
Abstract
Objective:
To investigate the effects of electroacupuncture (EA) at ST36 on intestinal microflora and plasma metabolites in a mouse model of type 2 diabetes mellitus (T2DM), to provide a theoretical basis and guidance for the clinical treatment of T2DM by traditional Chinese medicine (TCM).
Methods:
Sixteen T2DM db/db mice were randomly divided into treatment (T, n = 8) and model (M, n = 8) groups, and a further eight normal db/m+ mice reared under the same conditions served as a non-diabetic control group (C, n = 8). The general conditions of mice were observed weekly. After obtaining blood and stool samples, the mice were euthanized. Fasting blood glucose (FBG) was measured using a glucometer and fasting insulin (FINS) was measured in plasma by enzyme-linked immunosorbent assay (ELISA). Liver and colon tissues were embedded in paraffin and subjected to hematoxylin–eosin (HE) staining to observe pathological changes in these tissues. In addition, 16S ribosomal RNA (rRNA) sequencing was performed to analyze changes in the intestinal flora and metabolomics was employed to assess changes in metabolites in the blood.
Results:
EA significantly reduced FBG and FINS levels and alleviated pathological damage to the liver and colon. Furthermore, EA increased intestinal community richness and diversity by decreasing the relative abundance of Clostridium and incresasing the relative abundance of Lactobacillus. EA also reduced D-fructose levels in T2DM mice according to plasma metabolomics.
Conclusion:
EA has a positive regulatory effect on the intestinal flora and can regulate blood glucose and improve insulin resistance in T2DM model mice.
Keywords
Introduction
Diabetes mellitus (DM) has become the third major non-communicable disease after cardiovascular disease and cancer. It not only has a significant impact on human health, but also represents a heavy economic burden on families and wider society worldwide. 1 China is now the country with the largest number of DM patients, reaching a total of 114 million people, most of whom suffer from type 2 DM (T2DM), which accounts for ~90% of all cases. 2 The etiology and pathogenesis of T2DM have still not been fully elucidated. Insulin resistance (IR) and islet β cell dysfunction are considered the two major pathological factors in the occurrence of diabetes by the academic community. With continuous improvement in people’s living standards, the prevalence rate of T2DM keeps rising, which may seriously endanger health. Therefore, the prevention and treatment of T2DM have become urgent problems to be solved.
Flora in the human intestinal tract interacts with the host, affects metabolism and helps to maintain homeostasis. 3 Human intestinal flora is a large and complicated network of > 800 kinds of bacteria belonging to ~30 genera, including > 1014 bacterial cells (about 10 times the total number of host cells in a human adult), which are comprised of aerobic bacteria, facultatively anaerobic bacteria and anaerobic bacteria. 4 In recent years, increasing research has shown that T2DM may be related to intestinal flora and this relationship has become a major research area. The link between T2DM and intestinal flora is important because altered intestinal microbiota can directly affect intestinal immune cells or indirectly affect immune cells through microbial metabolites, 5 which mainly include lipopolysaccharide, 6 bile acids (BAs) and short-chain fatty acids (SCFAs); 7 these metabolites can affect adipose tissue production or IR, thereby leading to the occurrence of T2DM. 8 Thus, genetic information carried by gut flora may offer a breakthrough for the treatment of diabetes in the future.
In recent years, with the continuous development of traditional Chinese medicine (TCM), the therapeutic effect of acupuncture on T2DM and IR has been documented. 9 Although the mechanism by which acupuncture influences diabetes has not been fully elucidated, two factors are especially important—namely IR and impaired function of islet β cells. Acupuncture, as a TCM therapy, has certain effects in the treatment of diabetes; for example, it can lower blood sugar and mitigate IR. 10 Electroacupuncture (EA) at ST36 (Zusanli) at a specific frequency can improve gastrointestinal functional diseases. 11 One human study showed that acupuncture improved insulin sensitivity in patients with T2DM by decreasing endogenous insulin concentration and preserving pancreatic β-cell function. 12 Acupuncture also significantly reduced IR in a rat study, 13 potentially via inhibition of free fatty acid production through stimulation of cholinergic nerves and activation of nitric oxide synthase.
Previous animal experiments and clinical data on acupuncture treatment for DM are encouraging. The aim of this study was to further explore the mechanism of EA in experimental T2DM by focusing on the regulation of intestinal flora; we assessed changes in intestinal flora and metabolites of plasma flora in a T2DM db/db mouse model before and after EA treatment.
Methods
Experimental animals
A total of 16 male BKS.Cg m+/+ Leprdbrdb/J (db/db) diabetic mice (aged 6 weeks, weighing 30 ± 3 g) and 8 male Dock7 m+/+ Leprdb (db/m) non-diabetic mice (aged 6 weeks, weighing 19 ± 2 g) were purchased from Guangdong Yaokang Biotechnology Co., LTD (license number SCXK (Guangdong) 2020-0054). Animals were housed individually and had free access to standard food and water. The animal room was maintained at 23 ± 2°C and 50 ± 10% humidity under a 12 h light–dark cycle. All studies were performed in accordance with the Guide for the Care and Use of Laboratory Animals published by the National Institutes of Health (NIH, Bethesda, MD, USA). This study was approved by the Animal Care and Ethics Committee of Guangzhou University of Chinese Medicine (ref. 20210604003).
Experimental protocols
After experimental animals were fed adaptively for 1 week, male db/db mice were used as a model of T2DM. Male age-matched db/m mice (n = 8) were used as control non-diabetic mice. Sixteen db/db mice were randomly divided into two groups (n = 8 each), who either received or did not receive acupuncture for 3 weeks. Plasma samples were collected from the tail tip and feces was collected in 1.5 mL cryopreservation tubes, frozen in liquid nitrogen for 1 h and stored at −80°C until analysis. The mice were anesthetized by inhalation of 3% isoflurane and then euthanized using CO2, which was poured into the euthanasia box at a rate of 30% of the replacement volume of the box per minute for 10 min. The CO2 was shut off once it had been determined that the animals were not moving or breathing and had dilated pupils. Following observation for another 2 min to ensure death, dissection was carried out during which liver and colon tissues were taken, fixed with paraformaldehyde, embedded in paraffin and frozen at −80°C for inspection.
EA treatment
Mice in the EA treatment group (T) were bound and fixed in the prone position on an experimental plate. After shaving and disinfection with 75% alcohol, stainless steel acupuncture needles (0.18 mm × 10 mm width×length; Andy brand) with good elasticity, produced by Guizhou Andy Pharmaceutical Equipment Co., Ltd. (Guizhou, China), were inserted obliquely to a depth of 3 mm at bilateral ST36 and connected to a Huatuo brand SDZ-V EA instrument (Jiangsu, China). EA was administered for 20 min once a day for 3 weeks at an intensity of 1 mA, with a sparse wave of 2 Hz and dense wave of 50 Hz (frequency ratio 3:1, alternating 10 times/min, i.e. 3 sec at 2Hz followed by 9 sec at 50Hz. Mice were fed normally after treatment.
Mice in the model (M) and blank control (C) groups were fixed on the experimental plate in the same way, without treatment. After 20 min, the mice were put back into their cages and fed normally.
Body weight and blood glucose testing
Mice in each group were weighed and underwent fasting blood glucose (FBG) measurement before treatment, and again 1, 2 and 3 weeks after treatment. The tail tip was pricked with a disposable blood collection pen and gently squeezed; drops of whole blood were collected on the test paper of a blood glucose meter (Accu-Chek Integra, Roche, Germany) and the value on the display screen was recorded.
Plasma insulin determination
Plasma fasting insulin (FINS) concentration was measured using a mouse-specific insulin enzyme-linked immunosorbent assay (ELISA) kit (JYM0351Mo; Wuhan ColorfulGene Biological Technology Co., LTD) following the instructions provided by the manufacturer.
Hematoxylin–eosin staining
Liver and colon tissues were fixed in 4% formaldehyde for 24 h. After dehydration with a series of ethanol concentrations and clarification with xylene, tissues were embedded in mixed paraffin prior to sectioning. Tissues were cut into 5 μm sections using a paraffin slicing machine (RM2016; Leica, Wetzlar, Germany) and stained using a hematoxylin–eosin (HE) staining kit (G1120; Solarbio, Beijing, China). The number of cells was counted using Image J (version 1.8.0; NIH).
16S ribosomal RNA analysis of fecal samples
After collecting fecal samples, we immediately transferred them at 4° C to Guangzhou Genedenovo Biotechnology Co., LTD (Guangzhou, China), who performed a 16S ribosomal RNA (rRNA) analysis. DNA extraction was performed using a TIANamp stool DNA kit (Tiangen Biotech, Beijing, China). Genomic DNA was amplified in 50 μL triplicate reactions with bacterial 16S rRNA gene-specific primers (V3−V4 region) 338F (5′-ACTCCTACGGGAGGCAGC-3′) and 806R (5′-GGACTACHVGGGTWTCTAAT-3′). The reverse primer contained a sample barcode and both primers were connected using an Illumina sequencing adapter. PCR products were purified and a gene bank was constructed according to standard protocols. An Illumina MiSeq sequencing platform and the PE250 sequencing strategy were employed for sequencing. The original sequencing reads from each sample were sorted according to the unique barcodes, and barcodes, linkers and PCR primer sequences were removed.
Research on microbial diversity was divided into alpha/beta diversity, species composition, indicator species and functions. After raw reads were obtained by sequencing, low-quality reads were removed by filtering, then spliced and further filtered, and operational taxonomic units (OTUs) were obtained by clustering. For valid groups, differences between groups were compared.
Metabolic profiling
Plasma samples were transported to the laboratory of Suzhou PANOMIX Biomedical Technology Co., LTD by full cold chain transportation for metabolomics analysis.
Metabolite extraction
Samples were thawed at 4°C (insufficient samples were combined to an equal scale) and 50 µL of each sample was placed in a 2 mL centrifuge tube, mixed with 400 µL of methanol (–20°C) and vortexed for 60 s. After centrifuging at 4°C for 10 min at 13,200 g, supernatants were transferred into fresh 2 mL centrifuge tubes and concentrated to dryness using a vacuum. Samples were dissolved in 150 µL of 2-chlorobenzalanine (4 ppm) 80% methanol solution and the supernatant was filtered through a 0.22 µm membrane to obtain the prepared samples for liquid chromatography mass spectrometry (LC-MS). A 20 µL volume of each sample was used for quality control (QC).
Chromatography
Chromatographic separation was accomplished using a Thermo Ultimate 3000 system equipped with an ACQUITY UPLC HSS T3 column (150 mm × 2.1 mm, 1.8 µm; Waters) maintained at 40°C. The temperature of the autosampler was 8°C. Gradient elution of analytes was carried out with 0.1% formic acid in water (C) and 0.1% formic acid in acetonitrile (D) or 5 mM ammonium formate in water (A) and acetonitrile (B) at a flow rate of 0.25 mL/min. Injection of 2 μL of each sample was performed after equilibration. An increasing linear gradient of solvent B (v/v) was applied as follows: 0−1 min, 2% B/D; 1−9 min, 2%−50% B/D; 9−12 min, 50%−98% B/D; 12−13.5 min, 98% B/D; 13.5−14 min, 98%−2% B/D; 14−20 min, 2% D-positive model; 14−17 min, 2% B-negative model.
Mass spectrometry
The ESI-MSn experiments were carried out on a Thermo Q Exactive Plus mass spectrometer with a spray voltage of 3.5 kV and −2.5 kV in positive and negative modes, respectively. Sheath gas and auxiliary gas were set at 30 and 10 arbitrary units, respectively. The capillary temperature was 325°C. Scanning was performed over a mass range of m/z 81−1000 for a full scan at a mass resolution of 70,000. Data-dependent acquisition (DDA) MS/MS experiments were performed with a HCan D scan. The normalized collision energy was 30 eV. Dynamic exclusion was implemented to remove some unnecessary information in MS/MS spectra.
Statistical analysis
Data were analyzed by GraphPad Prism 8.0 statistical software. All values are expressed as mean ± standard deviation (SD). Mean values were compared using one-way analysis of variance (ANOVA) for normally distributed variables and p < 0.05 was considered significant.
Results
Ameliorative effect of EA on hyperglycemia, tissue damage and IR in T2DM mice
To evaluate the ameliorative effects of EA, an appropriate T2DM db/db mouse model was established. As shown in Figure 1(a)–(c), significant increases in weight, FBG and FINS were observed in T2DM mice. Levels of FBG and FINS decreased significantly after EA, while EA had little effect on weight. These results demonstrate the positive effects of EA on the regulation of glucose homeostasis and IR.
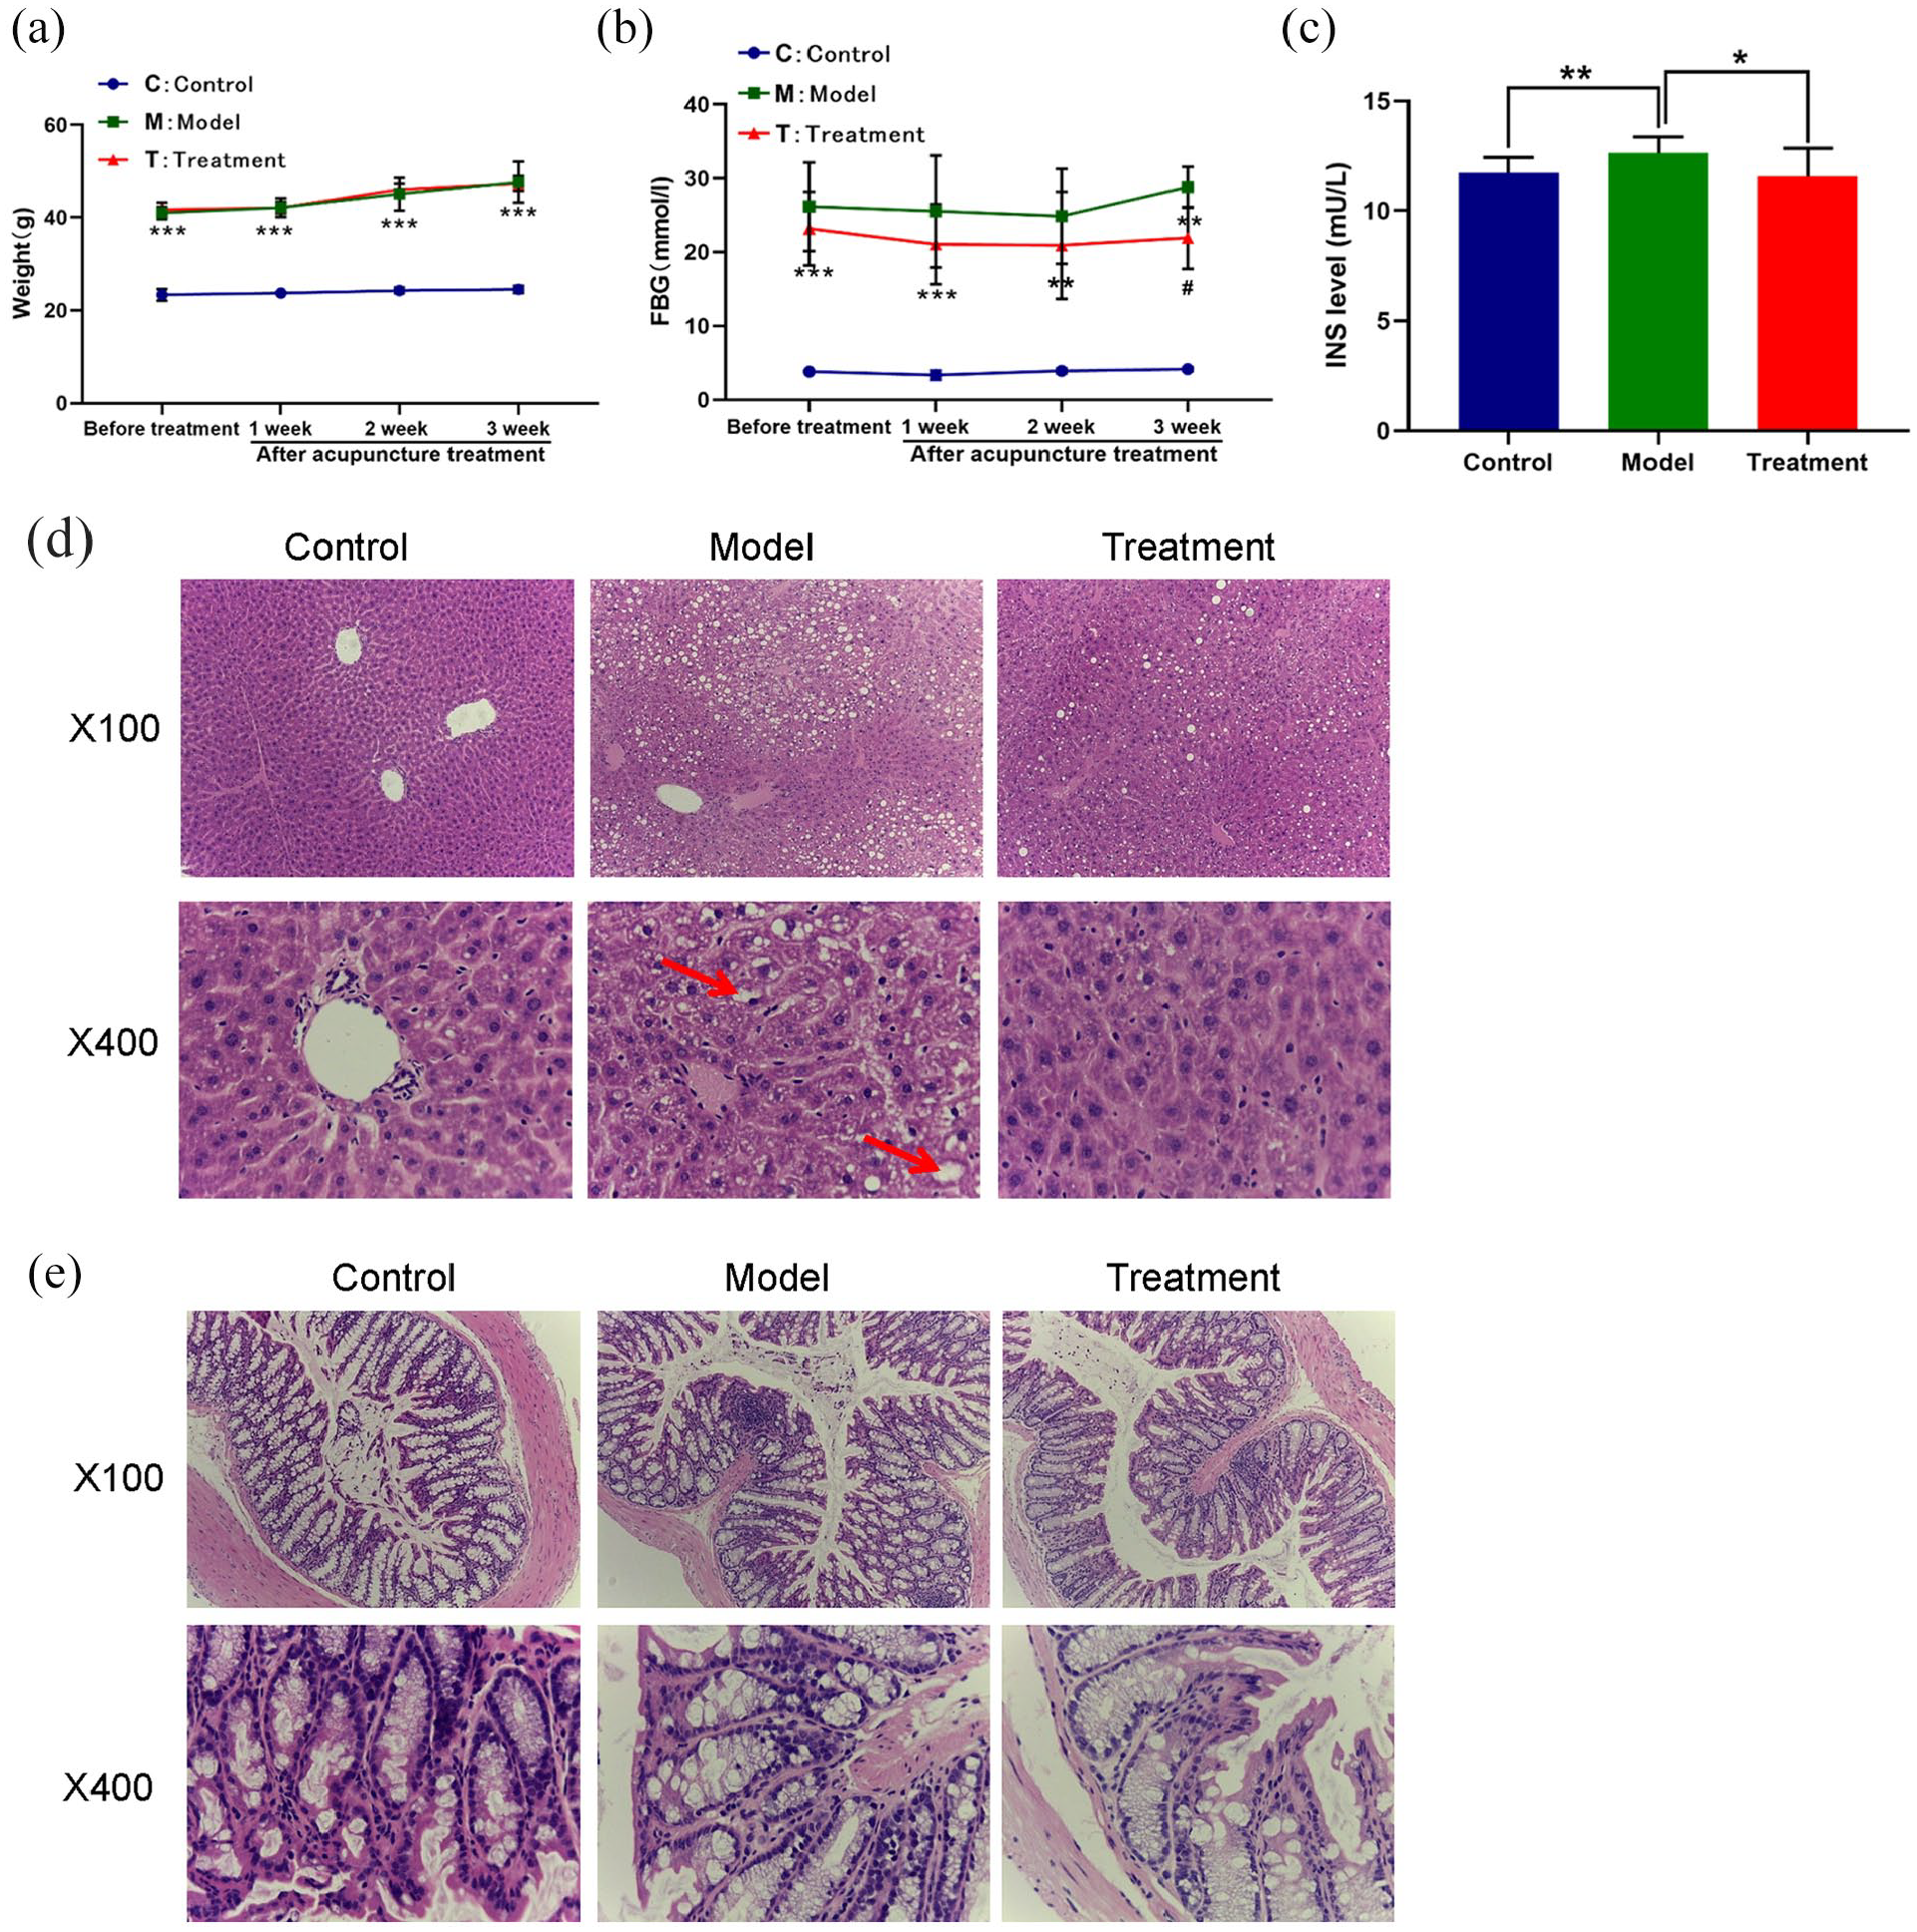
Measurement of (a) weight, (b) fasting blood glucose (FBG) and (c) fasting insulin (FINS) in plasma of the control group (C), model group (M) and treatment group (T) that received electroacupuncture (EA). (d) and (e) Histopathological observation of liver and colonic tissues in groups C, M and T. In the liver of model mice, notable changes in fatty degeneration are indicated by the red arrows. Samples were stained with H&E and photographed at 200× and 400× magnification. Results are mean ± SD. **p < 0.01 ***p < 0.001 versus C group; #p < 0.05 versus M group.
Furthermore, liver tissues of control mice exhibited normal cellular structure with intact liver lobules, cords and sinusoids, and a clear three pipeline structure of the portal area. By contrast, notable changes with severe fatty degeneration were observed in the liver tissues of T2DM mice; the hepatic lobule structure was not clear, the volume of liver cells was increased and disordered, and fat vacuoles of different sizes were present in the cytoplasm, pushing the nucleus to one side. Inflammatory cell infiltration and diffuse hepatic steatosis were also noted. Compared with model mice, the pathological manifestations in the liver of mice in group T included: mainly mild to moderate steatosis, roughly normal liver cell morphology with decreased fat vacuoles, and less inflammatory cell infiltration (see Figure 1(d)). In addition, pathological assessment of colonic tissues was performed by HE staining. In control mice, intestinal villi were arranged neatly with regular morphology, the epithelium was intact without shedding, and cell morphology was normal. Furthermore, villus height, width and mucosal thickness were uniform and normal; the submucosa was thin, the thickness of the muscle layer was uniform and no inflammatory cell infiltration was observed. By contrast, in group M, intestinal villi were irregular in shape and disorderly in their surface arrangement; some villi were thicker, wider, unequal in thickness and slightly taller. In addition, the lamina propria displayed mild edema with inflammatory cell infiltration, the mucosal thickness was increased slightly, the submucosa was thin with lymphocytic infiltration and the muscular layer was uneven with inflammatory cell infiltration. After acupuncture treatment, the morphology of intestinal villi was irregular; most villi were larger and thinner than normal, the epithelium was intact without shedding and the cell morphology was normal. There was no edema in the lamina propria and few inflammatory cells. Mucosal thickness was increased, the submucosa was thin with occasional lymphocytic infiltration and the thickness of the muscular layer was roughly uniform without inflammatory cell infiltration (see Figure 1(e)).
Changes in the intestinal microbiome in db/db mice treated with EA: richness and composition of the intestinal microbiome
Three α-diversity indices (Ace, Chao and Sobs) were used to estimate OTU richness. These indices were significantly lower in the db/db mouse model than the db/m mice in the control group (p < 0.05; Figure 2(a)–(c)), suggesting some differences between db/m and db/db samples in species composition and species abundance. However, there was little difference in species composition or abundance between db/db mice receiving and not receiving EA (Figure 2(a)–(c)). In order to compare the diversity within each bacterial flora, β-diversity analysis was performed. The UniFrac distance was calculated and principal coordinate analysis (PCoA) was performed. As shown in Figure 2(d), the unweighted UniFrac diversity distance heatmap suggested a significant difference in the composition of gut microbiota among control, model and treatment groups. In addition, the PCoA plots for the three groups showed that data for control mice were distinct from mice in the other two groups, while plots for the model and treatment groups were similar (see Figure 2(e)). According to unweighted UniFrac analysis, the detected species differed between db/db and db/m mice, while the effect of EA on the composition of the gut microbiota of db/db mice was mild.
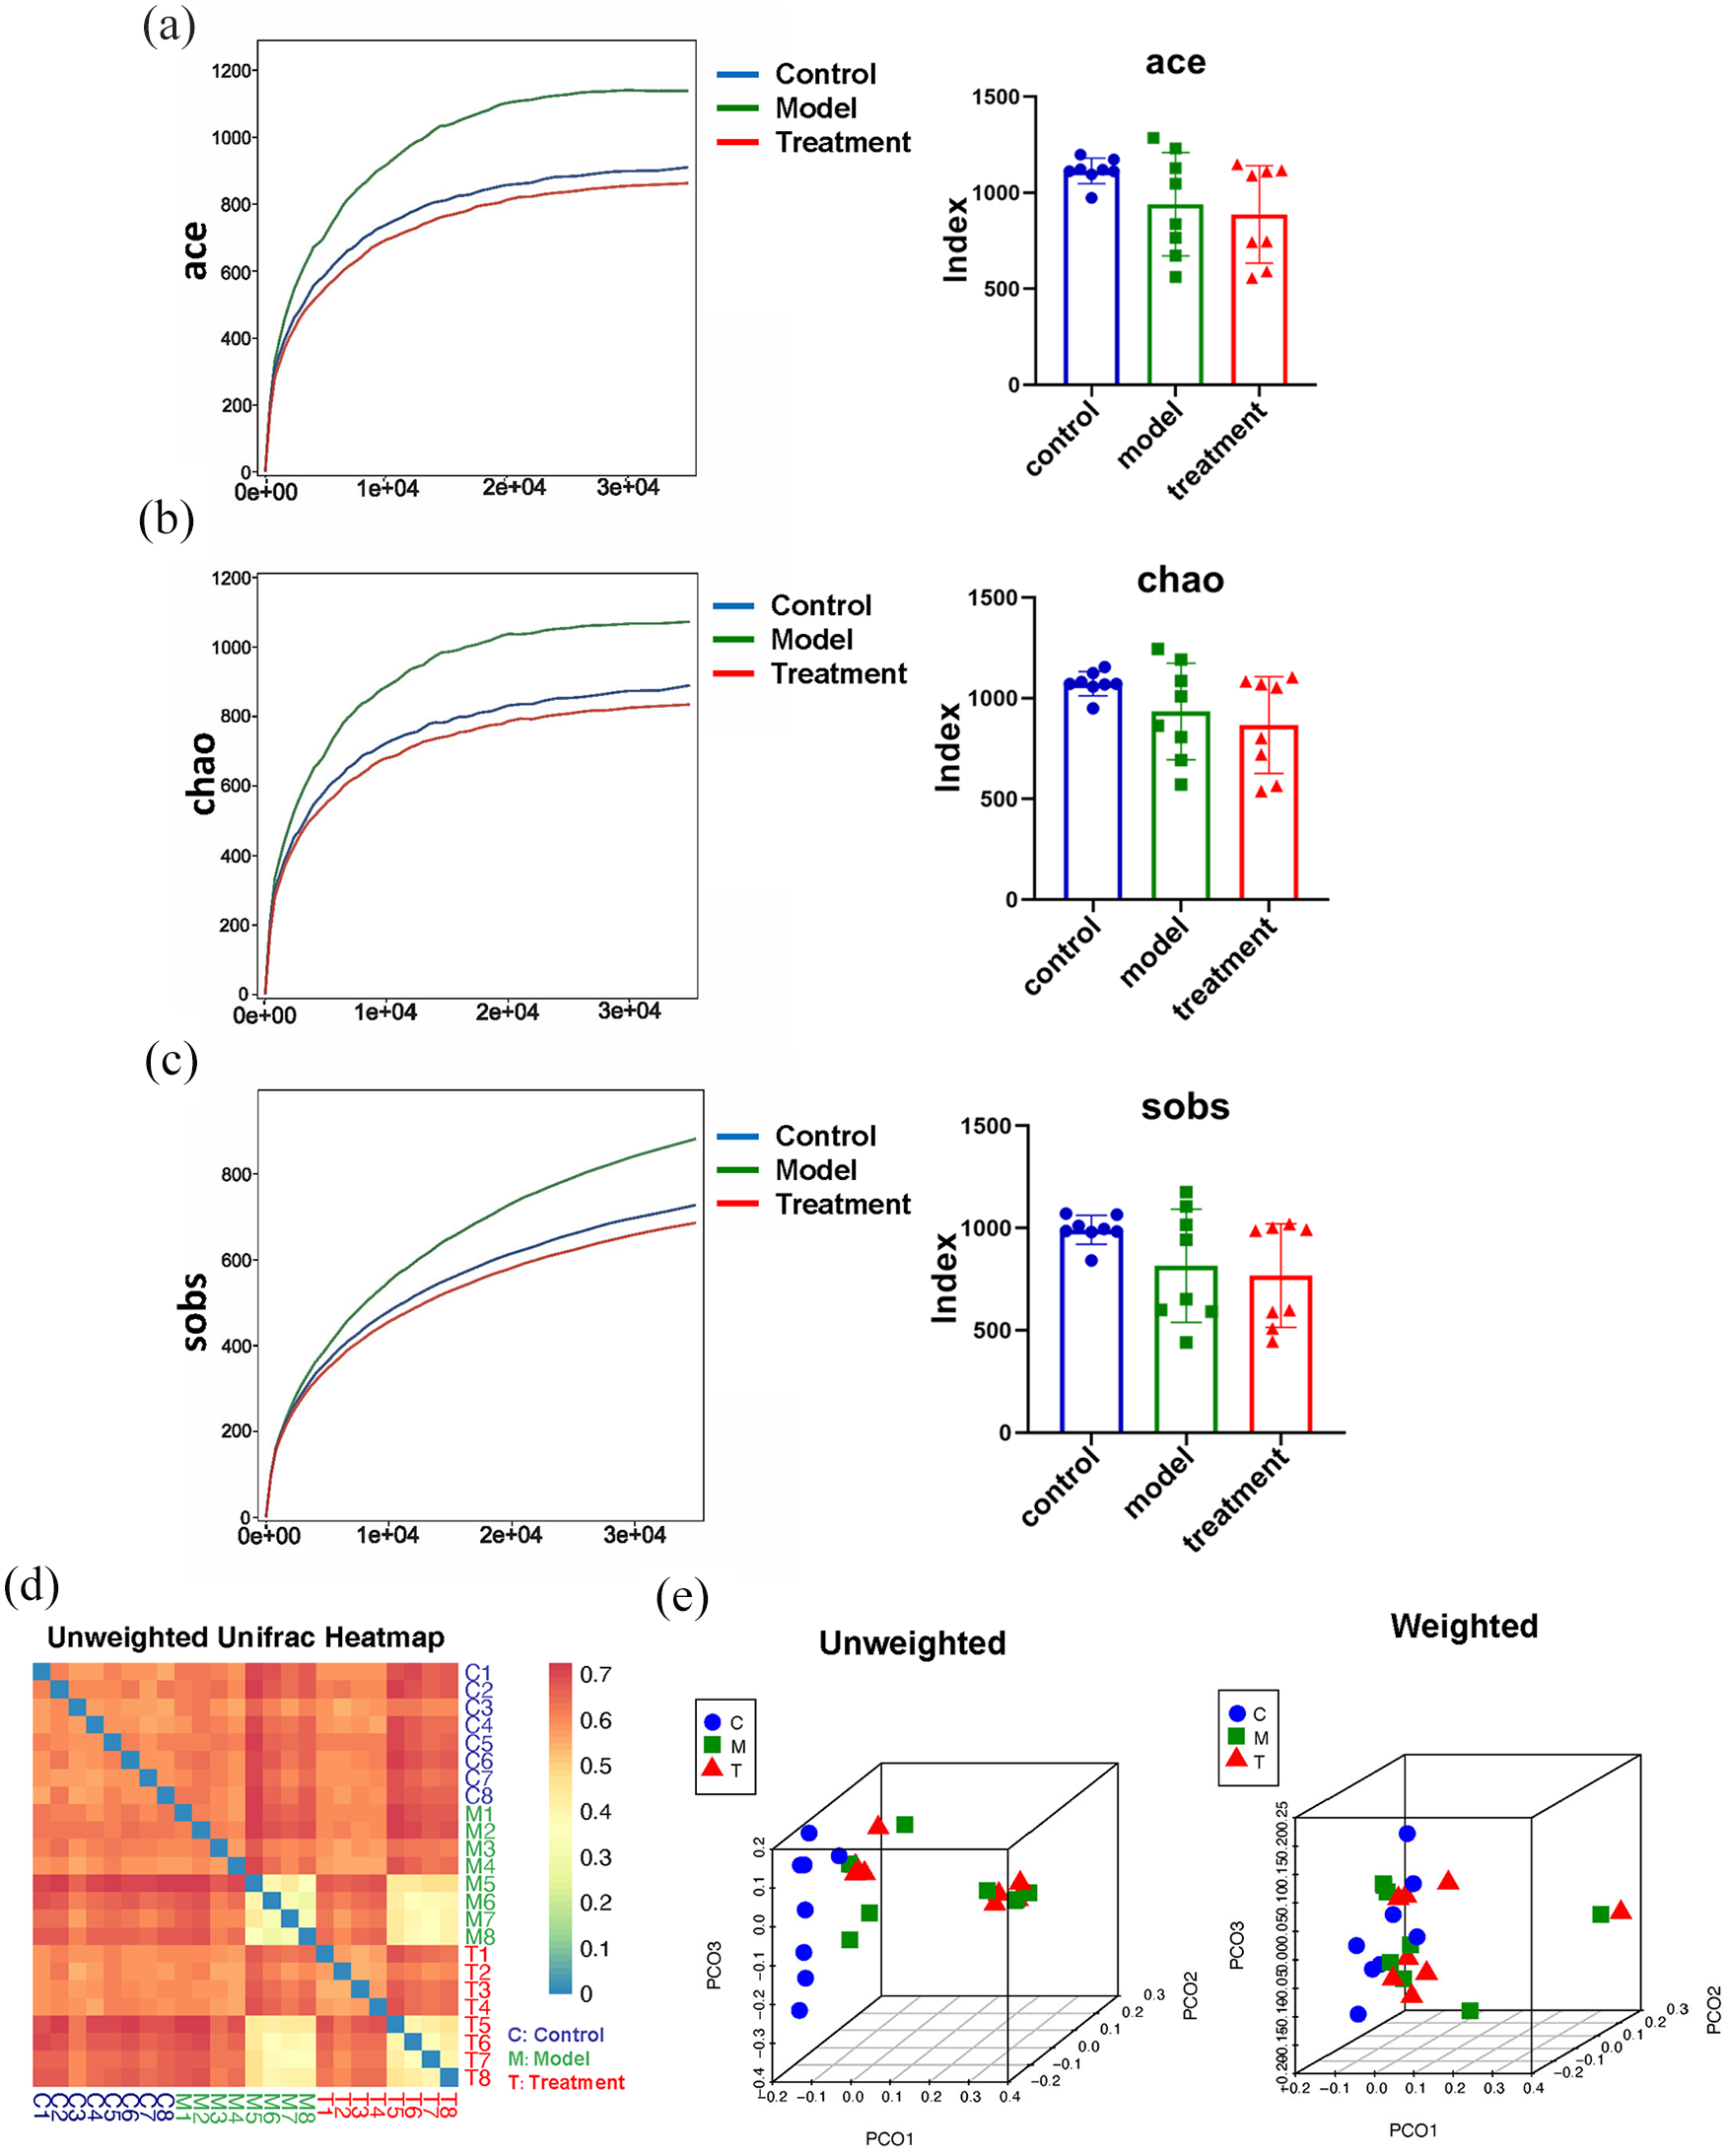
Total operational taxonomic unit (OTU) richness was evaluated by (a) ace, (b) chao and (c) sobs indices. Results were analyzed by one-way ANOVA. (d) Unweighted UniFrac diversity distance. (e) Principal coordinate analysis (PCoA) of the intestinal flora of each strain. The left side shows the results of unweighted mean PCoA based on the genealogical relationship of the determined bacterial species. The right side shows the results of weighted mean PCoA based on the genealogical relationship and number of reads of determined bacterial species. Control group (C) = db/m mice. Model group (M) = db/db mice not receiving electroacupuncture (EA). Treatment group (T) = db/db mice receiving EA. *p < 0.05 compared with db/m mice in control group.
The relative abundance ratio of the intestinal microbiome at the class, family, order, genus and species levels was further classified. As shown in Figure 3(a)–(e), compared with db/m mice in the control group, the relative abundances of Clostridia, Lachnospiraceae, Bacteroides and Ruminococcaceae were higher in db/db mice. These bacteria were downregulated 3 weeks after EA treatment in db/db mice. Compared with db/m mice, the relative abundance of Lactobacillaceae (or Lactobacillus) was decreased in db/db mice and upregulated after EA treatment for 3 weeks. The identified OTUs were also classified using RDP and NT-16S species databases and the results were consistent with the above data (see Figure 3(f)), for which all OTU species annotation results are listed in Table 1. These results suggest that EA could improve the composition of the intestinal microbiome in db/db mice.
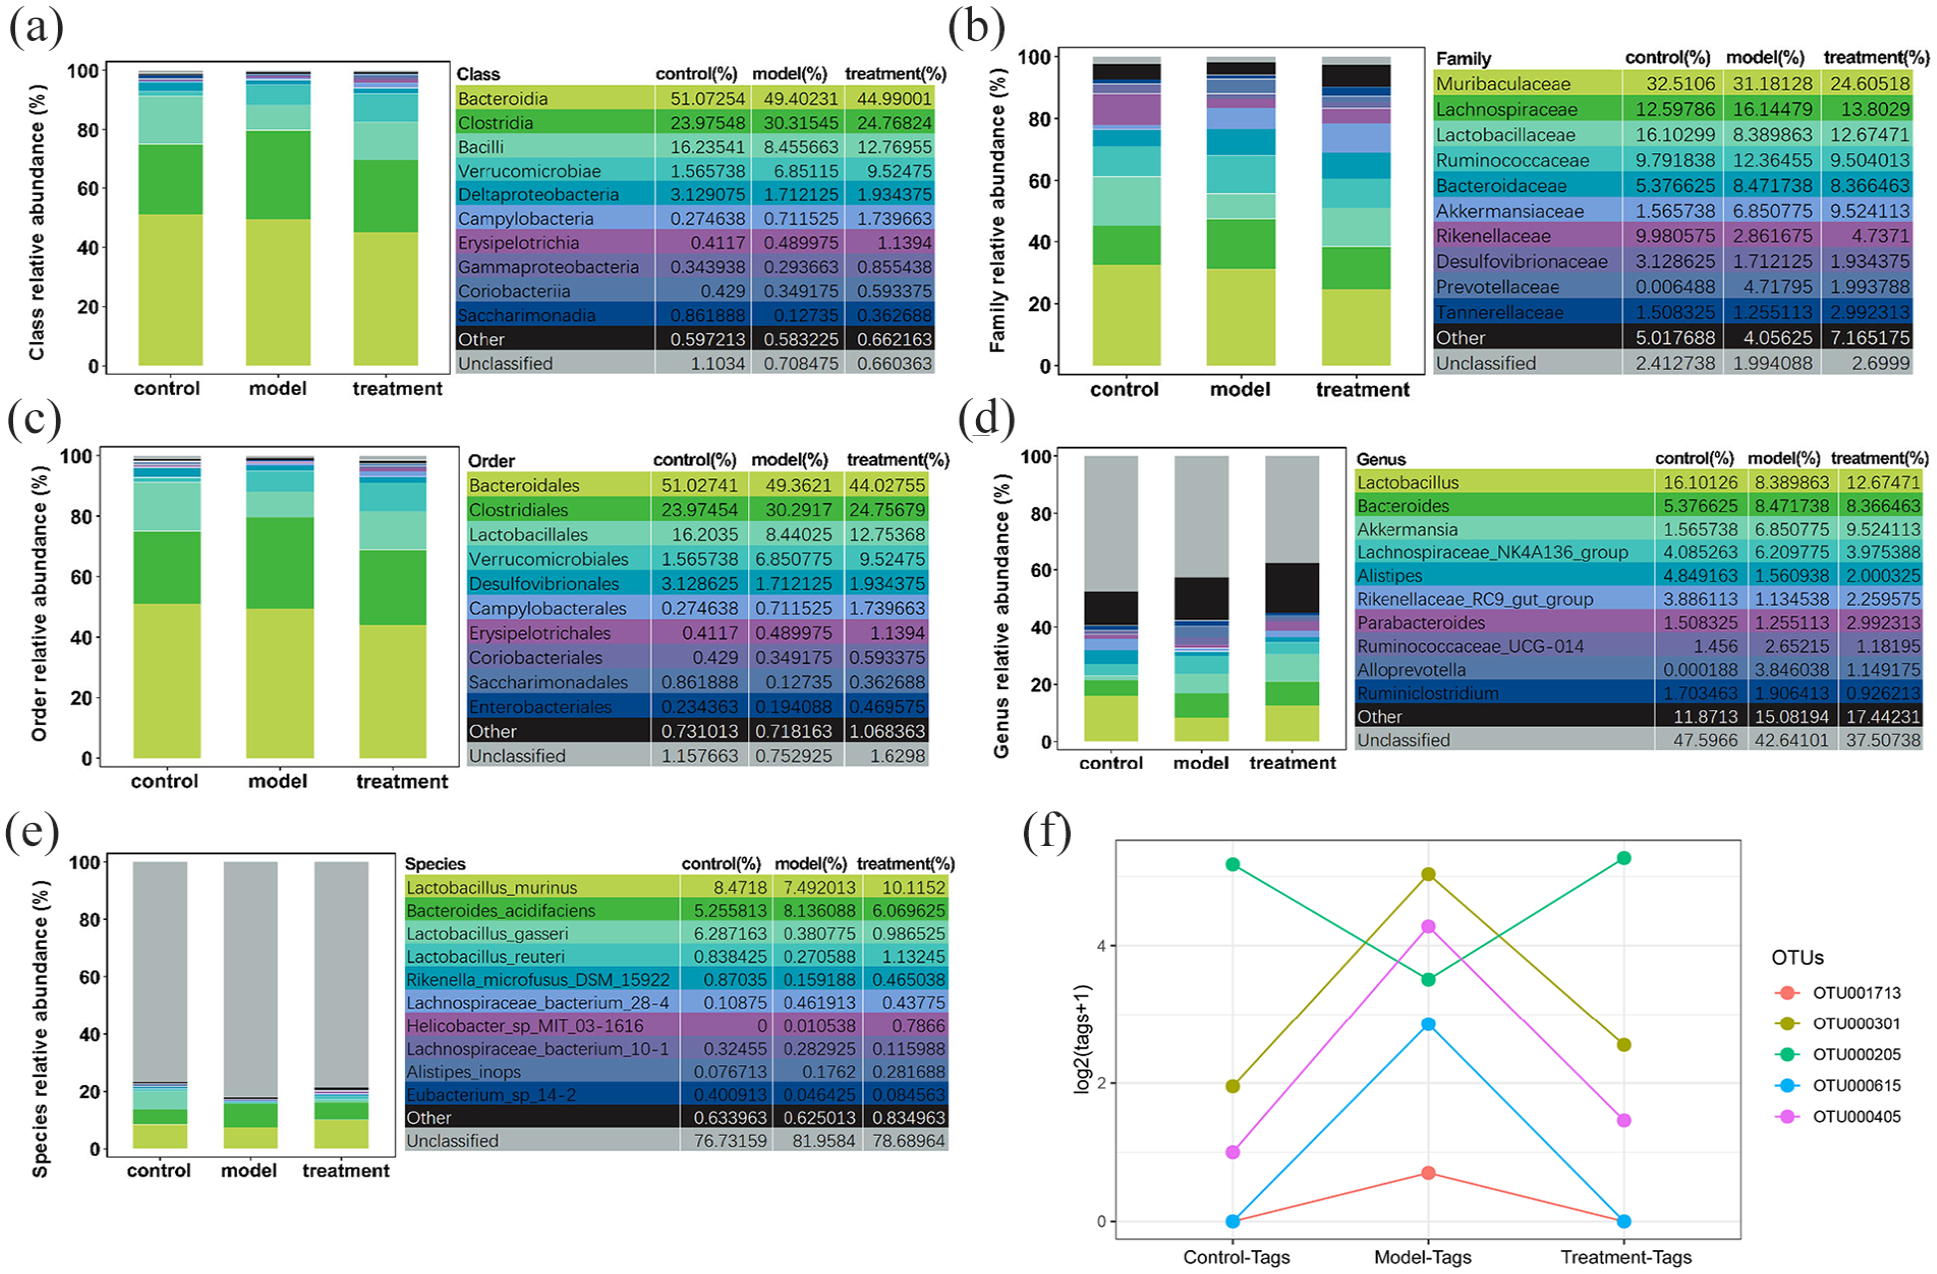
Relative abundance ratio of the intestinal microbiome at (a) class, (b) family, (c) order, (d) genus and (e) species levels. (f) Screening of differential bacteria at the operational taxonomic unit (OTU) level. Control group (C) = db/m mice. Model group (M) = db/db mice not receiving electroacupuncture (EA). Treatment group (T) = db/db mice receiving EA. Data are percentage of species, analyzed using Kruskal–Wallis test.
Operational taxonomic unit (OTU) species annotation.
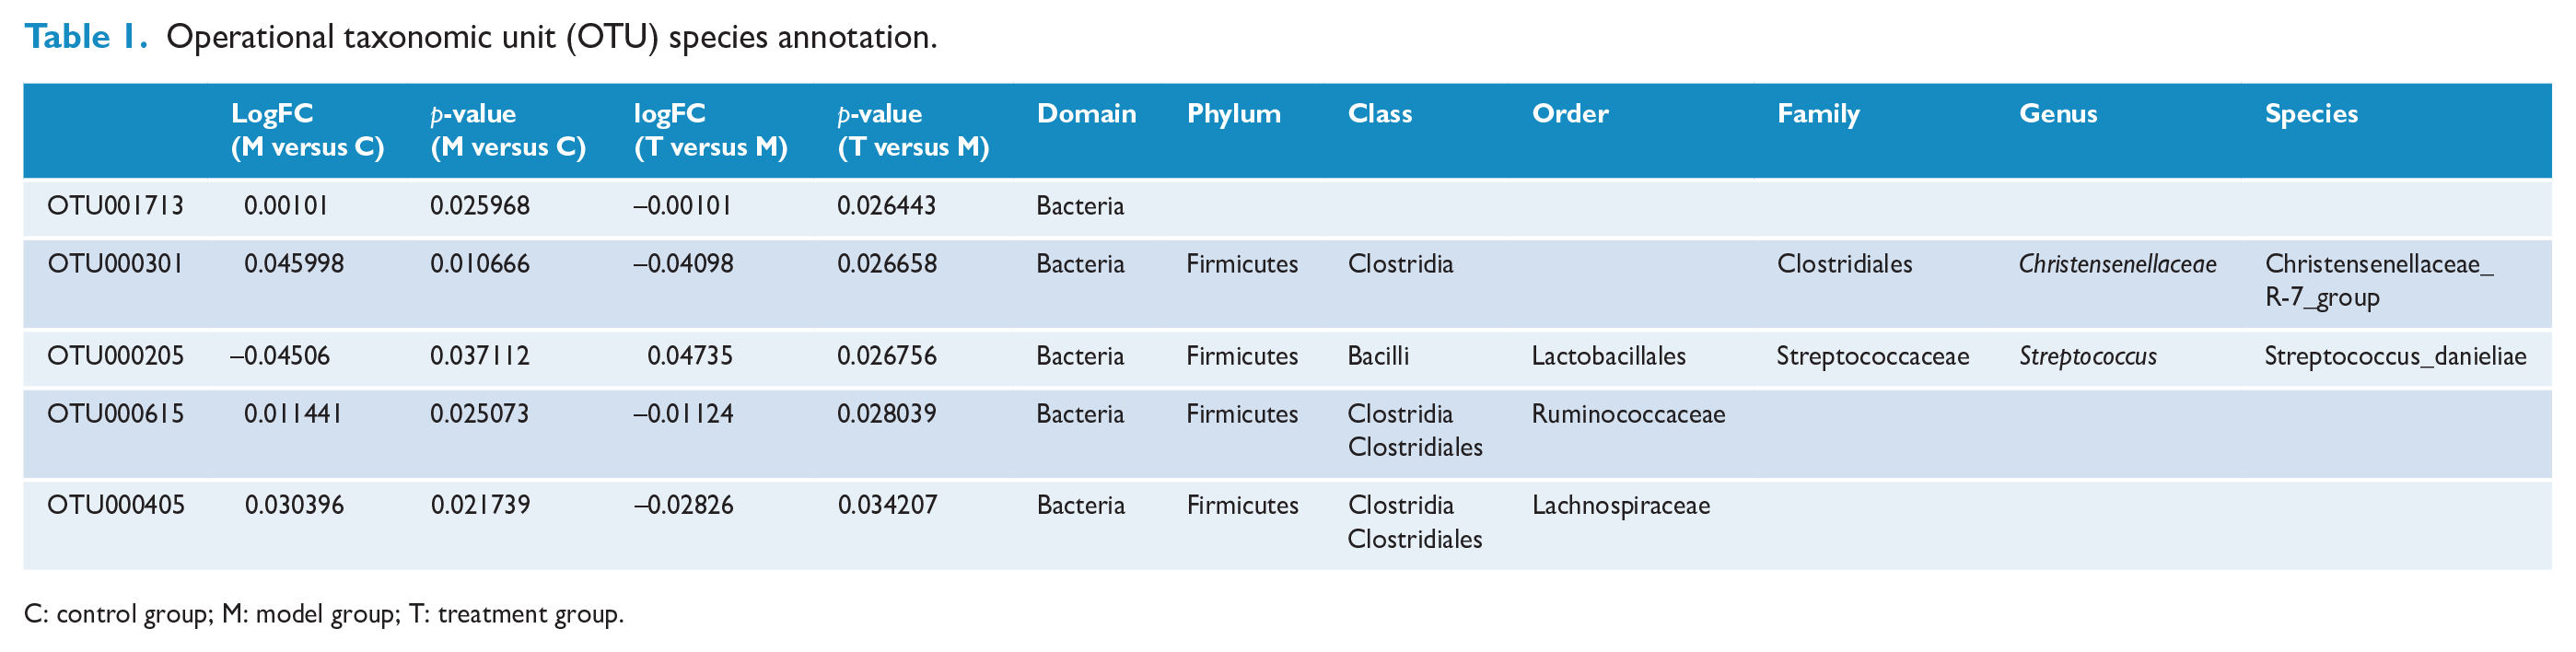
C: control group; M: model group; T: treatment group.
Effects of EA on plasma metabolic profiling of T2DM mice
In this study, LC-MS detection was applied to generate metabolic profiles of plasma samples from db/m mice (C group), db/db mice not receiving EA (M group) and db/db mice after EA treatment (T group). The metabolomics profiles of the three groups were subjected to principal component analysis (PCA), partial least squares discriminant analysis (PLS-DA) and orthogonal PLS-DA (OPLS-DA). The PCA score plot displayed intergroup separation (see Figure 4(a)), in which db/db mice before and after EA were clearly separated from control db/m mice. The variations in plasma metabolic profiling of db/db mice receiving EA treatment (T group) were restored to levels of control (C group) mice according to the PLS-DA score plot (see Figure 4(b)) and the validation plot (R2 = 0.99, Q2 = 0.46; see Figure 4(c)). The OPLS-DA score plot (Figure 4(d)) indicated clear separations between M (green dots) and C (blue dots) groups (R2X = 0.257, R2Y = 0.965, Q2 = 0.587; see Table 2), T (red dots) and C (blue dots) groups (R2X = 0.235, R2Y = 0.992, Q2 = 0.763) and M (green dots) and T (red dots) groups (R2X = 0.27, R2Y = 0.975, Q2 = 0.372). Furthermore, the relative quantity of D-fructose in plasma was significantly increased in db/db mice compared with db/m mice (p = 0.007), while D-fructose levels appeared to return to normal following EA treatment (p = 0.013; see Figure 4(e)).
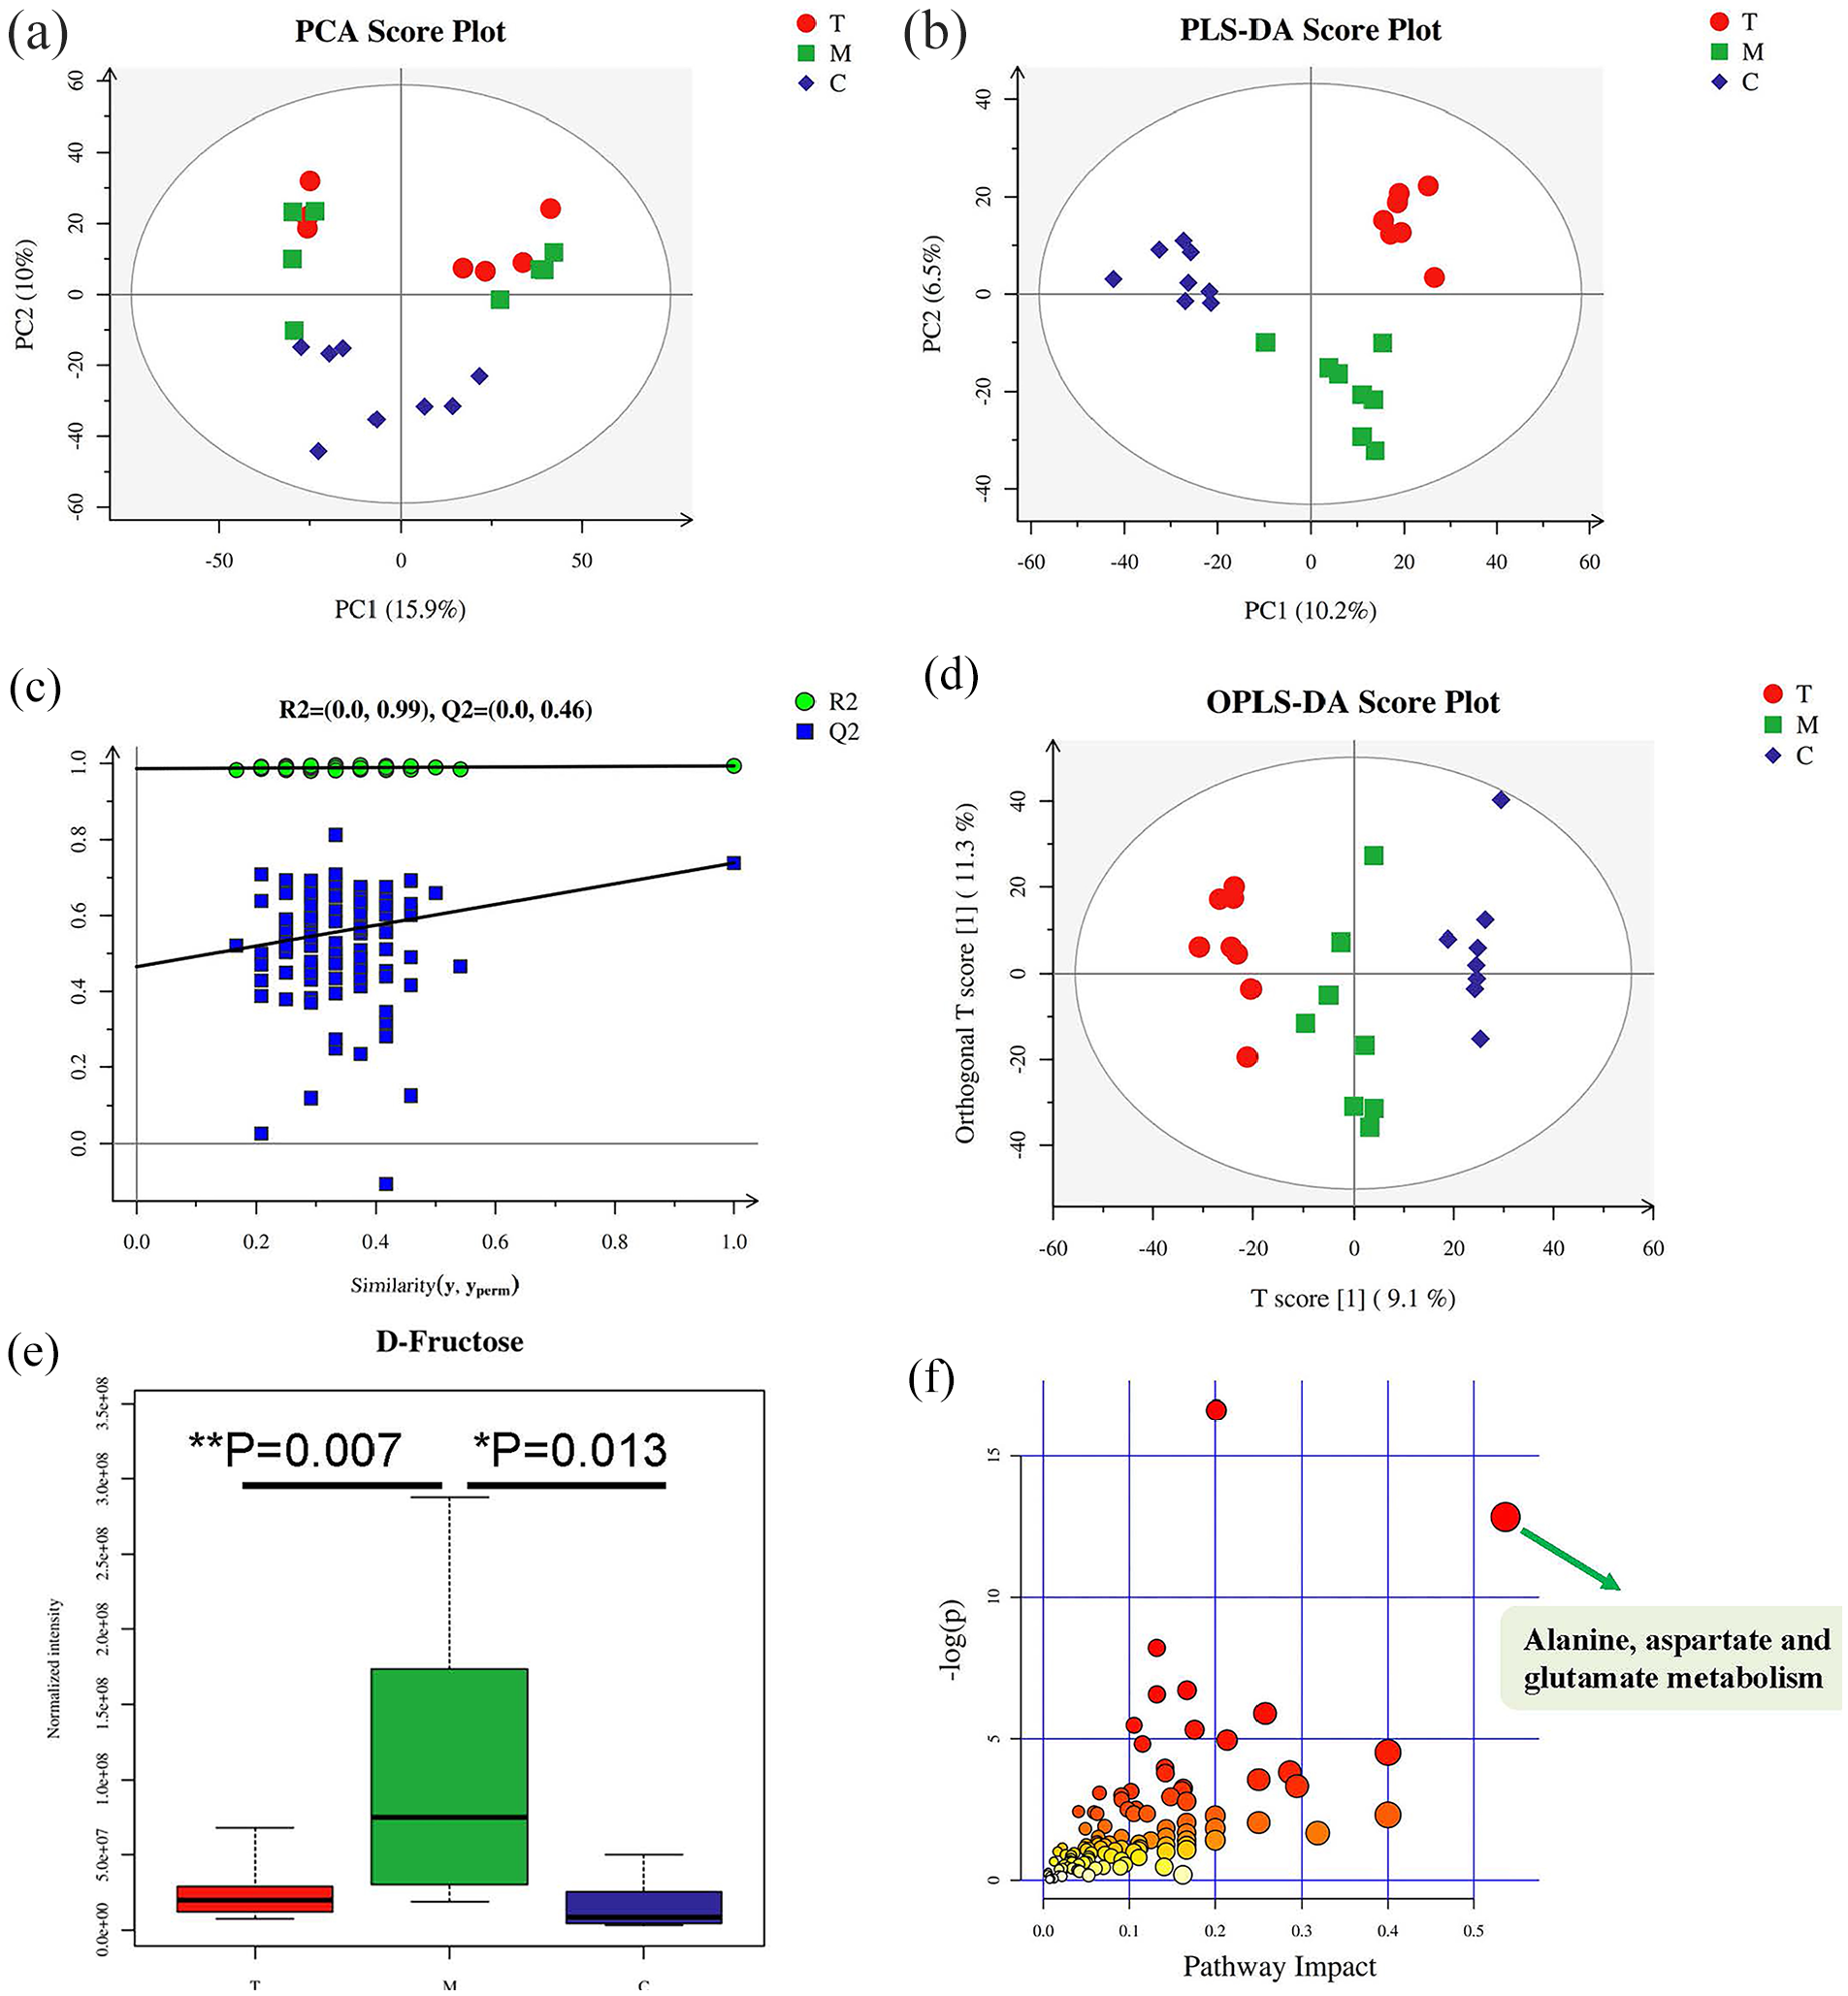
Principal component analysis (PCA), partial least squares discriminant analysis (PLS-DA) and orthogonal partial least squares discriminant analysis (OPLS-DA) with corresponding values of R2X, R2Y and Q2 for control group (C) consisting of db/m mice (blue diamonds), model group (M) consisting of db/db mice not receiving electroacupuncture (EA; green squares) and treatment group (T) consisting of db/db mice receiving EA (red circles). (a) PCA score plot. (b) PLS-DA score plot. (c) Validation plot obtained from PLS-DA score plot. (d) OPLS-DA score plot. (e) Amount of D-fructose in the three groups. (f) Metabolic pathways involved in potential markers in plasma (*p < 0.05 and **p < 0.01).
Validation parameters of the orthogonal partial least squares discriminant analysis (OPLS-DA) model.
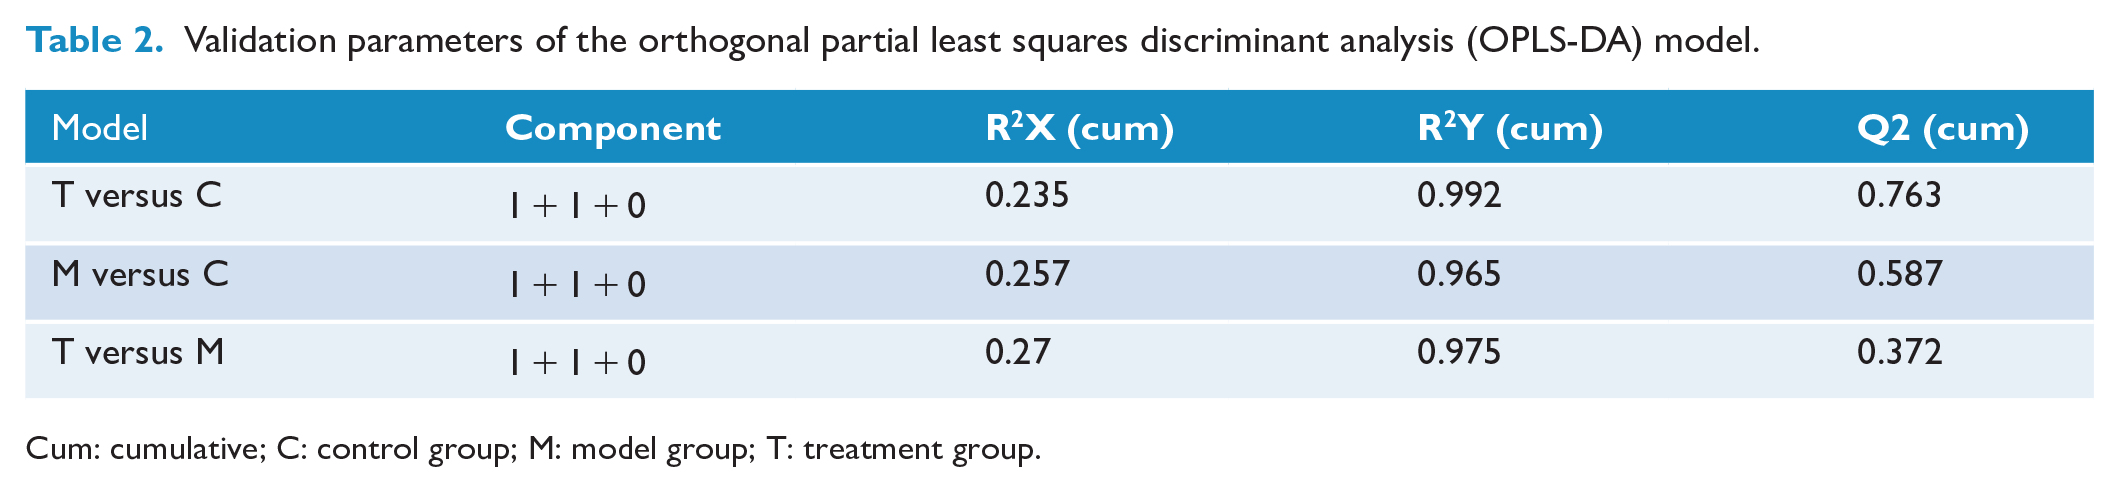
Cum: cumulative; C: control group; M: model group; T: treatment group.
The proposed metabolic pathway was established by importing the potential metabolites into the web-based MetPA database. The pathway impact value calculated from pathway to topology analysis with MetPA impact > 0.4 was screened out as the potential target pathway. As shown in Figure 4(f), alanine, aspartate and glutamate metabolism with impact values of 0.53693 were filtered out as the most important metabolic pathways. Our results also indicate that EA could more effectively modify plasma metabolic biomarkers and the related metabolic pathways involved in T2DM.
Discussion
Acupuncture has been used clinically to treat T2DM for thousands of years (with EA being incorporated more recently), 14 but the mechanism of action remains unknown. Thus, in this study, the effects of EA at ST36 in T2DM was first investigated and the mechanism was further unraveled by assessing the intestinal microbiome and plasma metabolomics of db/db mice.
EA at bilateral ST36 has been shown to enhance insulin sensitivity in rats, 15 and has been shown to have a bidirectional regulating effect on the function of the pituitary–adrenal cortex system and on carbohydrate metabolism.16,17 From the perspective of histoembryology, the innervation of the tissues at ST36 is segmentally related to that of the gastrointestinal tract and acupuncture at ST36 is able to modulate function of the gastrointestinal autonomic nerves. 18 In terms of our selected animal model, db/db mice are spontaneously diabetic and exhibit obesity, with characteristics reminiscent of human T2DM, making them an ideal animal model for experimental analysis. 19 Weight and levels of FBG and FINS were markedly increased in db/db mice, similar to human T2DM. Interestingly, acupuncture treatment for 3 weeks was able to reverse elevated FBG and FINS levels in db/db mice, as well as alleviate liver and colonic tissue damage. Numerous studies confirmed that acupuncture can improve blood glucose and associated complications in animal models of DM;20,21 acupuncture stimulation improves insulin function, glucose metabolism and glucose-related hormone levels, thereby reducing blood glucose. Acupuncture also stimulates the activity of mitochondrial respiratory chain-related enzymes, improves mitochondrial function and ultimately enhances the sensitivity of islet cells. 22 According to the experimental results of this study, EA at ST36 controlled blood glucose levels of db/db mice, reduced levels of plasma insulin, and prevented liver injury and the destruction of the intestinal mucosal barrier. Our findings are consistent with those reported by Jia et al., 23 who found that EA at ST36 and BL23 reduced the level of FINS and protected islet B cell morphology by enhancing mRNA expression of glucose transporter 2 (GLUT2) and glucokinase (GCK). We preliminarily conclude that the protective effect of EA on db/db mice mainly involves the amelioration of IR, which lays a foundation for analysis of the effects of EA on the intestinal flora of db/db mice.
Genetic and environmental factors can lead to T2DM. Changes in the intestinal microbiome composition attributed to age and diet are also important in inducing diabetes. 24 In this work, 16S rRNA gene sequencing showed that the composition of the intestinal microbiome changed and microbiome richness decreased significantly in db/db mice compared with db/m mice. However, α- and β-diversity analyses showed little difference after EA. This may be due to the small sample size, or the possibility that the effect of acupuncture on the composition of gut microbiota of db/db mice is mild. Interestingly, 21 of 23 Bacteroides OTUs detected previously25,26 were negatively correlated with T2DM. The use of Bacteroides acidifaciens 27 and Bacteroides uniformis 28 improved glucose tolerance and IR in diabetic mice. Together, these studies suggest that Bacteroides play a beneficial role in glucose metabolism in humans and laboratory animals. Furthermore, species positively associated with DM include Clostridium, Brotiella and Ruminococcus (belonging to the non-probiotics), which may induce an increase in pro-inflammatory factors.29,30 A recent study showed that Clostridium coccoides levels in the gut were significantly increased in db/db mice, while fecal microbiota transplantation (FMT) could reverse the changes in this microbe. 31 RT-PCR based on the 16S rRNA gene was performed to further accurately analyze the target bacteria. Our results showed that levels of Clostridium in the feces of db/db mice were higher than in db/m mice and levels were significantly reduced when db/db mice were treated with EA. Our results also showed a negative correlation between the level of Bacteroides and T2DM in mice, suggesting that Bacteroides may participate in the development of T2DM.
Metabolite profiles are also closely related to the development of T2DM.32,33 Moreover, metabolites of plasma and urine can reflect changes in systemic physiology. Therefore, based on a comparative analysis of plasma metabolomics in normal and T2DM mice, potential biomarkers and their associated pathways could be discovered, which would be helpful to clarify the molecular mechanism by which acupuncture ameliorates metabolic disruption in T2DM mice. In this study, plasma metabolomics of the db/db mice suggested that D-fructose levels were increased, while treatment with EA for 3 weeks dramatically reduced D-fructose levels. These results indicate that D-fructose has a distinct correlation with DM and IR. For decades, there has been growing concern about the effects of long-term consumption of sugar, particularly fructose; there has been considerable speculation that increased consumption of fructose, particularly through high-fructose corn syrup, is a major contributor to the increase in type 2 diabetes.34–36 1,5-dehydrate D-fructose does not directly enhance glucose-induced insulin release. D-fructose inhibits intestinal α-glucosidase to increase glucagon-like peptide 1 (GLP-1) secretion after oral sucrose, thereby delaying glucose absorption and increasing intestinal L-cell density. 37 GLP-1, the main intestinal hormone released by intestinal glucose, participates in the regulation of enteric-mediated postprandial insulin secretion, 38 and it also plays a role in reducing glucagon and inhibiting gastric emptying.39–41 Recently, GLP-1 has become widely used in the treatment of DM. These studies suggest that D-fructose promotes endogenous GLP-1 secretion and increases glucose tolerance and insulin release after gastric glucose administration. Since the growth of gut microbes requires nutrient supply, D-fructose affects gastric glucose absorption, a finding that may link fructose metabolism in plasma to the richness of intestinal microbes, suggesting a potentially effective mechanism of acupuncture treatment on T2DM.
In addition, alanine, aspartate and glutamate metabolism were filtered out as the most important metabolic pathways. Amino acids are considered useful diagnostic biomarkers because amino acid metabolism is significantly altered in prediabetes, and it continues to change during the progression of T2DM.42,43 In particular, tryptophan and branched-chain amino acids (BCAAs), such as valine, leucine and isoleucine, may be potentially useful biomarkers for T2DM due to their higher serum concentrations in T2DM patients. 44 Our results also indicate that EA could modify plasma metabolic biomarkers and the associated metabolic pathways involved in T2DM.
Based on the research cited above, acupuncture appears to stimulate the secretion of insulin, enhance the function of insulin receptors, modulate central nervous system functionality and improve the level of hormones related to glucose metabolism, and thus may play a certain role in lowering blood glucose. Acupuncture is generally believe to be safe in diabetic patients and no complications were observed in our study. However, acupuncture should still be cautiously applied in the patients with more severe disease (e.g. cardiovascular complications and diabetic foot ulcers). 21 Therefore, EA should not be used as an independent treatment for diabetes, which likely still requires comprehensive treatment including medication, diet and exercise (not just EA).
Conclusion
In conclusion, in db/db mice, EA improved markers of diabetes by alleviating hypoglycemia, increasing the diversity of intestinal flora, elevating beneficial bacteria and reducing harmful bacteria, and decreasing content of the plasma metabolite D-fructose. The mechanism by which EA positively impacts T2DM may be closely related to the regulation of intestinal flora and its metabolites. Collectively, our results suggest that EA may ameliorate T2DM by modulating intestinal microbiome richness, D-fructose levels and insulin signal pathways related to glucose metabolism. These results might provide useful hints for T2DM treatment, and further clinical investigation is warranted. These findings not only provide high-quality experimental evidence in support of the clinical application of EA but have also provided a new strategy and scientific basis for the treatment of diabetes using EA to regulate intestinal flora.
Footnotes
Contributors
WY designed the study. LHC drafted the article. LHC and SZ performed experiments and analyzed the data. KFC and XJX contributed significantly to the experiments and data analysis. WY, SZ and JJL designed the study and critically reviewed the article. All authors reviewed and approved the final version of the article accepted for publication.
Declaration of conflicting interests
The authors declared no potential conflicts of interest with respect to the research, authorship, and/or publication of this article.
Funding
The authors disclosed receipt of the following financial support for the research, authorship, and/or publication of this article: This study was supported by the Traditional Chinese Medicine Innovation Team and Talent Support Program (National Traditional Chinese Medicine Inheritance Innovation Team Project; ZYYCXTD-C-202004).
License statement
All studies were performed in accordance with the Guide for the Care and Use of Laboratory Animals published by the National Institutes of Health (NIH, USA). This study was approved by the Animal Care and Ethics Committee of Guangzhou University of Chinese Medicine (approval no. 20210604003).
Data availability
All raw data used to support the findings of this study are available in the following online data set: 10.6084/m9.figshare.21670376.