
Abstract
Hemoglobin is one of the most important chromophores in the human body, since oxygen is carried to the tissue by binding with the hemoglobin. Therefore measuring the concentrations of oxy-hemoglobin (HbO) and deoxy-hemoglobin (HbR) is very important in both clinical settings and academic fields. Frequency domain near infrared spectroscopy (fdNIR spectroscopy) is a technique that can be used to measure the absolute concentrations of HbO and HbR non-invasively and locally. The fdNIR spectrometer utilizes the attenuation and the phase shift (with respect to the source) that an intensity modulated NIR light experiences in order to calculate the absorption (μa) and reduced scattering (μ′s) coefficient of the tissue. In this work, a miniaturized dual-wavelength fdNIR spectrometry instrument is presented with both tissue-like phantom and in vivo occlusion measurements. Systematic tests were performed on tissue phantoms to quantify the accuracy and stability of the instrument. The absolute errors for μa and μ′s were below 15% respectively. The amplitude and phase uncertainty were below 0.25% and 0.35°. In vivo measurements were also conducted to further validate the system.
Introduction
In vivo biomedical imaging of tissue using NIR spectroscopy can be traced to Frans Jöbsis in 1977, 1 however the field rapidly evolved only recently. In certain wavelengths in the visible and NIR regions (for example 690 nm and 830 nm in this work) the absorption of HbO and HbR are distinct and significantly greater than of water. The basis of NIR spectroscopy in biomedical applications lies here. The absolute concentrations of HbO and HbR can be extracted by sending near infrared light at different wavelengths and collecting the attenuated and scattered light at a single location or multiple locations.
The absolute concentration of HbO and HbR are important biomarker in many applications including pediatric neurology, wound healing, breast tumor detection, and the diagnosis of brain ischemia.2–5 To this end, several techniques have been developed over the years; continuous-wave NIR spectroscopy (cwNIR spectroscopy), time-domain NIR spectroscopy (tdNIR spectroscopy) and frequency-domain NIR spectroscopy (fdNIR spectroscopy). Even though these techniques differ in how they utilize near infrared light, they all use the same range of wavelengths in the optical window Figure 1.
In fdNIR spectroscopy, the light intensity is modulated with a high frequency sine wave, typically at least tens of MHz. The attenuation and the phase shift information of the light, which traversed the tissue, are used to calculate the absorption (μa) and reduced scattering (μ′s) coefficients.
Several benchtop, commercial fdNIR instruments are readily available with reports of validation performance.6,7
In this work, the design and validation of a miniaturized fdNIR instrument is presented. The instrument utilizes off-the-shelf laser diodes and a solid-state avalanche photodiode (APD) as the light source and detector. The portable fdNIR system, with ∼30 times smaller footprint in volume compared to commercial fdNIR oximeters, consists of a multi-tier printed circuit board (PCB) stack, a data acquisition card, and a Raspberry Pi controller. The core signal processing circuit is a custom-designed application specific integrated circuit (ASIC), fabricated in a 130 nm (CMOS, complementary metal-oxide-semiconductor) process. The instrument’s accuracy and stability were characterized on calibrated solid tissue phantoms. In vivo measurements were also conducted to further validate the instrument.
Materials and methods
fdNIR theory
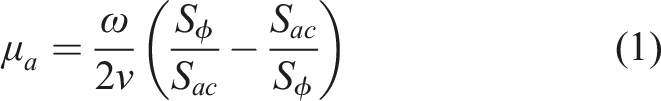
The two modalities of fdNIR spectroscopy are a multi-frequency method or a multi-distance method. In multi-frequency measurements, the modulation frequency is swept across a wide range, while the source-to-detector distance is fixed. The phase shift and amplitude at different frequencies can be used to recover the above-mentioned optical parameters of the media. The most significant advantage of multi-frequency method is that the measurement can be accomplished at one single source-to-detector distance. This leads to better immunity to local tissue variations and a more compact probe design. However, the required modulation frequency is beyond 1 GHz for accuracy, which requires high-frequency sources, detectors, and complex circuits.8,9 In multi-distance measurements, the modulation frequency is fixed, while the measurement is performed at different source-to-detector distances. The absorption (μa) and reduced scattering (μ′s) coefficients of the media can be recovered by feeding the slope of amplitude-distance curve (SAC) and phase-distance curve (S
ϕ
) to the following equations
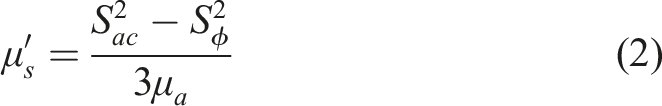
System level block diagram of the fdNIR spectroscopy system.
System architecture
The block diagram of the system is shown in Figure 1. Laser diodes that emit at 690 nm (4 × HL6750 MG) and 830 nm (4 × HL8338 MG) are time division multiplexed each with 120 ms on-time. Two additional time slots are reserved for transmitting the sampled data, which means a single measurement frame takes 1200 ms, which corresponds to 0.83 Hz refresh rate. The laser diodes are coupled to the probe via a fiber bundle. The visible (690 nm) and near infrared (830 nm) energies, modulated at 80.001 MHz travel through the tissue, and are detected by the probe again and converted to electrical signal with an APD (Hamamatsu S9251-15, Hamamatsu City, Japan). The APD was selected for its low junction capacitance (3.6 pF), high photosensitivity (5000 A/W), 3 dB bandwidth (350 MHz) and large photosensitive area (1.5 mm2). The recovered electrical signal is amplified, processed and down-converted in the CMOS ASIC. 16 The entire signal chain is fully differential for optimal common-mode suppression and noise performance. To that end, a reference signal at the same frequency as the laser modulation frequency and differential local oscillator (LO) signals are generated. The down-conversion results in output signals at 100 Hz, which are digitized by the data acquisition system (DAQ, National Instruments Corp., Austin, TX, USA) with sampling rate of 400 kSps and further processed in software to extract the μa, μ′s, and finally the HbO and HbR concentrations.
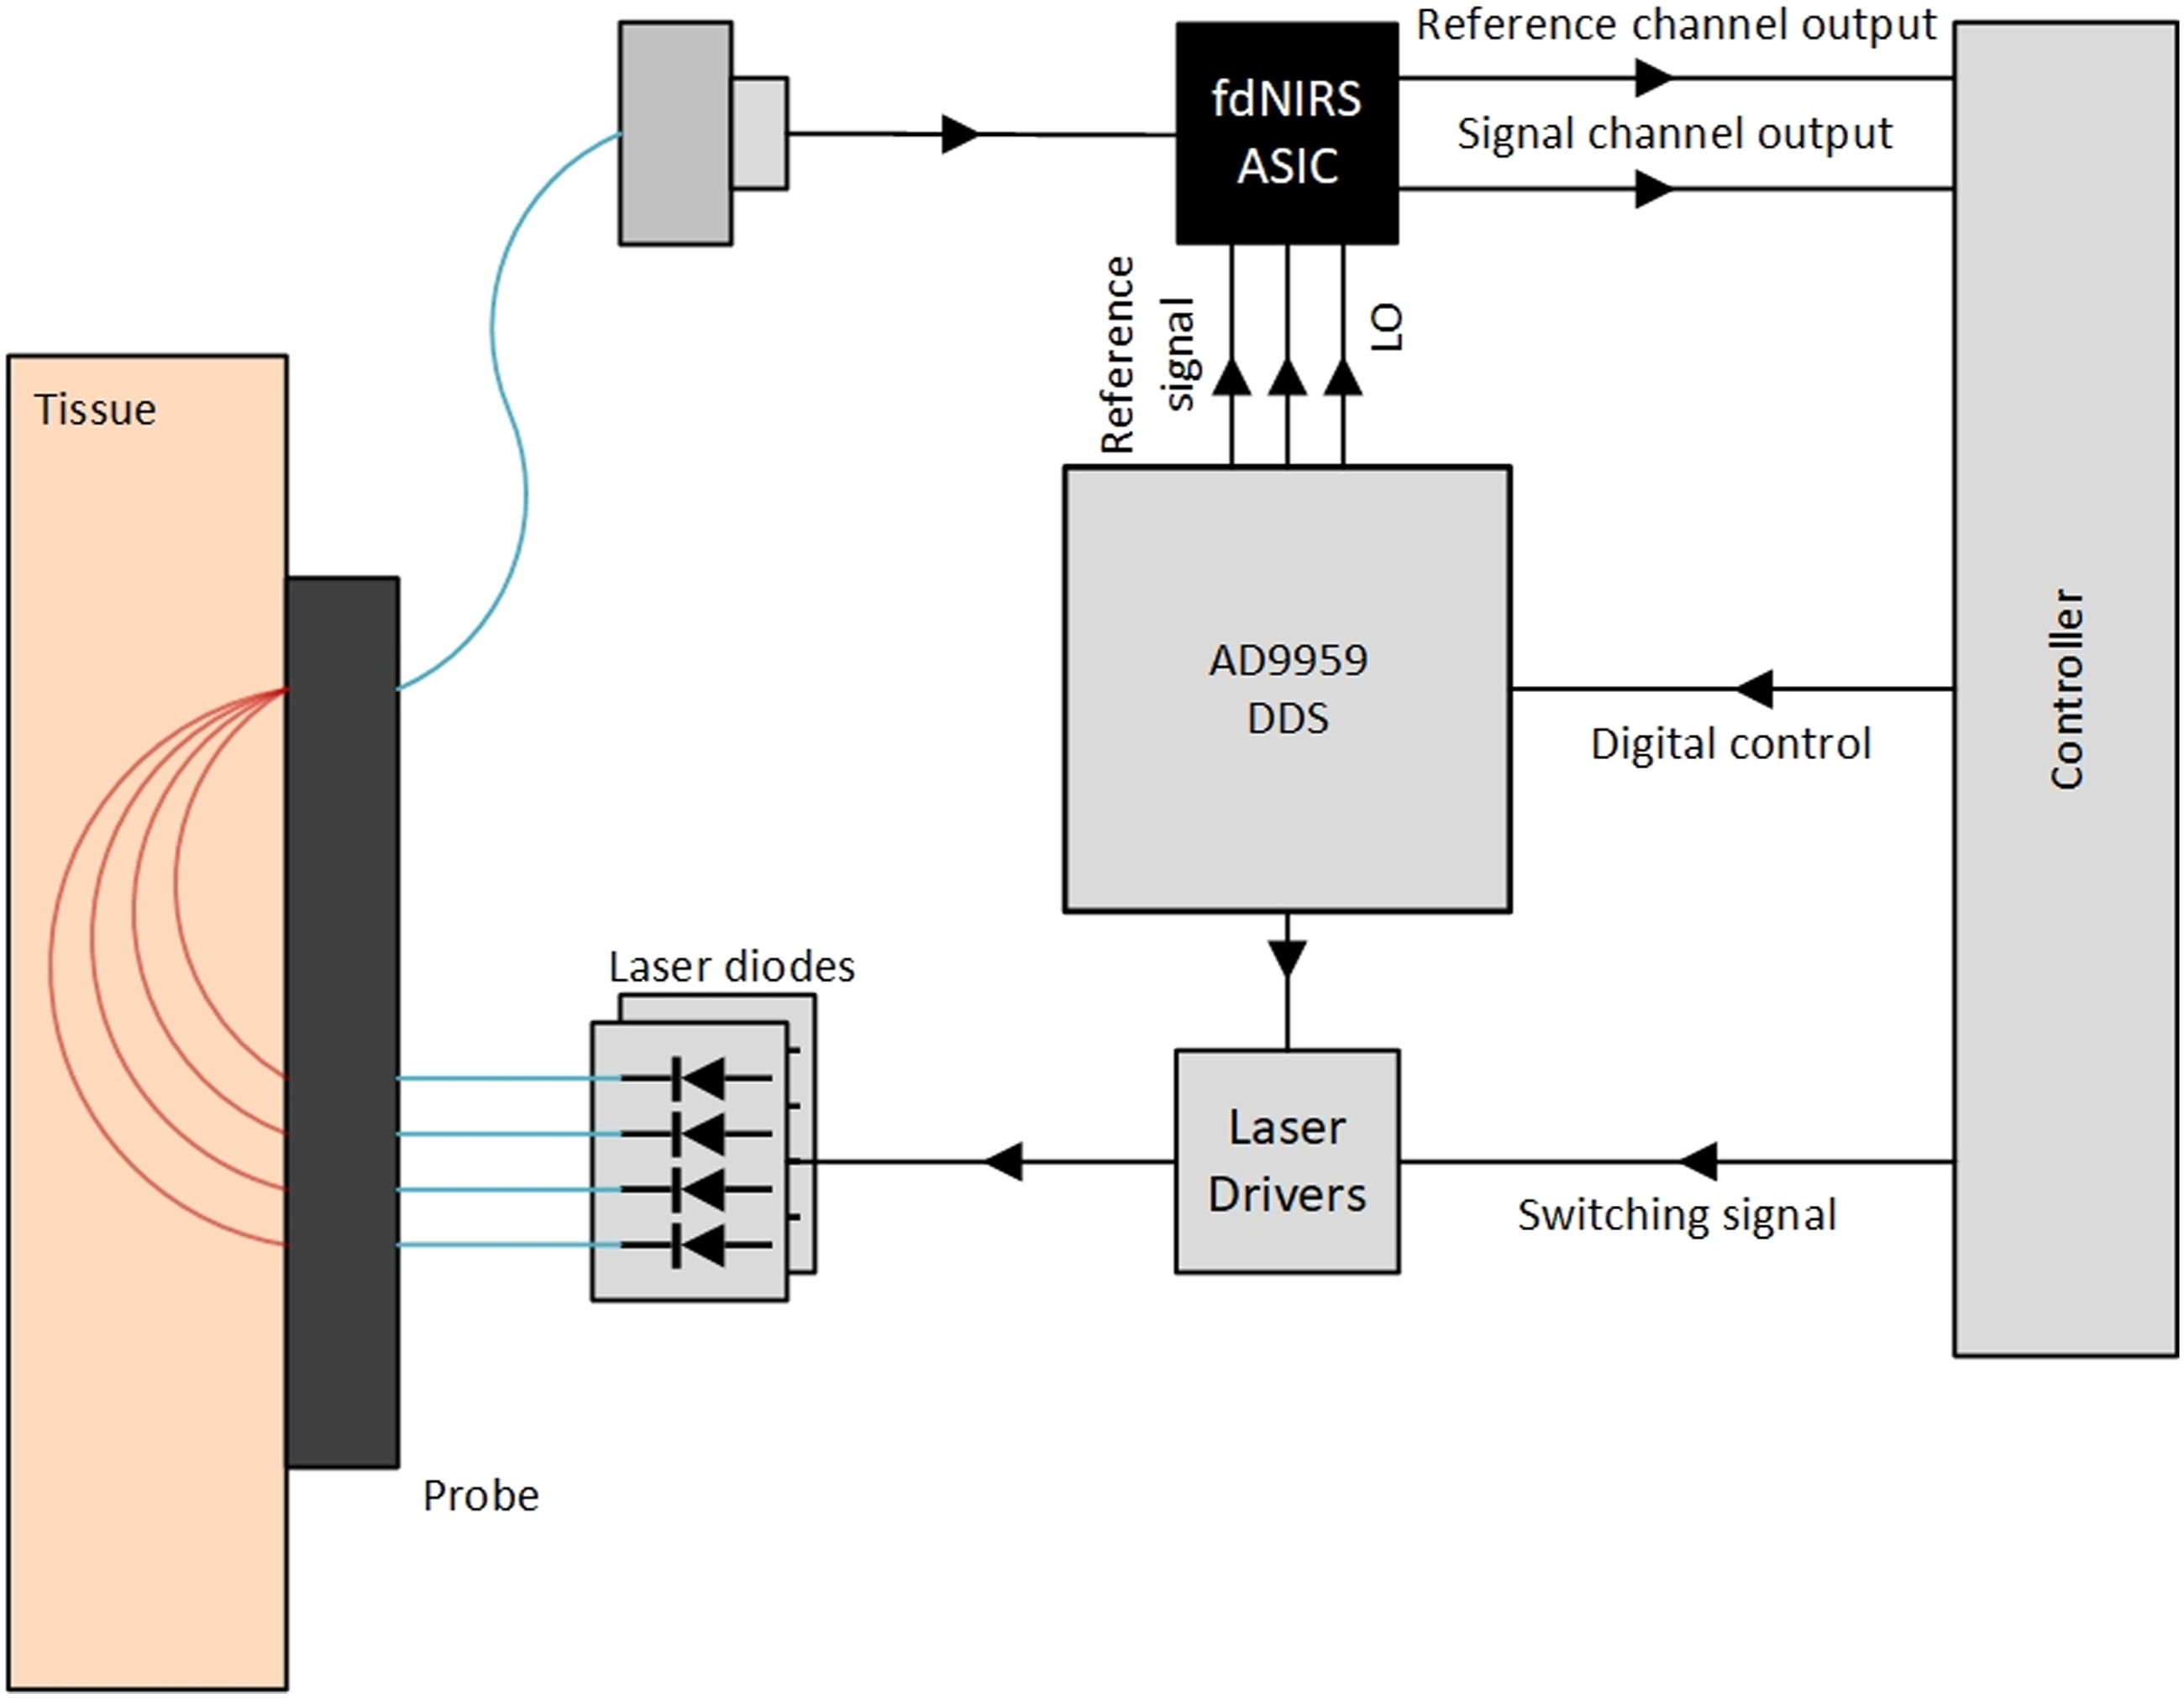
Probe design
The main requirements for the probe in a multi-distance fdNIR measurement are: (1) flexibility for good coupling with the tissue, (2) several windows that allow NIR light to become incident to the tissue at known distances from the detector window, and (3) large fiber numerical aperture defined previously and diameter to accommodate large area APDs. To that end, a custom probe (ISS, Inc., Champaign, IL) was used. It has a total of five windows; 4 emitter windows, each accommodating two fibers (400 μm in diameter), and one detector window. For the detector window, a 2 mm fiber bundle with 0.55 NA is used. The head of the probe is made of polyurethane so that it can conform to curved surfaces. One end of the each fiber has an SMA connector for sturdy connection with the laser diode or APD mounts. The source-detector distances on the probe are 1.5 cm, 2.0 cm, 2.5 cm and 3.0 cm. The diagram of the probe can be seen in Figure 2. The available optical power at different source-detector distance varies significantly in multi-distance measurements. A high gain can boost the SNR at large source-detector distances but may lead to saturation at small source-detector distances. Although the ASIC has a good dynamic range of 33 dB, tuning the optical power can be a tricky and challenging job in many cases. To solve that problem, a thin film neutral density filter is placed on the surface of the first emitter window as an equalizer. The filter attenuates the optical power at 1.5 cm source-detector distance, which expends the overall dynamic range. The probe design.
Electronics
Laser driver
The above-mentioned eight laser diodes are driven by two laser driver circuits, one circuit for each wavelength. These eight laser diodes are mounted onto the PCB via laser driver mounts (Thorlabs S05LM56, Thorlabs Inc., Newton, NJ, USA), and the fibers are coupled to the laser diodes via SMA fiber adapters (Thorlabs PM20-SMA). The mounts and adapters provide sturdy contact and also works as heat sinks. The schematic of the laser driver circuits can be seen in Figure 3. Laser driver circuit.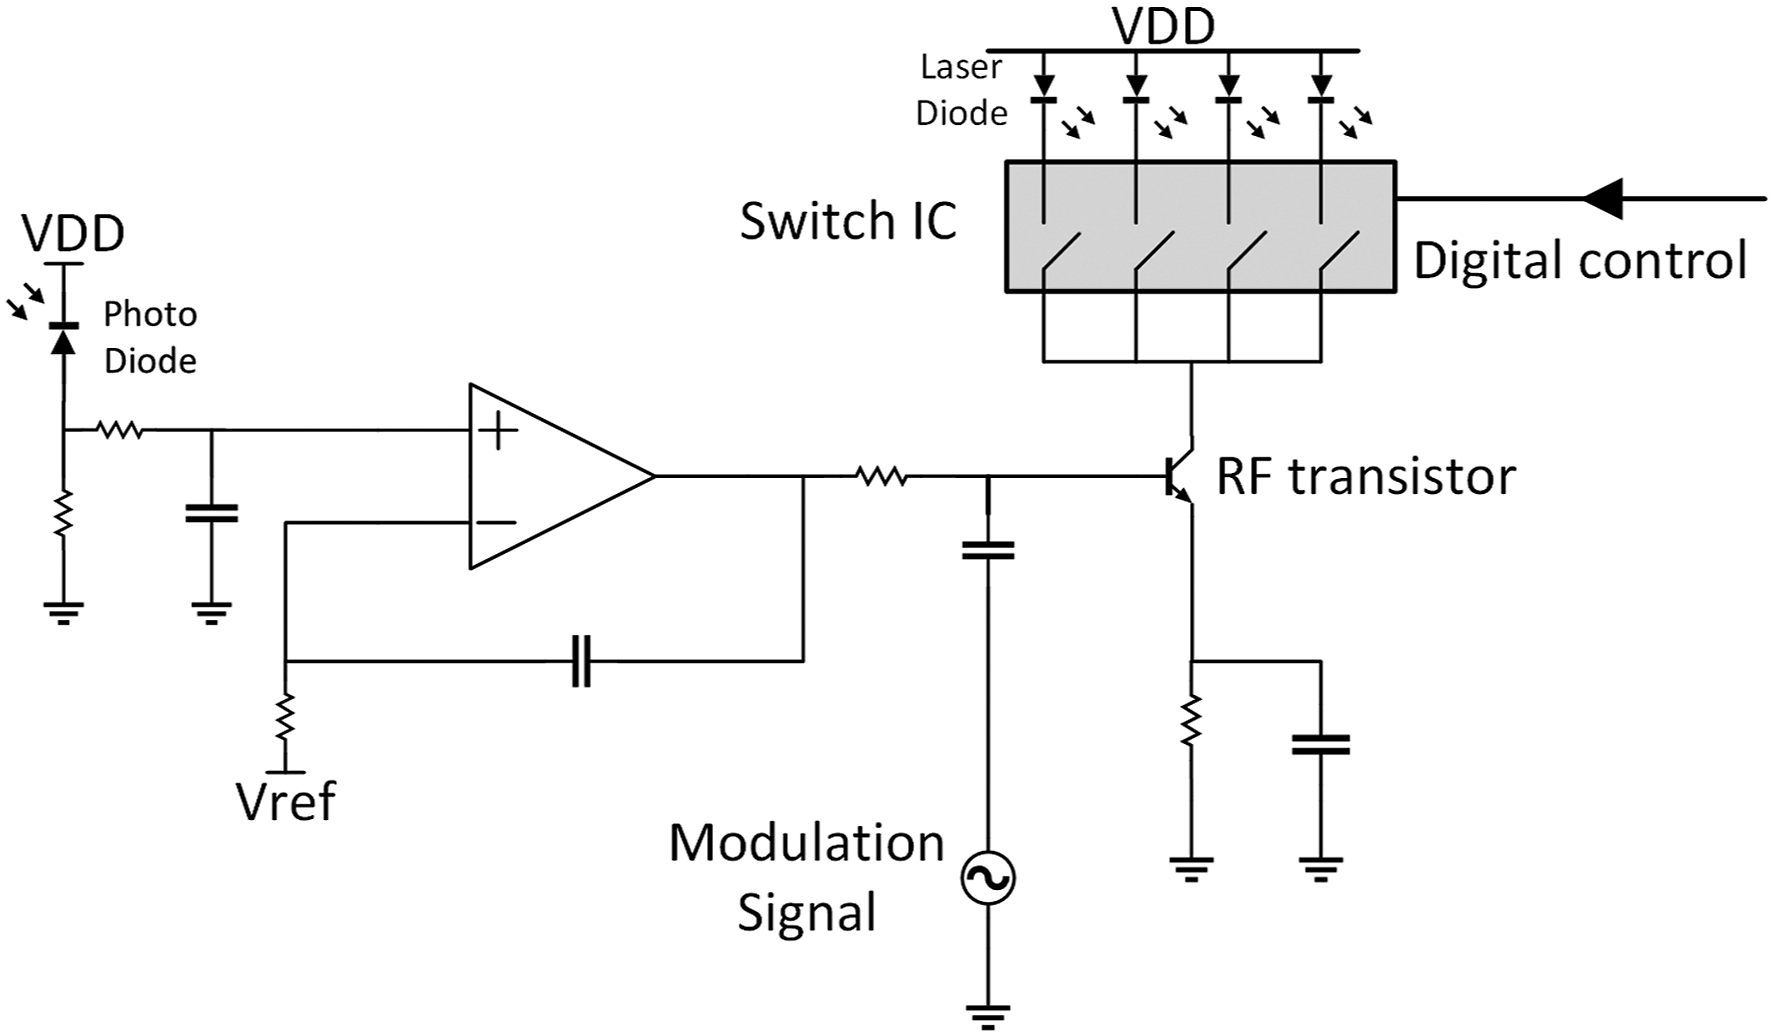
The basic topology of the driver is constant current regulator with a feedback loop that sets the DC voltage at the output of the OP-AMP, using the monitoring current of the integrated photo diodes of laser diodes. This feedback loop adjusts the DC operating point of the RF transistor, so that the monitoring current stays constant, which helps to keep the optical output power of different laser diodes the same. For example, if a laser diode has a lower optical output power than the others with the same forward current, in other words lower monitoring current than expected, the feedback loop increases the forward current which increases the optical power, which in turn increases the monitoring current of that laser diode, and the loop settles.
The DC reference voltage Vref sets the operating DC voltage at the output of the OP-AMP and the coupling capacitor Cc couples the radio-frequency (RF) modulation signal the DC voltage. The output of the OP-AMP, biases the BJT and results in an emitter current with DC and AC components. The AC component of the current can be adjusted independently from the DC component by adjusting the amplitude of the modulation signal. The OP-AMP was chosen as OPA695 (Texas Instruments) for its very high bandwidth (1.4 GHz for Gain = +2) and unity gain stability. The BJT is chosen as BFP780 (Infenion Technologies) for its linearity (23 dB output 1-dB compression point), maximum current capability (>100 mA). The switching IC is ADG1412 (Analog Devices), picked for its low channel resistance (∼1 Ω) and current capability (>200 mA).
Signal generation
For the multi-distance fdNIR spectroscopy measurement presented here, a total of four RF signals need to be generated; one for laser modulation (80.0001 MHz), one as reference signal (80.0001 MHz) and two as the differential local oscillator (LO) signals (80 MHz) for the down-conversion. Solutions such as crystal oscillators are not suitable because two RF tones that are very near to each other need to be generated. Therefore, a direct digital synthesizer (DDS, AD9959) is implemented for its four differential output channels that are frequency, amplitude and phase independent. The DDS system offers 0.12 Hz frequency resolution, 14-bit phase resolution and exceptional phase noise characteristics. For differential-to-single-ended conversion, baluns are used. The DDS output is filtered by a band-pass filter.
fdNIR ASIC
The fdNIR spectrometer’s ASIC is a custom designed integrated circuit, fabricated in a 130 nm CMOS process. 12 It has two fully differential identical channels that comprise of a low-noise, resistive feedback transimpedance amplifier (TIA), a Gm-C band-pass filter and a double-balanced gilbert mixer. Channel 1 processes the signal from the APD and the parallel channel processes the reference signal generated by the DDS.
The very weak photoelectric current at RF is amplified by ∼120 dB by the front-end TIA. The Gm-C band-pass filter further amplifies the signal and also filters noise signals that may have coupled to the RF signal. The Double-Balanced Gilbert Mixer, down-converts the RF signal to 100 Hz with the help of the local oscillator previously defined signals for the mixer, generated via the DDS (Figure 4). FdNIR CMOS ASIC.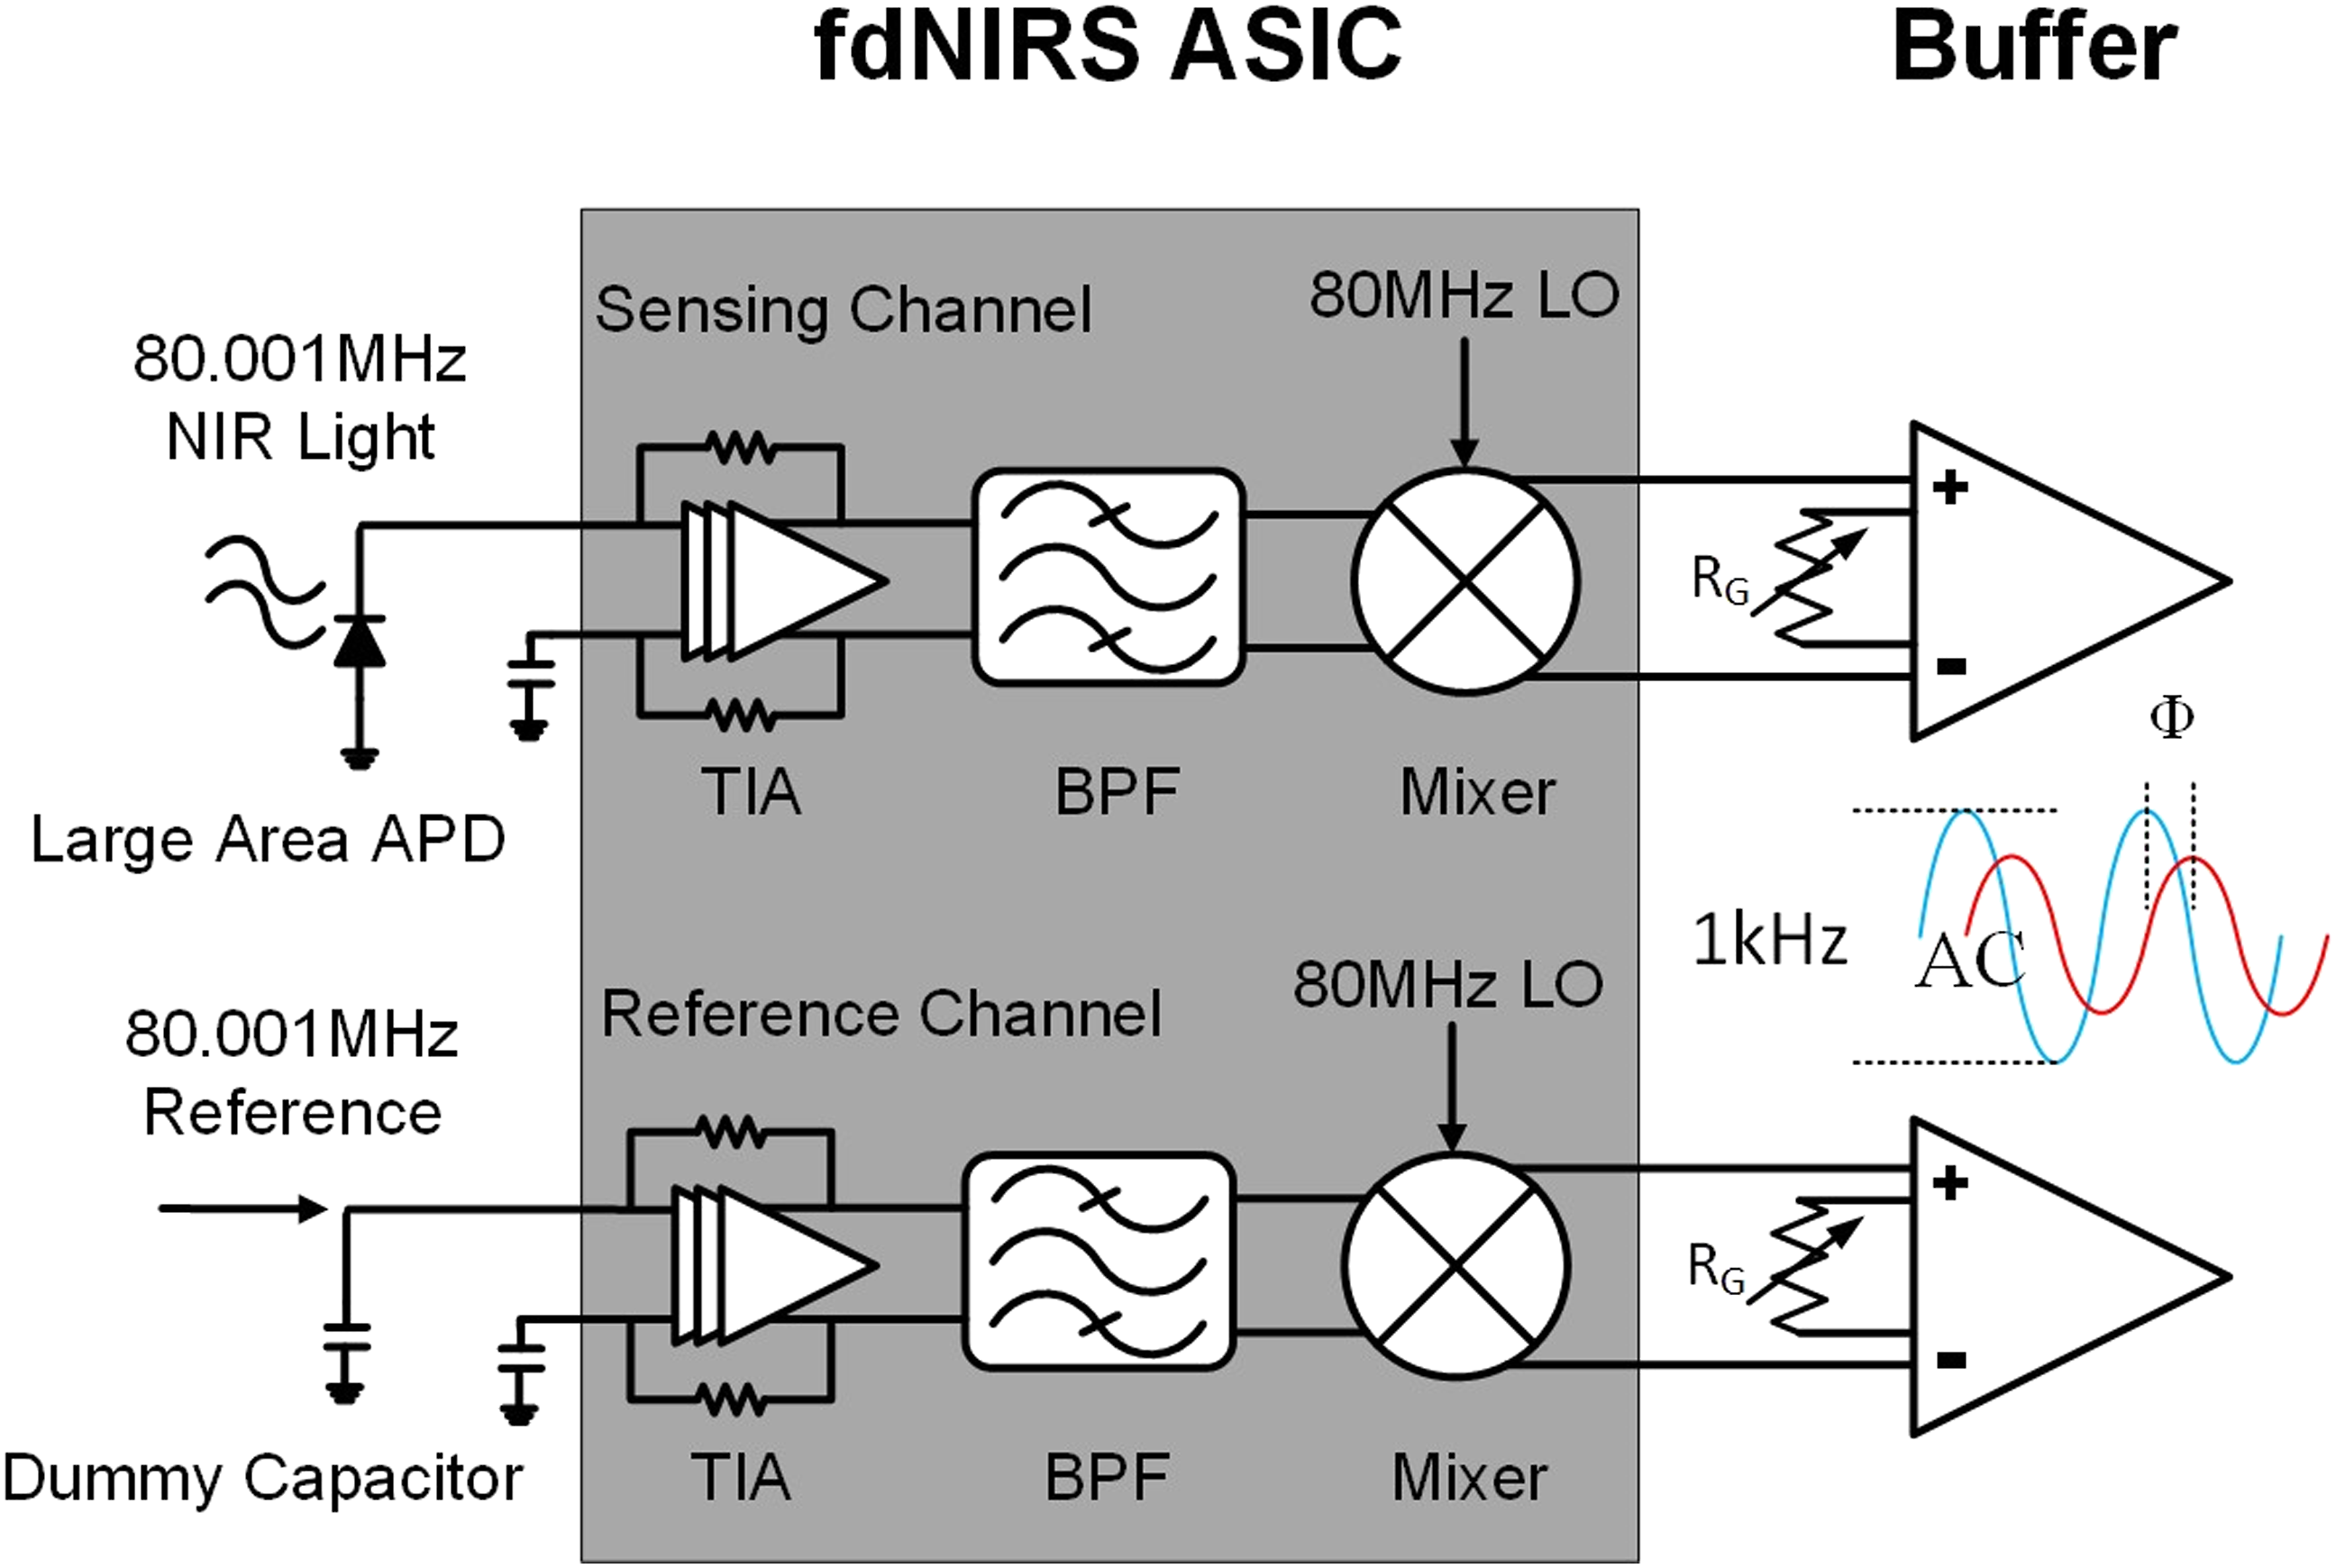
Since most APDs that operate in these wavelength ranges with these bandwidths are single-ended products, a dummy capacitor with the same capacitance as that of the APD junction is connected to the input of the Channel 2. Equalizing the capacitances seen by both inputs improves the noise performance and the linearity of the fdNIR ASIC. The two differential output pairs of the fdNIR ASIC are converted to single ended, buffered and further amplified off-chip.
Calibration
The top view of the system can be seen in Figure 5. There are two laser arrays consisting of four laser diodes each, driven by a laser driver circuit. Even though the laser diodes and the laser driver circuits for the two different colors (690 nm and 830 nm) are identical to each other, there is always some mismatch due to manufacturing, layout, aging etc., but most importantly the different coupling efficiencies of each to the tissue. Top view of the system.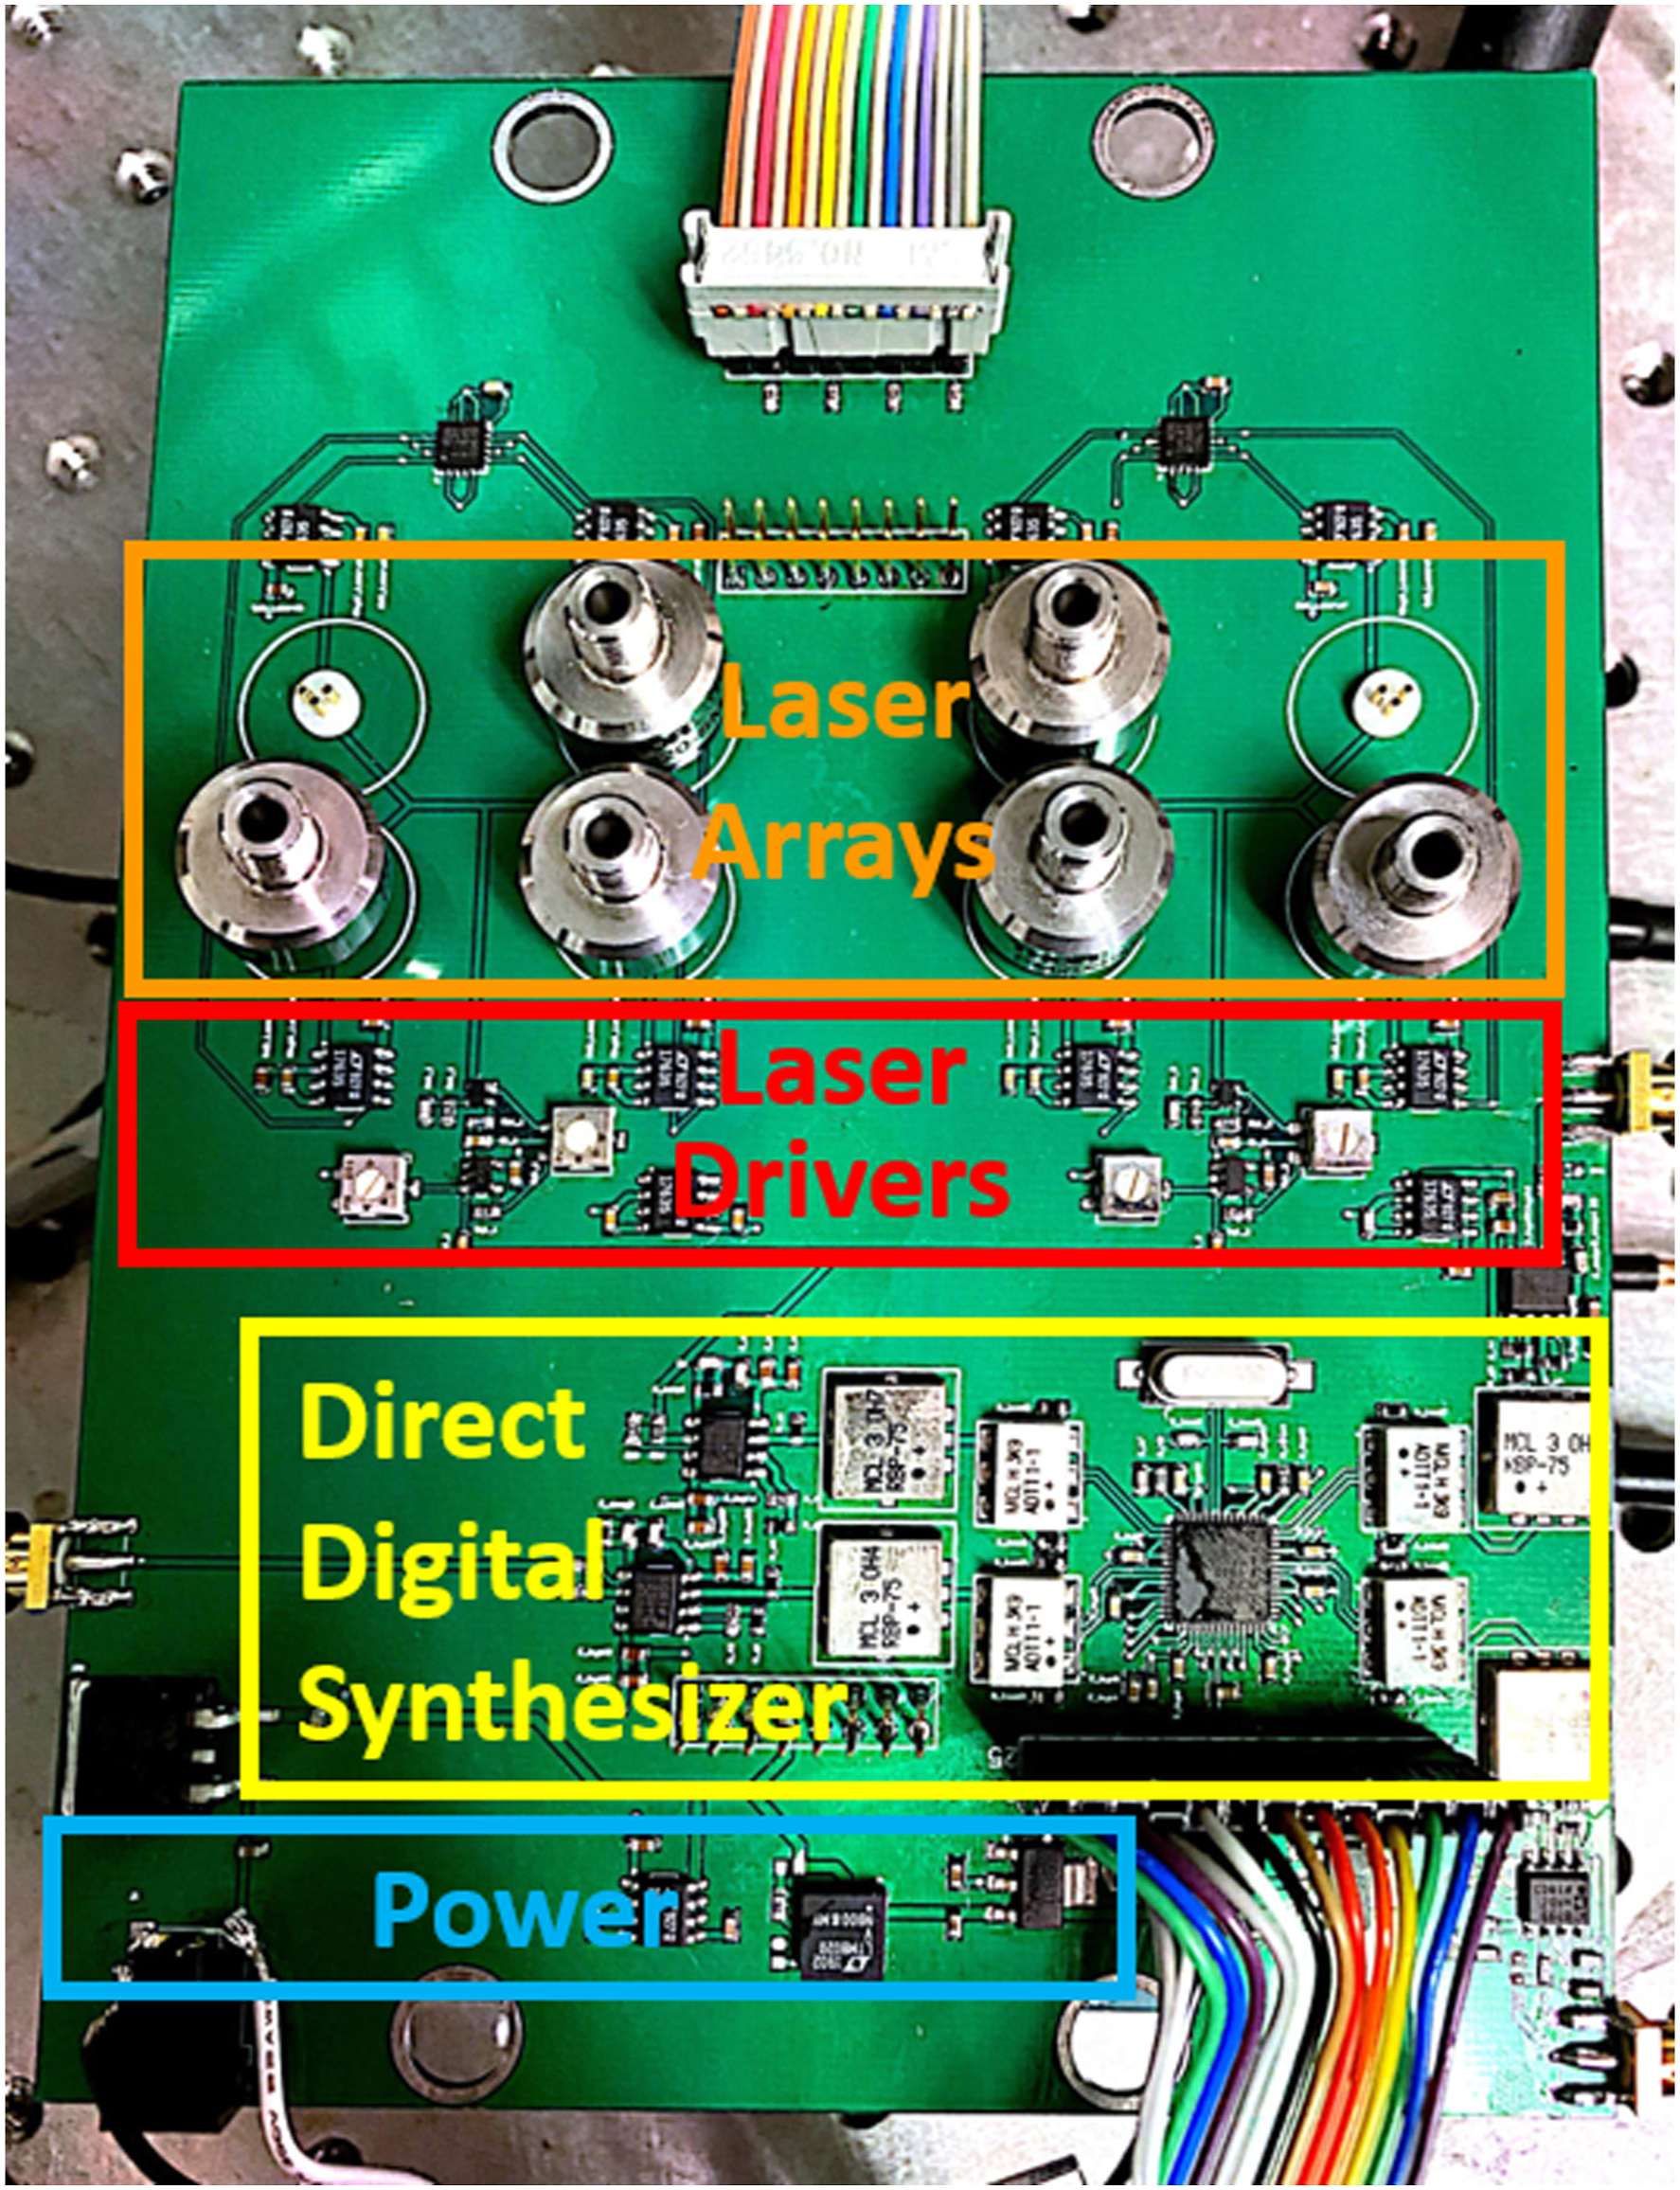
Solid phantom measurement results using a calibration phantom.
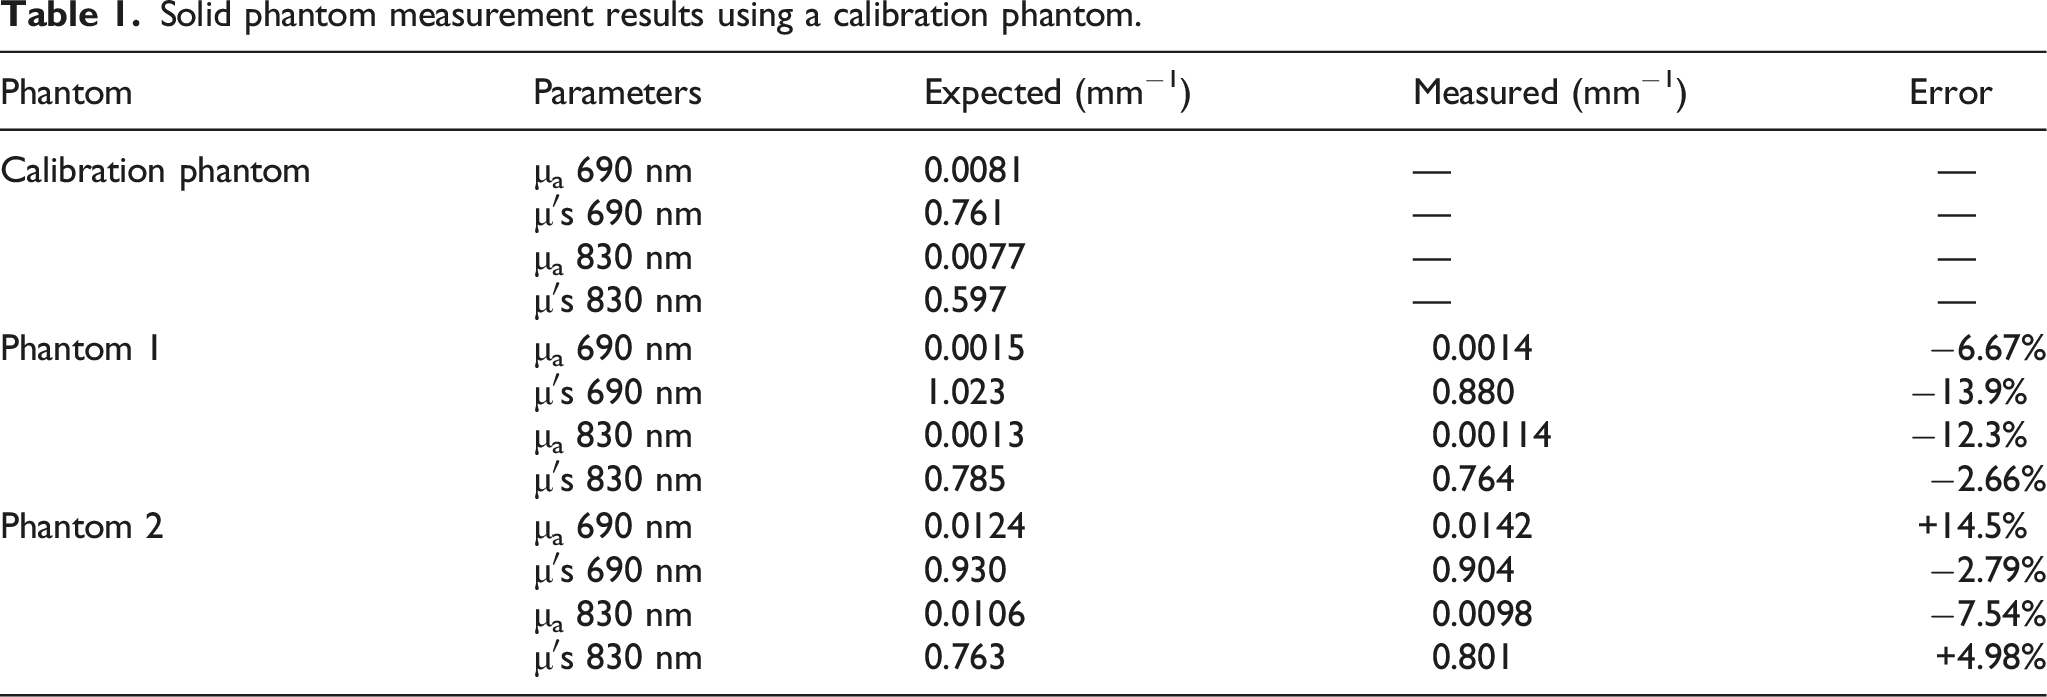
Figure 6 shows an example of the calibration algorithm, where the red crosses are the measurement results before the calibration, and the blue stars are after calibration. One important note is that subplots (a) and (c) of Figure 6 show the “linearized amplitudes”. This linearization process enables realization the goal of measuring SAC of the medium, which can be approximated as the slope of ln(ρ2*AC) for reflectance measurements in a semi-infinite media, where ρ is the source-detector separation,
13
and AC is the amplitude of the measured AC signal. The black dashed lines indicate the SAC and S
ϕ
values derived from the known μa and μ′s of the phantom we measure using (equations 1) and (2), and the green dashed lines are the line fit to the calibrated results. An example of the calibration algorithm. (a) Linearized and (c) normalized amplitudes for 690 nm and 830 nm lasers. Normalized phases for (b) 690 nm and (c) 830 nm lasers.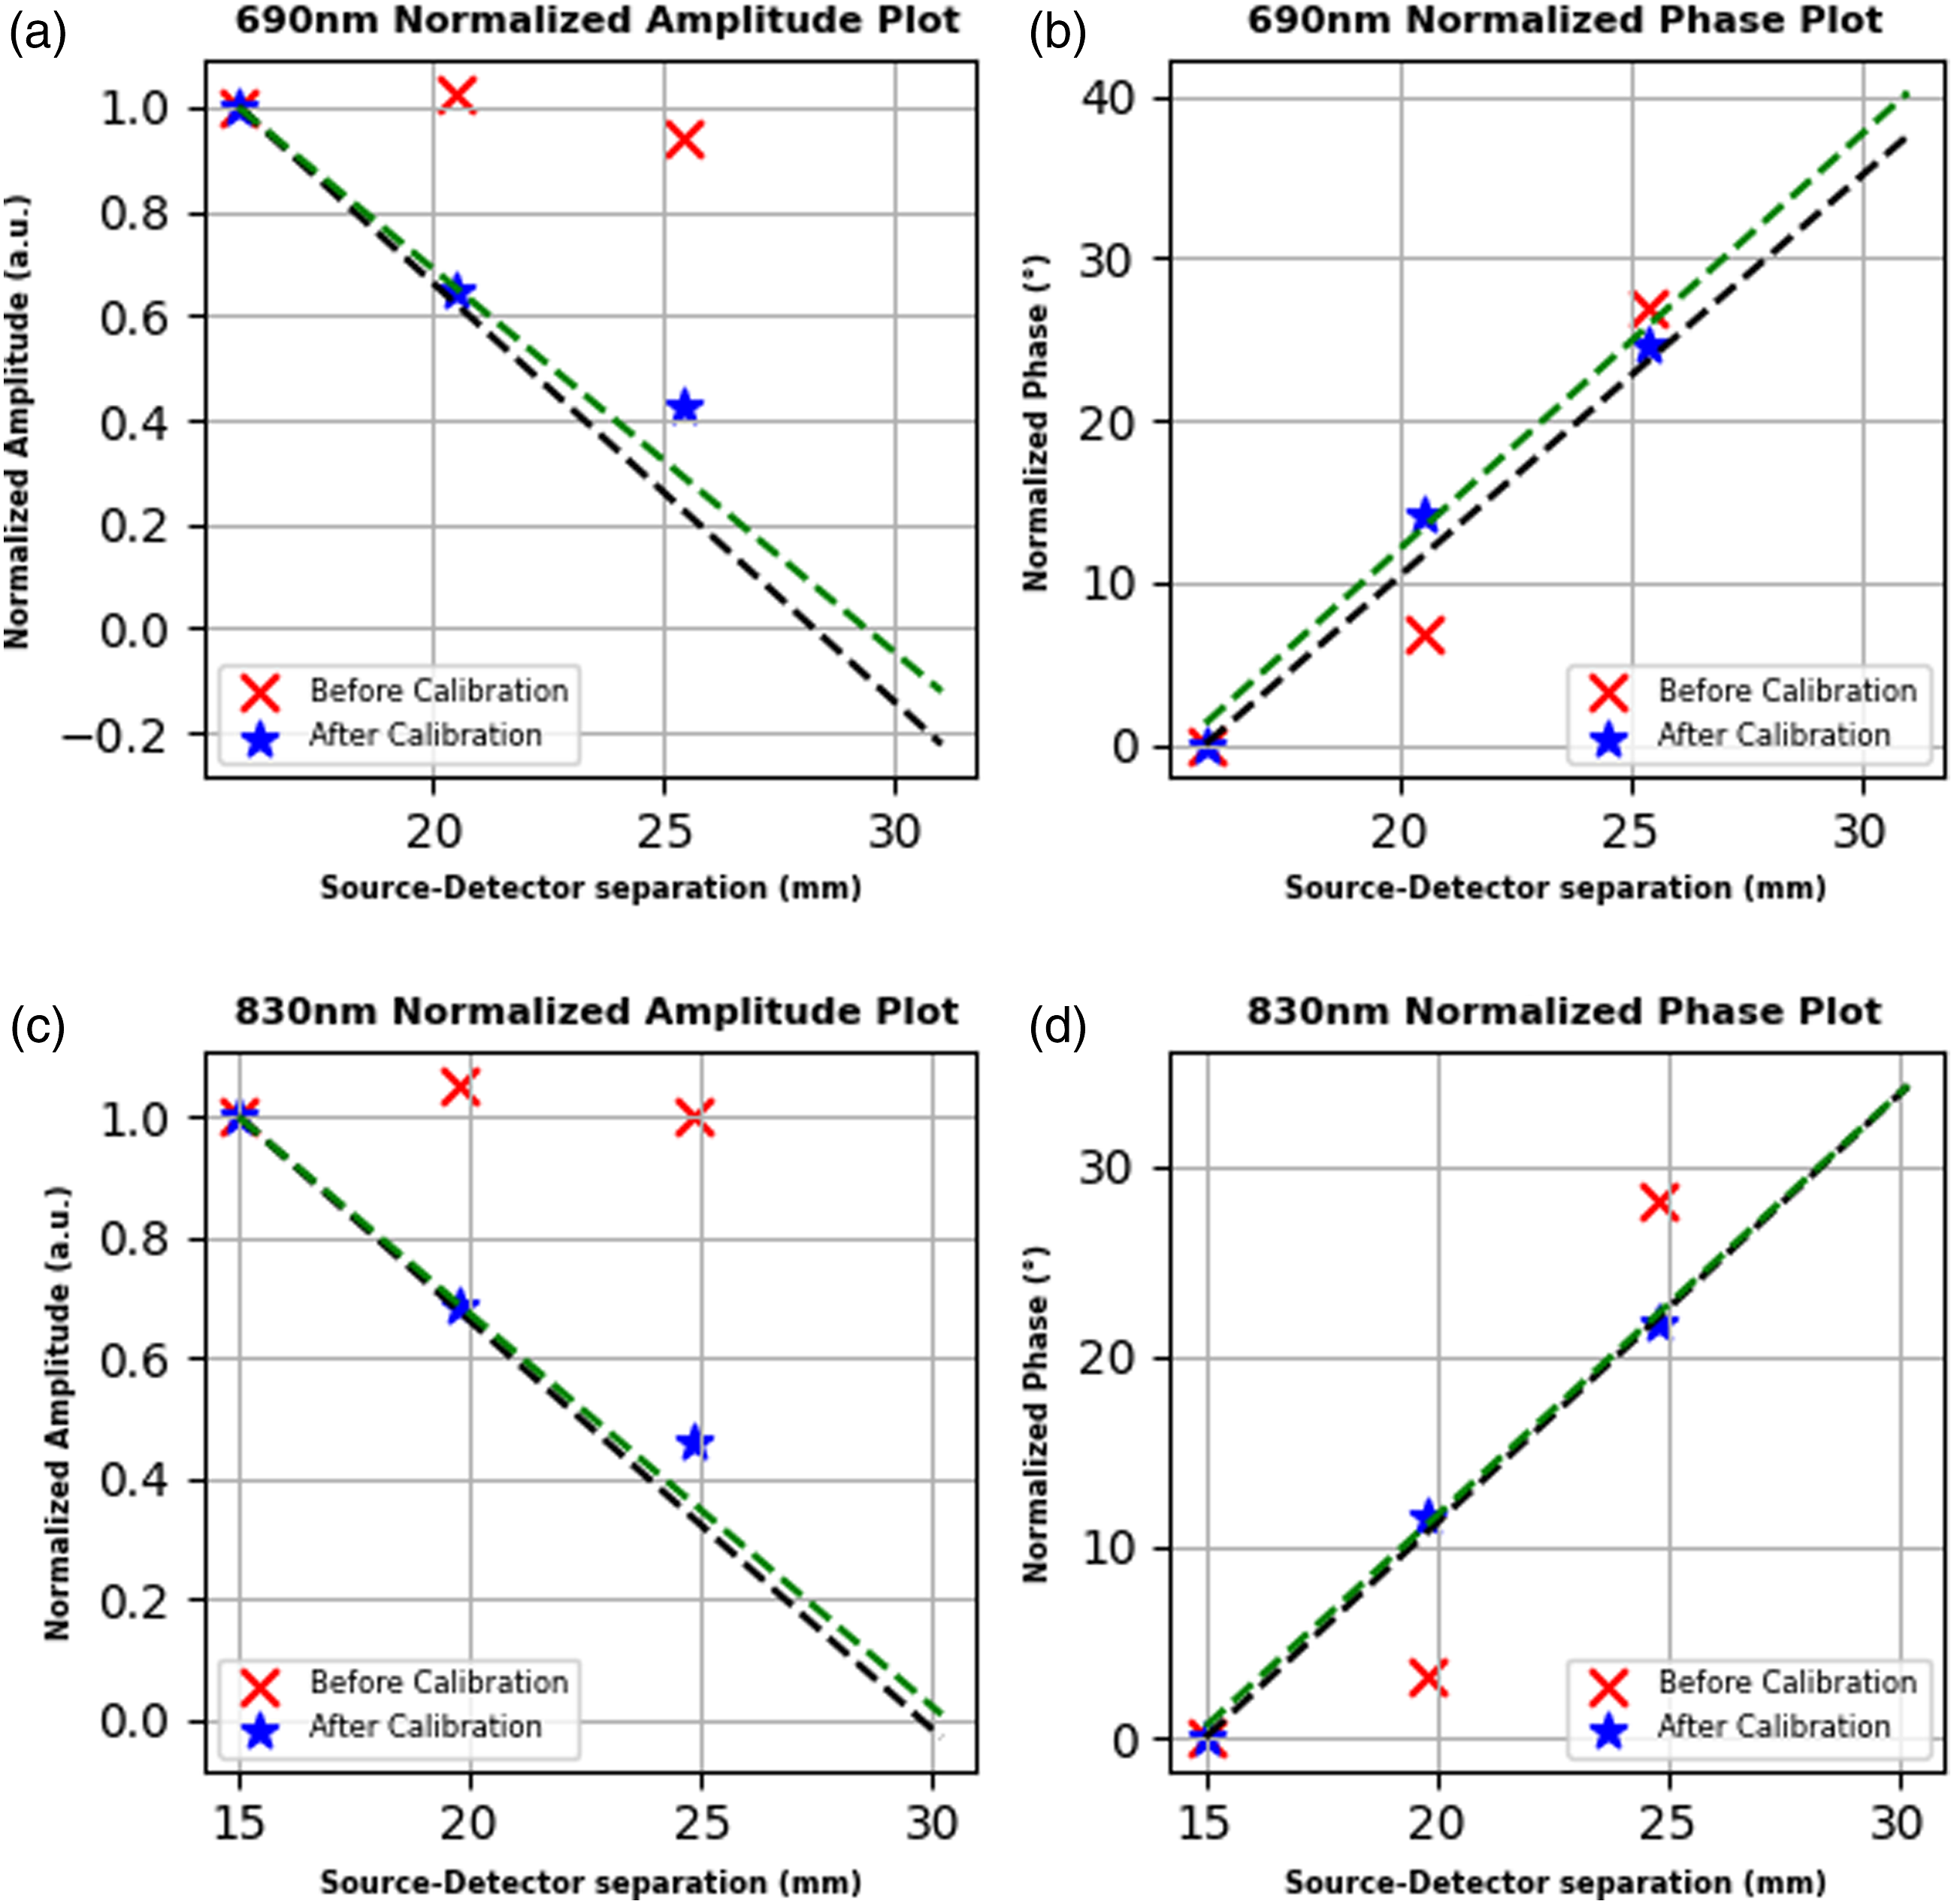
It can be seen that after the calibration, the recovered SAC and S ϕ (green dashed lines) are very close to the known optical values (black dashed lines). Tabulated results for calculated μa and μ′s can be found in Table 1.
Accuracy and stability
The absolute accuracy is affected by both systematic errors and instrumental noise. The systematic errors such as validity of semi-infinite medium assumption, uneven light coupling, and variation in probe fabrication can be minimized by applying more sophisticated calibration and correction methods. 14
Accuracy
To characterize the accuracy of fdNIR instruments, usually measurements on solid and/or liquid phantoms with known optical parameters are conducted. Liquid phantom experiments were reported for previous iteration of the system, which featured the same ASIC, but also comprising mostly of benchtop equipment. 12 In this work, we present the solid phantom experiments where one phantom is used for calibration and two others used for the accuracy and stability measurements.
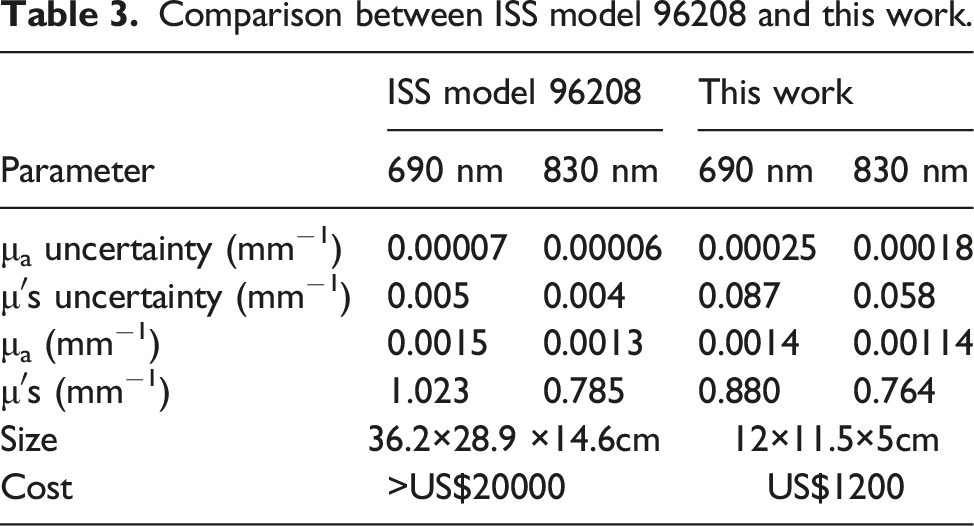
All three phantoms were fabricated by the Diffuse Optical Imaging of Tissue Lab at Tufts University and their optical properties were characterized by a commercial oximeter system (ISS Model 96208, Fastest Electronics, Walled Lake, MI, USA) using a multi-distance approach. These characterization results were taken as the ground truth and reported under the “Expected (mm−1)” column in Table 1. The calibration phantom provides baseline results. The calibration phantom provides baseline results. Measured data and error results on phantom 1 and 2 are reported in Table 1.
Accuracy comparison.
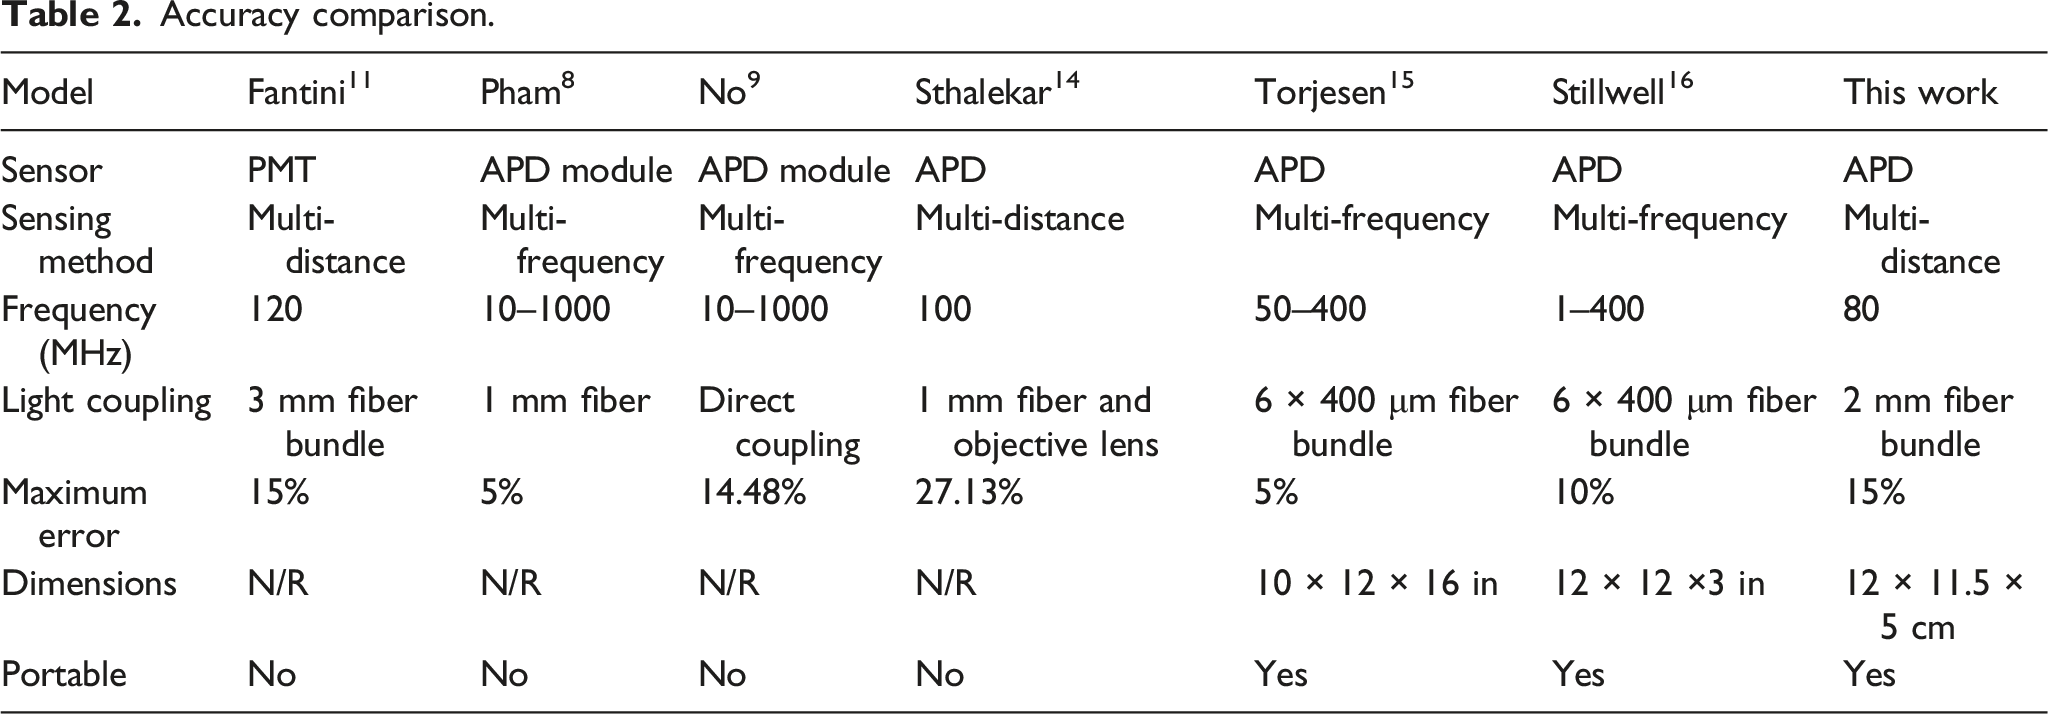
We can see that our design achieved a good level of accuracy among the other reported systems. Especially considering the fact that our system if at least an order of magnitude smaller than systems of accuracy below 15% as well as avoiding the use of expensive (even more so than the complete commercial fdNIR instrument from ISS) and complex equipment such as a vector network analyzers (VNAs), standalone laser controller/drivers or very high speed ADCs that require an field programmable gate array development kit.
Stability
In order to characterize the stability of our measurements, a 15 minute-long solid phantom measurement is performed. The ratios of the measured AC amplitudes of adjacent lasers, and their distribution can be seen in Figure 7, where, (a) shows the measured AC signal ratios of second laser to first and the distribution over 15 min, (b) shows the same quantities for third to second, (c) fourth to third, where first, second, third and fourth lasers refer to increasing source-detector separations. (a) The amplitude of second laser normalized to first. (b) The amplitude of third laser normalized to second. (c) The amplitude of fourth laser normalized to third. All are 830 nm lasers.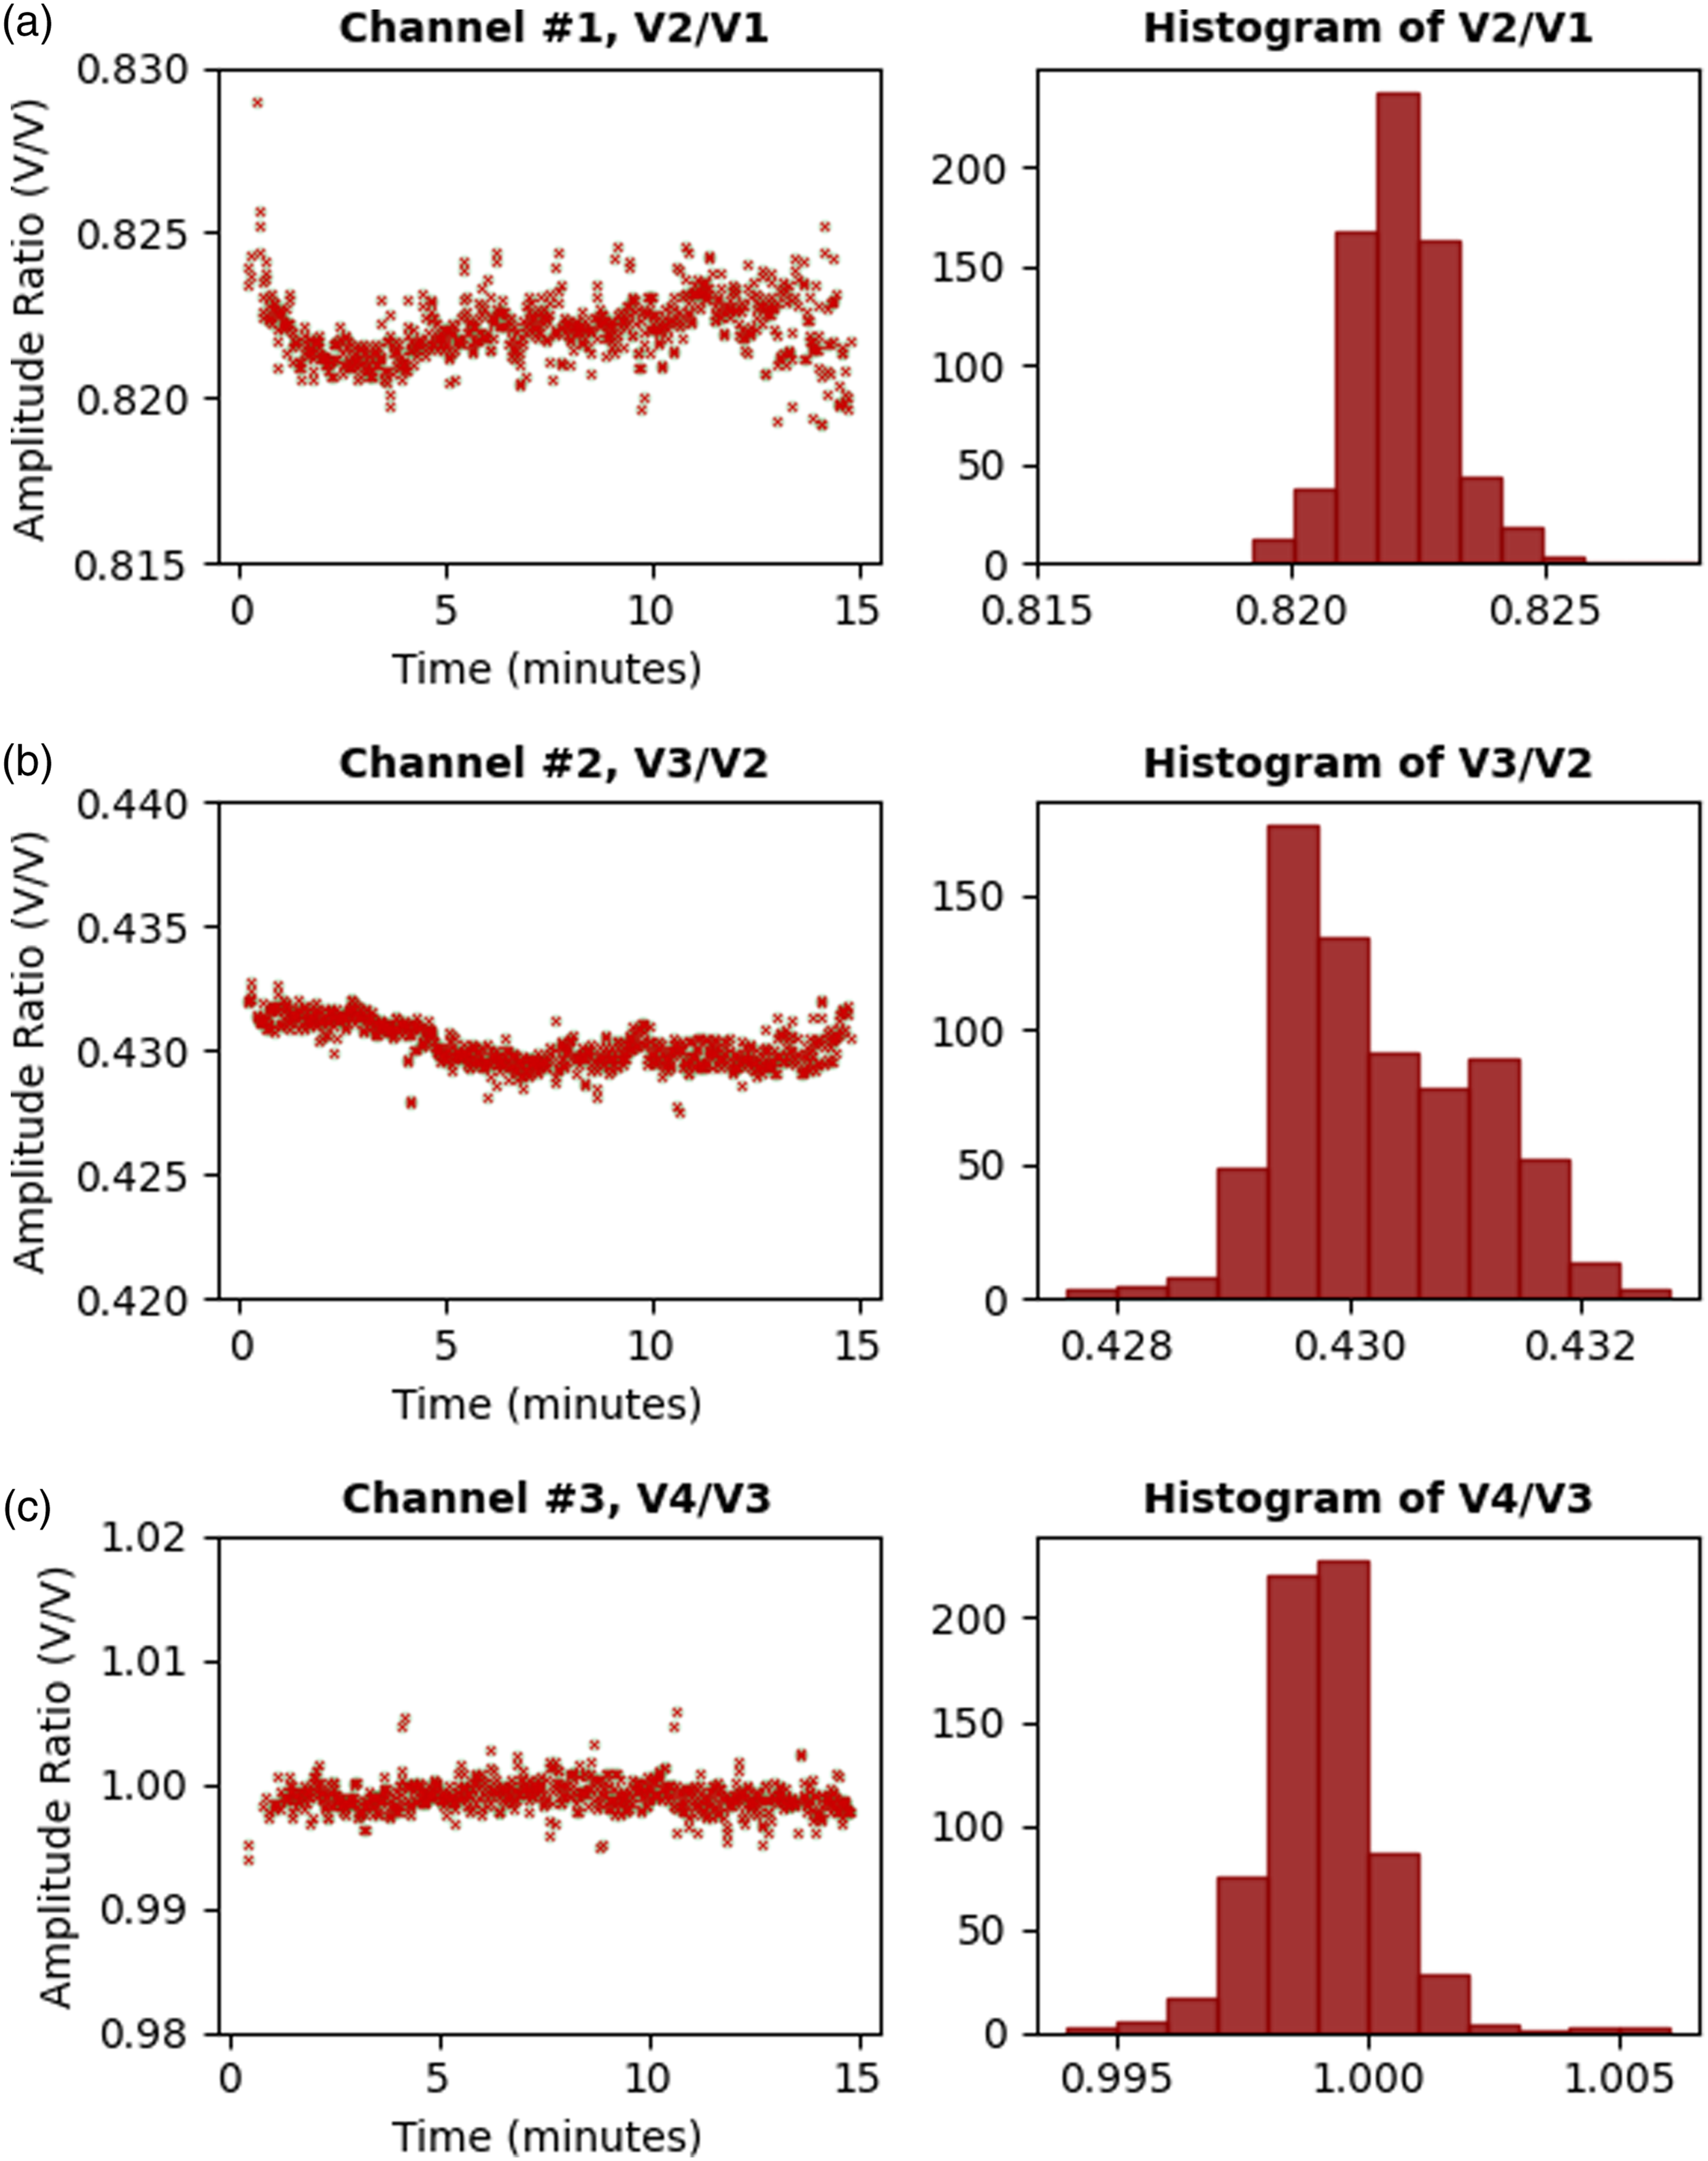
Similarly, Figure 8 shows the measured phase shifts between adjacent lasers, with (a) showing the phase shifts between second and first, (b) between third and second and (c) between fourth and third lasers. (a) The measured phase shift of the second laser with respect to the first. (b) The measured phase shift of the third laser with respect to the second. (c) The measured phase shift of the fourth laser with respect to the third.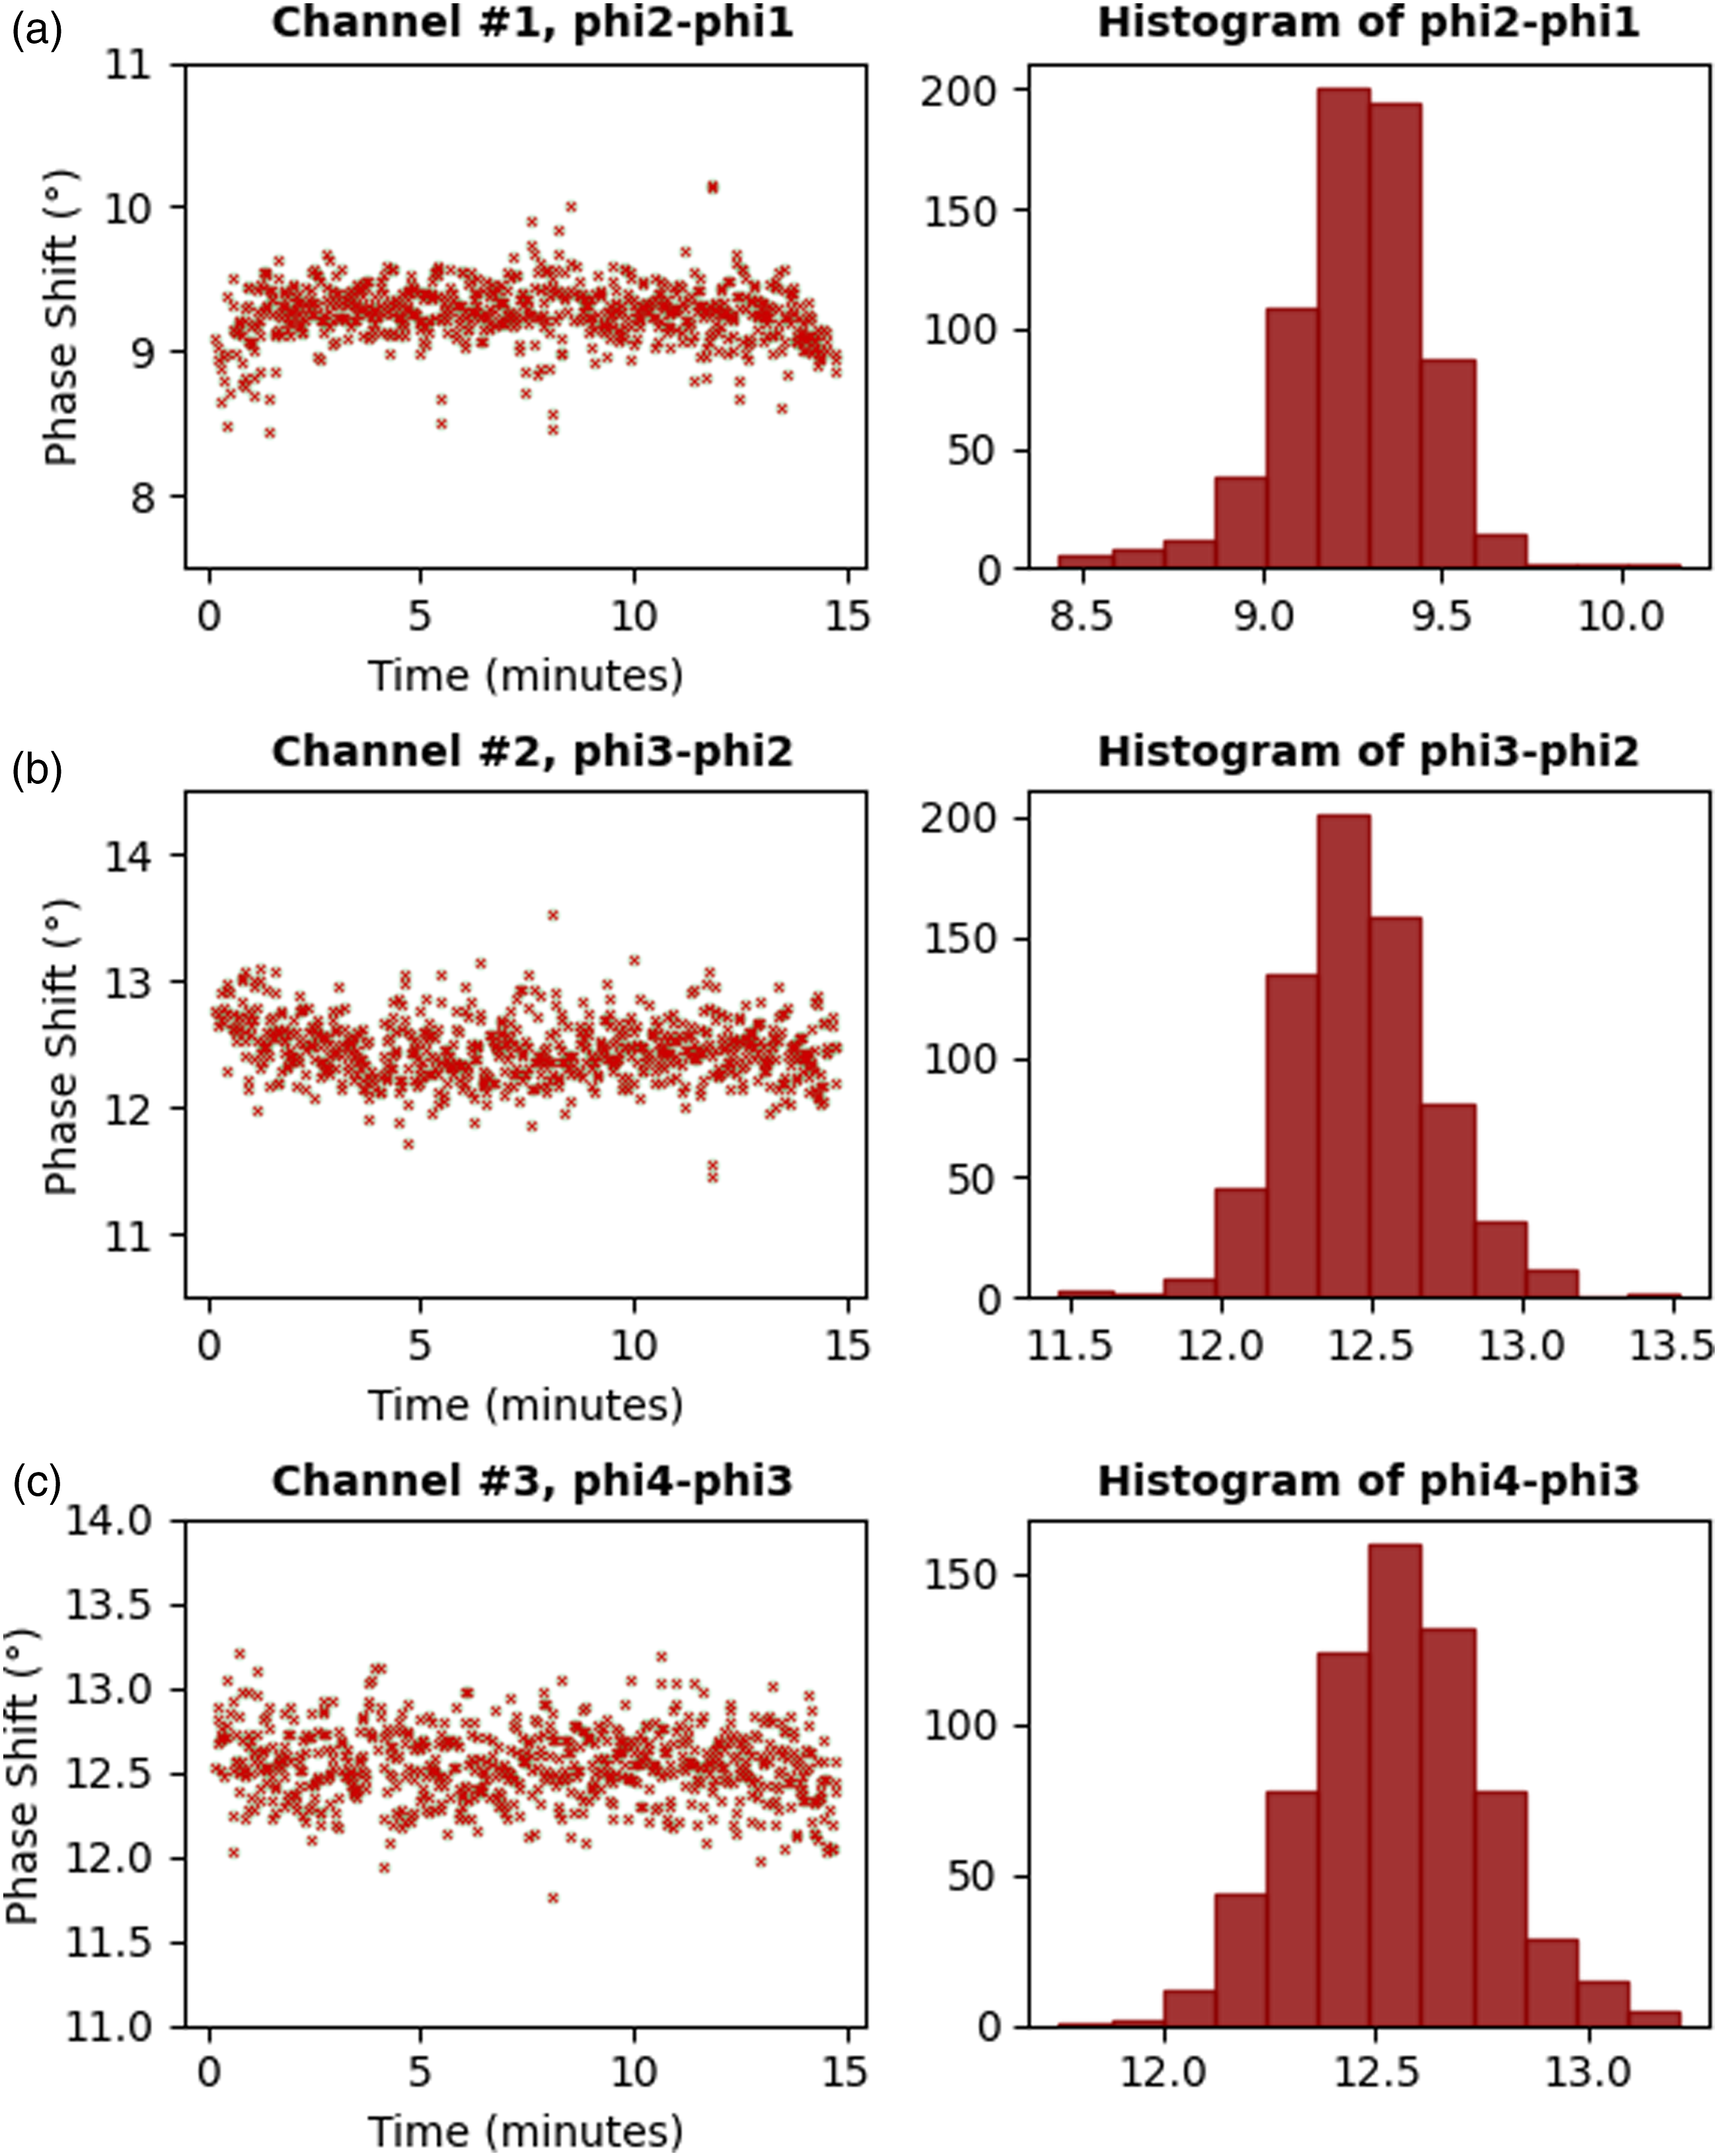
Finally, Figure 9 shows the distribution of measured μa and μ′s over 15 min, with (a) and (b) showing the μa and μ′s for 690 nm lasers respectively, and (c) and (d) showing the μa and μ′s for 830 nm lasers respectively. The distribution of the measured (a) μa and (b) μ′s respectively for 690 nm. The distribution of the measured (c) μa and (d) μ′s respectively for 830 nm.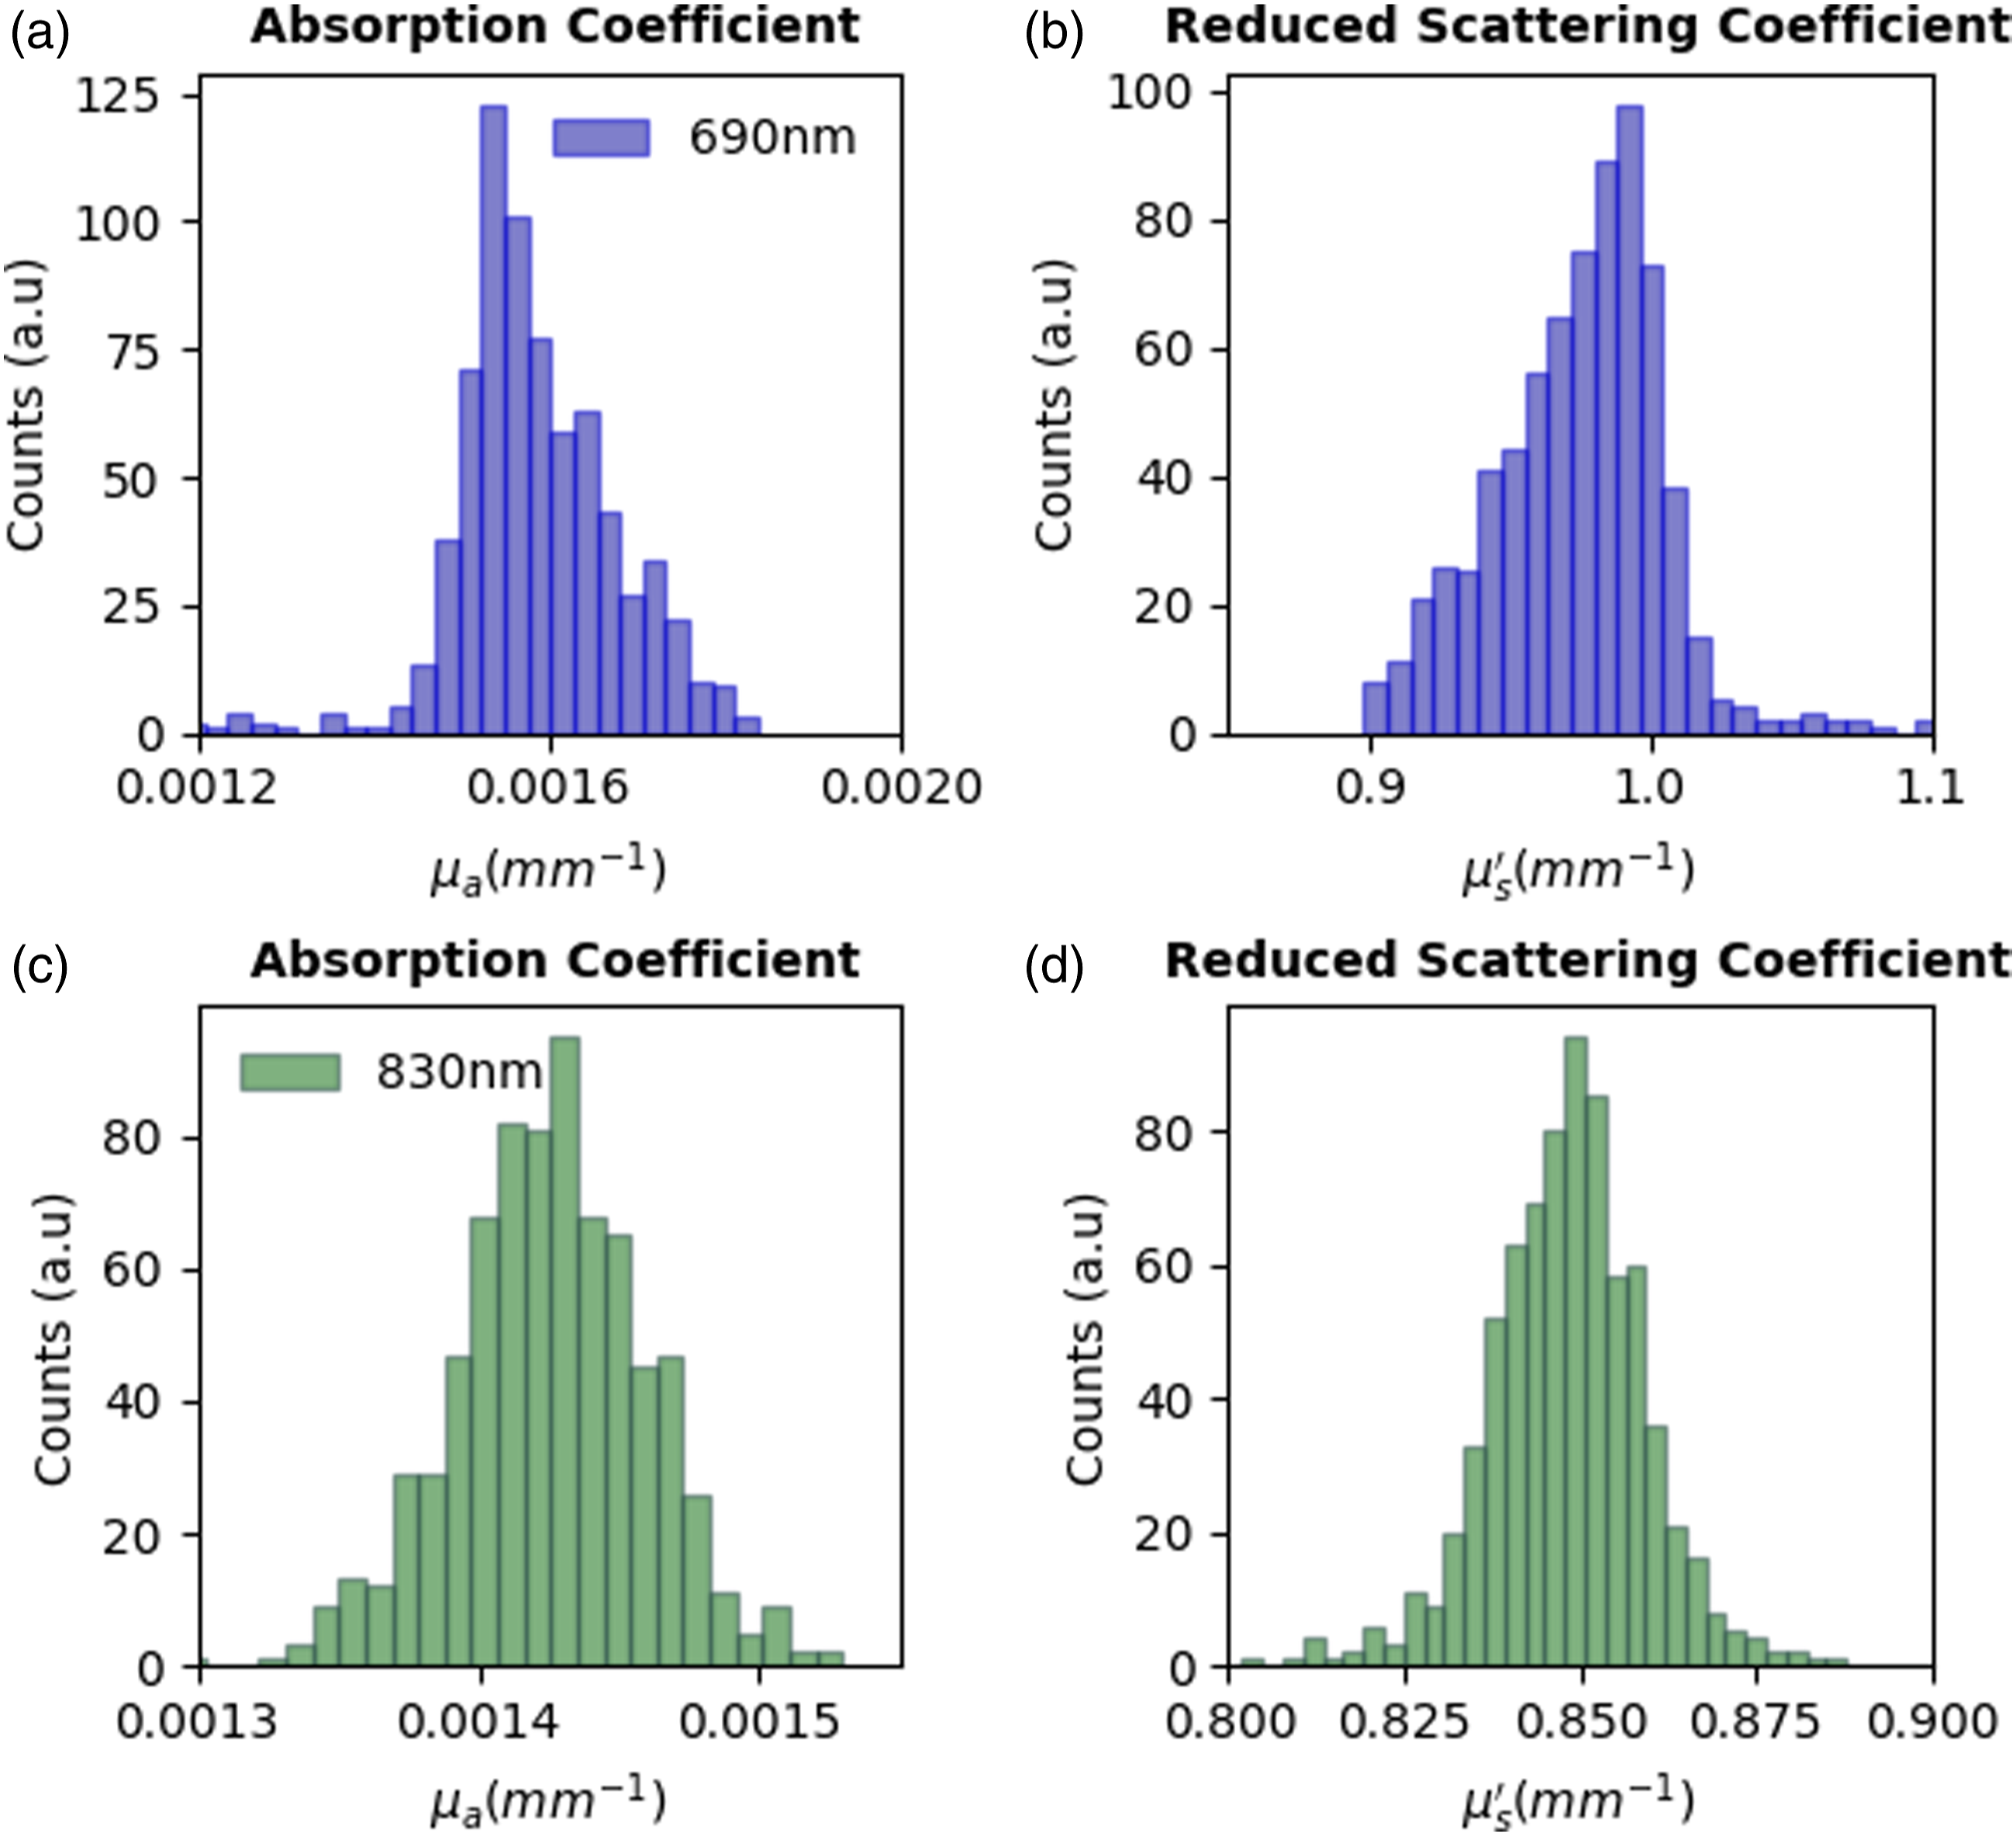
Comparison between ISS model 96208 and this work.
In vivo occlusion tests
After validating the system on solid phantoms, arterial and venous occlusion tests on the human forearm were done. The probe was placed on the brachioradialis muscle on the right forearm and a regular blood pressure cuff was placed just above the elbow. The optical power from each laser diode is set to meet the ANSI Z136.1 laser safety standards. 19 Different pressures were used for the venous and arterial occlusion tests. The procedures were reviewed and approved by Health Sciences Institutional Review Board (HS IRB) at Tufts University.
Venous occlusion tests
In the venous occlusion test, the subject stayed at rest for 30 s, then 60 mmHg pressure was applied for 60 s, after which the pressure was released, additional measurements were taken for another 60 s. A 60 mmHg pressure can cutoff the venous blood flow but have minimum influence on arterial blood flow. As a result, the arterial blood keeps flowing into the forearm, which will result in an increment in both oxy-hemoglobin and total-hemoglobin. In Figure 10, the chromophore concentrations during a venous occlusion test can be seen. The occlusion was marked with the green shaded region, 30–90 s. During the occlusion test, the HbR cannot leave the forearm but the HbO can enter the forearm since the artery is not occluded. As expected, HbO enters the lower arm, resulting in an increase in concentration. The HbT naturally followed these changes and rises during the occlusion test, as expected.
19
After the pressure is released, the HbO leaves the lower arm and the concentrations returned to baseline levels. Venous occlusion test with measured chromophore concentrations.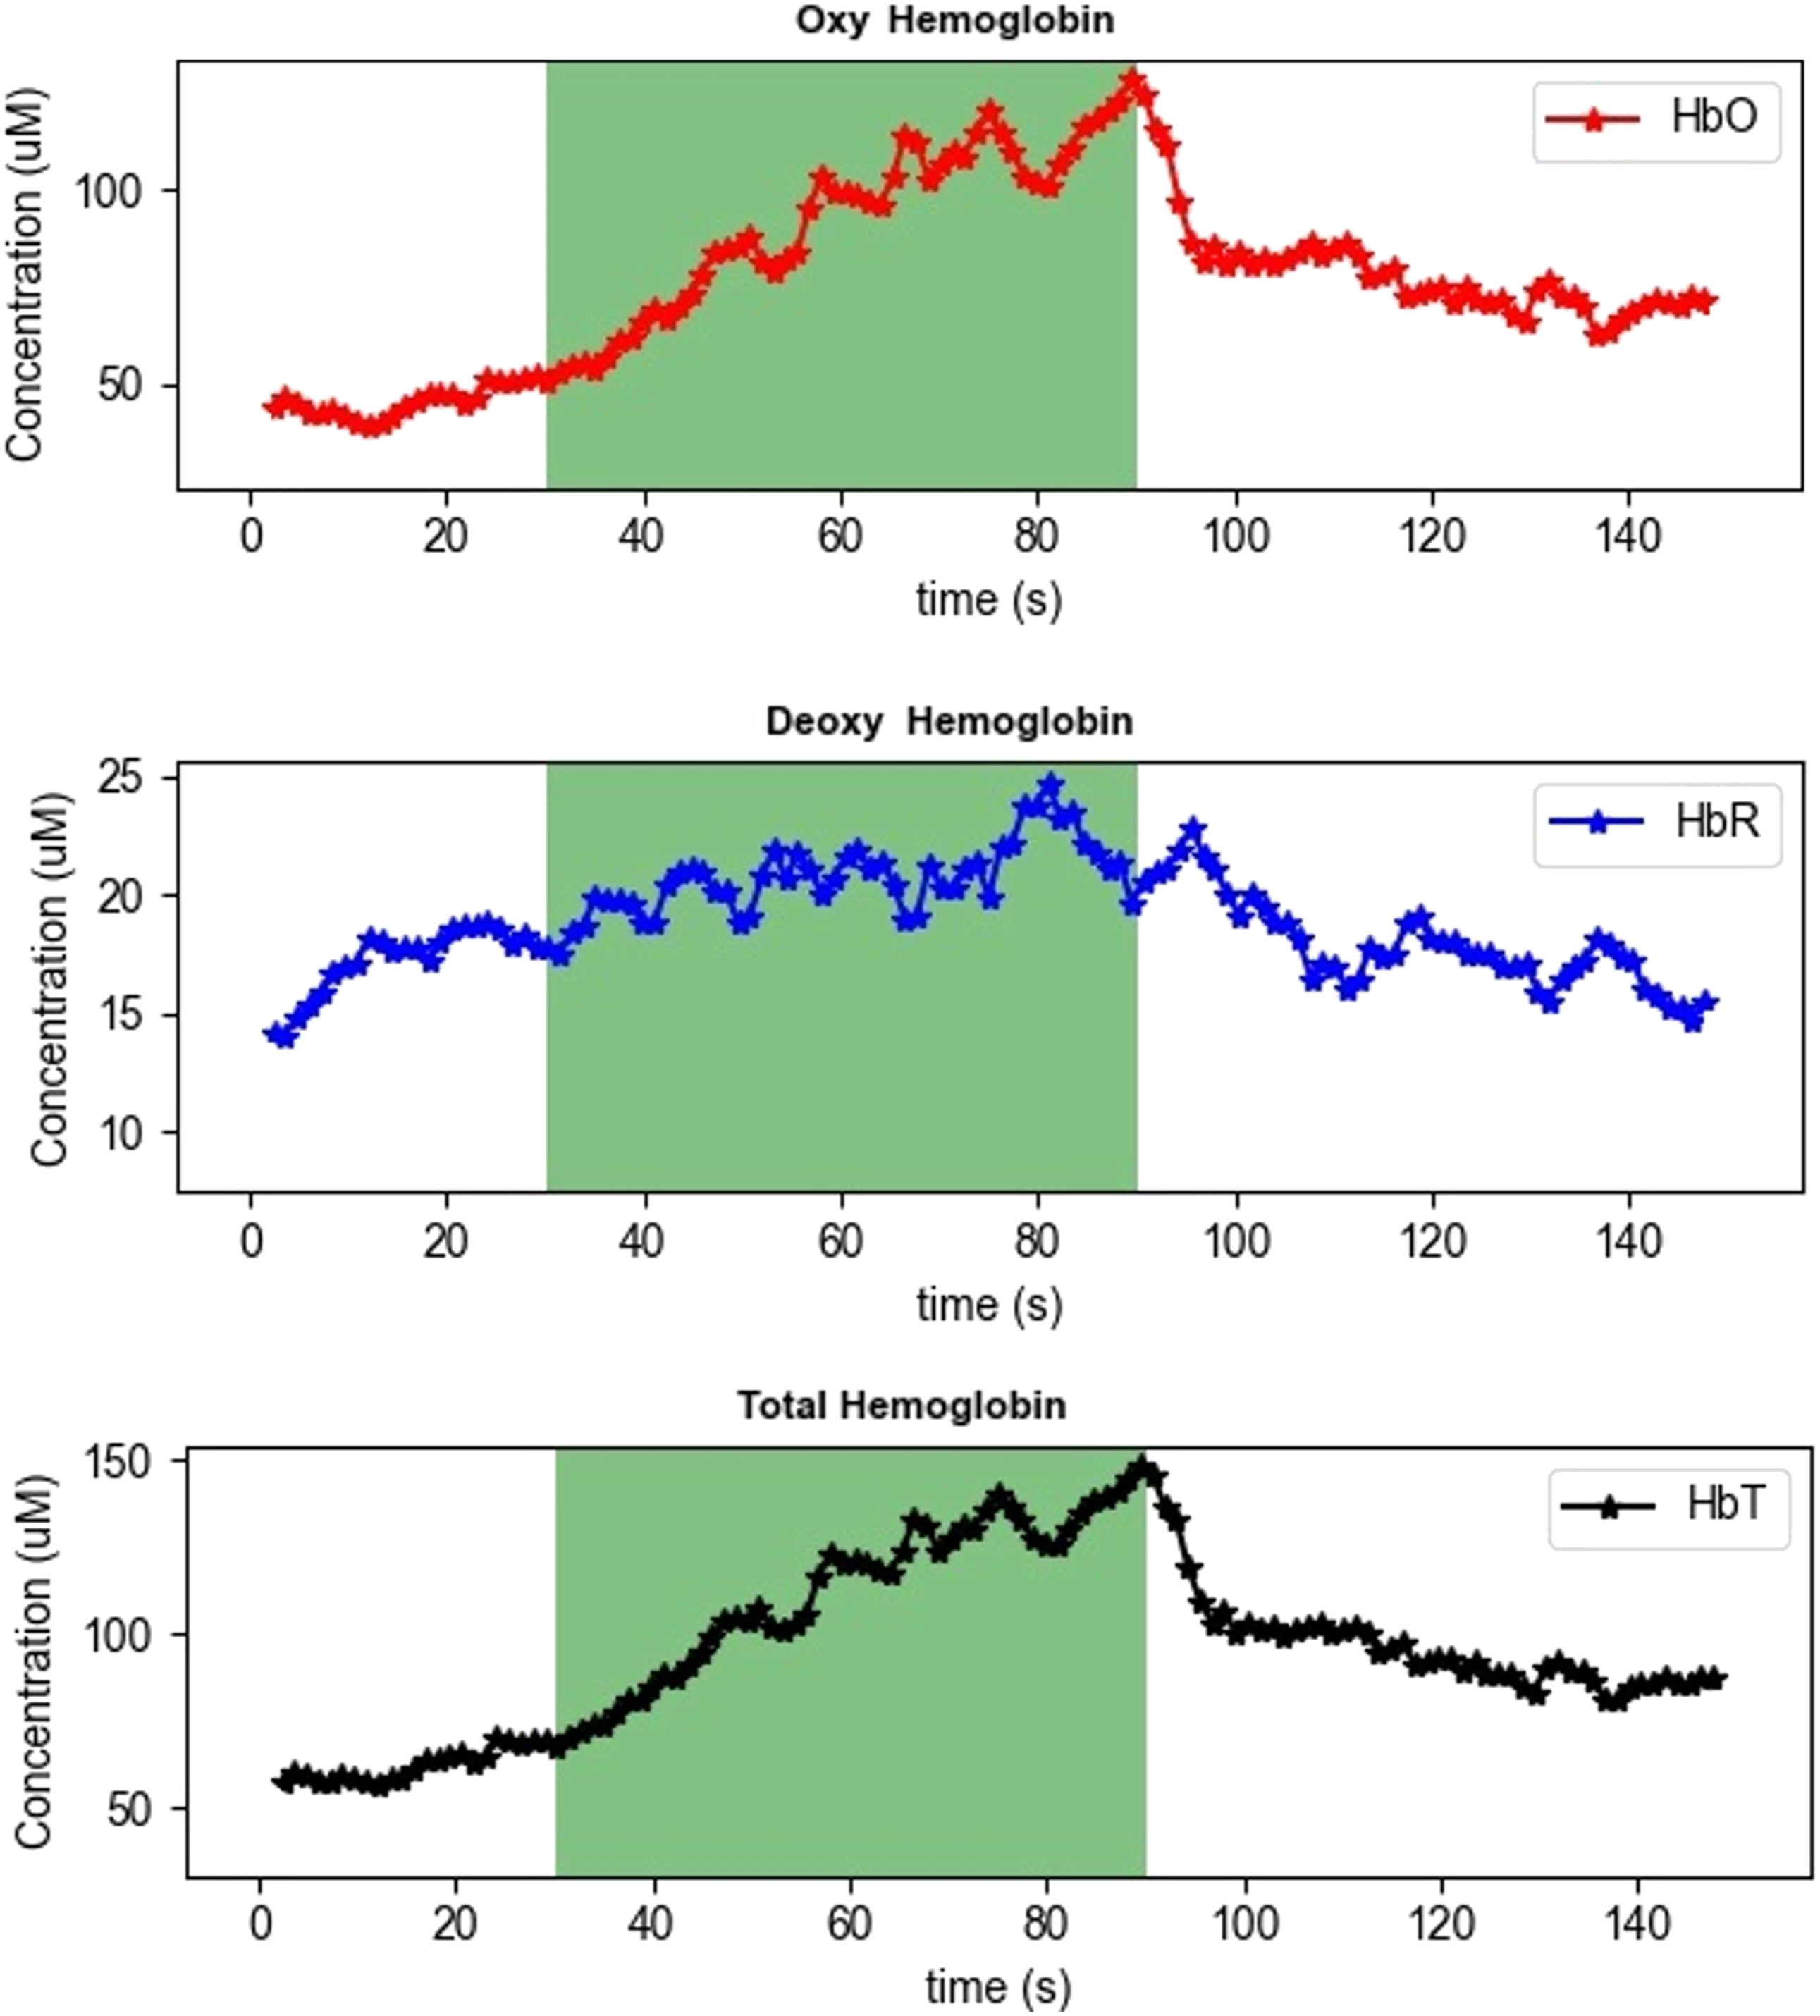
Arterial occlusion tests
In the arterial occlusion test, the procedure was identical except for the pressure. In this experiment, the applied cuff pressure was 200 mmHg. Under this condition both the artery and the vein are occluded. Therefore, the expected behavior is that while the HbR concentration rises, HbO concentration falls during the occlusion, and HbT stays roughly the same. Figure 11 shows an arterial occlusion test. The occlusion is indicated with the green shaded region again, 30–90 s. As expected, when the occlusion starts the HbR increases and HbO decreases roughly the same amount, hence HbT stays the same. After the cuff is released, there is a rush of oxy-hemoglobin because the artery is reopened, therefore we observe an increase in both HbO and HbT. All results are consistent with previously reported data. Arterial occlusion test with measured chromophore concentrations and oxygen saturation.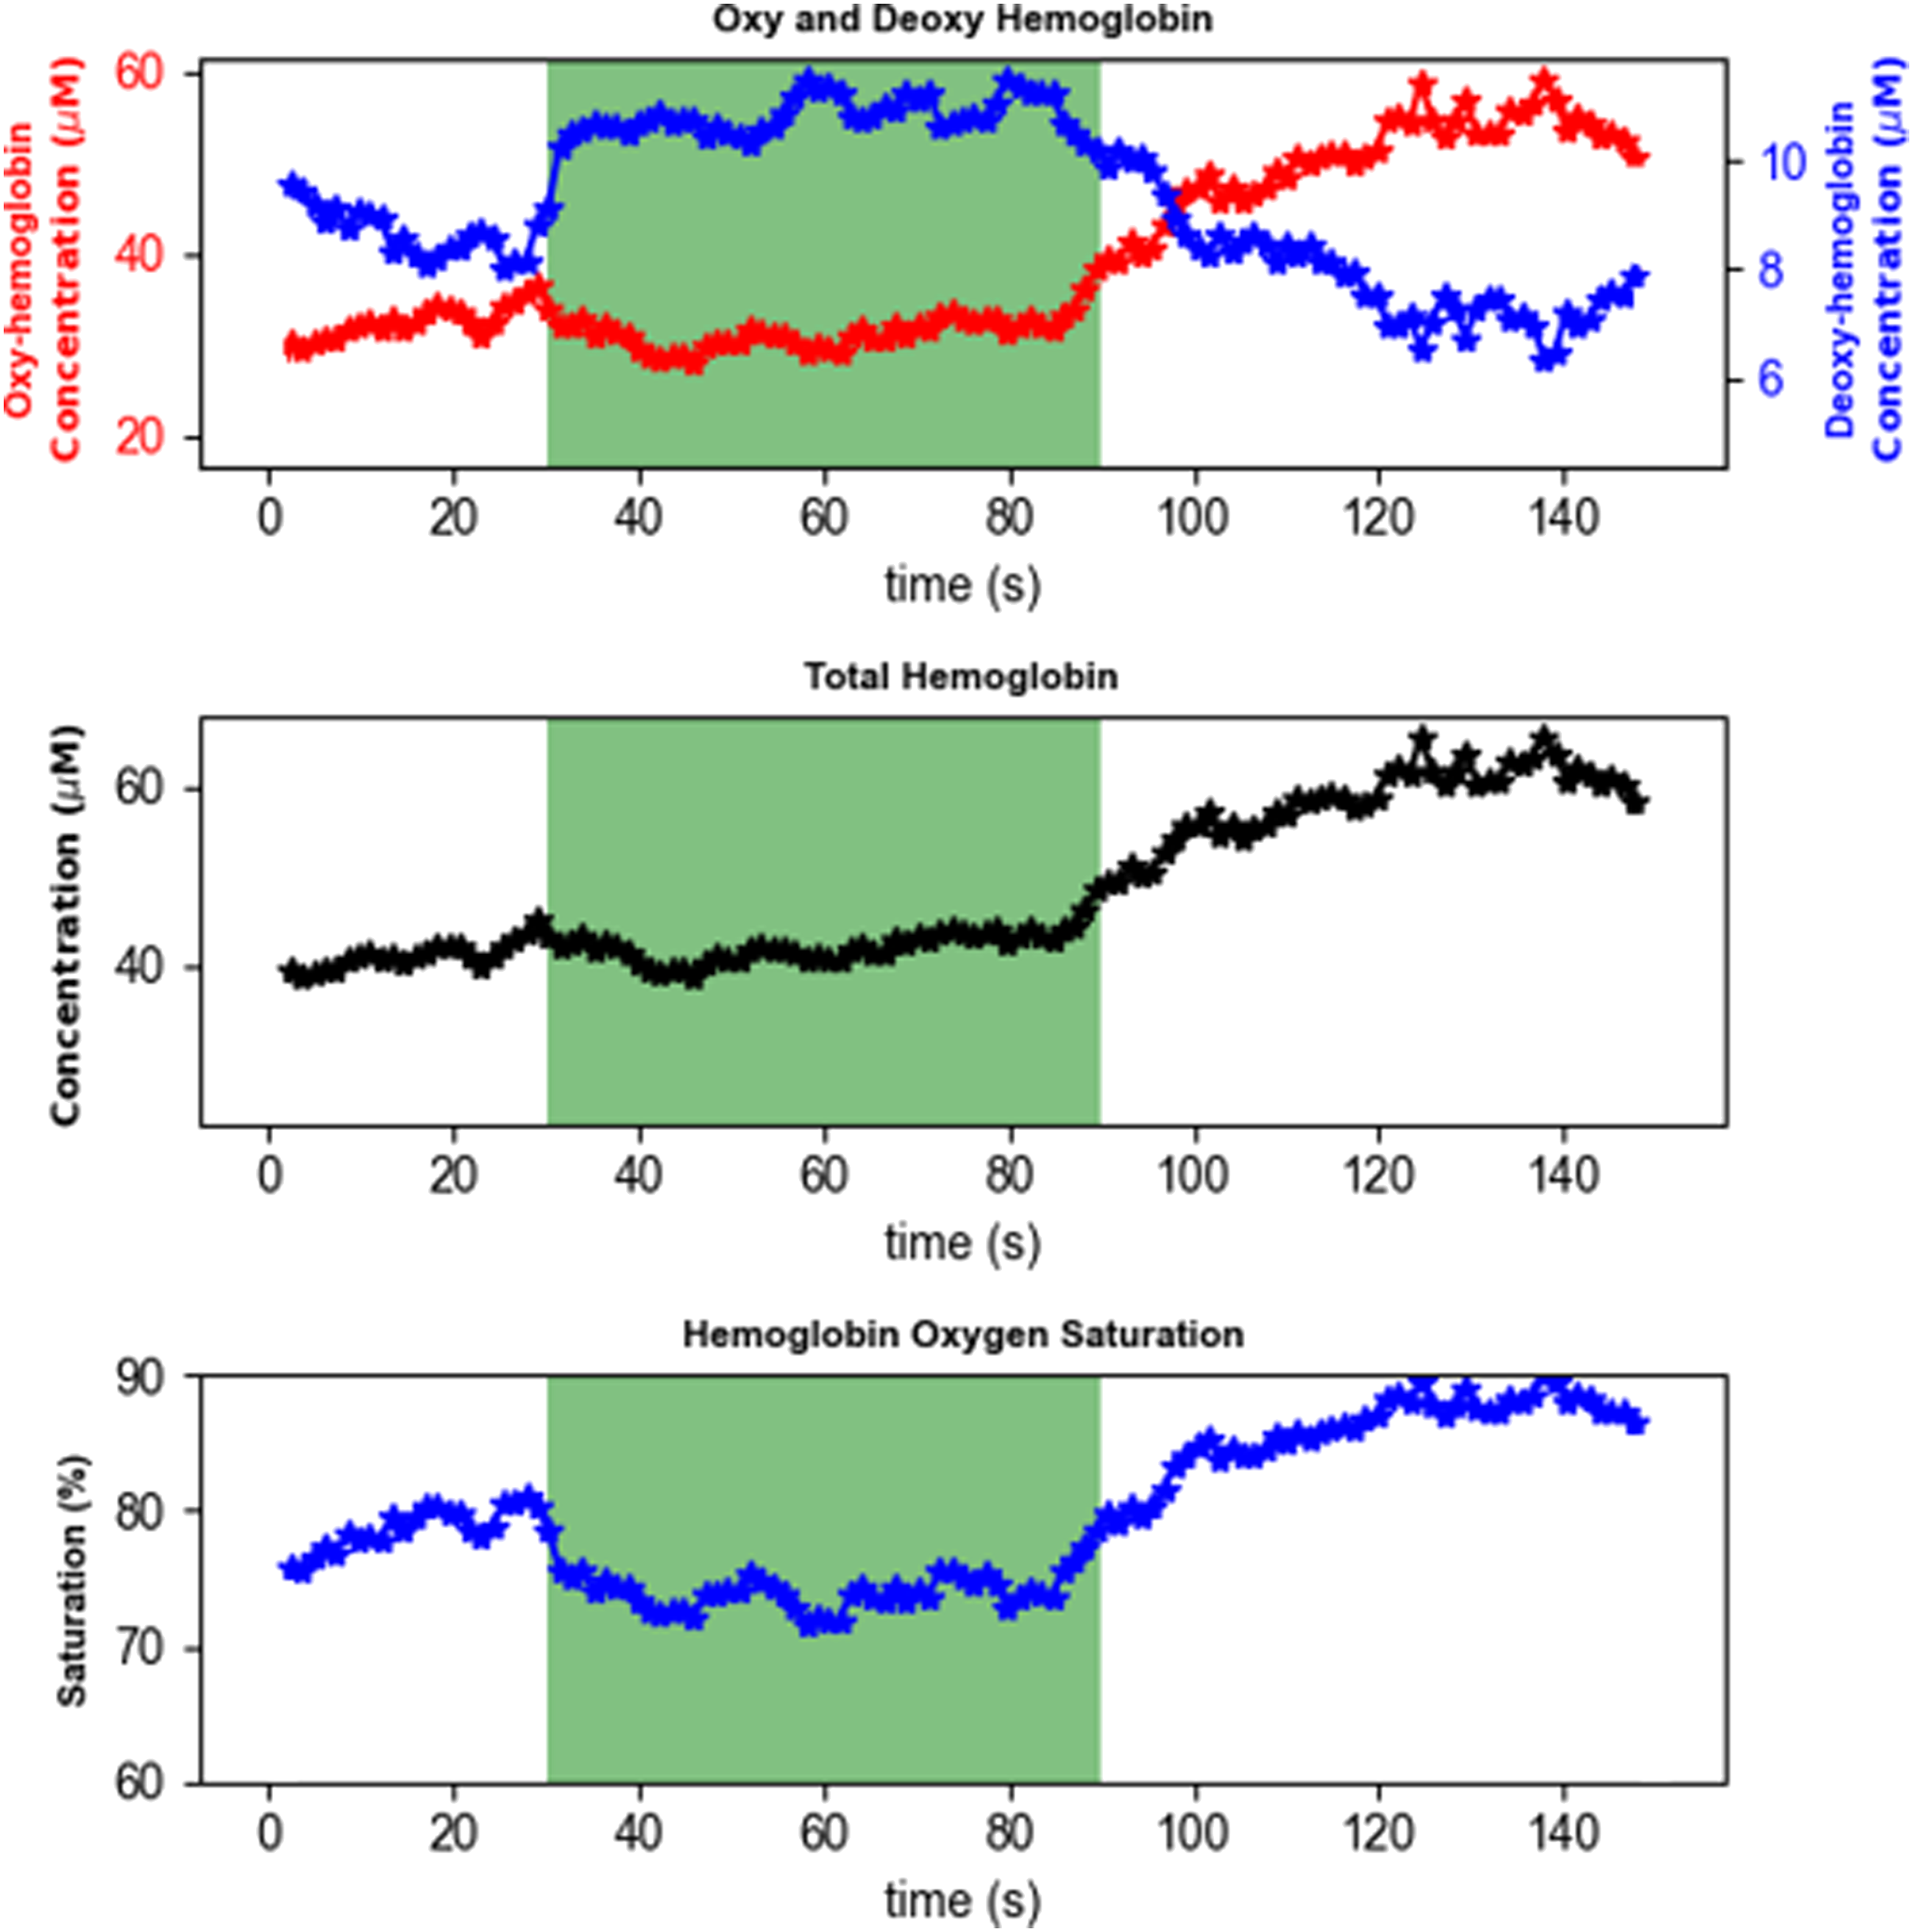
Conclusion
This work presents the design and validation of a miniaturized, dual-wavelength, multi-distance fdNIR spectrometry instrument. The accuracy and the stability of the system was validated using tissue mimicking solid phantoms. Venous and arterial occlusion experiments were performed on brachioradialis muscle of the right forearm. Although the APD has a much lower gain than PMT, a performance comparable to state-of-the-art commercial instruments is achieved with the help of a custom-designed ASIC implemented in a commercial 130 nm semiconductor process. The miniaturization of fdNIR spectrometry instrument enables the monitoring of absolute hemoglobin concentration on a routine basis. The miniaturized instrument will benefit the use of fdNIR in both research and clinic applications.
Footnotes
Acknowledgements
The authors would like to thank Dr S. Fantini, Dr A. Sassaroli and Dr G. Blaney from Tufts University for guidance and assistance with phantom fabrication and optical characterization.
Declaration of conflicting interests
The author(s) declared no potential conflicts of interest with respect to the research, authorship, and/or publication of this article.
Funding
The author(s) disclosed receipt of the following financial support for the research, authorship, and/or publication of this article: This work was in partially funded by a NSF Faculty Early Career Development Award (DBI-0953635), NSF Partnerships for Innovation - Technology Transfer Award (IIP-1919038), and NIH (R01-EB029414).
Ethical approval
This study has been reviewed and approved by Health Sciences Institutional Review Board (HS IRB) at Tufts University.