
Abstract
This study evaluated the wood preservation state of archaeological wood timber based on eigenvalue analysis of the near infrared spectral matrix. Near infrared (NIR) spectra were acquired from archaeological wood with different degrees of decay, thereby showing greatly varying molecular configurations in the cell wall. The set of eigenvalues calculated from the variance-covariance matrix created by the NIR data was treated as the Hamiltonian representing the energy eigenstate of the archaeological wood with different decay levels. This variation has been discussed from the viewpoints of thermodynamics and statistical mechanics. The eigenvalues were widely distributed, showing that the spectral data changes in relation to the degree of decay. The gradual increase in the first eigenvalue (E1), equivalent to the Helmholtz free energy, indicates that the heavily decayed archaeological wood system was likely to change to a more unstable state. The probability corresponding to each energy eigenstate of the heavily degraded wood timber was steeply distributed compared to the slightly degraded groups. The Helmholtz free energy was high, and the Shannon entropy low, in the heavily decayed archaeological wood timber. The variations in Shannon entropy and density matrix with degree of decay reveal structural instability in all of the groups. The results obtained in this study provided concrete data on the relationship between the physical properties (i.e. basic density and/or maximum moisture content) and the degree of wood decay, while the first eigenvalue and/or Shannon entropy obtained from the NIR spectral matrix provides a potential parameter to assess the degree of degradation of archaeological wood timber.
Keywords
Introduction
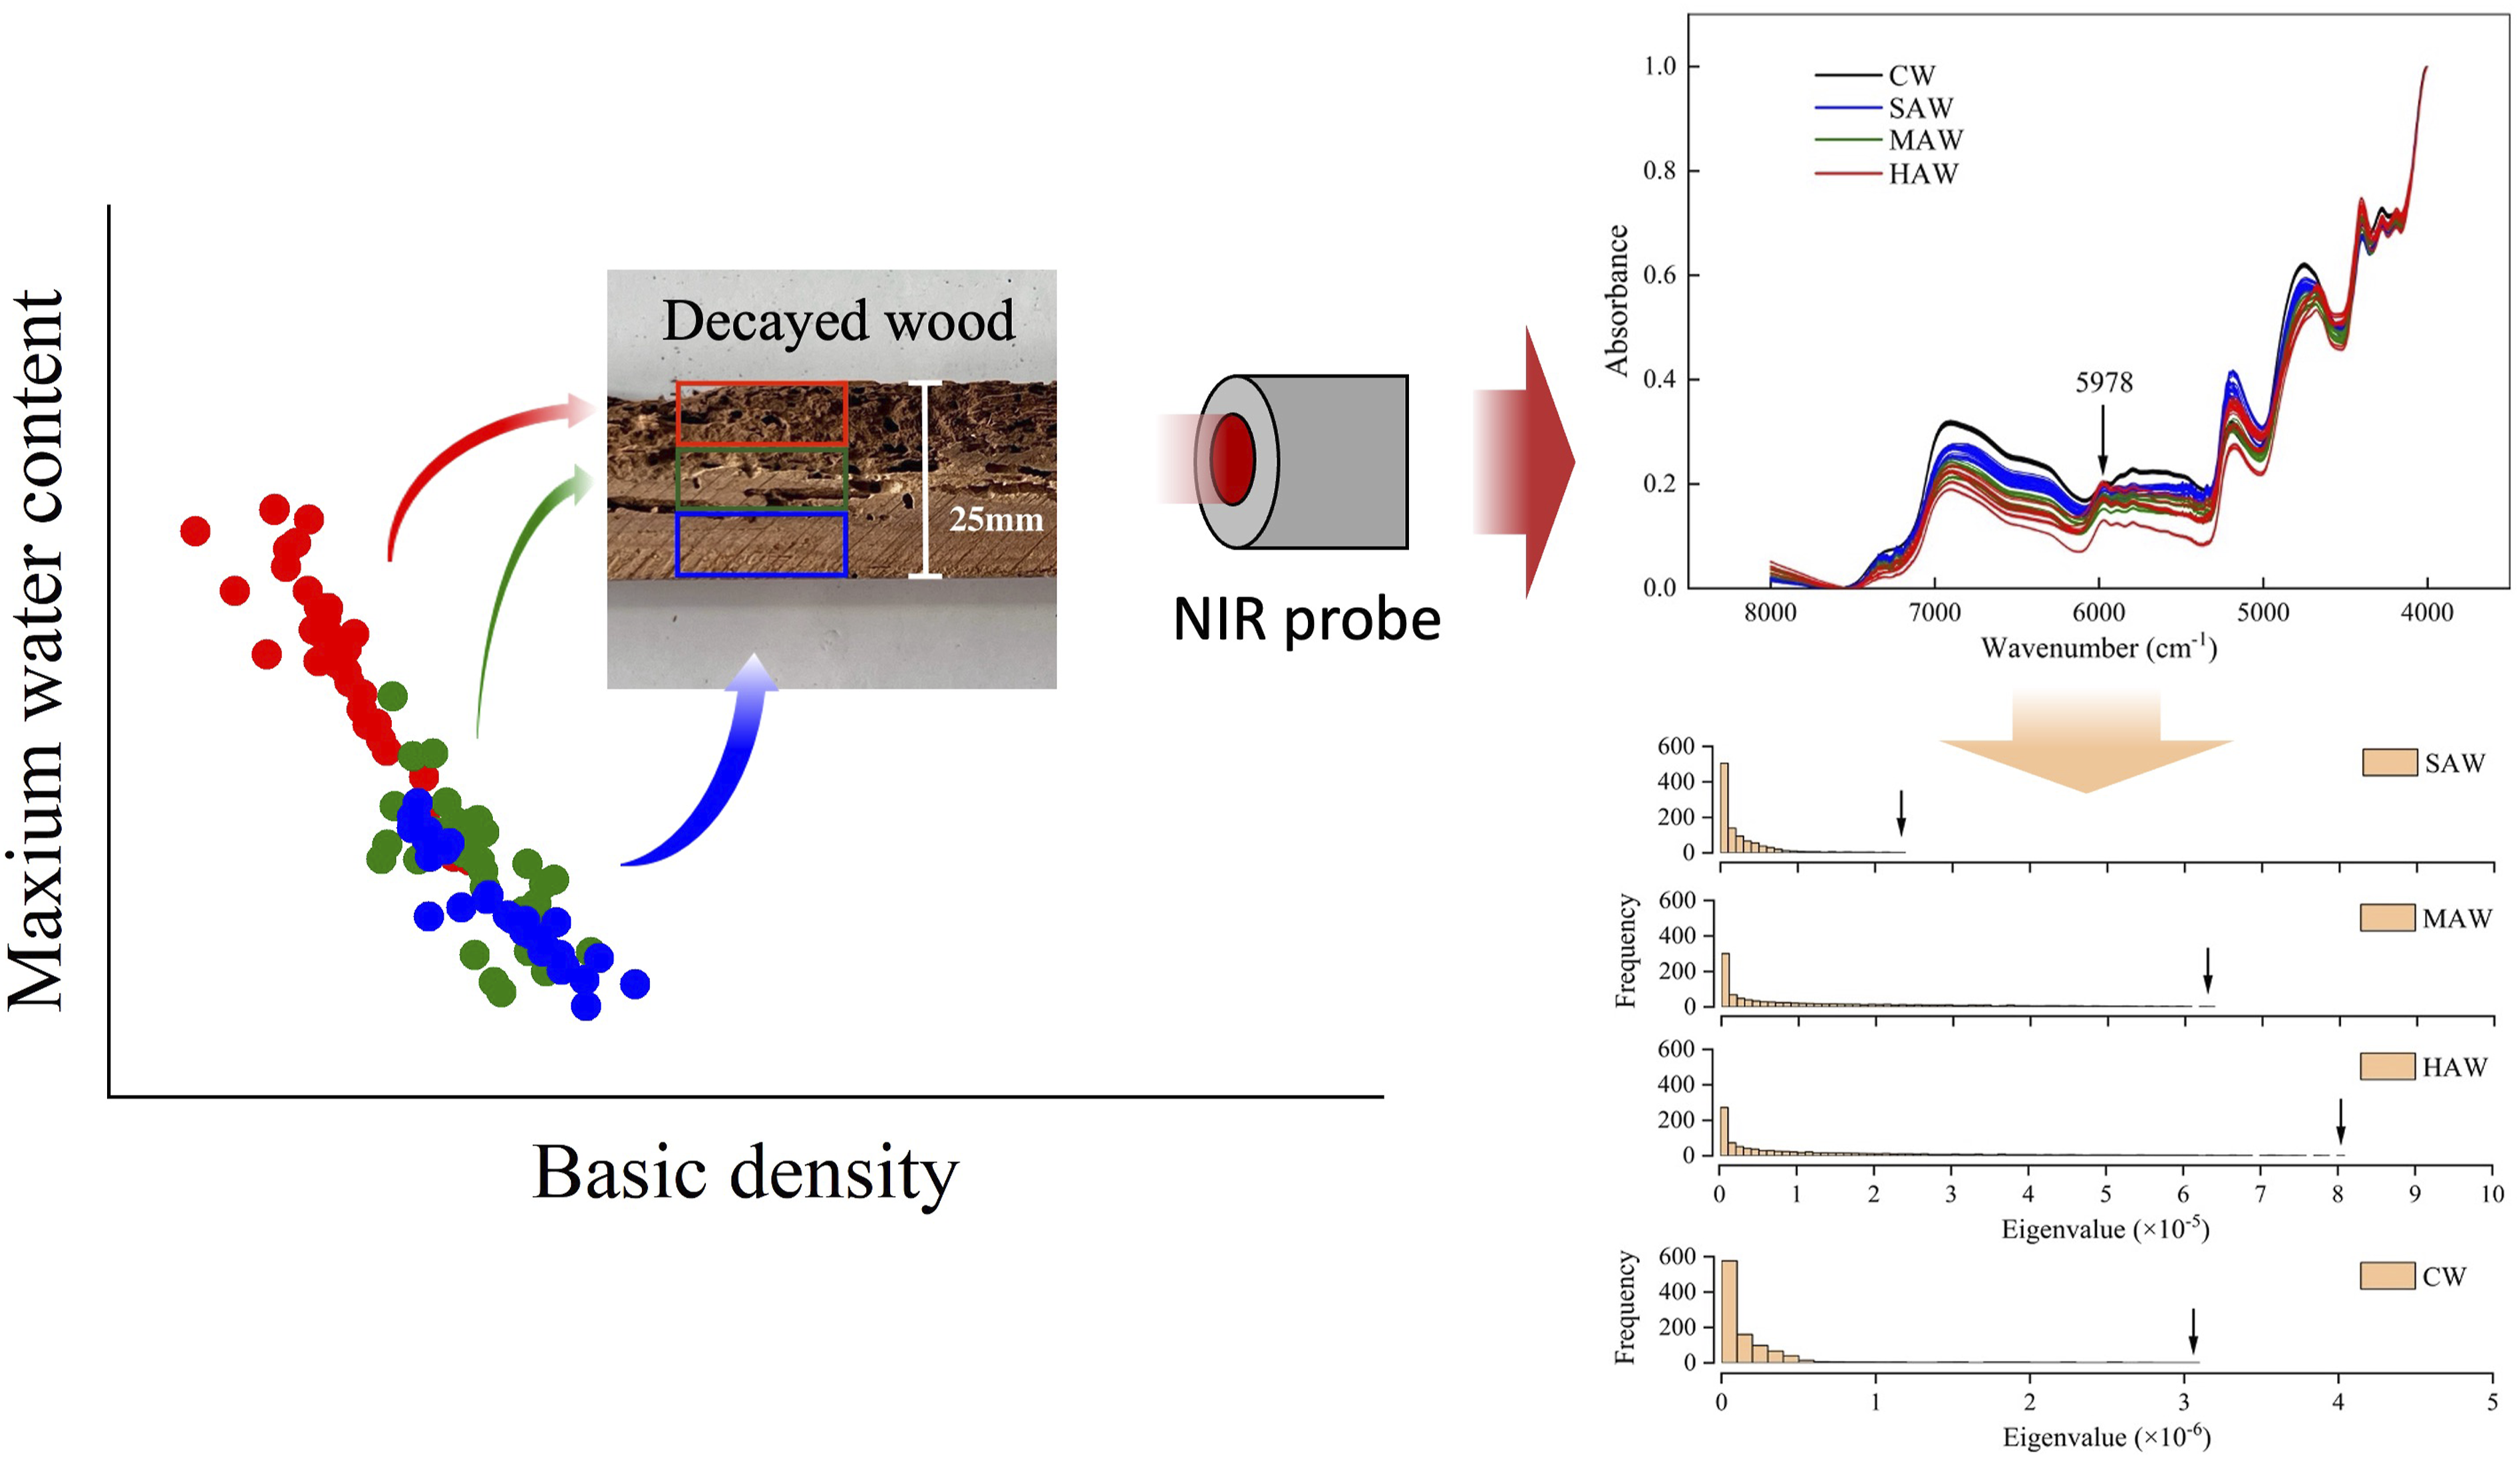
Wood decay is a highly complex biochemical phenomenon, depending on tree species and multiple environmental factors such as light, temperature, humidity, insects and microorganism, and their interactions between wood and multi-combinations of these factors. 1 Evaluation and understanding of the decay status of archaeological wood timber are essential requirements for developing sustainable conservation strategies of wooden cultural heritage. The preservative state of wood is evaluated by investigating variations of wood properties, typically according to basic density (BD), maximum moisture content (MMC), morphological characteristics of wood cell wall and ratios of various properties (chemical and/or mechanical) with respect to recent wood.2,3 As a biopolymer, each characteristic property of wood is relative, thus a given wood property may induce subsequent changes in other properties. 4 For instance, if decayed wood exhibits density, mechanical strength and dimensional stability decrease yet high moisture content (MC), then the cellulose microfibril angle increases in conjunction with changes of chemical constituents. 5 It is thus essential to consider changes in multiple traits inclusively, rather than individually, for a more comprehensive understanding of decayed wood’s properties. In this sense, wood can be characterized by a number of variables X1, X2, …, …, Xn corresponding to various properties such as density, moisture content (MC), mechanical properties, chemical components, and anatomical features. In most previous studies, near infrared spectroscopy technology was exploited to combine with big data information and complex multivariate analysis methods to evaluate wood, forestry products and other organic compounds in qualitative and quantitative aspects, including chemical composition, MC, density, wooden anatomical features, mechanical properties, wood modification, degradation and species classification et al.6,7 Recently, a method based on the distribution of eigenvalues calculated by near infrared spectroscopy was proposed to evaluate the differences of multiple wood characteristics.8–11 In this method, wood is considered to be a physical system with multiple degrees of freedom, and is characterized by numerous variables based on differences in traits (such as latewood and earlywood). The NIR spectra associated with the variation of the properties of wood has been successfully applied to quantitatively and qualitatively evaluate various properties of wood, and can be acquired as multi-dimensional data with a number of spectral variables, namely the absorbance or transmittance values at each wavenumber i. Although the spectral variables {1, …, …, n} do not exhibit a one-to-one correspondence with the wood properties {X1, X2,…, …, Xn }, the NIR spectra contain abundant information by which to interpret the physical state of the wood with multiple degrees of freedom. 12 This is favorable to evaluating the preservation state of the archaeological wood, a multiple factor result. In the present study we examine the variation in archaeological wood timber with different levels of degradation using sets of eigenvalues calculated from the NIR spectral matrix. The set of eigenvalues is analyzed within a statistical mechanics framework, drawing conceptual inspiration from the Hamiltonian formalism 13 to characterize the system’s state distribution. This allows the use of thermodynamic measures such as Shannon entropy and free energy to describe the internal variation and decay state of archaeological wood.
Material and methods
Sample description and preparation
Roof boards (Figure 1(a)) from a historic hall in Beijing, built in 1537 (Ming Dynasty) and mainly repaired in 1873 (Qing Dynasty), were used in this study. The boards’ wood species, as identified in the Beijing Forestry University laboratory traditional light microscopy, is Larix Mill. See Figure S1 for details. These boards are the main structural wooden materials of the hall roof which laid on the rafters and purlins for bearing and dispersing on the roof, while also providing heat preservation and insulation. The roof boards are 165 cm in length, 20 cm in width and 3 cm in thickness (Figure 1(b) and (c)). Toward the interior side they remain intact and on the opposite side insect galleries are visible by the naked eye (Figure 1(c) and (d)). The boards are in the highest position of the hall, where the status of decay cannot easily be monitored on a day-to-day basis. The exterior-facing side which has been in contact with waterproof and heat insulation materials has become dark and wet due to the permeation of precipitation and retention of atmospheric water, making it susceptible to colonies of insects and microbes.
14
Therefore, in this study the archaeological wood timber of the roof boards was caharacterized visually into three groups according to decay status: slightly decayed (SAW), moderately decayed (MAW), and heavily decayed wood (HAW), in which, wood remained intact in appearance for the SAW interior side of the roof board, while an extensive network of galleries was apparently observed in HAW toward the exterior side of the roof board, with the transition zone between both being classified as MAW, respectively (Figure 1(c)–(e)). It was very difficult to form the brittle and fragile MAW and HAW samples into regular shapes (Figure 1(e)). In addition, contemporary Larix wood (CW) with 52-years growth was used as the control for subsequent chemical constituent and NIR spectral analyses. Location of samples obtained and appearance: (a) Roof boards on site; (b) appearance of roof boards; (c) radial surface of roof boards; (d) cross-section of the samples; (e) samples classified by visual degree of decayed archaeological wood timber. SAW: slightly decayed archaeological wood; MAW: moderately decayed archaeological wood; HAW: heavily decayed archaeological wood.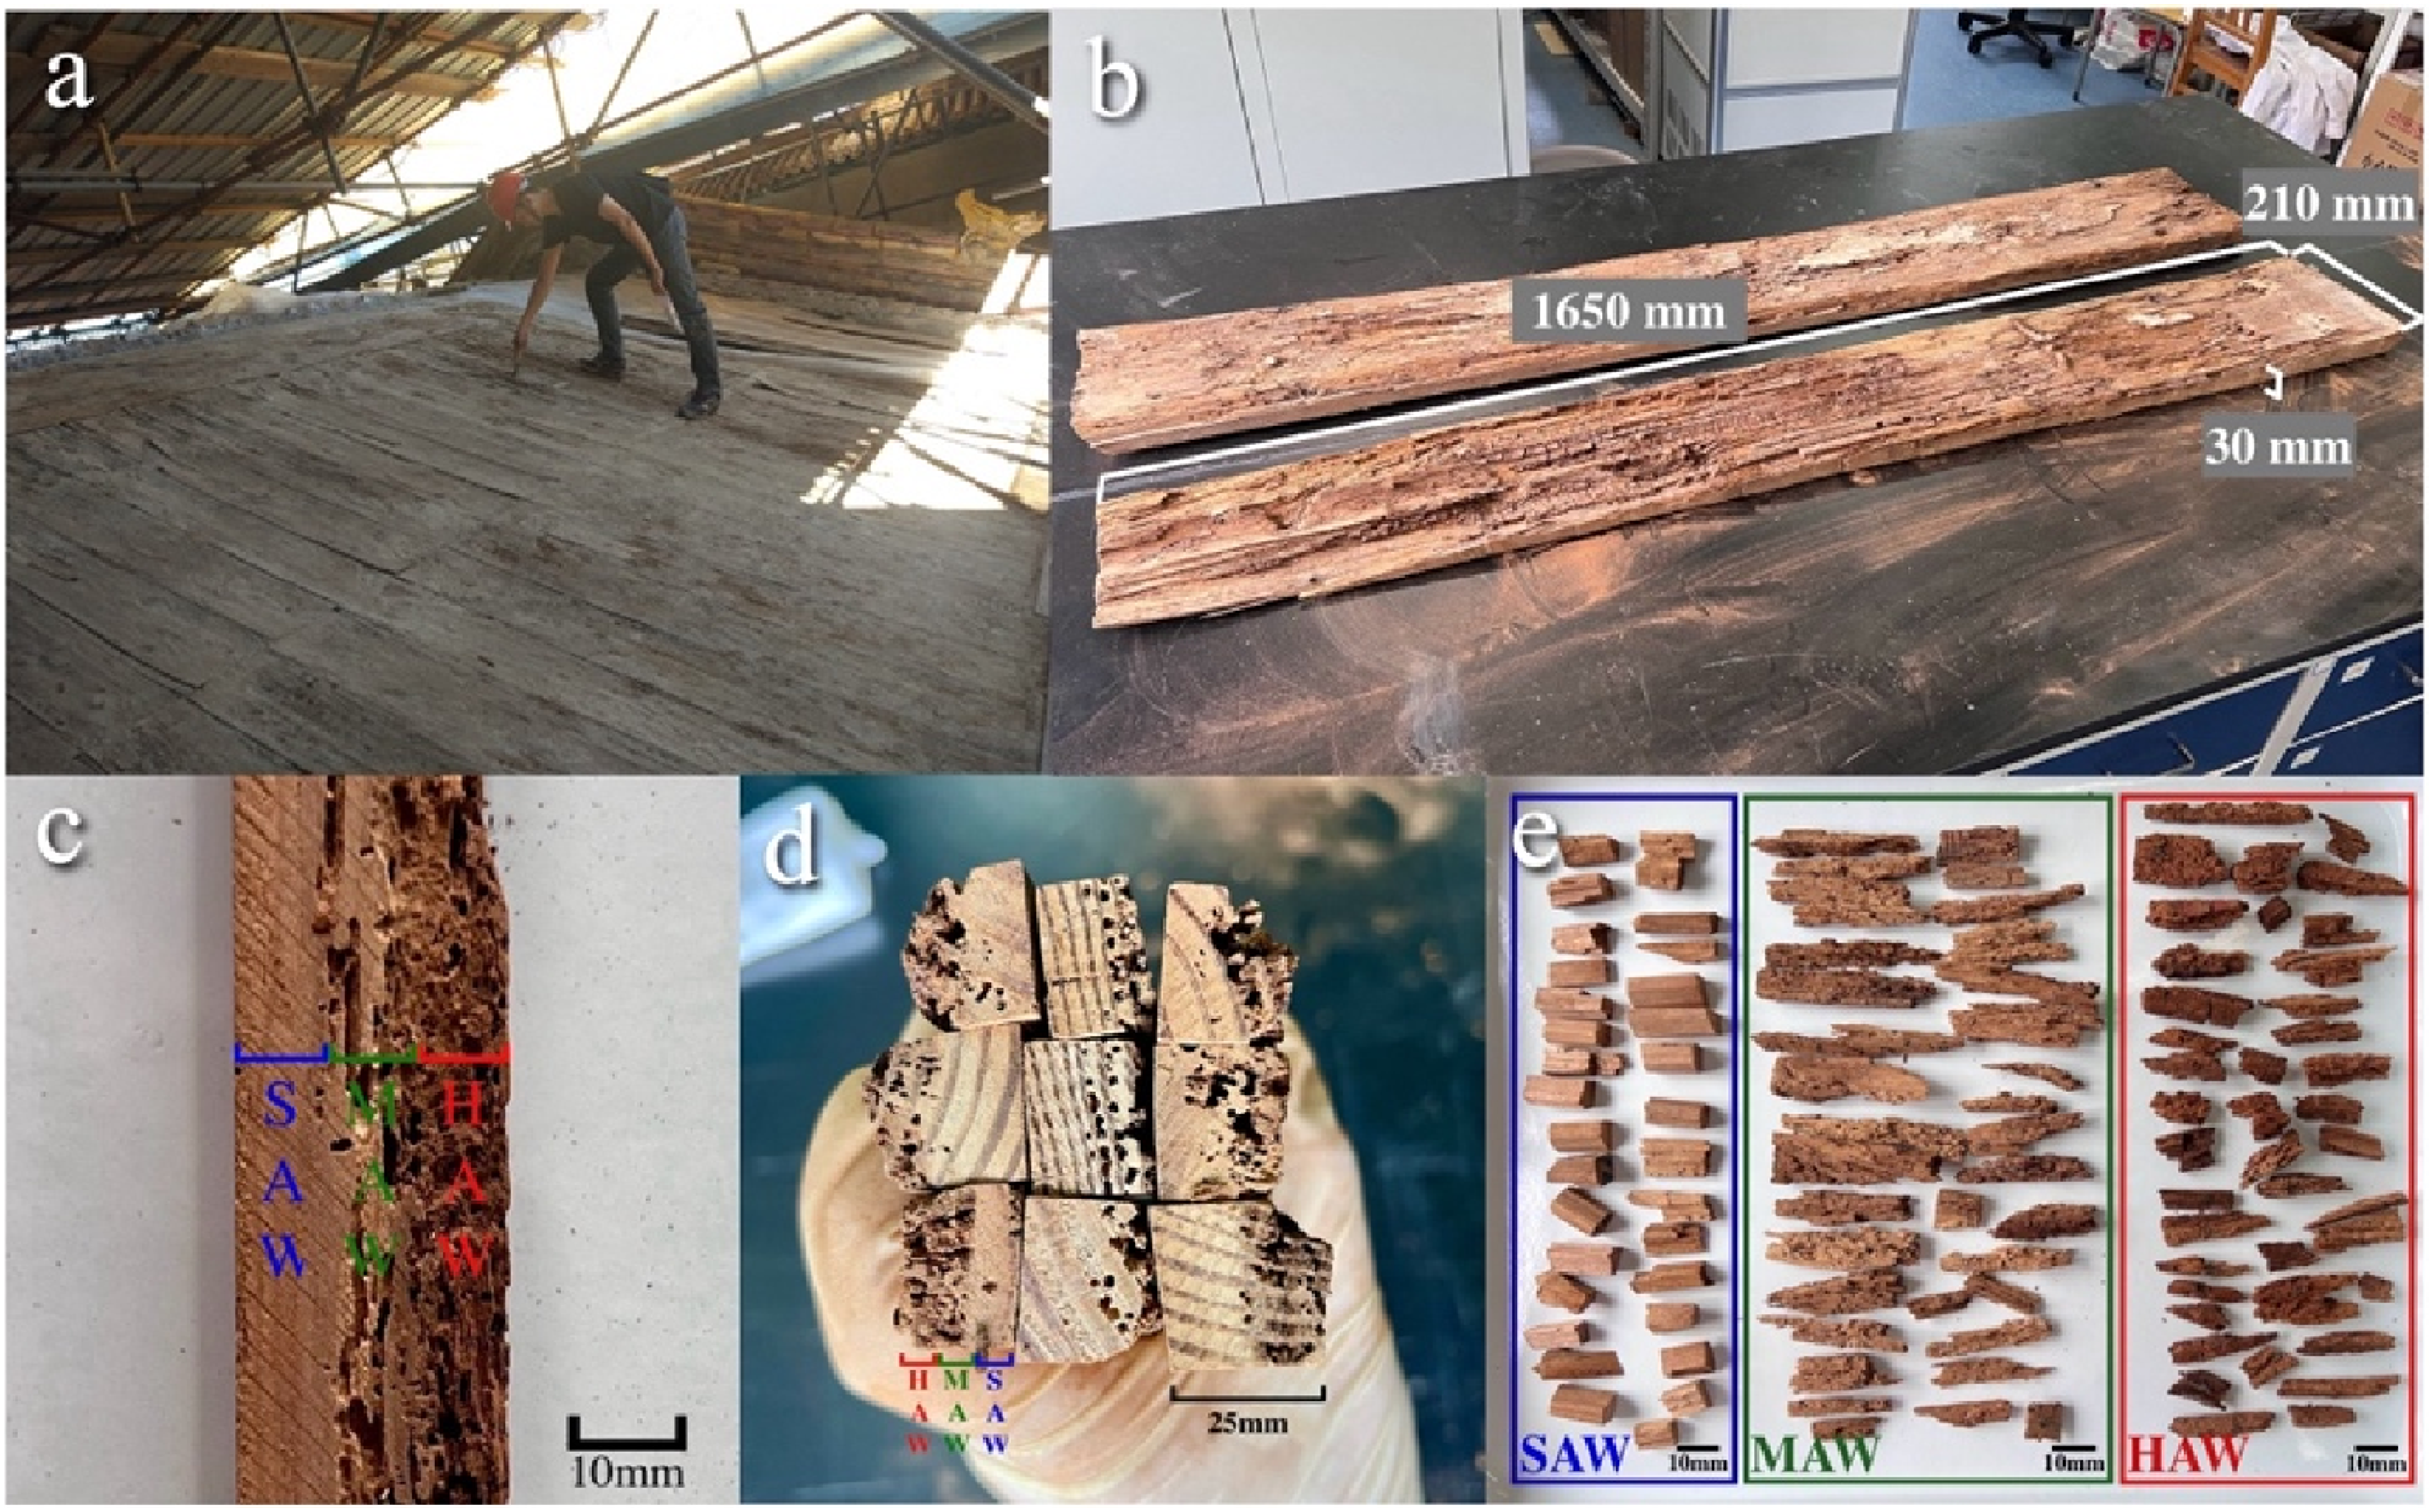
Chemical analyses
All samples were ground into a fine powder (sieved to 60–80 mesh) and then oven-dried for quantitative chemical composition analysis following the national standards of China GB/T35820-2018. 15 At first, the samples were extracted using acetone. Then a mixed solution of sodium hypochlorite and acetic acid was prepared to determine the lignin content in the wood. After that the content levels of α-cellulose and hemicellulose were determined using a 5% potassium hydroxide solution. This study’s quantitative chemical component analyses were conducted using three duplicates for each sample and the results were averaged.
Basic density and maximum moisture content measurements
As the most fundamental physical indices for evaluating the degree of archaeological wood timber decay, the BD and MMC values could not be accurately determined by conventional measurement methods designed for regular-shaped wood blocks due to the irregular shapes of the samples. For this reason, the drainage method was used in this study. All the samples (Figure 1(e)) were dried in an oven at 80°C, then the three to five samples were weighed every 4 h until their weights remained unchanged. Next, the dried samples were placed in a desiccator to cool to room temperature and weighed to obtain oven-dry mass M0 using an electronic balance with an accuracy of 0.001 g. Thereafter, the samples were submerged in a beaker filled with water under reduced pressure and left for 7 days until reaching a fully water-saturated state. After saturation, the excess water on the sample surface was gently wiped off with absorbent paper, and the samples were weighed once again to obtain the maximum water saturation mass Mmax, which represents the mass of the samples at full water saturation. After the mass and dimensions of the saturated samples were measured, the basic density ρ (equation (1)) and MMC of W% (equation (2)) were calculated individually for each sample as follows: Relationship between BD and MMC of samples with different decay levels. The classification information of wood samples is shown in Figure 1.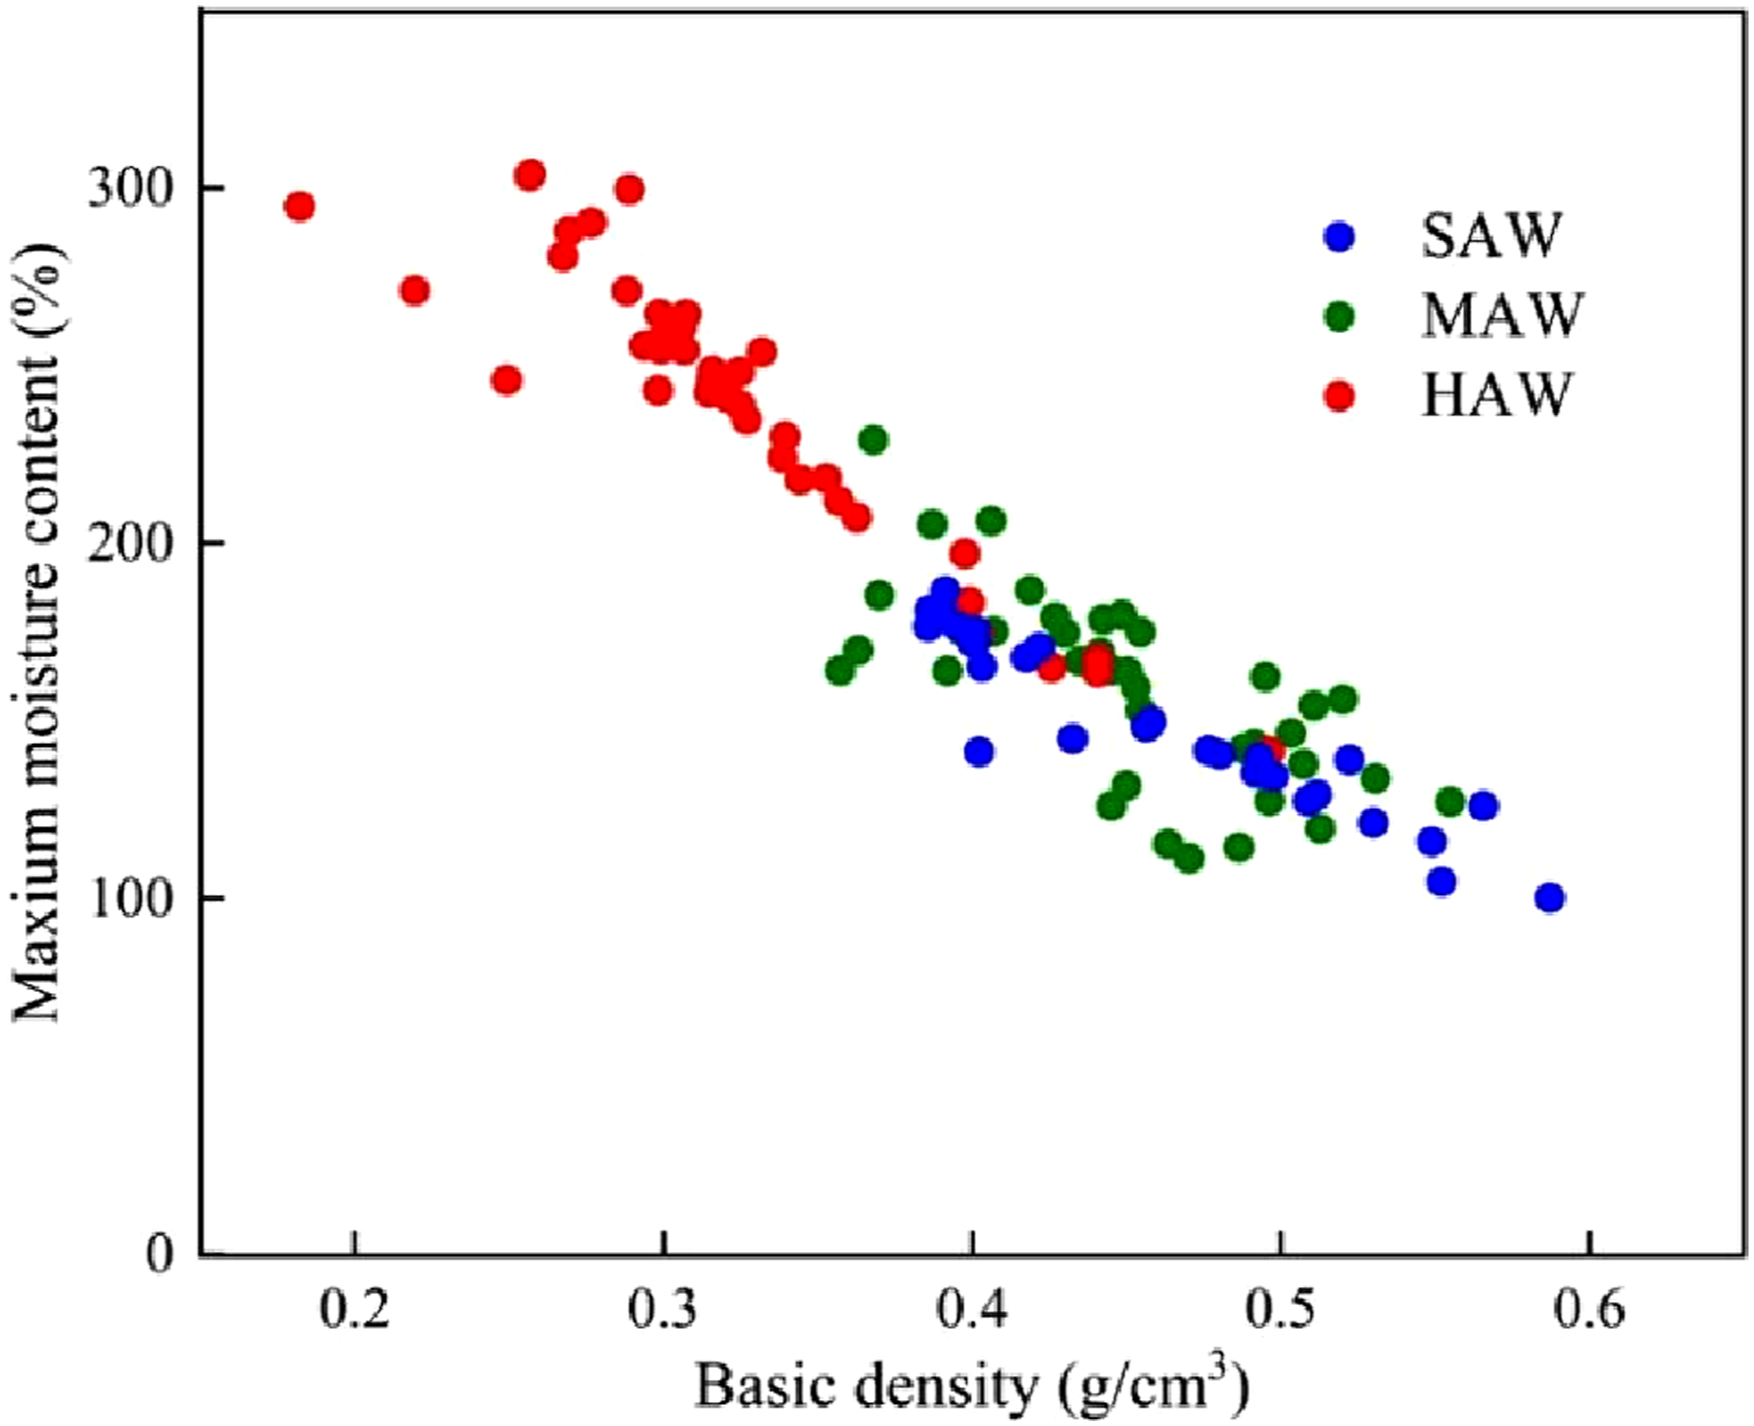


Near infrared spectroscopy measurement
After oven-drying and being passed through a 60–80 mesh sieve, the milled powder of each sample was used to acquire NIR spectra using a FT-NIR Multi Purpose Analyzer (Bruker Optik GmbH, Ettlingen, Germany) running OPUS 7.2 software. The spectra were obtained in diffuse reflectance scanning mode, with a spectral range of 10,000–4000 cm−1 and a resolution of 4 cm−1, so that more data points could be acquired for subsequent spectral matrix construction. A total of 32 scans per spectrum were co-added. A total of 80 data sets were collected, with 20 data sets from 20 samples in each sample group. The spectral data analysis focused on the 8000–4000 cm−1 wavenumber range, which is the overtone and combination vibration modes of the H-containing group occurring in NIR spectra. The raw spectra were normalized with the max-min values method before the spectral data for further analysis. A total of 1038 data points were used as spectral variables.
NIR matrix construction and data analysis
We applied the bootstrap resampling method for data simulation to construct the variance-covariance matrix, with the details as follows: The absorbance values for each wavenumber were assumed to conform to the empirical distribution of the measured data, and the average of the bootstrap samples was obtained (1000 times) using bootstrap repetitions in Python v.2.1 (partial code constructed using the NIR data to be a variance-covariance matrix can be found in the in Figure S3).17,18 A spectral matrix with 1000 rows and 1038 columns was obtained for each sample group. The variance-covariance matrix C calculated from the spectral matrix A (C = ATA) for different levels of decayed archaeological wood timber was subjected to an eigenvalue decomposition, expressed as follows:


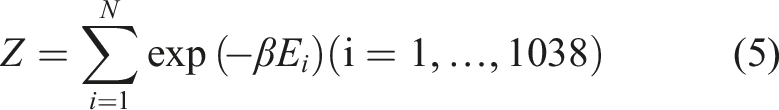
Once H(u) = {E1, E2, …, E1038} is defined using equation (4), the distribution function Z can be calculated as follows:
Results
Chemical analyses
Results of the chemical component analysis (%).
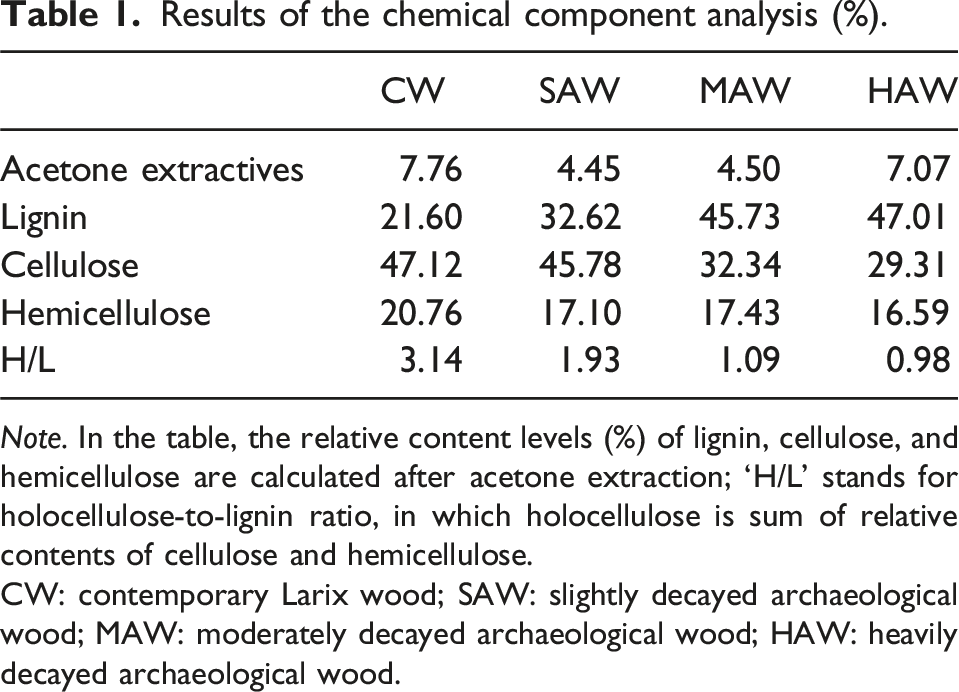
Note. In the table, the relative content levels (%) of lignin, cellulose, and hemicellulose are calculated after acetone extraction; ‘H/L’ stands for holocellulose-to-lignin ratio, in which holocellulose is sum of relative contents of cellulose and hemicellulose.
CW: contemporary Larix wood; SAW: slightly decayed archaeological wood; MAW: moderately decayed archaeological wood; HAW: heavily decayed archaeological wood.
BD and MMC
The relationships between BD and MMC of decayed archaeological wood timbers are shown in Figure 2. A close linear relationship was found between BDs and MMCs with increasing degree of decay. Basic density as a fundamental parameter of archaeological wood is closely related to mechanical properties, and is intensively used in evaluating the wood decay degree. In this study, the respective BD values for the three sample groups were the following ranges: 0.18–0.50 g/cm3 for HAW, 0.34–0.54 g/cm3 for MAW, and 0.38–0.58 g/cm3 for SAW. Notably, the maximum BD values of archaeological wood were around three times the lowest ones for each group with a wide distributing range, indicating it was not relevant to take average values. Changes in BD values for archaeological wood are usually closely related to decomposition of wood cell wall by decay, which also affects its MMCs. A similar tendency with BD values was found in MMC values of the different decay levels, which is another fundamental parameter for being widely used accessing the decay extent of archaeological wood. The MMC values for the HAW group reached around 300%, indicating that many voids were formed inside the heavily decayed samples, equivalent to the Class 2 as proposed by Macchioni et al., who clarified the decay degree of archaeological wood by MMC into five classes. 24 The BD and MMC values are distributed in a wide range due to large individual differences among the archaeological wood samples. For instance, the BD and MMC values of the MAW and SAW samples show smaller differences, suggesting that the two groups are similar in degree of decay if determined by BD or MMC values (Figure 2). Therefore, we cannot quantify the difference of wood decay in terms of BD and MMC values, as discussed in the following section.
Variation of NIR spectra with decay degree
The respective variations of original and normalized NIR spectra for different levels of decayed archaeological wood timbers and contemporary wood are shown in Figures S2 and 3. The absorbance intensities of NIR spectra decreased with wood decay degree (Figure S2), indicating changes in the archaeological wood’s chemical components. All samples showed similar tendencies of spectral variation due to the NIR overlap, and the absorption intensity showed characteristic changes at specific bands (7200–6100 cm−1), which is the first overtone of hydroxyl group stretching from wood cellulose, showing remarkable cellulose decomposition. However, the NIR intensity increased at around 5978 cm−1, which is assigned to lignin in wood.
25
The observation agreed well with the common trend of wood degradation, namely the relative contents of polysaccharides decrease while those of lignin increase.
26
In this study, however, our objective was to examine spectral variations from a statistical mechanics perspective, considering the spectrum as a holistic reflection of the wood system, rather than decomposing it into individual wavenumber variables. Normalized NIR spectra of samples with different decay levels. The classification information of wood samples is shown in Table 1.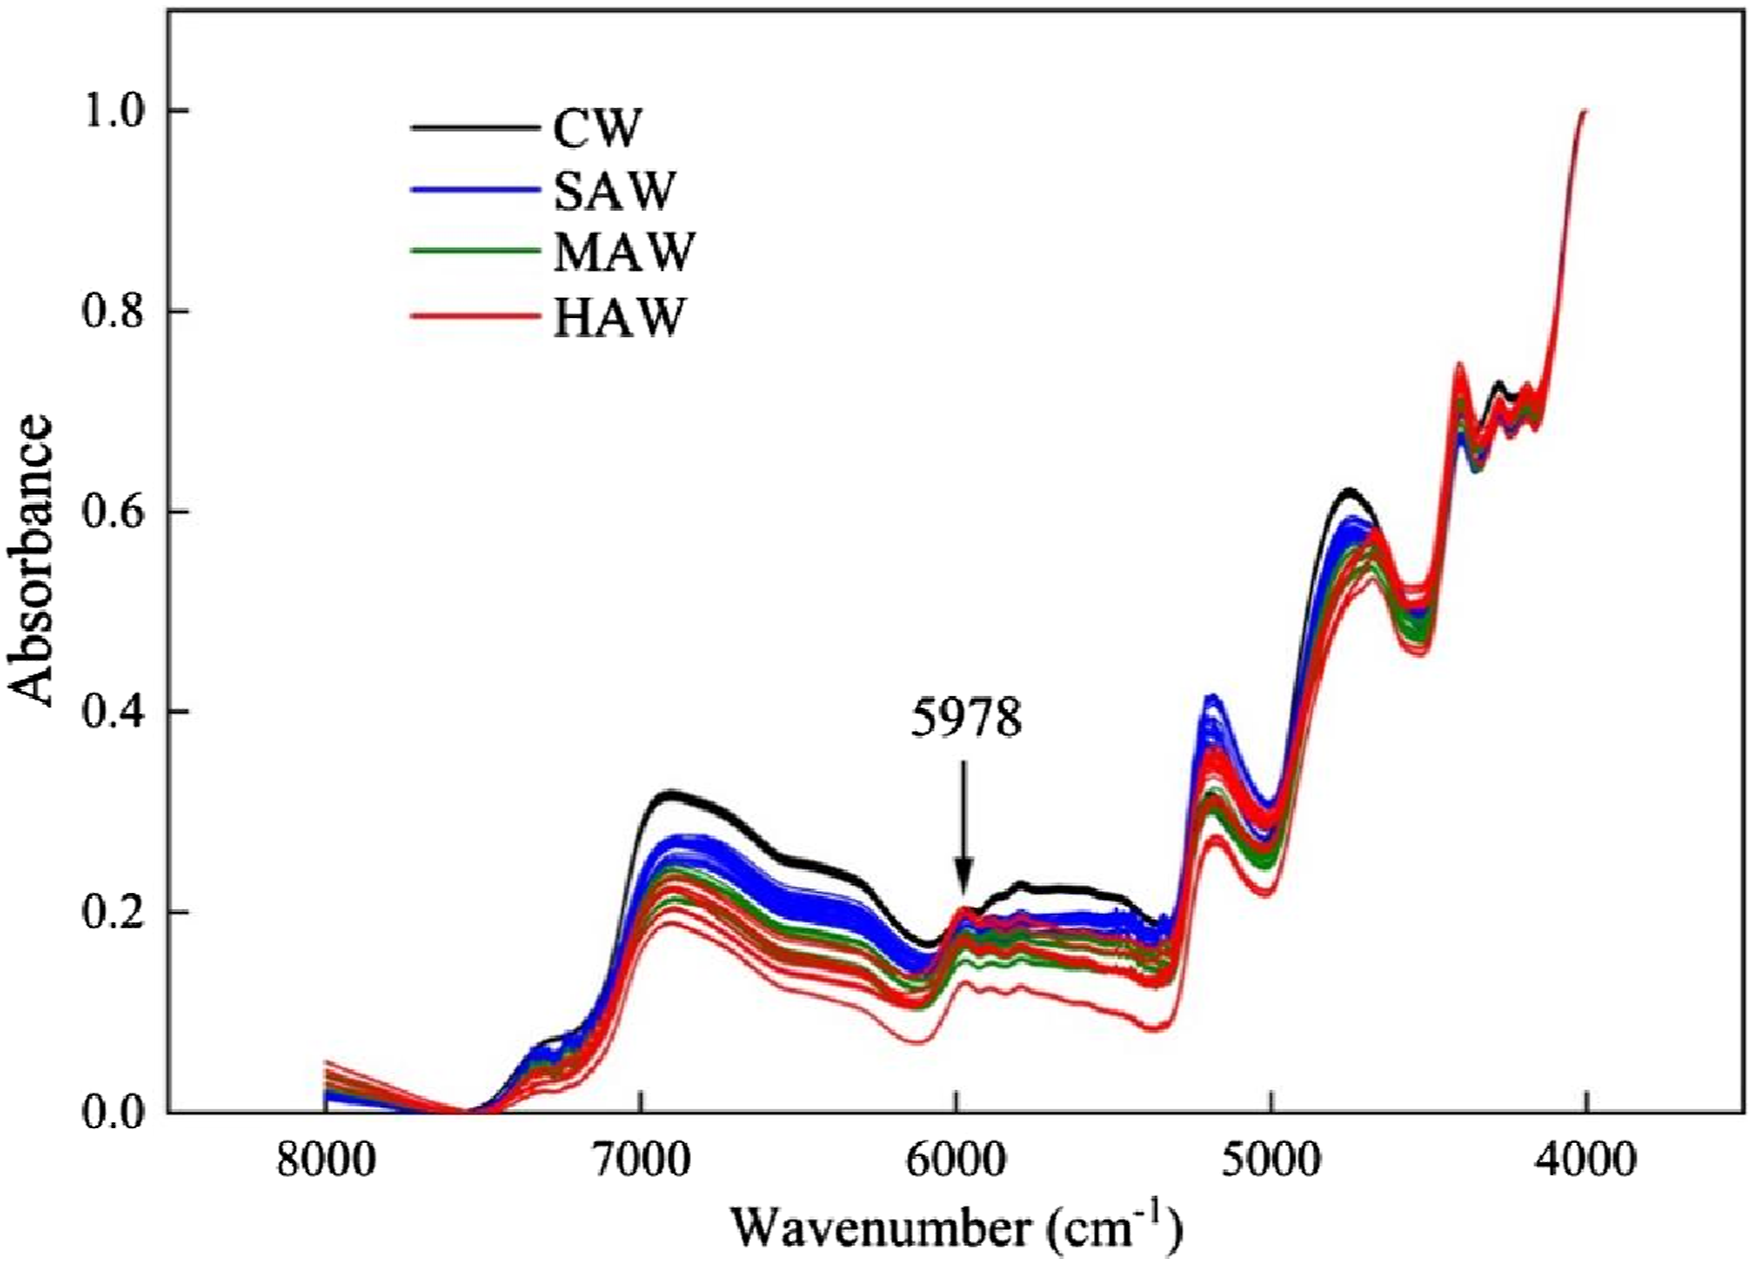
Eigenvalue distribution
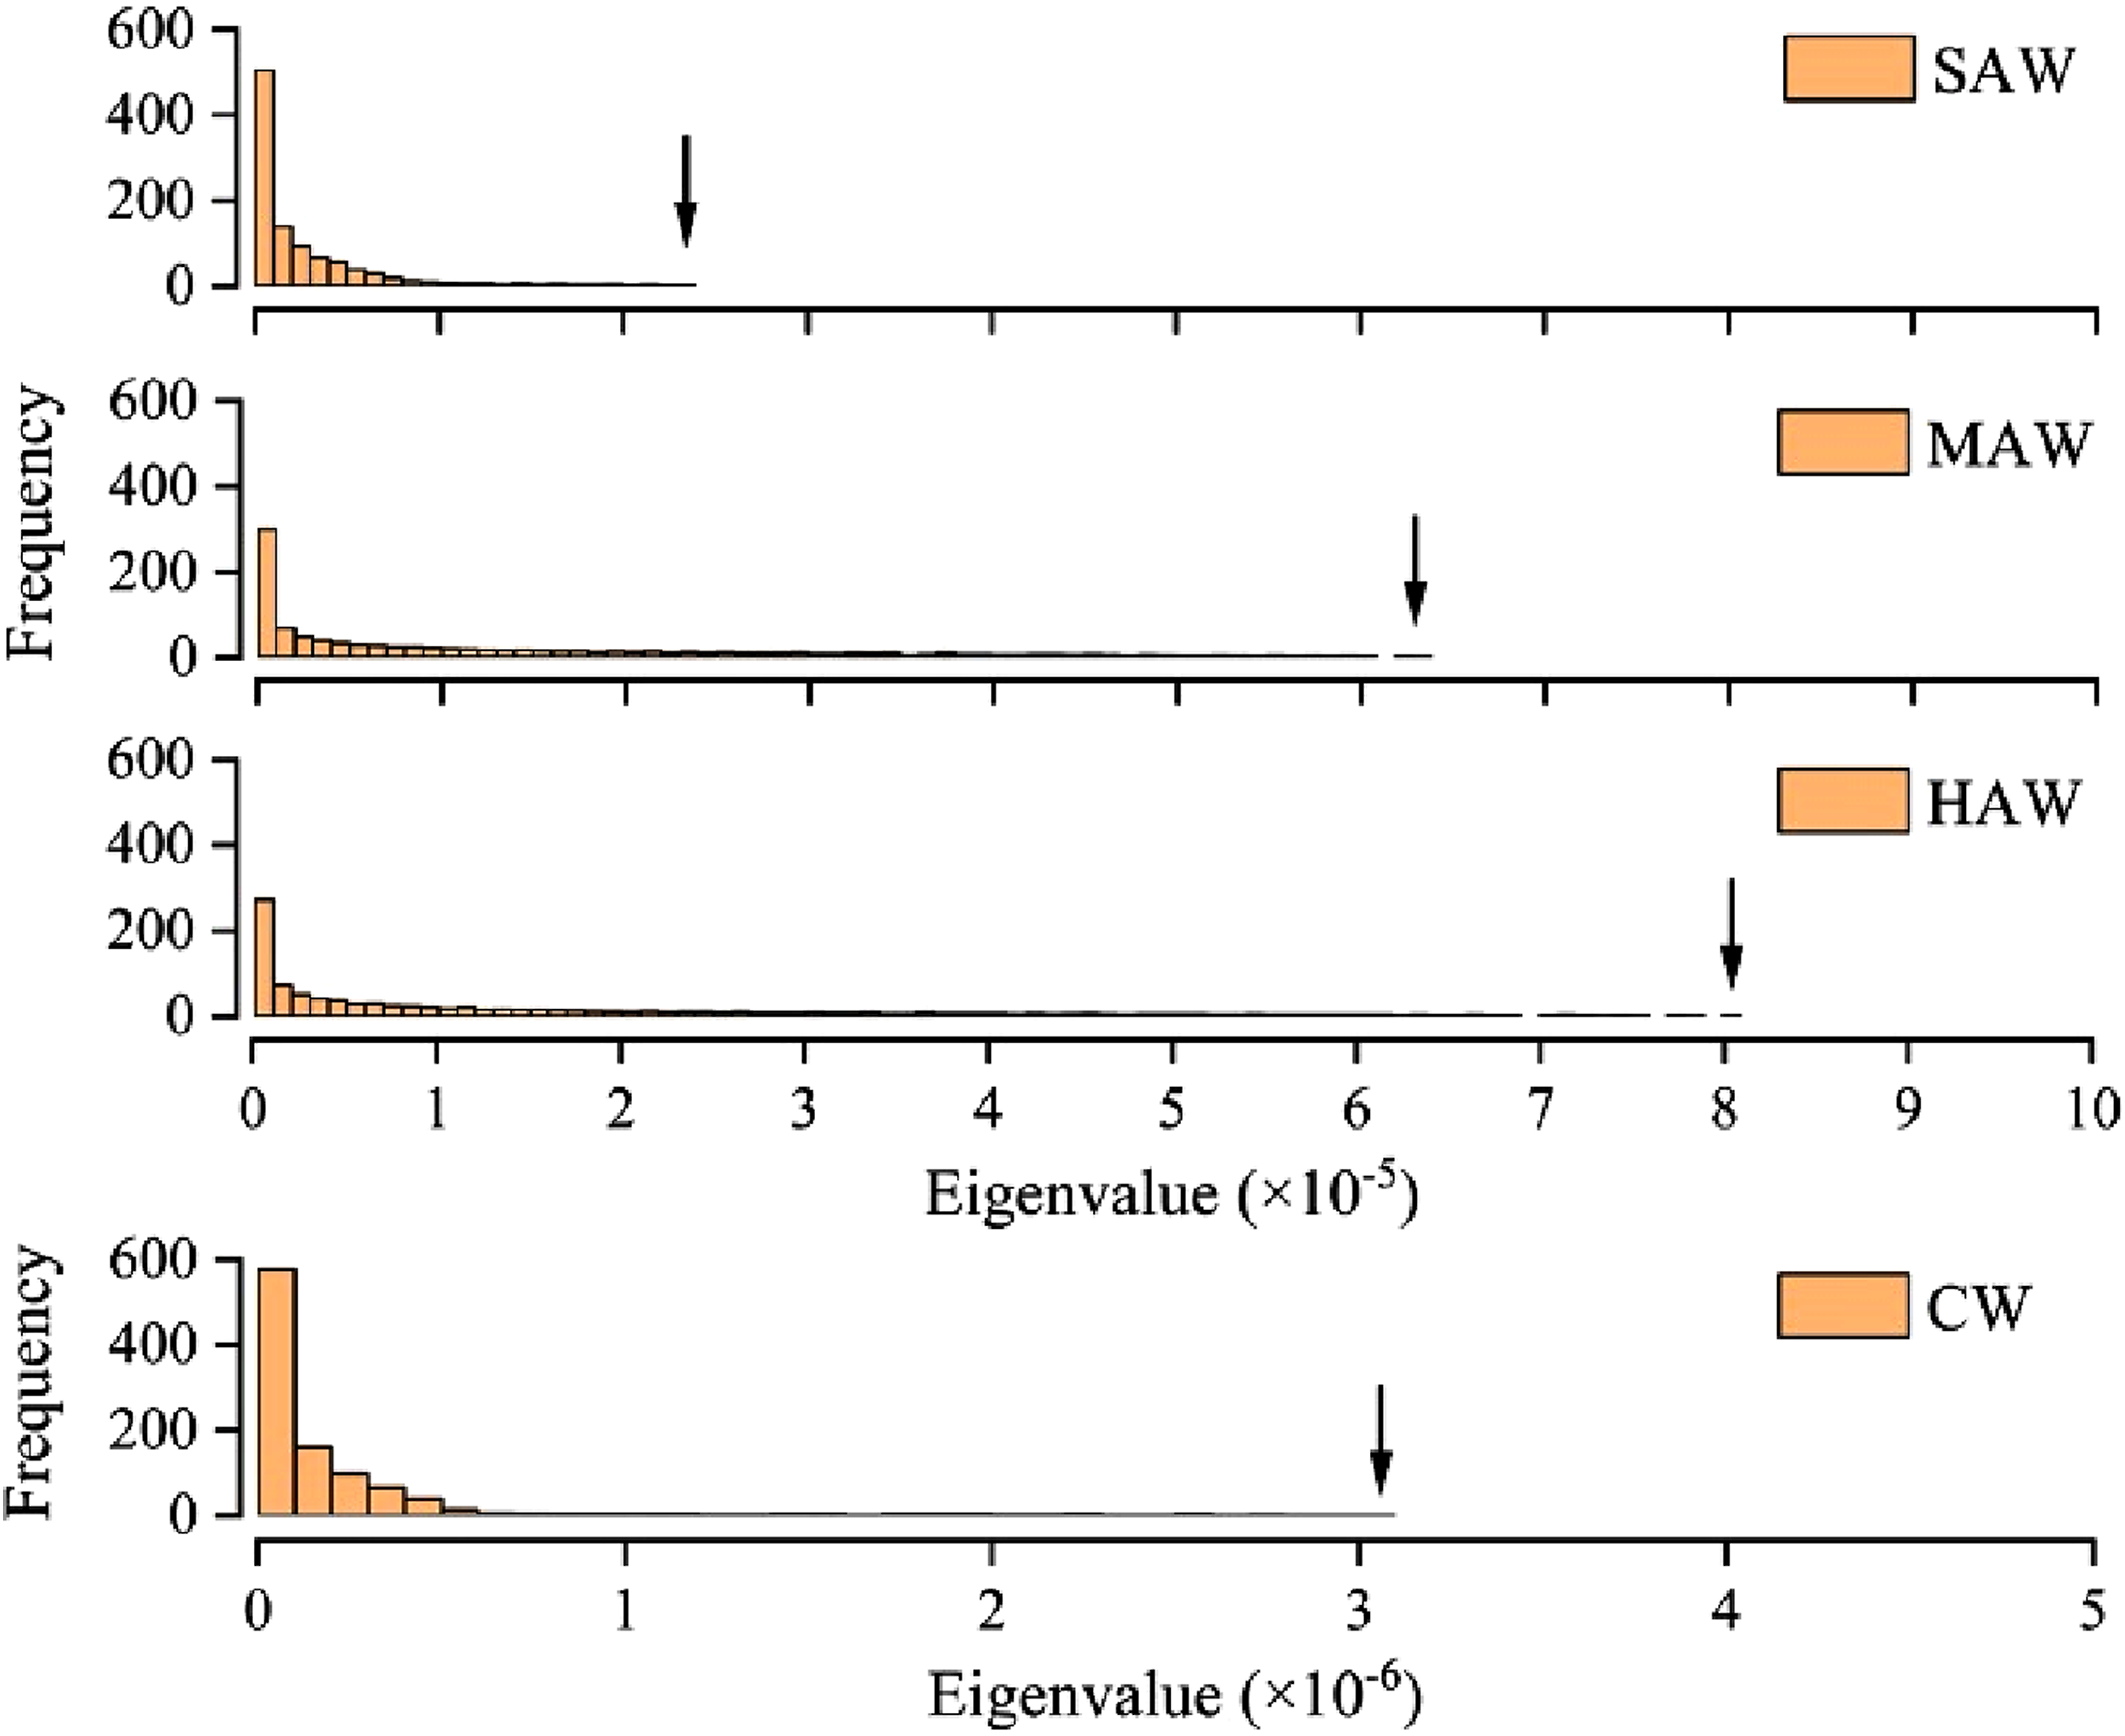
The distribution of the (energy) eigenvalues E
i
of archaeological wood calculated from equation (3) is shown in Figure 4. As the degree of decay increases, the eigenvalues are widely distributed, which indicates that the spectral matrix of the HAW group varied more stably than those of less decayed groups, possibly because as the chemical composition decomposes in archaeological wood during degradation, less information is reflected in the NIR spectra. As mentioned above, the set of eigenvalues can be identified with an energy function H, while the distribution function Z can be calculated as the summation of the Boltzmann factor (-βE
i
). Next, the Helmholtz free energy (F) is defined as a function of β conditioned by the variance-covariance matrix C (equation (3)):
27
Distribution of eigenvalues calculated from the spectral matrices of samples with different decay levels. The classification information of wood samples is shown in Table 1.
Based on the random matrix theory, the first eigenvalue E1 of the variance-covariance matrix C, can be evaluated by F in the limit β → ∞:
28

The gradual increase in the first eigenvalue (arrow indicated in Figure 4) for HAW (8.08 × 10⁻⁵), MAW (6.34 × 10⁻⁵), SAW (2.50 × 10⁻⁵) and CW (3.06 × 10⁻⁶), which is equivalent to the Helmholtz free energy, indicates that archaeological wood forms a more ordered/unstable state as decay increases. 29 Note that order or disorder means structural state of wood considered as an ensemble in this paper rather than traditional supramolecular structure of cellulose descripted by crystalline (order) or amorphous (disorder). The first eigenvalue of the HAW group is greater than the less decayed groups, indicating that it involves more free energy. From the perspectives of thermodynamics and statistical mechanics, this suggests that there is more energy available for release or transfer within the system, suggesting that its structure is more prone to disruption and decomposition. Wood decay results from changes in chemical composition and a reduction in total wood substance, suggesting a decrease in the overall information content in the wood system. As it is well known in wood cell wall crystalline cellulose microfiber bundles run through matrix composed of hemicellulose and lignin, which functioned as preventing microbiol from accessing the substrate. Polysaccharides in wood are degraded in preference to lignin, which was modified i.e., demethoxylation,30,31 causing simplification of chemical constituents in wood cell wall with increasing decay degree. These phenomena can be understood as the achievement of a more organized molecular configuration. The diffusion of eigenvalues indicates that these complex variations are a progression of the chemical constituent decomposition of cell walls in archaeological wood. The results obtained based on thermodynamics and statistical mechanics effectively verified the analytic results from the individual characteristics of archaeological wood traits.
Randomness of the archaeological wood system
Using the distribution function Z (equation (5)) as a normalization factor, and by setting β to a fixed value (β = 103 in this study), the probability (P
i
) that the system of interest could occupy the energy eigenstate (E
i
) is as follows:
32

The distribution of the probability (P
i
) corresponding to each energy eigenstate is shown in Figure 5. Under the same value of β, the distribution of P
i
differs for various degrees of wood decay, and assuming that the system arrives at thermal equilibrium, as the archaeological wood decays, the distribution of P
i
becomes more concentrated. Compared with highly decayed wood, the probability distribution of each energy eigenstate in the slightly decayed group is more balanced, with a wider range, indicating that the spectral matrix has more repeated information and is less orderly.33,34 At the same time, the Helmholtz free energy calculated from the characteristic value distribution of archaeological wood also reveals the molecular rearrangement of the cell wall’s chemical components caused by degradation during the decay process. Next, we consider the variation in the molecular states of archaeological wood with decay by another thermodynamic function, that is, Shannon entropy (S) as a function of the probability (P
i
):22,35 Probability distributions corresponding to each energy eigenstate of samples with different decay levels. The classification information of wood samples is shown in Table 1.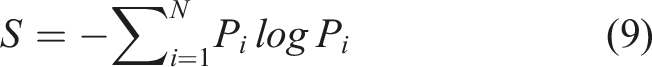
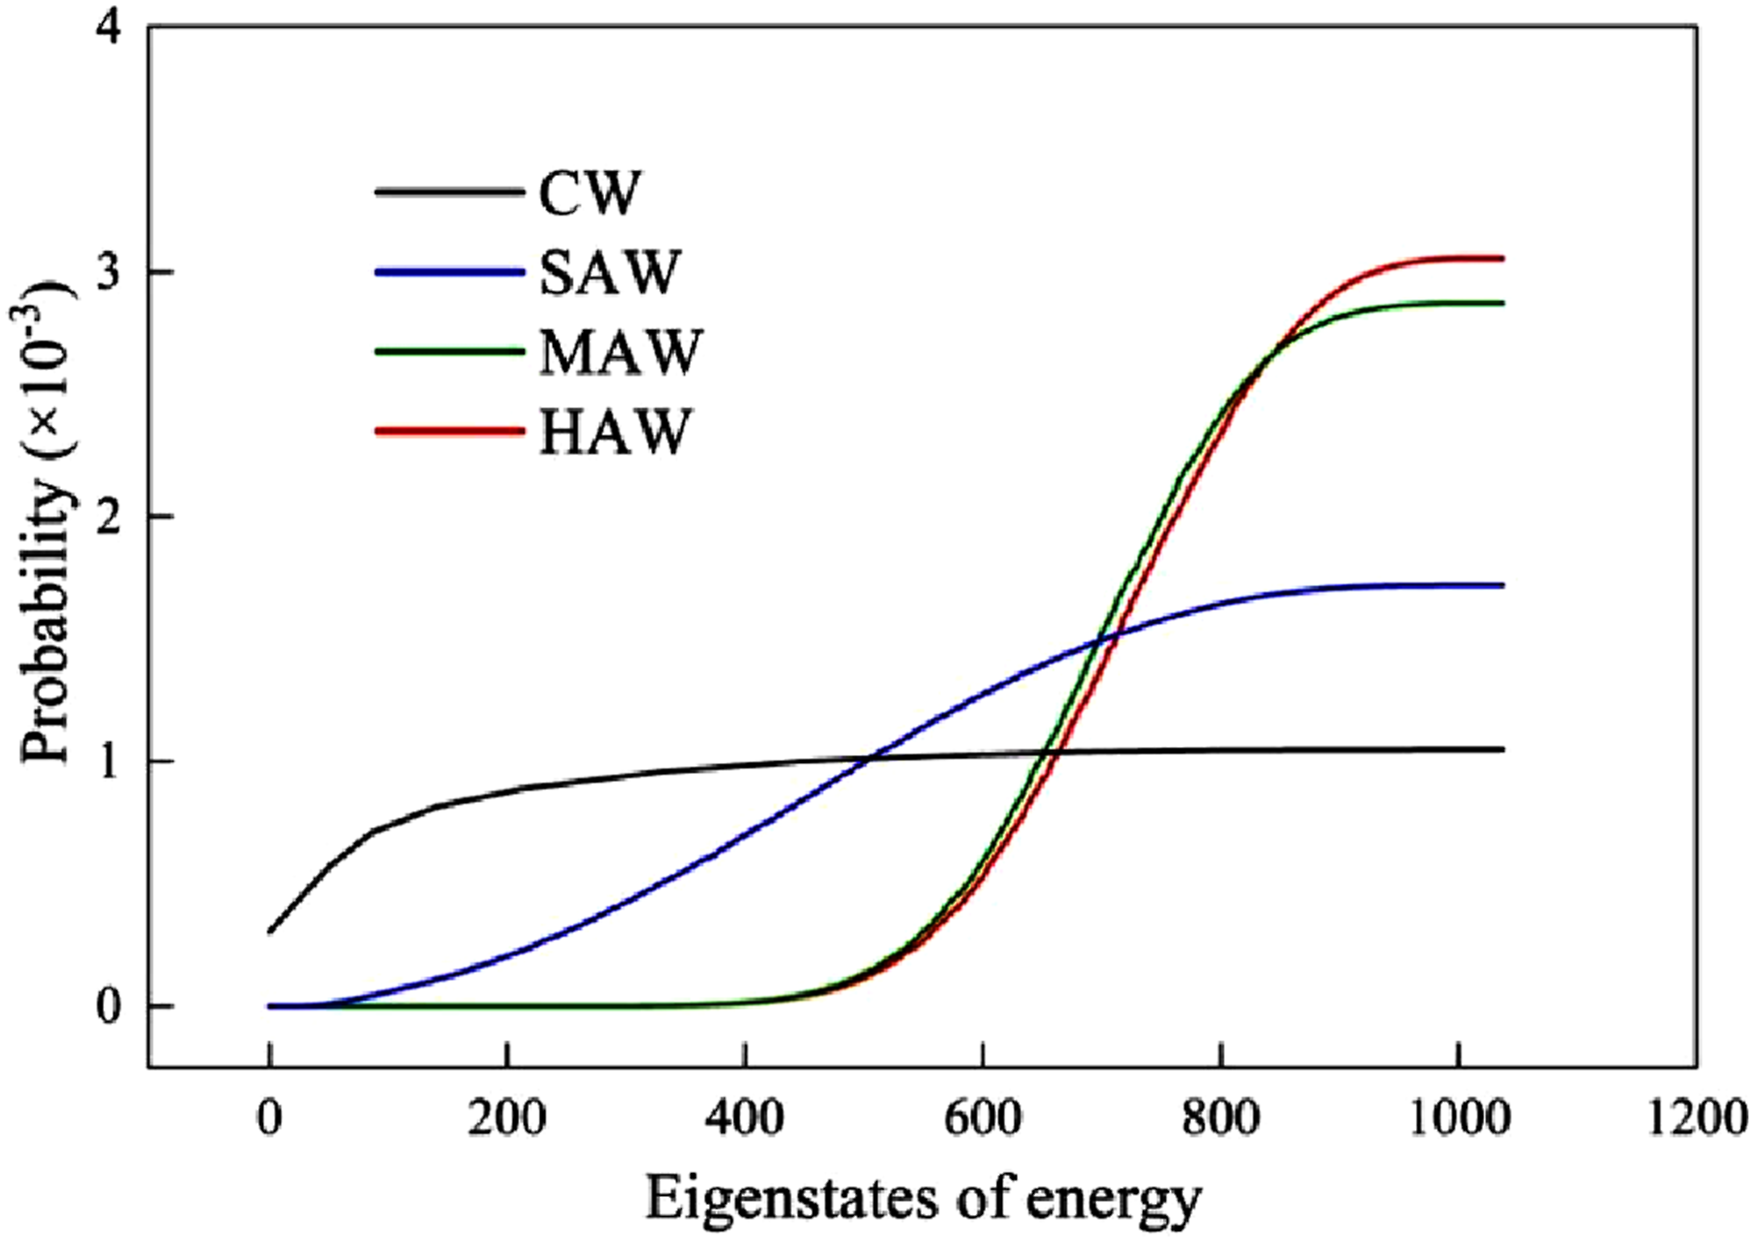
Figure 6 shows the variation of Shannon entropy under each β condition. The Shannon entropy decreases gradually with increasing inverse temperature, and that for decayed archaeological wood timbers drops exponentially compared to contemporary wood, which shows an approximately linear decrease. Compared to other decay groups, SAW has higher entropy, indicating greater uncertainty in the NIR spectral information sources within the system. Due to energy release and wood substance loss, the physical systems of highly decayed wood show lower Shannon entropy, thus, from an information theory perspective, the internal disorder of wood decreases as decay progresses, and the wood system becomes more distinct. Quantities related to the energetics distributed in decayed archaeological wood decrease with decay. In particular, the higher Helmholtz free energy found in the HAW indicates that decayed wood with a lower BD value and higher MMC value is prone to react and release energy and matter. In contrast, the entropy is higher in the less decayed groups, which is well corresponding to the H/L values in Table 1. Wohlert et al. investigated the molecular deformation mechanisms of cellulose, and found that thermodynamic entropy affects the stiffness of cellulose nanocrystals, while the decrease in Young’s modulus with increasing temperature arises from the entropy.
36
Decay level dependency of entropy for various inverse temperature conditions. The classification information of wood samples is shown in Table 1.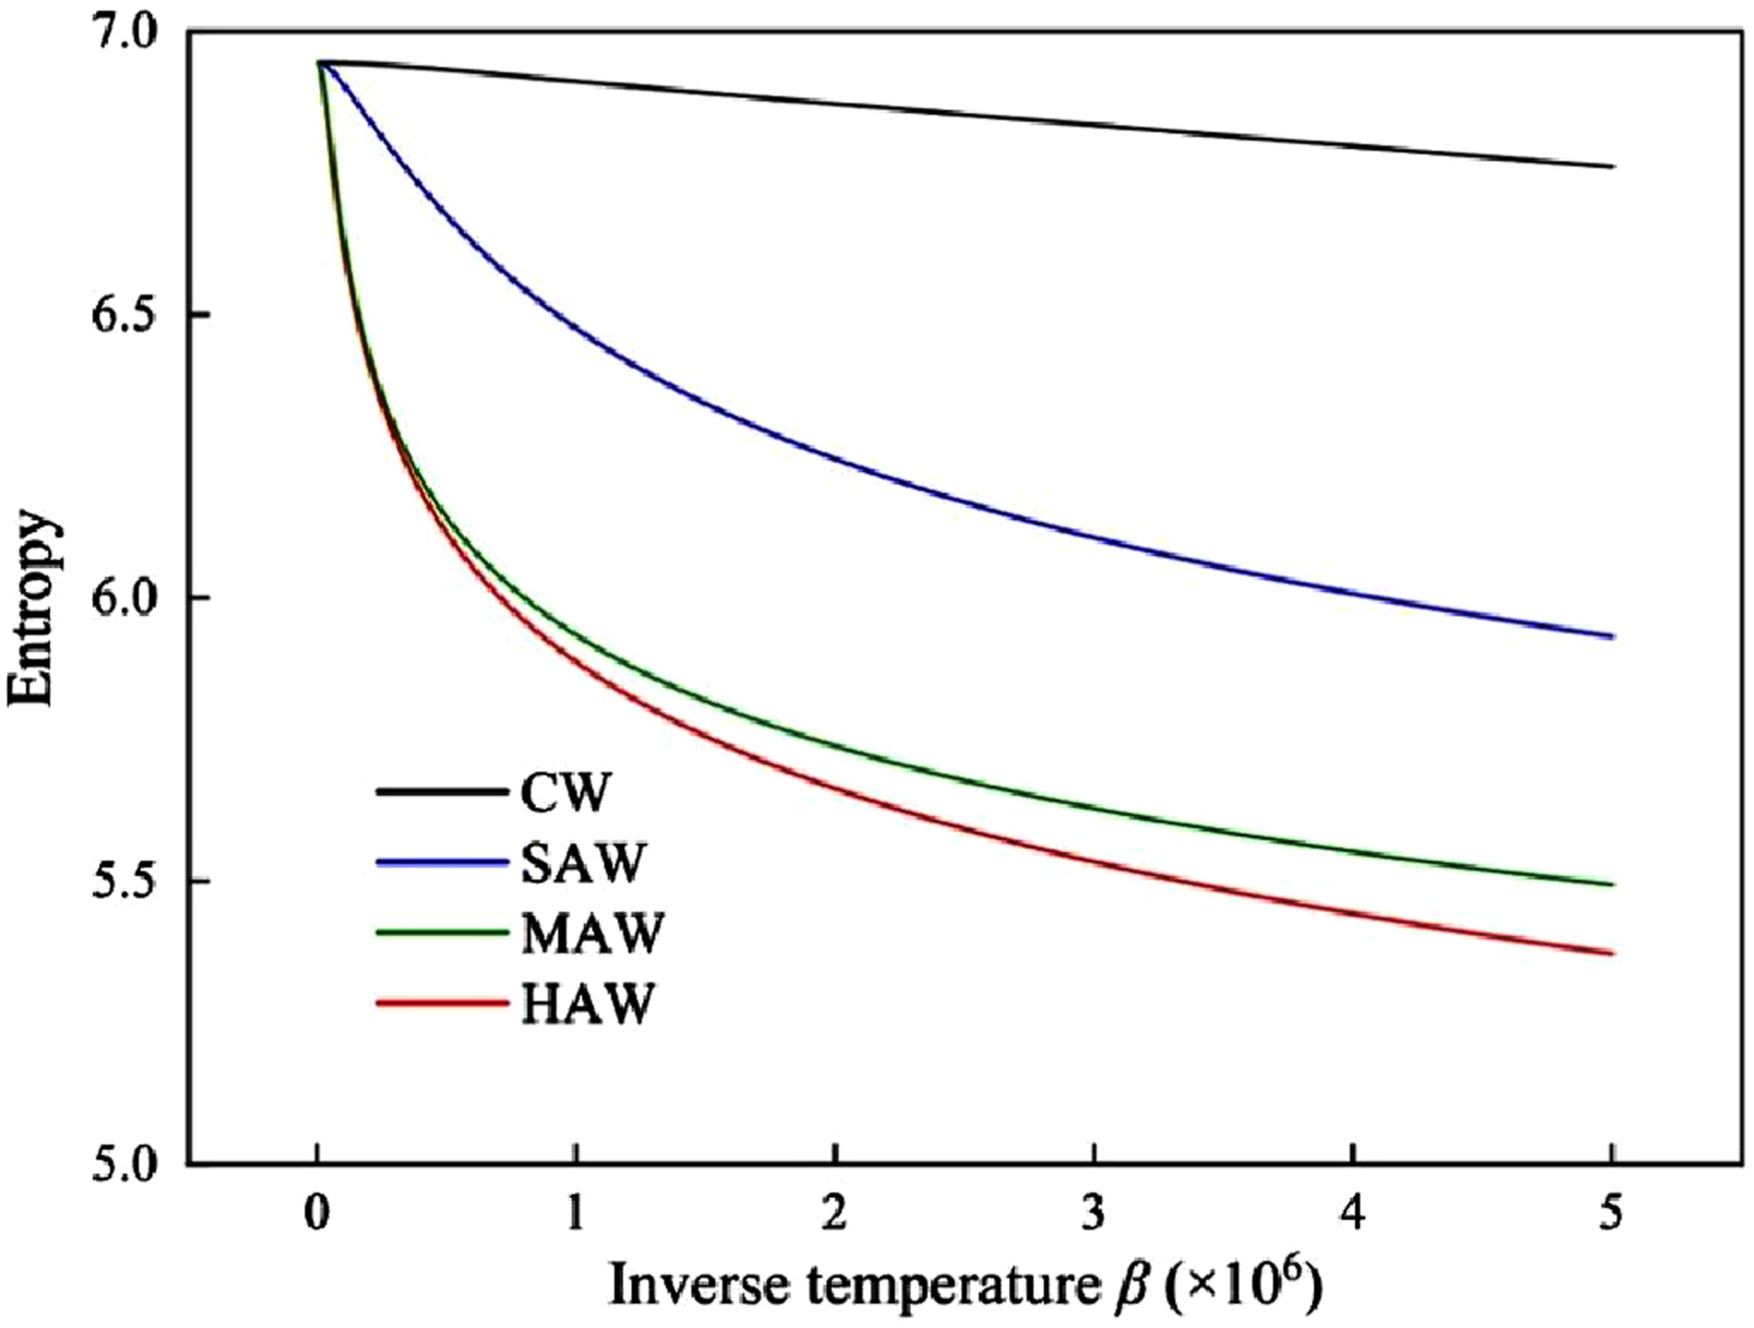
Density matrix
The Hamiltonian system is the fundamental framework in classical mechanics used to describe the evolution of physical systems. It outlines the evolution of a physical system by representing its state in phase space. Each point there corresponds to the system’s state at a specific moment, encompassing all possible states over different times, initial conditions, or microstates.
37
Within this framework, we can further investigate the system’s dynamic evolution using the density matrix. The formula for calculating the density matrix 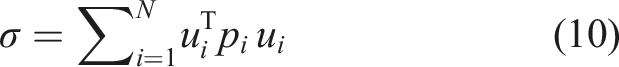
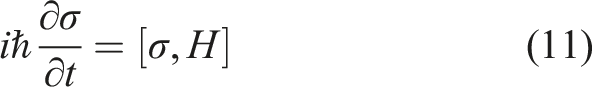
Where i = Differential of the density matrix corresponding to each energy eigenstate of samples with different decay levels. The classification information of wood samples is shown in Table 1.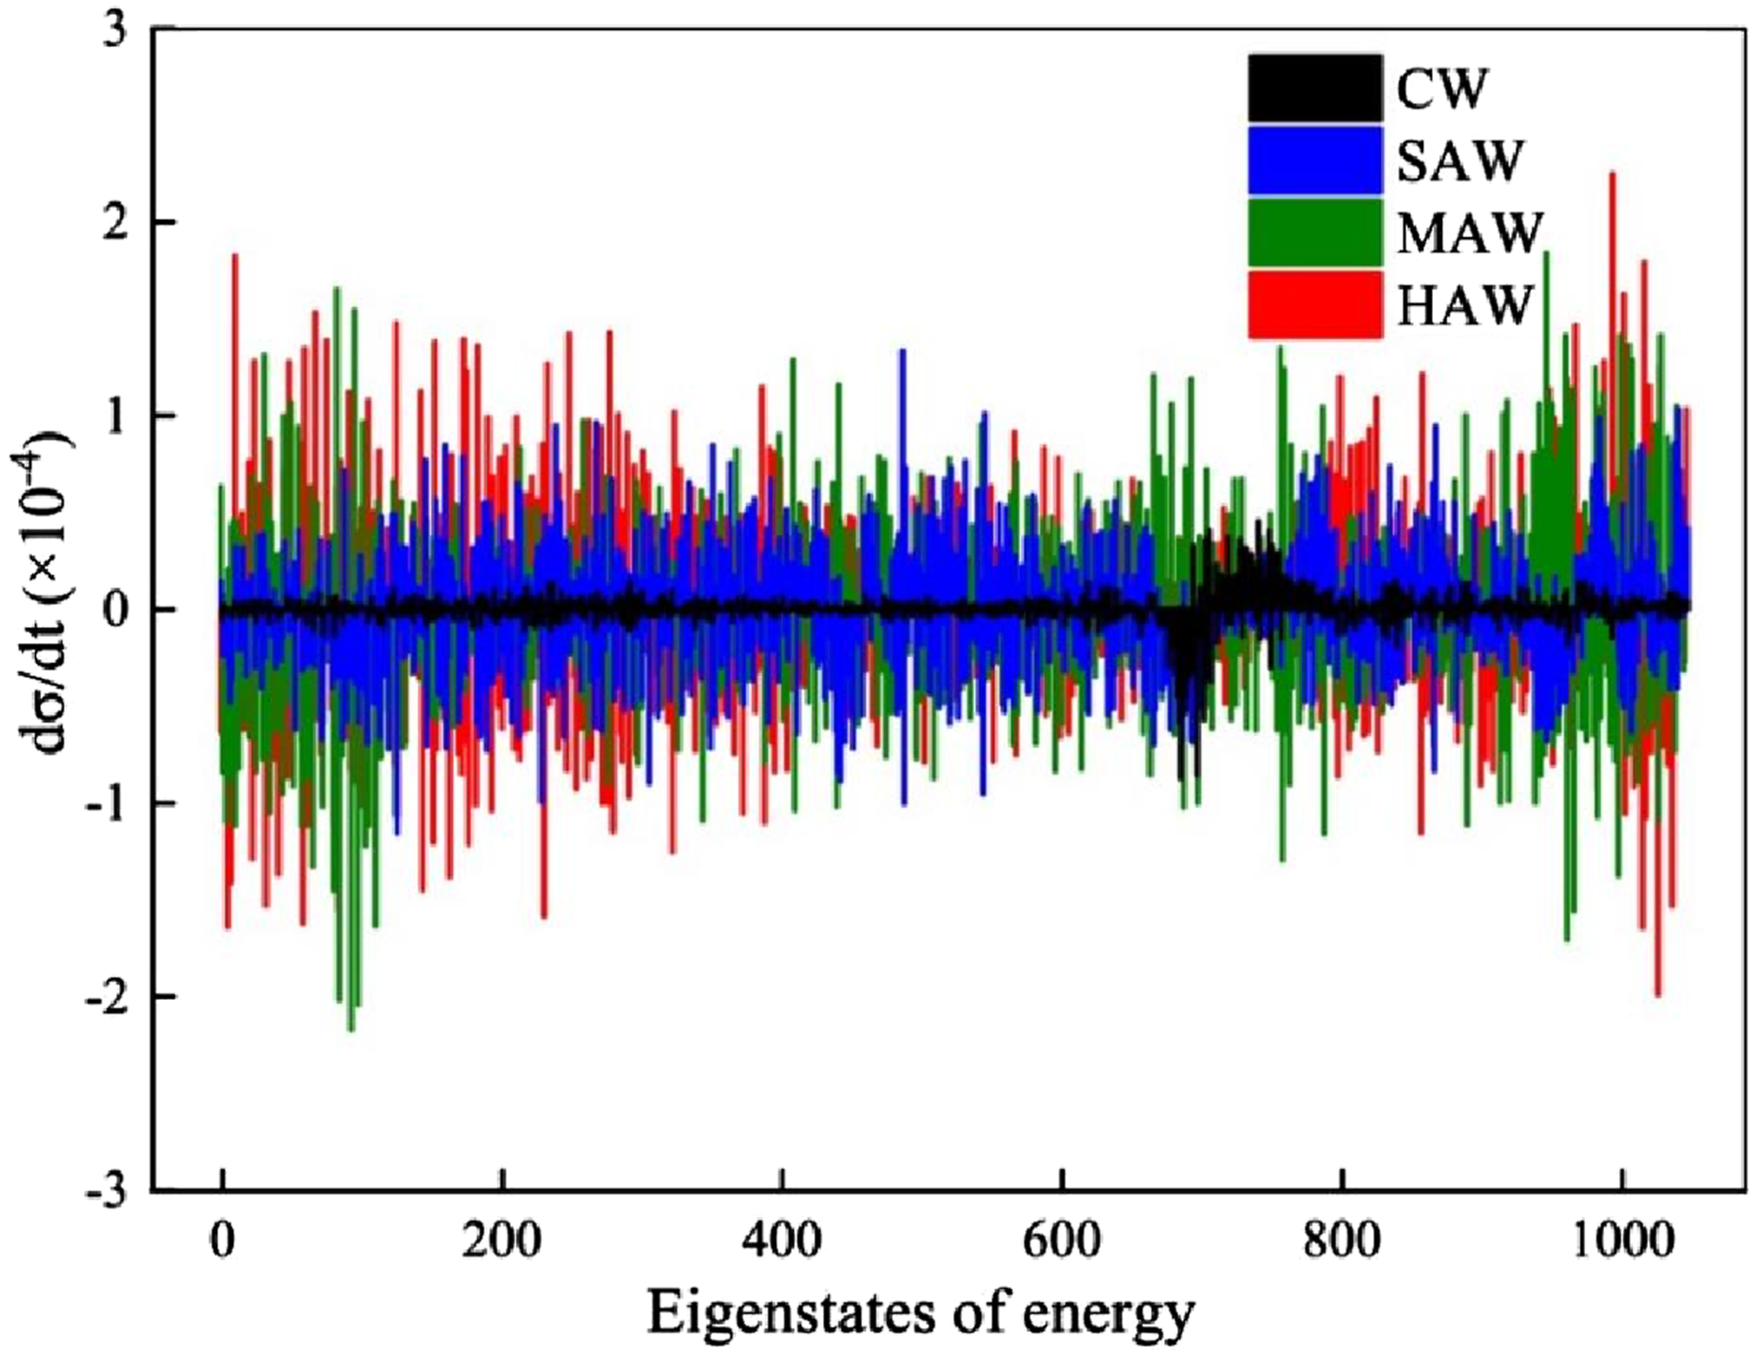
Discussion
Difference of degree of wood decay evaluation by BD value and NIR spectral matrix
The BD and MMC values of samples show similar trends for each group (Figure 2), in which values of both for SAW and MAW are quite similar, but rather clearly distinguished from the HAW group. The samples are considered heavily degraded if the RBD value (ratio of BD of archaeological wood to that of recent wood) is lower than 40%. The BD values are widely distributed, as shown in Figure 2, where the maximum BD value is three times the minimum of that in the HAW group. A similar result is observed for MMC, where the MMC maximum of around 300% is twice the minimum. According to Macchioni et al., the samples in HAW group categorized as Class 2 (MMC range of 225%–350%), and were considered to in better conservation condition. Our results, however, contrary to those calculated by NIR spectral matrices, where the SAW and MAW groups show more similar degree of decay evaluated by the BD and MMC values, but rather the HAW and MAW group are closer in terms of decay degree from probability distribution function (Figure 5) and Shannon entropy (Figure 6) variation as calculated by the eigenvalues. The results of NIR spectral matrix calculation indicate that the decay degrees of MAW and HAW are more closer, which are consistent well with the H/L values of chemical composition analyses presented in Table 1. There are differences in evaluating the wood decay degree based on BD and MMC values and NIR spectral matrix. By traditional BD and MMC values to evaluate degree of wood decay, there are always differences in BD value between archaeological wood samples. Wood ring width (i.e., ratio of earlywood and latewood) resulted in individual differences in the BD values. There were also differences as decay occurred in uneven in cell walls of archaeological wood rising unevenly and locally from the microbial decomposed chemical components of wood. Finally, it is usually difficult to prepare samples with regular shapes for heavily decayed archaeological wood, and decomposition products that fill the wood cell wall by microbial attack and mineral substances affect the sample’s weight. These factors lead to differences in the degree of archaeological wood decay, and correspondingly the NIR spectra reflect the molecular information containing in archaeological wood, where NIR intensity varies with chemical group content in decayed wood. In this study, archaeological wood showed definite Ei value distribution according to different wood decay levels by NIR matrix. Typically, the E1 value increased with increasing degree of wood decay, indicating a potential to evaluate the degree of archaeological wood decay.
NIR spectral matrix on wood decay assessment
Since all of the variations induced by various wood properties during the degradation process were aggregated into the set of eigenvalues, the Shannon entropy, 40 calculated from these eigenvalues and representing the variation in eigenvalue distribution may provide a conclusive basis for determining the demarcation between different degrees of decay. The wood decay process involves complex biochemical reactions at the microscopic level, mainly involving the degradation and transformation of the main components of wood, leading to significant changes in its properties and structure. For this reason, the set of eigenvalues reveals the intrinsic changes in the characteristics of archaeological wood. In thermodynamic analysis, an increase in entropy is typically observed in closed systems. However, during the wood decay process, wood substance loss and energy release often occur, making decayed wood an open system. In such a system, changes in entropy are influenced by interactions with the external environment. Overall, the physical system of recent wood exhibits high entropy across different inverse temperatures. On the contrary, the decrease of entropy in decayed archaeological wood caused by the extent of energy release and wood substance loss surpasses the increase of entropy. Consequently, the results of the wood decay of the entropy and density matrix indicate that the wood decay from the view of the variation in wood properties is clearly an irreversible process. According to the second law of thermodynamics, when an irreversible change occurs in an isolated and adiabatic system, the system’s entropy increases. Although wood and trees are neither isolated nor adiabatic, they form a more organized structure since they decay more within a dissipative system.
Conclusions
This study evaluated the degree of archaeological wood decay by means of normalized NIR matrix eigenvalue analysis, which is a principal issue in the research field of archaeological wood together with identification of decay causes. The analysis of parameters such as eigenvalues, free energy and Shannon entropy can provide an in-depth understanding of the internal structural changes and their information characteristics during wood decay. The results indicate that the Shannon entropy definitely reflected the degree of wood decay, where the value became lower with increasing decay degree. This result is well consistent with the value of H/L in the chemical components of archaeological wood (Table 1). Wood decay results from changes in wood composition and a reduction in total wood substance, suggesting a decrease in the overall information content in the wood system. Moreover, the volume change of the density matrix indicates that wood decay is an irreversible and continuous process. The lower Shannon entropy of decayed wood suggests that its spectral signal pattern is quite clear. Although some components change quite drastically, the overall reduction in information does not affect the significance of data differences. These conclusions demonstrate that near infrared spectroscopy matrix eigenvalue analysis provides theory and an effective method for evaluating the preservative state of archaeological wood.
Supplemental Material
Supplemental Material - Study on the preservation state of archaeological wood by the eigenvalue distribution of near-infrared spectral matrix
Supplemental Material for Study on the preservation state of archaeological wood by the eigenvalue distribution of near-infrared spectral matrix by Lihui Wang, Wenbo Zhang, Dian Zhang in Journal of Near Infrared Spectroscopy
Footnotes
Acknowledgements
The authors sincerely acknowledge Dr Takaaki Fujimoto of Faculty of Agriculture, Tottori University, Japan for his kind advices and valuable discussion on construction of the NIR spectral matrices.
Funding
The authors received no financial support for the research, authorship, and/or publication of this article.
Declaration of conflicting interests
The authors declared no potential conflicts of interest with respect to the research, authorship, and/or publication of this article.
Supplemental Material
Supplemental material for this article is available online.
References
Supplementary Material
Please find the following supplemental material available below.
For Open Access articles published under a Creative Commons License, all supplemental material carries the same license as the article it is associated with.
For non-Open Access articles published, all supplemental material carries a non-exclusive license, and permission requests for re-use of supplemental material or any part of supplemental material shall be sent directly to the copyright owner as specified in the copyright notice associated with the article.