
Abstract
In this work, we compare how the properties of polycaprolactone (PCLO) nanocomposites are affected by the method of nanocomposite synthesis and the differences in graphene oxide (GO) properties. PCLO nanocomposites with freeze-dried or hot-dried graphene oxide (FGO/HGO) were synthesized by in situ polymerization and melt mixing. The PCLO molar masses remained constant during melt mixing, but they were significantly reduced with increasing amount of GOs during in situ polymerization. Despite this fact, the in situ polymerized nanocomposites showed enhancement in Young modulus up to 45%, compared to only 10% modulus increase of melt-mixed nanocomposites. This was attributed to the higher crystallinity and the higher level of nanofiller dispersion and exfoliation in in situ polymerized nanocomposites. When comparing the effect of FGO and HGO on nanocomposites properties, the improved dispersion and ameliorated mechanical properties were observed for the former one.
Introduction
Polycaprolactone (PCLO) is an aliphatic polyester, whose biodegradability made it popular for biomedical applications. 1 Specifically, many PCLO-based products were commercialized for tissue engineering such as nerve guidance conduits, the monofilament sutures or the root canal filling materials.2–4 However, further PCLO application potential is limited by its poor mechanical performance. This deficiency can be suppressed by addition of various nanofillers, which opens new possibilities in biomedicine and beyond. Recently, graphene-based nanofillers were reported to improve not only the mechanical properties of various polymers 5 but also several biomedical properties of PCLO.6–8 A combination of good biomedical and mechanical properties is promising for future medical applications. However, it is important to balance the individual properties, which are heavily influenced by synthesis procedure.
Two commonly used procedures to synthesize PCLO nanocomposites are in situ polymerization and melt mixing. An advantage of in situ polymerization is a possibility of using nanofiller functional groups to (co)initiate/catalyze polymerization, possibly leading to covalent attachment of the nanofiller to polymer matrix. This ability was reported for untreated graphene oxide (GO),9,10 as well as for a treated one.11,12 The covalent attachment then helped to exfoliate the GO layers in the polymer matrix and improved the mechanical properties of PCLO nanocomposites. Nanocomposites prepared by in situ polymerization were also processed to scaffolds with good biocompatibility and honeycomb-patterned films with enhanced electrical conductivity. Contrary to in situ polymerization, melt mixing is usually faster and provides nanocomposites with good biomedical and mechanical properties as well, that are often further processed by 3D printing. Nevertheless, the results obtained from different authors vary. For example, Wang et al. prepared the nanocomposite scaffolds with enhanced compression modulus and biocompatibility, 13 whereas Scenini et al. reported the graphene nanocomposites with only a negligible change in mechanical properties. 14 To conclude this section, we must emphasize that despite the large amount of research, the direct comparison of in situ polymerization and melt mixing is still missing in the literature.
The major aim of this work is to compare the properties of PCLO/GO nanocomposites prepared by in situ polymerization and melt mixing. The minor aim is to describe the influence of varying GO characteristics on the nanocomposite properties. The GOs were characterized by the transmission electron micrographs, sorption analysis and X-ray diffraction. The nanocomposite analysis focused on the relationship between mechanical and rheological properties and the level of nanofiller dispersion and exfoliation in polymer matrix.
Experimental
Materials
Graphite (325 mesh, GK Graphite Týn CR 12 995; Czech Republic). Sulfuric acid (96%, Penta s. r.o.; Czech Republic). Sodium nitrate, potassium permanganate (Lachema; Czech Republic). Hydrogen peroxide (30%, Penta s. r.o.; Czech Republic). ε-Caprolactone (97%, Sigma-Aldrich) was dried over powdered calcium hydride (Sigma Aldrich) and distilled under reduced pressure (40 Pa), water content determined by Karl-Fischer titration was less than 30 ppm. Stannous octoate (95%, Sigma-Aldrich). Toluene and methanol (p.a., Sigma-Aldrich).
Synthesis of the graphene oxide
The GO was synthesized using the modified Hummers method according to the work of Rajaura et al. 15 The main steps of GO synthesis are discussed in Electronic Supporting Information (ESI). The obtained dispersion was then dried by freeze-drying or hot-drying. During the freeze-drying, the water was sublimed from the frozen sample (−70°C) at reduced pressure (50 Pa). In case of hot drying, Petri dishes with dispersion were placed in a vacuum oven (60°C) and the water was evaporated at reduced pressure (800 Pa). Both GOs were ground in the knife mill. The freeze-dried GO will be further denoted as FGO, whereas the hot-dried GO as HGO.
Synthesis of the nanocomposites
The PCLO nanocomposites were prepared by in situ polymerization and melt mixing.
All steps of the in situ polymerization were carried out under argon atmosphere. Firstly, the GOs were dispersed in caprolactone by ultrasonication to obtain a homogenous dispersion. The ultrasonication time was 30 min (FGO) or 60–120 min (HGO, the time was increased with the increasing concentration of nanofiller). Afterwards, the solution of stannous octoate (polymerization catalyst) in toluene was introduced to the GO/caprolactone dispersion; the final concentration of stannous octoate in polymerization feed was 0.5 mol%. Toluene was then removed at reduced pressure (50 Pa) and polymerization was carried out for 4 h at 120°C. Finally, the toluene residues were removed from nanocomposites by annealing at 50°C and reduced pressure (800 Pa) to constant weight.
The conditions for the synthesis of PCLO matrix used for the melt mixing were analogous to the in situ polymerization. Stannous octoate (0.5 mol%) was dispersed in caprolactone, the mixture was transferred to an open teflon mould with internal dimensions 160 × 140 × 4 mm and the polymerization was carried out for 4 h at 120°C. After demoulding, PCLO was ground to the small chips. The chips were premixed with the GOs by manual stirring and were dosed to twin-screw microextruder (HAAKE Minilab II) with co-rotating conical screws. The melt mixing was carried out for 10 min at 80°C, screw speed was set to 100 rpm for mixing and to 50 rpm for the extrusion of nanocomposites.
Characterization
The elemental composition of GOs was determined by combustion analysis using a Vario EL Cube (Elementar, Germany) and by X-ray photoelectron spectroscopy (XPS) on an ESCAProbeP (Omicron Nanotechnology Ltd.; Germany). The ESCAProbeP used an aluminium anode with energy 1486.7 eV as a source of monochromatic light. The data were analysed with CASA XPS software using Shirley background subtraction.
The interlayer distance of GO layers and the level of GO dispersion in polymer matrix were measured by X-ray diffraction (XRD) on an X´Pert
3
Powder diffractometer (PANanalytical; United Kingdom) with Bragg-Brentano parafocusing geometry and a CuKα tube providing wavelength of λ = 0.154 nm. Peak profiles were obtained using HighScore 4.0 software (PANAlytical). The calculations of GO interlayer distance were based on Bragg equation (1) (d – interlayer distance,

The surface area of graphite and GOs was measured using a Coulter SA 3100 sorption analyzer, (Beckman Coulter). Before the sorption experiments, samples were degassed for 4 h at 95°C under high vacuum. Detector cooled by liquid nitrogen (−196°C) was used to evaluate the results using Kelvin and Brunauer, Emmett and Teller equations, respectively.
To obtain transmission electron microscopy (TEM) images, the powder nanofillers were ground in an agate mortar and dispersed in isopropanol. Then, 7 μl of the dispersion was dripped on a copper grid (Ted Pella Inc. mesh 300, lacey carbon) and isopropanol was evaporated. The measurements were carried out on an EFTEM 2200 FS (Jeol, Ltd.; Japan) operating at an accelerating voltage of 200 kV.
The polymer yield of nanocomposites was determined gravimetrically after extraction of low-molecular compounds, performed three times for 30 min in methanol (50 mL per 0.5 g of sample). To calculate the polymer yield, the equation (2) was used (

The average values of molar masses were determined using a chromatographic system Breeze (Waters; USA) with a refractive index detector and multi-angle laser light scattering detector miniDawn TREOS (Wyatt; USA). The separation was performed on a PSS Lux LIN M 5 μm column (7.8 × 300 mm) at 35°C in tetrahydrofuran at an elution rate of 1 mL/min using polystyrene standards for calibration.
To prepare the specimens for tensile tests and dynamic mechanical analysis (DMA), the nanocomposites were ground to chips, which were hot pressed in a mould with dimensions 60 × 50 × 0.7 mm using this procedure: (I) 5 min preheating, (II) 5 min hot-pressing at 75°C (degassing after 1 min), (III) 5 min cooling. Finally, dog bone specimens were cut from the pressed foil (distance between shoulders – 20 mm, width – 4 mm, thickness – 0.7 mm) and stored in a desiccator before the measurement. Dynamic mechanical behaviour of nanocomposites was studied using DMA DMX04T instrument (RMI; Czech Republic). The measurements were realized in bending mode in the temperature range: –110–50°C at a heating rate of 2 °C/min, frequency 1 Hz and force amplitude 500 mN. The tensile tests were carried out on an Instron 3365 (Instron; USA) at a rate of 1 mm/min until the proportional elongation exceeded 1%, then the rate was increased to 50 mm/min.
The crystalline properties of nanocomposites were obtained using differential scanning calorimeter DSC Q100 (TA Instruments; USA). The measurements were carried out in a 0–100°C range (heating – cooling – heating) at rate of 10 °C/min. To calculate the crystalline content of nanocomposites, the equation (3) was used
17
(

The optical micrographs of nanocomposites were obtained using a Leitz DMRXE microscope equipped with objective HC PL Fluotar (10x/0.3 PH1). Nanocomposite chips on microscopy slides were placed on Linkamcell Scientific LTS 350 plate that was heated to 80°C.
Scanning electron microscopy was carried out on TESCAN Vega 3 LMU apparatus in Univac mode.
Results and discussion
The synthesis of graphene oxide
The chemical composition of freeze dried graphene oxide and hot dried graphene oxide.
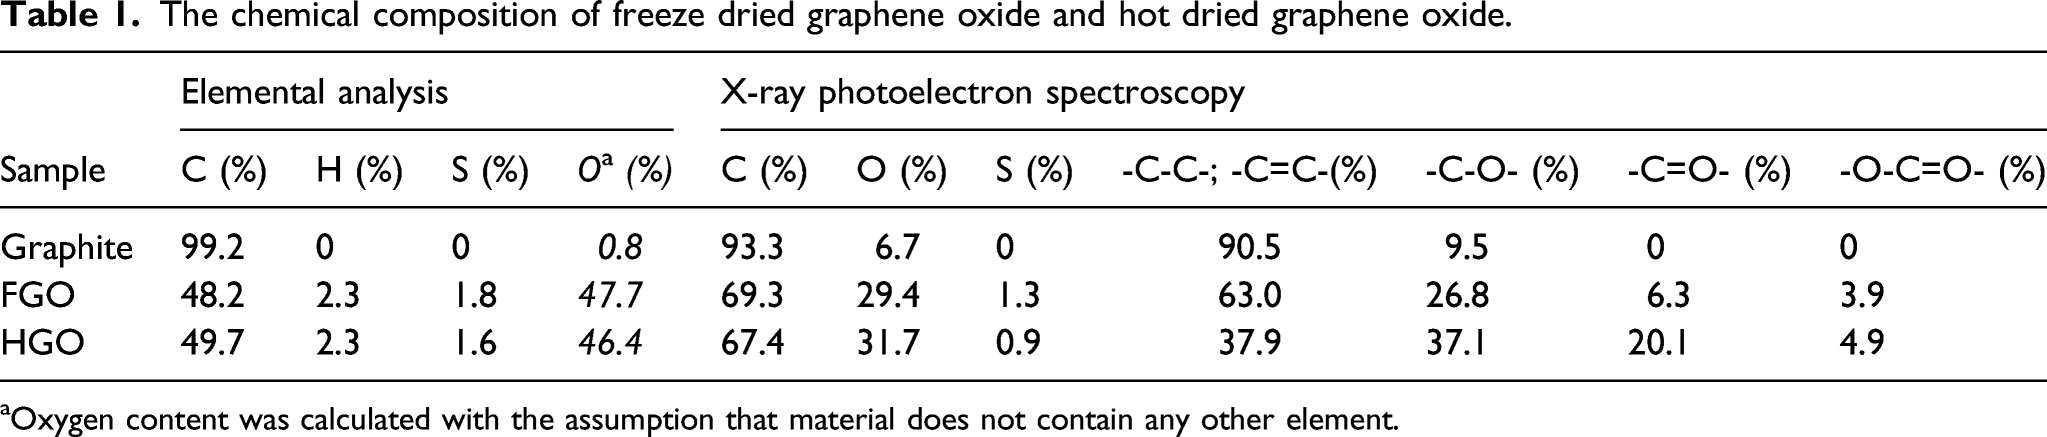
aOxygen content was calculated with the assumption that material does not contain any other element.
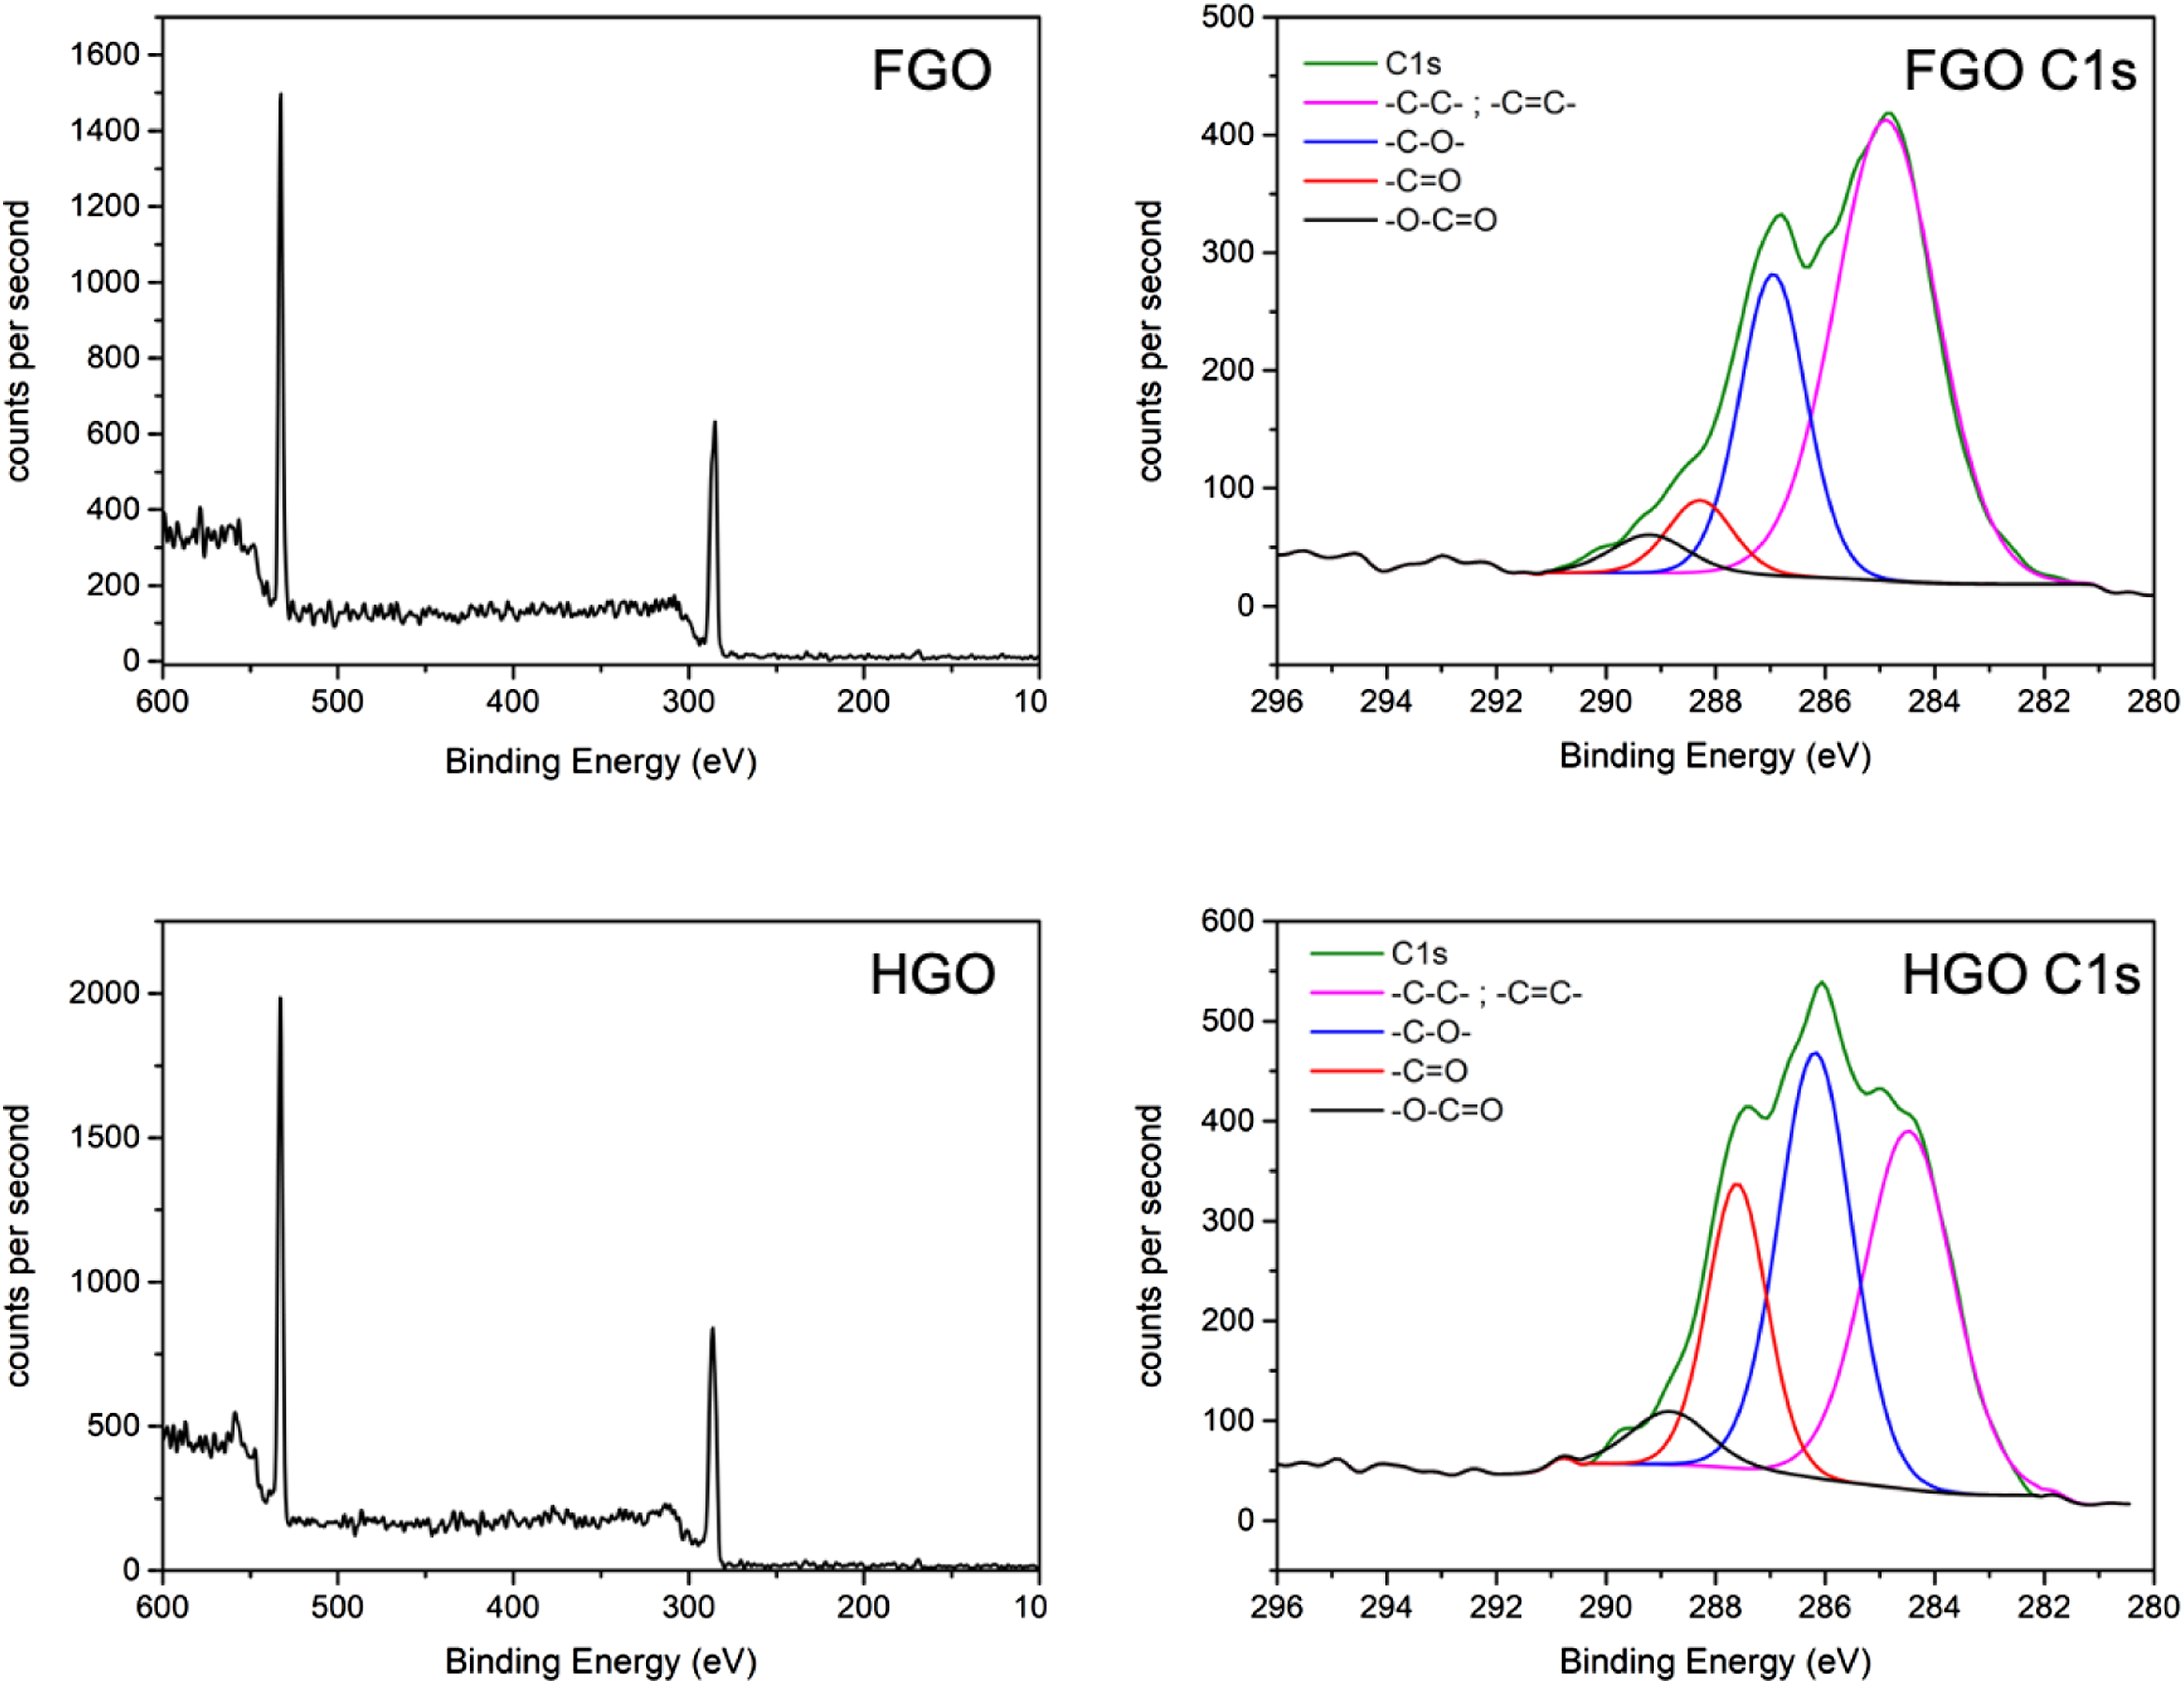
X-ray photoelectron spectroscopy survey spectra (lefthand side) and deconvoluted C1s spectra (righthand side) of FGO (top) and HGO (bottom).
The interlayer distances and surface areas of freeze dried graphene oxide and hot dried graphene oxide.


The X-ray diffraction patterns of FGO and HGO (top), the comparison of bulk densities of FGO and HGO (bottom). FGO: Freeze dried graphene oxide; HGO: Hot dried graphene oxide.
Sorption analysis proved that freeze-drying slightly increased the surface area of the product, whereas hot-drying decreased the surface area by an order of magnitude (Table 2). It is noteworthy that while the GOs significantly differ in their surface areas, their interlayer distances are similar. This discrepancy was resolved via TEM that indicate the presence of single sheets and multiple layers in both GOs (Figure 3). However, FGO micrographs show mostly flat surfaces with low level of folding, while HGO sheets exhibit much more folding and wrinkling. Such distortion of HGO can strongly decrease the accessibility of its surface to nitrogen atoms used in sorption analysis which can explain the difference in surface areas. We also believe that the difference in surface area is responsible for the extremely high bulk density of FGO compared to HGO (Figure 2). The transmission electron microscopy images. (a) FGO single sheet, (b) FGO multiple sheets, (c) HGO single sheet and (d) HGO multiple sheets. FGO: Freeze dried graphene oxide; HGO: Hot dried graphene oxide.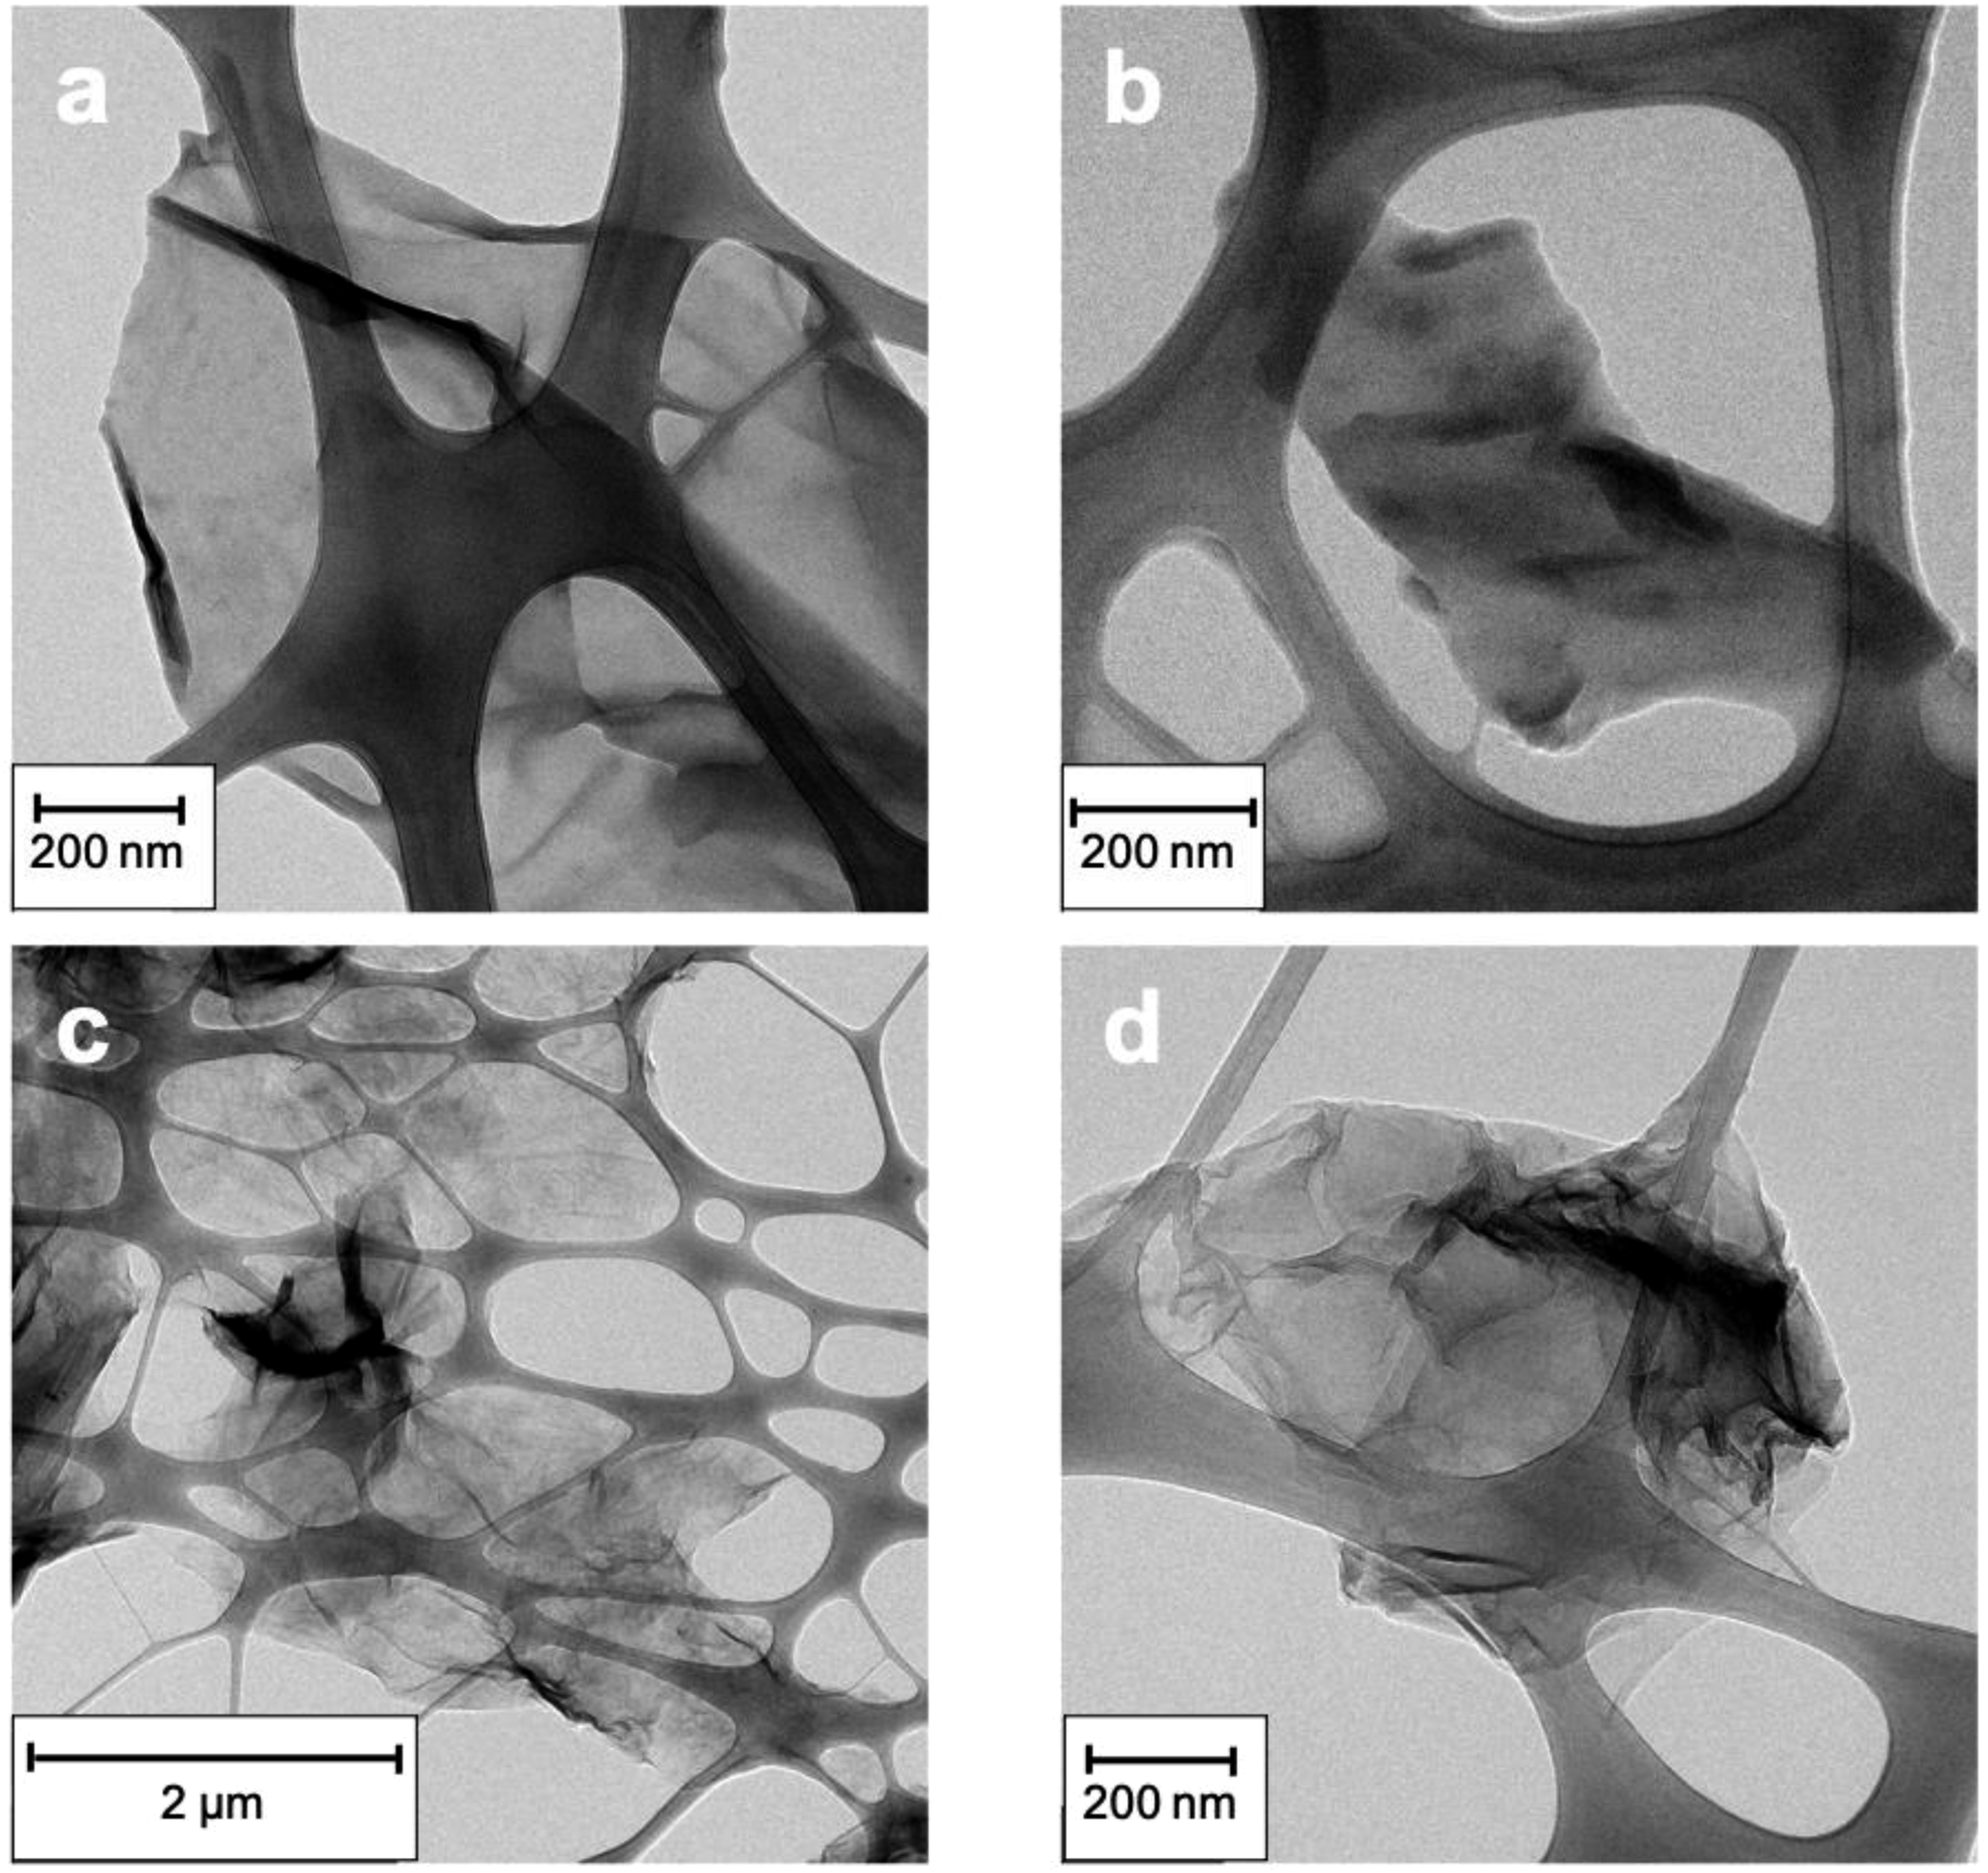
The synthesis of nanocomposites
In situ polymerization afforded nanocomposites containing both GOs in amount up to 2.5 wt%. Melt mixing was successful with FGO, but the preliminary experiment with 1 wt% of HGO resulted in its poor dispersion in the polymer matrix (Figure ESI 1). We ascribe this deficiency to the low surface area of HGO, which makes it hardly accessible for polymer chains and, therefore, unable to be well dispersed or even exfoliated. For this reason, melt mixing was used only for the synthesis of nanocomposites with FGO.
Molar masses of nanocomposites
Polymer yield, molar masses and dispersity of polymer matrix from polycaprolactone/graphene oxide nanocomposites.

acontent in polymerization mixture (in situ) or mixing batch (melt mixing).
bweight average molecular weight obtained from SEC.
cnumber average molecular weight obtained from SEC.
ddispersity
emolar masses of virgin PCLO before melt mixing.
molar masses of virgin PCLO after melt mixing.
gNA = material not available.
Thermal properties of nanocomposites
Thermal properties of nanocomposites.

acontent in polymerization mixture (in situ) or mixing batch (melt mixing).
bcrystallization temperature obtained from DSC (first run).
ccrystallinity obtained from DSC (first run).
dglass transition temperature obtained from DMA.
evalue before melt mixing.
fvalue after melt mixing.
gNA = material not available.
hBS = brittle sample, that cracked while being cut from the pressed foil, therefore, it could not have been subjected to any measurement.
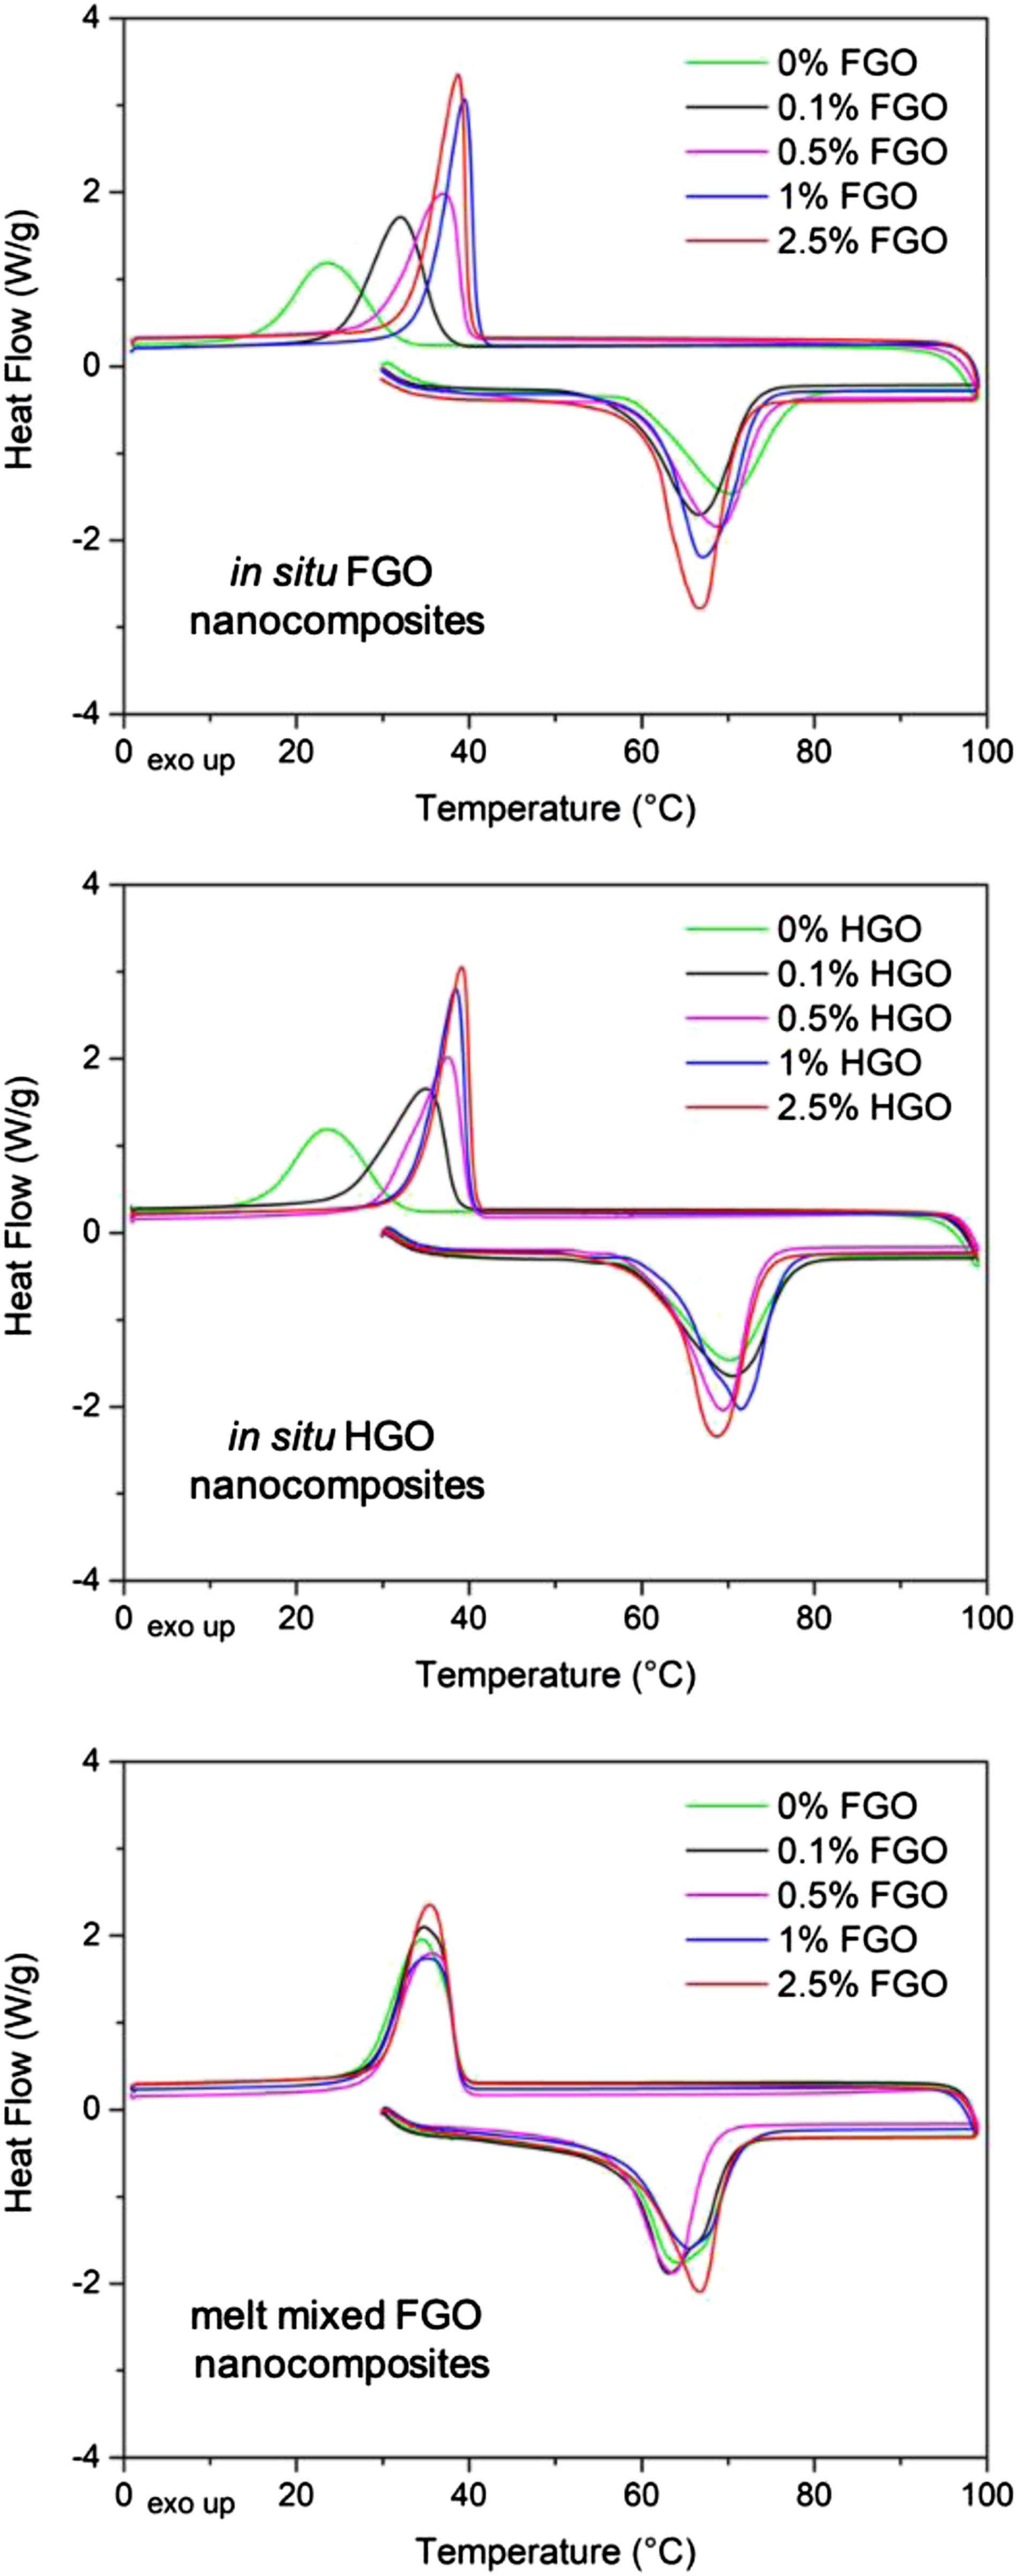
Differential scanning calorimeter curves of polycaprolactone nanocomposites.
Second, dynamic mechanical analysis provided an additional information about the polymer-nanofiller interactions, because nanofillers can restrain the mobility of polymer chains resulting in an increased glass transition temperature (Tg). 20 Indeed, we can see that the Tg of in situ polymerized nanocomposites increased by 4°C at 1 wt% of both GOs and then remained constant (Table 4). On the other hand, the melt mixed nanocomposites did not show any significant change in the Tg values. An analogy to our results can be found in the work of Liao et al., 21 who compared solvent blending and in situ polymerization to synthesize PMMA nanocomposites. The authors reported a higher increase in Tg values for chemical blending (in situ polymerization) than for physical blending (in solvent) and related such behaviour to the different level of interactions between the polymer and the nanofiller. This analogy suggests that in situ polymerization provides nanocomposites with a higher level of polymer-nanofiller interactions than melt mixing.
Morphology of nanocomposites
X-ray diffraction pattern of melt mixed nanocomposite with 2.5 wt% of FGO shows a peak at 12° that can be ascribed to FGO aggregate with a slightly reduced interlayer distance (Figure 5, detailed explanation in ESI). Nevertheless, in situ polymerized nanocomposites with both GOs showed only shallow peaks around 10°. This suggests that in situ polymerization pronounces the dispersion and exfoliation even in the case of HGO, the signal of which was around seven times stronger than the signal of FGO (Figure 2). X-ray diffraction patterns of virgin polycaprolactone, melt mixed (MM) and in situ polymerized (IS) nanocomposites with 2.5 wt% of freeze dried graphene oxide and hot dried graphene oxide; insets show the areas in range of x: 10–20° and y: 0–20,000 counts.
The optical microscopy indicates that although the agglomeration of GO sheets appear to some extent in all samples, in situ polymerized samples exhibit much better dispersion of GOs than melt mixed ones (Figure 6, SEM images on Figure ESI 4). This can be observed at all concentrations, although the largest difference is between 0.1 and 1 wt%. The comparison of the in situ polymerized samples suggests better dispersion for FGO samples. A very interesting feature suggesting partial exfoliation of FGO in 0.1 wt% FGO in situ polymerized nanocomposite is further described in ESI (Figure ESI 5). Optical micrographs of polycaprolactone/graphene oxide nanocomposites; red scale bar – 100 μm.
Mechanical properties
The choice of the synthesis method and the type and concentration of GO considerably influenced the mechanical properties of the nanocomposites (Figure 7, Table 5, Figure ESI 6 and 7). In case of the in situ polymerization, the increase in Young modulus was more pronounced for the FGO than for HGO nanocomposites. The melt mixed samples also showed increased tensile modulus. Nevertheless, the increase in Young modulus of melt mixed nanocomposites was not so significant as in the case of in situ polymerized samples. This difference can be clearly seen in Figure ESI 6, which shows the proportional improvement in Young modulus as compared to the unfilled sample. While the proportional improvement of in situ polymerized nanocomposites progressively increased up until 45% with increasing GO concentration, the improvement of melt mixed nanocomposites reached a plateau around 10% for all GO concentrations. Similar behaviour was also observed for the complex modulus values obtained by DMA measurements, where higher FGO concentrations even deteriorated the modulus of melt mixed nanocomposites (Table 5, Figure ESI 7). Moreover, the ductility of the polymer matrix remarkably decreased upon the addition of GOs, as was evidenced by the huge drop in elongation at break of all nanocomposites. In analogy to Young modulus, the influence of GOs on elongation was more pronounced for the in situ polymerized nanocomposites. Typical stress-strain curves of polycaprolactone nanocomposites. Mechanical properties of polycaprolactone/graphene oxide nanocomposites. acontent in polymerization mixture (in situ) or mixing batch (melt mixing). bYoung modulus obtained from tensile test. celongation at break obtained from tensile test. dcomplex modulus obtained from DMA. evalue after melt mixing. fNA = material not available. gBS = brittle sample, that cracked while being cut from the pressed foil, therefore, it could not have been subjected to any measurement.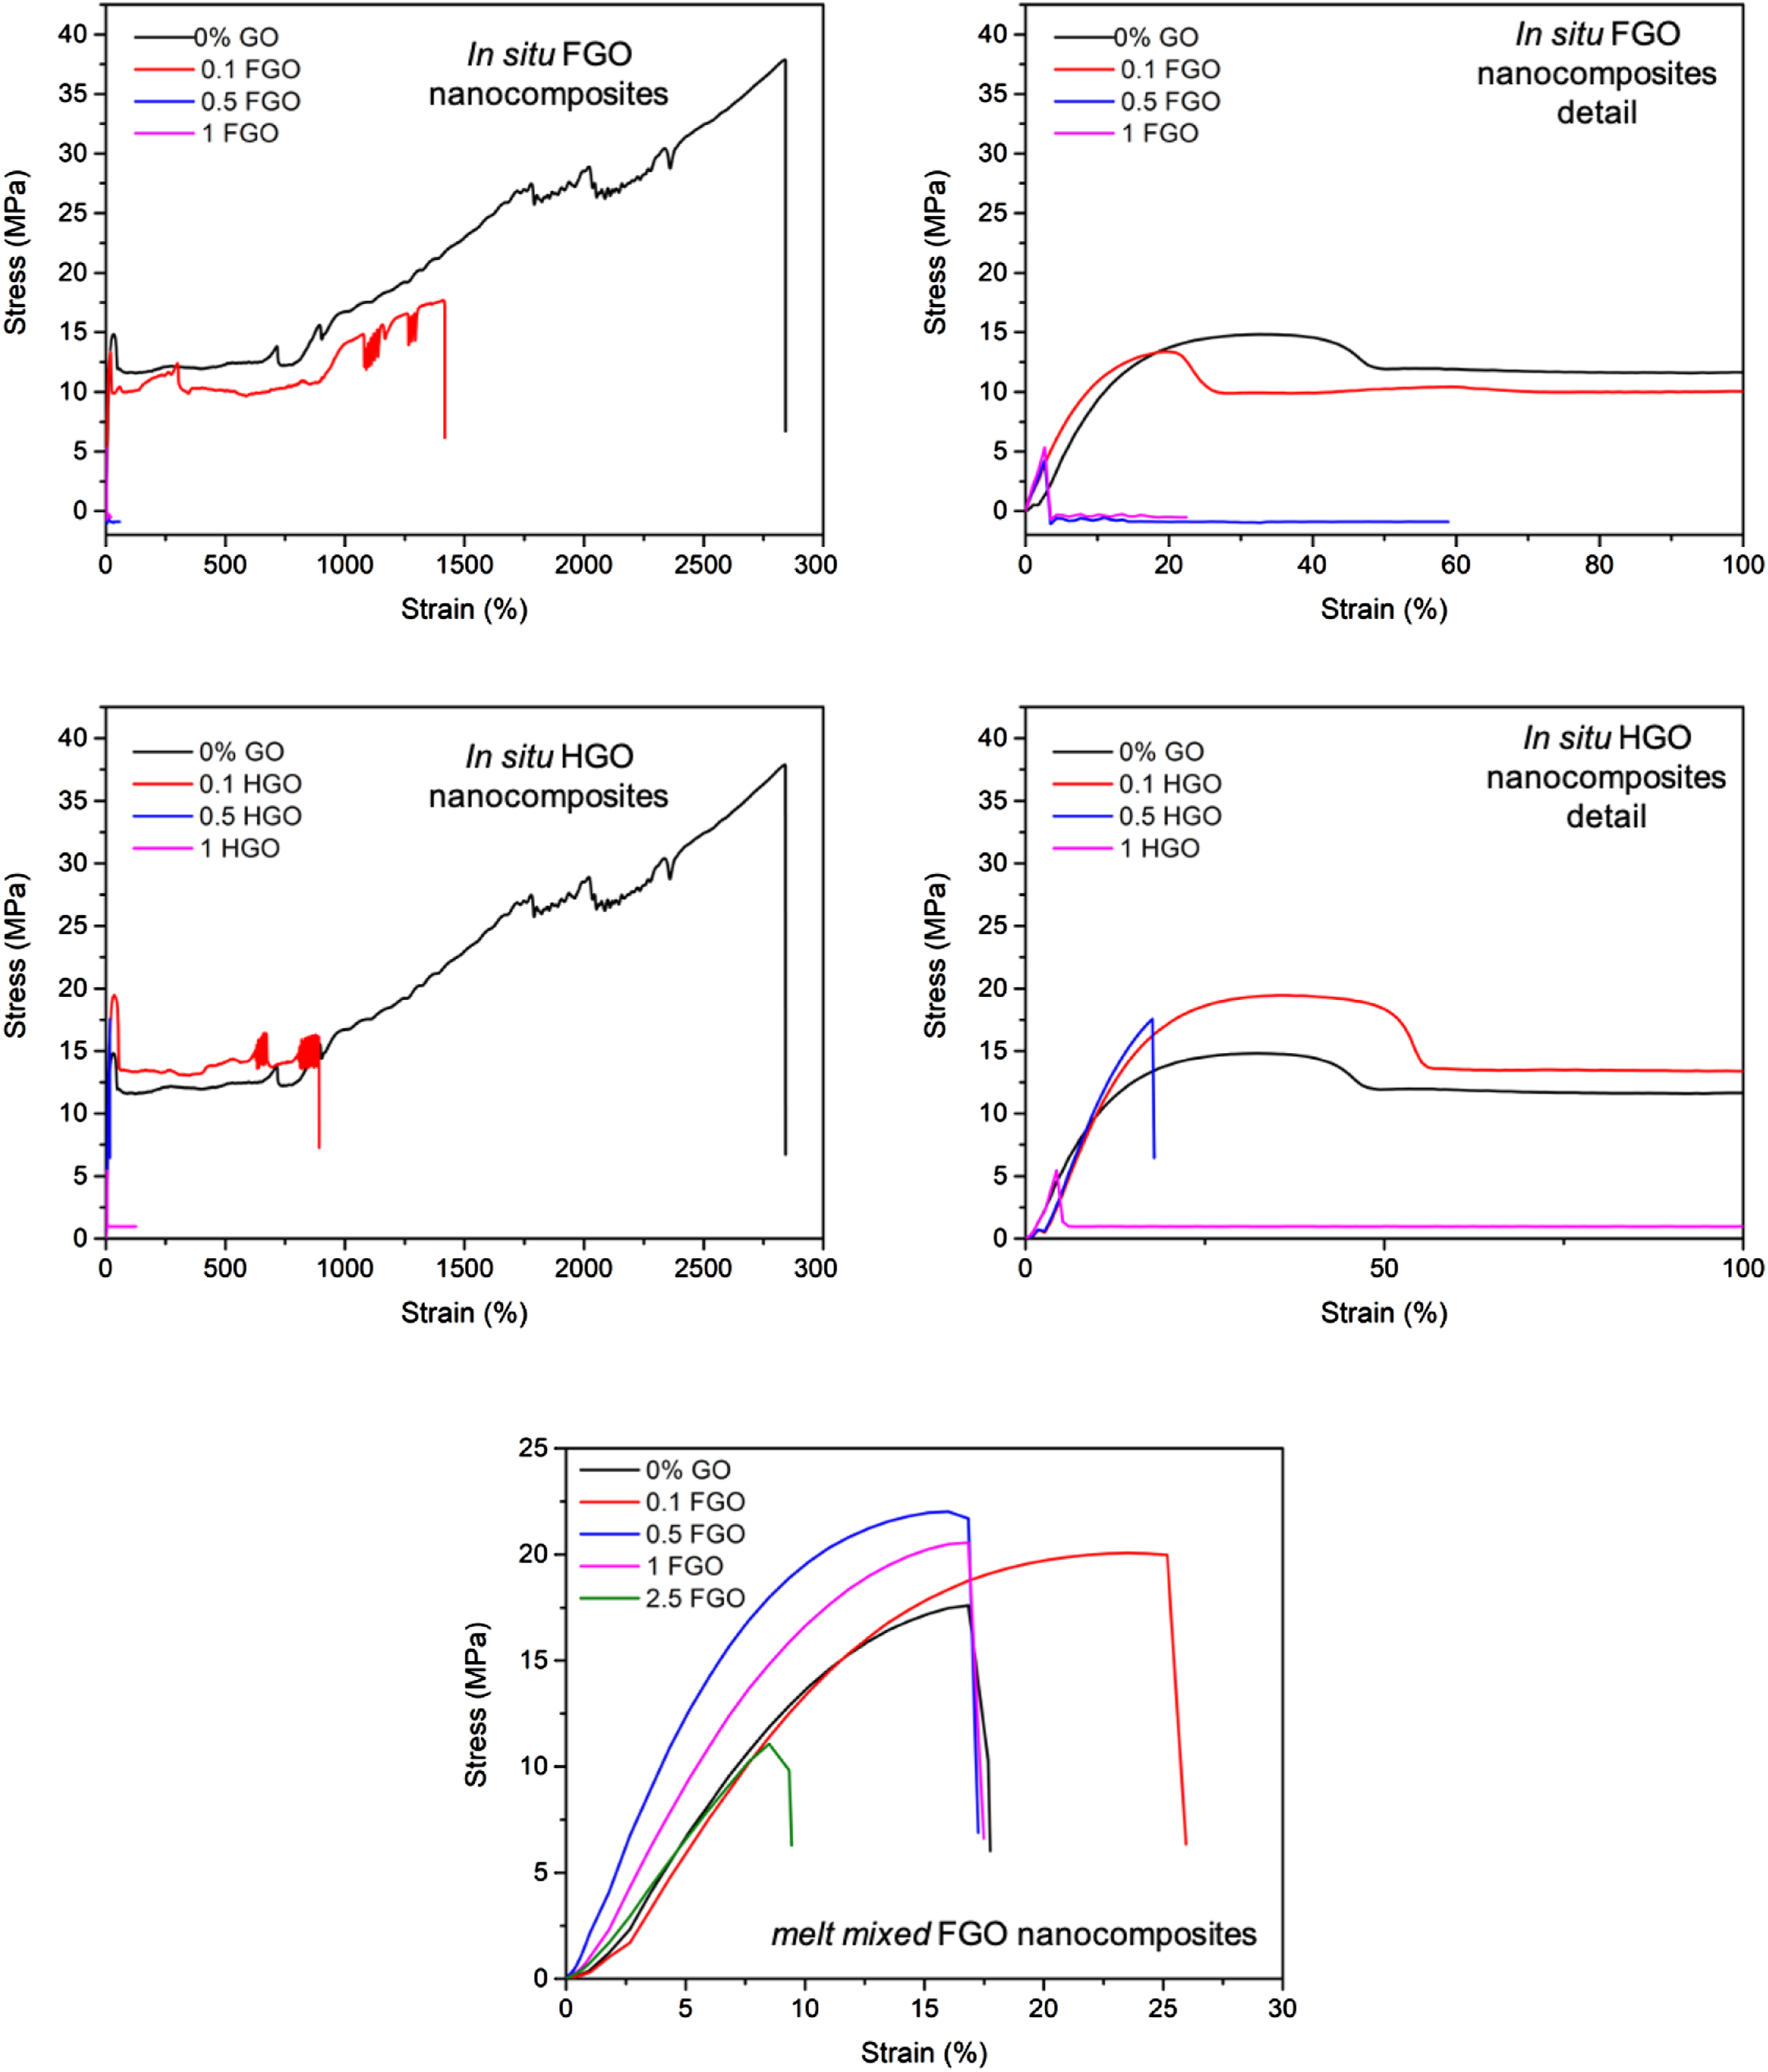

To assess the influence of different variables on mechanical properties of the PCLO nanocomposites, it is crucial to take into account their thermal and morphological properties. Optical microscopy and XRD suggest that in situ polymerized nanocomposites exhibit better dispersion of GOs and higher level of exfoliation in comparison with melt mixed nanocomposites. On the one hand, this suggests that ultrasonication is much more efficient in exfoliating FGO than melt mixing, although we must consider the higher treatment time of the former method. On the other hand, the residence time of the PCLO in the microextruder can not be considerably extended due to the limited thermal stability of the PCLO. The better dispersion in FGO nanocomposites resulted in much higher number of polymer-nanofiller interactions that finally promoted the superior mechanical properties of in situ polymerized nanocomposites over melt mixed ones. We can also examine the various impact of GO type on properties of in situ polymerized nanocomposites in a similar manner. Hot-dried GO showed a 13-fold decrease in surface area and increased tendency to aggregate when compared with FGO. Therefore, in situ polymerized nanocomposites with FGO significantly surpassed those with HGO with respect to their mechanical properties.
However, the overall discussion on mechanical properties should not omit the effects of molar masses and crystallinity. We can see a notable difference between mechanical properties of unfilled samples. The Young modulus of unfilled melt mixed sample exceeded the modulus of its in situ polymerized counterpart by 22%. This might seem quite surprising, because the matrix for melt mixing had three times lower molar mass (Table 3). Such counterintuitive finding becomes reasonable when considering the crystallinity of the nanocomposites (Table 4, Figure ESI 2). Despite the difference in crystallinity between the melt mixed and in situ polymerized unfilled samples being rather small (67% melt mixing, 60% in situ), the recent findings of Eriksson et al. suggest that even such small variation can cause a significant increase in mechanical properties of PCLO with lower molar mass. 22 Consequently, the bigger improvement in mechanical properties of in situ polymerized nanocomposites can be considered as a conjunction of increasing crystallinity and reinforcing effect of the GO sheets. Further comparison with literature data and corresponding discussion are provided in ESI (Table ESI 2).
Conclusion
We suggest that the in situ polymerization method favours the dispersion and exfoliation of GOs within the PCLO matrix, which subsequently boosts the crystallization of the PCLO matrix and improves the number of mutual interactions. The mechanical properties of in situ polymerized nanocomposites are then influenced not only by the presence of the GO sheets but also by the increased crystallinity of the polymer matrix. The choice of drying method of GO dispersion considerably affects the nanocomposite properties in that the freeze-drying method provides the GO with higher surface area. As a result, the FGO nanocomposites exhibited much more improved mechanical properties than HGO nanocomposites. To obtain the PCLO nanocomposites with improved mechanical properties, the application of in situ polymerization with FGO is highly recommendable.
Supplemental Material
sj-pdf-1-ppc-10.1177_09673911211068923 – Supplemental Material for The effect of nanocomposite synthesis and the drying procedure of graphene oxide dispersion on the polycaprolactone/graphene oxide nanocomposite properties
Supplemental Material, sj-pdf-1-ppc-10.1177_09673911211068923 for The effect of nanocomposite synthesis and the drying procedure of graphene oxide dispersion on the polycaprolactone/graphene oxide nanocomposite properties by Jaroslav Minář, Jan Doležal and Jiří Brožek in Polymers and Polymer Composites
Footnotes
Acknowledgements
The authors would like to thank François Tournilhac from ESPCI Paris for optical microscopy of nanocomposites and Jiří Minář for proofreading.
Declaration of conflicting interests
The author(s) declared no potential conflicts of interest with respect to the research, authorship, and/or publication of this article.
Funding
The author(s) disclosed receipt of the following financial support for the research, authorship, and/or publication of this article: This work was supported by the specific university research (MSMT No 21-SVV/2019).
Supplemental material
Supplemental material for this article is available online.
References
Supplementary Material
Please find the following supplemental material available below.
For Open Access articles published under a Creative Commons License, all supplemental material carries the same license as the article it is associated with.
For non-Open Access articles published, all supplemental material carries a non-exclusive license, and permission requests for re-use of supplemental material or any part of supplemental material shall be sent directly to the copyright owner as specified in the copyright notice associated with the article.