






Abstract
Present study investigates the possibilities of the effect of fillers (coconut and eggshell) on the fatigue, creep and tribological (wear and friction) performance of fibers (jute and flax) reinforced epoxy composites. The fatigue test results revealed that the Flax/Epoxy/Coconut Shell Powder composite exhibited the highest fatigue life and achieved maximum fatigue cycles at different ranges of the ultimate tensile strength (UTS), respectively, while the creep analysis demonstrated superior dimensional stability for the same composite. Frictional analysis revealed that all composite specimens exhibited maximum friction force values at an applied load of 50 N and a sliding speed of 5 m/s. The coefficient of friction was between 0.29 and 0.85 at a 3 m/s sliding speed and a 30N load for all the developed samples. Wear test results showed that a minimum SWR of 3.82 mm3/N-mm was achieved by JEE composite while maximum SWR was 15.08 mm3/N-mm by pure epoxy sample at 3 m/s sliding speed and 10 N applied load. JEC composite achieved the highest interfacial temperature among all prepared specimens at 15°C, 36°C, and 65°C for 10, 30 and 50 N applied load at 5 m/s sliding speed. The Scanning electron microscopy appears in the presence of wear out surfaces after tribological test and helps to identify the failure mechanism after tribological performance. The morphological analysis of the FEE and FEC composites uncovered lengthened fracture patterns and broad matrix surface breakage. Additionally, fiber debonding and sliding during tribological analysis led to significant matrix damage.
Keywords
1. Introduction
Environmental degradation due to huge consumption of fossil fuels, synthetic plastics and metallic materials impacts harmfully impacts all living organisms on the earth as well as depleting the ozone layer. 1 These synthetic materials produce toxic gases at the time of degradation which are very harmful for human health. Strict government laws counter toxic plastic and synthetic metals and force the researchers and scientists to discover different materials developed from natural resources and non-toxic chemicals. Some natural resources are utilized as a reinforcement and matrix to form biodegradable materials with non-toxic behaviors. 2 Composite materials combined with polymer matrix and reinforcement utilize various bio resins as matrix material and natural fibers as reinforcement. These natural fibers and resins are extracted from numerous parts of plants, animals and minerals.3–5
Some reinforcements for composite materials extracted by the plants such as jute, coconut, flax, kenaf, ramie, bagasse etc. 6 These reinforcements collected from the plant stems, leaves and their fruits. Animals also provides the reinforcement for composites like animal hairs, wool, chicken feather, cow dung etc. These reinforcements are collected from the animal’s skin, hair and their waste. Mineral like asbestos serves as a non-toxic reinforcement to develop the composite material. Various bio-reins extracted from the banana sap, coconut sap, plant oils, corn, soybeans, sugar cane, vegetable oils, whey, and algae serve as a matrix material to forms the biodegradable composite materials. 7
The addition of fibers and matrix materials forms composite materials, but their strengthening and compatibility disrupts by the low wettability of smooth fibers with polymer resin and other parameters like air entrapment, voids and porosity occurs during the manufacturing phase. These parameters lower the strength of developed composite materials and reduce their resistance to wear during sliding operations. 8 During sliding operations, low interfacial adhesion between fiber reinforcement and matrix material causes fiber debonding from the matrix, which results in a high wear rate in the composite material. This effect can be minimized and eliminates by the incorporation of fillers between fiber and matrix phase. Addition of fillers enhances the wettability between reinforcement and matrix and serves as a bonding agent by eliminates the possibilities of voids and air entrapment. These fillers improve the interfacial strength and overall stability of the composite materials. Different size (micro to nano) and geometries (1D, 2D and 3D) of fillers also play a vital role to decide the mechanical and tribological behaviour of developed composite materials. Utilization of bio fillers like coconut fillers, eggshell fillers, seashell fillers, walnut fillers etc. Imparts the biodegradability to the developed composite materials. 9
Adding fillers and fiber reinforcement with polymer resin delivers enhanced structural stability and strength to composite material. The composite materials are then transferred to the different applications. 10 Some applications include dynamic loadings and sliding surfaces between two different composite materials. Sliding applications require the analysis of developed composites through tribological analysis and different dynamic loadings require the mechanical characterization of composite specimens to implement the application constraints. Tribological analysis involves performing sliding tests of composite specimen against steel counterface which evaluates the frictional forces applied by the specimen against sliding surface and specific wear rate. These characteristics withstand the developed materials in numerous applications like automotive parts as seat liners, dashboards, door panels etc., civil constructions like window panels, shipping and aerospace industries.11,12 The development of high-performance, low-cost eco-composites with load-bearing applications like light automotive structural parts, agricultural machinery covers and panels and industrial housings exposed to cyclic loads. Improved tribomechanical and sliding wear properties of developed composite makes them suitable for parts with frequent frictional contacts, like protective guards and sliding panels, sports equipment parts. Application of developed composites in real world manufacturing processes consist of Material Formulation & Compounding by varying the optimal proportion of eggshell and coconut shell powder by the manufacturing techniques like, twin-screw extruders, high-shear mixers and resin infusion systems. The developed bio composite can be faultlessly incorporated into common processes like vacuum-assisted resin infusion (VARI), compression moulding and resin transfer moulding (RTM).
In tribological analysis, orientation of specimens against sliding surface and geometry of reinforced fibers plays an important role for friction generation. When fibers encounter sliding surface then they resist the sliding of the specimen, and this phenomenon generates frictional force. The longitudinal and transverse directions of fibers and normal and perpendicular direction of specimens against the sliding counterface influenced the frictional force. 13 Thus, prior to application in any sliding surfaces of developed composites, analysis of tribological performance is very much required. The output of tribological tests is influenced by the numerous parameters such as applied load, sliding speed, sliding time and material of sliding surface. These parameters govern the frictional force and wear rate during tribological analysis. Other factors are percentages of fiber reinforcement and matrix materials with orientation fiber reinforcement against the sliding surface which largely influence the friction and wear rate during tribology test of composite materials. When fiber reinforcements meet a sliding surface, they resist the movement of the specimen, creating a frictional force.8,9 The frictional force is influenced by the orientation of the fibers both longitudinal and transverse and the direction of the specimen relative to the sliding counterface, whether normal or perpendicular. Therefore, it is essential to analyse the tribological performance of developed composites before applying them to any sliding surfaces.14,15
The present study explored the extensive experimental investigations of tribological test based on input parameters of applied load (10, 20 and 30N) and sliding speed (1, 3 and 5m/s). Creep and fatigue analysis were also performed to analyze the static and dynamic characteristics of developed composite. This study focused on the addition of coconut shell and eggshell fillers and their effect on bio-fiber and fillers based reinforced epoxy composites and their hybrids. Based on the available literature on biobased fibers and filler-reinforced epoxy composites, no previous studies have been identified specifically to examine coconut shell and eggshell fillers in combination with jute and flax fibers within a single composite system. Coconut shell and eggshell powders are abundant, low-cost agricultural wastes,16–18 and their usefulness in enhancing composite dynamic and tribological properties is demonstrated in this study. The study contributes to the sustainable materials development with eco-friendly alternatives to synthetic fillers like talc, silica, and carbon black. Moreover, the existing research does not simultaneously address the creep, fatigue, and tribological performance of such hybrid composites in one comprehensive manuscript. This highlights a significant research gap, indicating the need for an integrated investigation that evaluates all three dynamic and wear-related behaviors for these environmentally friendly composite materials. The present study would provide the roadmap for prioritizing the selection of various fillers to enhance the interface between matrix and reinforcement and their effect on tribological performance (frictional force, specific wear rate, coefficient of friction) of developed composite materials. Scanning electron microscopy (SEM) was staged to observe the worm out surface and reasons of worm out way afterward tribological analysis.
The objectives of the present study include investigating the coactive effect of coconut shell and eggshell fillers on the tribological, mechanical, and durability performance of jute/flax fiber reinforced epoxy bio composites under static, dynamic, and sliding conditions. Specific objective of work focused on the fabrication of jute/flax fibrous epoxy bio composites and their hybrid variations reinforced with coconut shell and eggshell fillers, and to evaluate the influence of bio-fillers on composite integrity and interfacial bonding. The interactive mechanisms of coconut shell and eggshell fillers in improving wear resistance and frictional stability of bio-fiber reinforced epoxy composites under dynamic sliding conditions was discussed in detail. Creep behaviour of the developed composites assessed their long-term deformation characteristics and dimensional stability under sustained static loading conditions while fatigue performance under cyclic loading to understand their dynamic response, damage evolution, and endurance characteristics. Wear mechanisms and surface degradation patterns of fractured specimens were identified using scanning electron microscopy (SEM) analysis.
2. Experimentation: Materials and methods
2.1. Fibers and matrix
Jute and flax fiber mats were supplied by Compact buying services, Faridabad (India). Both the fibers were reinforced in form of bi-directional mats. The fiber thickness was 0.75 mm. The GSM of jute fiber mat was 250 GSM and flax fiber mat was 180 GSM. Density of jute fiber mat was 0.85 g/cm3 and flax fiber mat was 1.25 g/cm3. Fiber mats were placed in an oven to eliminate any moisture before the fabrication of composites. Moisture content in the fibers can disturb the results of the water uptake behaviour of composite sample during water absorption test.19,20 Thus, it was needed to eliminate it by drying the fibers in the oven. All the natural fiber mats were supplied by Compact Buying Services, Faridabad (India).
2.2. Fillers
Two fillers (coconut shell powder and eggshell powder) were used with jute and flax fibers reinforced with polymer matrix to develop the composite specimens. The density of coconut shell powder and eggshell powder was 0.9 g/cm3 and 2.5 g/cm3 respectively. The size of the fillers used were measured to be 10-2400nm.21,22
2.3. Matrix
The matrix material used is epoxy resin Araldite LY 556 which is based on bisphenol-A and has a viscosity of 10,000 – 12,000 MPa*s and a density of 1.15-1.20 g/cm3 at 25°C. The hardener used was HY 951 which has a viscosity of 10-20 MPa*s and specific gravity of 0.98 g/cm3 at 25°C. The epoxy resin, hardener, and the releasing agent were purchased from Excellence Resins, Meerut, Uttar Pradesh. Figure 1 shows the methodology by presenting flow chart for the present study. In each composite, reinforced fibers and fillers were added with epoxy polymer matrix to fabricate the composite samples. Fabricated composite samples were named as jute/epoxy/coconut shell, jute/epoxy/eggshell, flax/epoxy/coconut shell, flax/epoxy/eggshell, epoxy/coconut shell and epoxy/eggshell composites. Methodology of fabricated composites of epoxy matrix and jute and flax fiber reinforcement with coconut and eggshell fillers.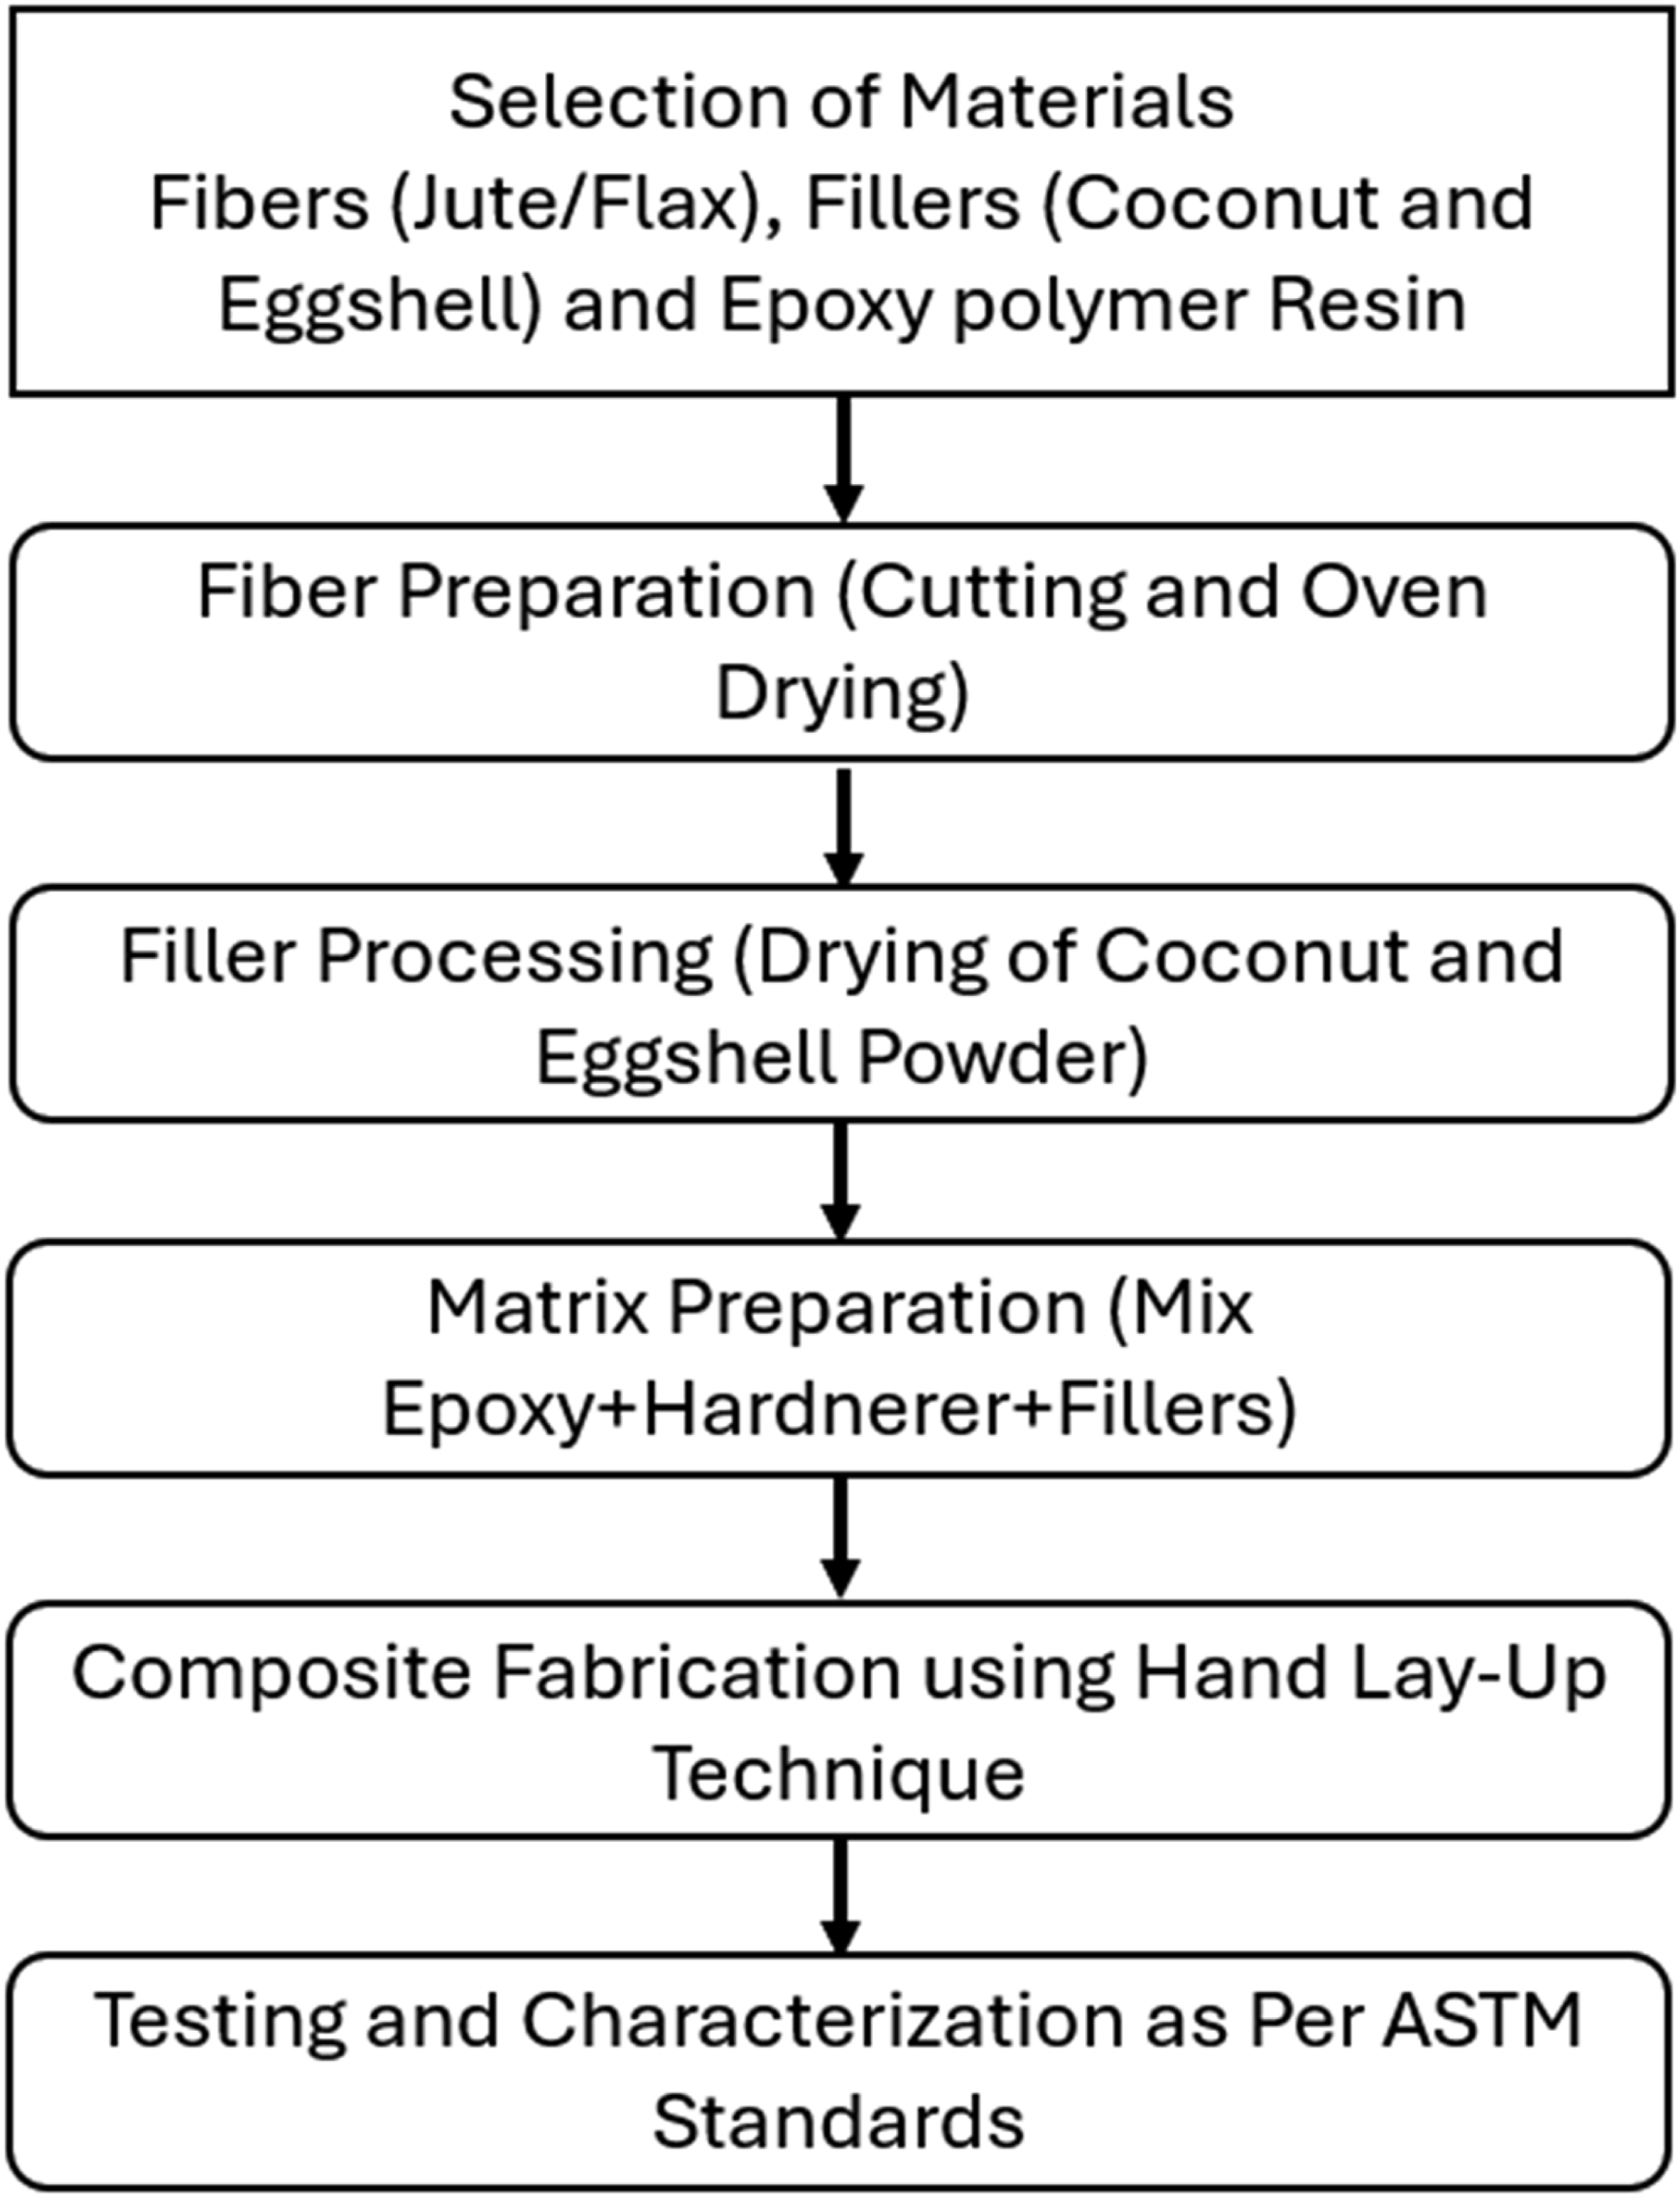
2.4. Processing
The hand lay-up technique using closed mold was used to construct the composite material specimens. First, a plastic sheet was put over the internal surface of the mold, followed by a layer of silica gel to prevent the epoxy polymer from sticking to any surfaces. After preparing the mold, the initial layer of epoxy resin mixed with fillers was applied to the mold cavity, and the first layer of fiber was laid on top. This process was repeated until the desired weight percentage of fiber and matrix material was achieved. The mold was then closed with the upper part, applying the required pressure.23,24 Composite samples were cured cure at room temperature without forced heat and a simple weight applied, equal to 7.5 kPa (0.0075 MPa) of pressure. After 36 hours, the mold was opened, and the cured composite specimen was removed. Then specimens were prepared for different characterizations based on ASTM standards. The combined weight percentage of fiber reinforcement and fillers was 30%, while epoxy constituted 70% of the composite. For the composite specimen without fiber reinforcement, 30% filler and 70% epoxy were used.
2.5. Fatigue analysis
Fatigue testing was accomplished to evaluate the fatigue response of the built composite specimens under fluctuating load conditions. All specimens were tested using a 5900 horizontal fatigue testing machine to determine the number of cycles until failure. The testing machine was supplied by PSI Sales Pvt. Ltd., and the test specimens were prepared in accordance with ASTM D3479 standards. The size of the fatigue test specimen was 200 mm in length by 25 mm in width.
2.6. Creep analysis
Creep tests were conducted to assess the behaviour of the created composite specimens under continuous loading at elevated temperatures. Test specimens were ready according to ASTM D7337 standards. The size of the creep test specimen was 400 mm in length by 30 mm in width. For the creep test, the applied load was set at 40% of the ultimate tensile strength of the composite. The maximum duration of the creep test was 15,000 seconds, with an operating temperature of 450°C.
3. Experimental set-up
3.1. Tribological properties
Tribological tests were conducted on DUCOM India, TR-20LE-PHM 400 tribometer. The tribometer operates with a steel counterface of hardened steel (EN-31). Steel counterface of tribometer having hardness of 64 HRC and surface roughness of 0.7 µm Ra. During tribological test, specimen held in specimen holder and rubbed against steel counterface with applied dead weight by a pulley and tribometer records the frictional force at every 0.9 seconds with time, time/revolution and temperature between counterface and specimen, and displayed all these parameters by the digital display indicators.
3.2. Wear testing
The input constraints for the tribological test contained sliding speed, applied load, and sliding distance. Specimens for the investigation were ready in accordance with ASTM G99-95 standards. The size of the wear test specimen was 30 mm in length by 20 mm in width. The range of input parameters was as follows: sliding speed (1-5 m/s), applied load (10-50 N), and sliding distance (1000-2000 m). These constraints were used to measure the output system of measurement of frictional force and specific wear rate. Coefficient of friction was calculated using friction force and normal load applied by the following equation.
24

Specific wear rate was calculated to analyse the wear behaviour of prepared specimens. Firstly, weight of sample before and after wear test was recorded by electronic balance (Shimadzu Japan, AUW. 220D). The least count of weighing machine was 0.001 mg. The difference in weights indicates the mass of the material worn away from the test sample. The specific wear rate of the test sample was calculated using the following formula.
24

4. Result and discussion
4.1. Fatigue analysis
Experimental results of fatigue test were used to calculate calculate the total number of cycles sustained by the specimen during fluctuating load as shown in Figure 2. All the specimens were test for fluctuating load at 25%, 50% and 75% of their ultimate tensile strength (UTS). Figure 2 gives the results in terms of fatigue number of cycles for every test specimen at their different ultimate tensile strength. From 25 to 75% of UTS, all the developed specimens show the substantial decrement in the fatigue number of cycles. Among all the developed composite pure epoxy represented the minimum number of fatigue cycles at each percentage of UTS. The minimum number of fatigue cycles indicated the brittle nature of pure epoxy matrix as compared to fiber reinforced composites. Incorporation of fiber reinforcement with epoxy polymer matrix enhancing the fatigue performance for each type of developed composites as compared to neat epoxy. The addition of coconut and eggshell powder with jute and flax fiber reinforced epoxy composite showed higher value of fatigue number of cycles as compared to coconut/epoxy and eggshell/epoxy composites at each percentage of UTS. Maximum number of fatigue cycles 3750, 3189 and 2176 was achieved by Flax/Epoxy/Coconut Shell Powder composite at 25, 50 and 75% UTS of developed specimen. Flax/Epoxy/Eggshell Powder achieved the second highest values of fatigue cycles at each range of UTS. Incorporation of coconut filler and eggshell shows the different values of fatigue cycles. Coconut powder added with jute/epoxy provides lower value of fatigue cycle as compared to eggshell added with jute/epoxy composite. Similarly eggshell powder added with flax/epoxy represent lower value of fatigue cycle as compared to eggshell powder added with coconut/epoxy composite. The reason behind this is the wettability and mixing of flax and eggshell is lower due to smooth surface of both eggshell and flax which shows the lower interfacial adhesion. Lower interfacial adhesion enhanced possibilities of cracking during fatigue analysis. While eggshell added with jute provides the better stability of interfacial adhesion due to different surface properties as compared to coconut added with jute that have almost similar surface properties. Rao et al.
16
investigated the fatigue properties of different thermoplastic composites reinforced with different nano fillers. Polymer was blended by varying the nano clay weight percentage (0.5, 1, 3, and 5 wt.%) using a twin-screw extruder. They found that incorporation of nano clay with polymer achieved the 30% enhancement in fatigue strength and improves the fatigue number of cycle. Similar findings were explained by Borrego et al.
17
for glass fibre reinforced epoxy composites added with nanoparticles. They found that composites with 1-2 wt.% of nano clays or carbon nanotubes additive into the matrix improves the fatigue strength of epoxy polymer composites. While higher percentages (above 3 wt.%) of nano clay or carbon nanotube addition decreased the fatigue strength due to poor nanoparticle dispersion and agglomeration. Fatigue analysis of all developed composite specimens.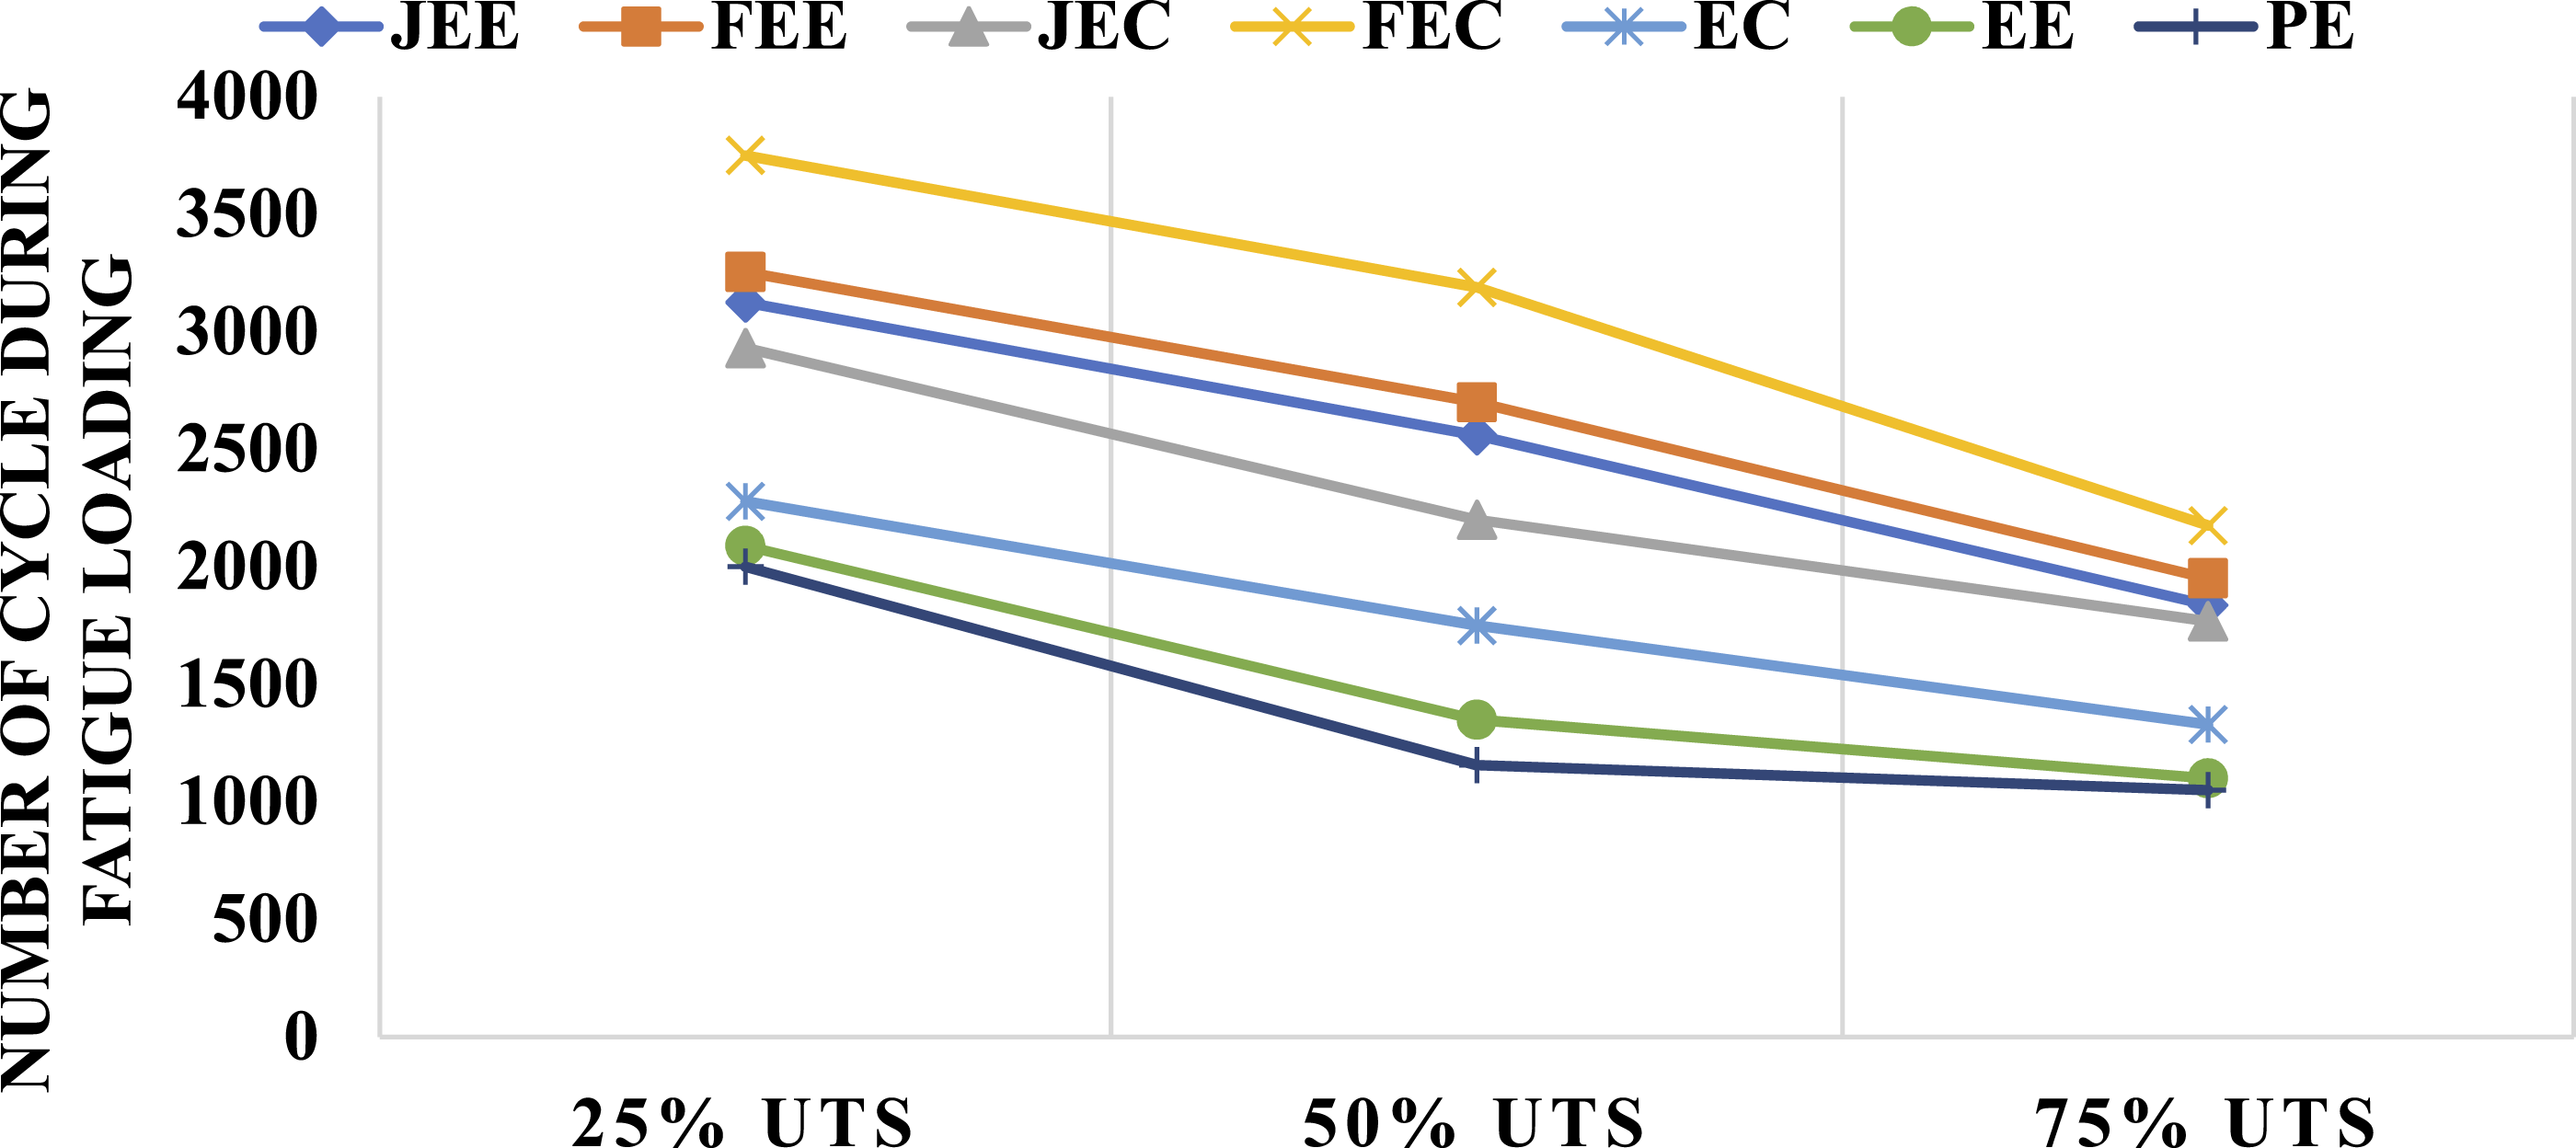
4.2. Creep analysis
Experimental results of creep test were used to calculate the creep strain with respect to time and temperature by the specimen during continuous load as shown in Figure 3. A creep test applies a steady load to a material, and the material slowly deforms (creep strain) over time. The amount of creep strain depends on both time and temperature. Figure 3 presents the data showing how the specimen deformed under constant loading conditions. Incorporation of fillers and fiber reinforcement resist the creep strain as compared to neat epoxy which shows the highest value of creep strain 0.031 at 15000s. Initially, from 0 to 2000 s, each composite and pure epoxy exhibited a rapid increment in creep strain. Between 4000 and 10,000 s, it became saturated for all types of composites. As the time exceeded 10,000 s, the creep strain of all composites increased rapidly. Among all the developed composite specimens, the flax/epoxy/coconut shell powder composite achieved the minimum value of creep strain, i.e., 0.0042, from 0 to 15,000 s. Flax/epoxy/eggshell powder achieved the second-lowest value of creep strain, i.e., 0.0051, at each range of time. Eggshell/epoxy and coconut/epoxy composites showed comparable creep strain values as compared to pure epoxy at every interval of time. However, both fillers added to fiber-reinforced epoxy provided improved creep resistance. The smooth surface of eggshell provided better stability and compatibility with rough jute fiber, and the rough surface properties of coconut filler exhibited better interfacial adhesion and strength with smooth flax fibers. The combination of flax with coconut and jute with eggshell achieved higher creep strain values, as shown in Figure 5. Naz et al.
18
investigated the creep strain of polypropylene composites filled with graphene nano filler. They found that the creep strain rate of the PP/RGO nanocomposite at 80 °C was reduced by 24%, 28%, and 22% compared to pure polypropylene when 0.2 wt.%, 0.5 wt.%, and 0.8 wt.% RGO were added, respectively. Similar experimental findings regarding the addition of fillers to polymer composites for creep strain were examined by Nuñez et al.
19
The authors investigated the effect of wood flour on the creep strain of polypropylene composites, and the wood flour content was varied from 0% to 60%. The authors found that, in general, the addition of wood flour decreased creep deformation, except at very high filler concentrations due to issues related to filler wetting and dispersion. Creep analysis of all developed composite specimens.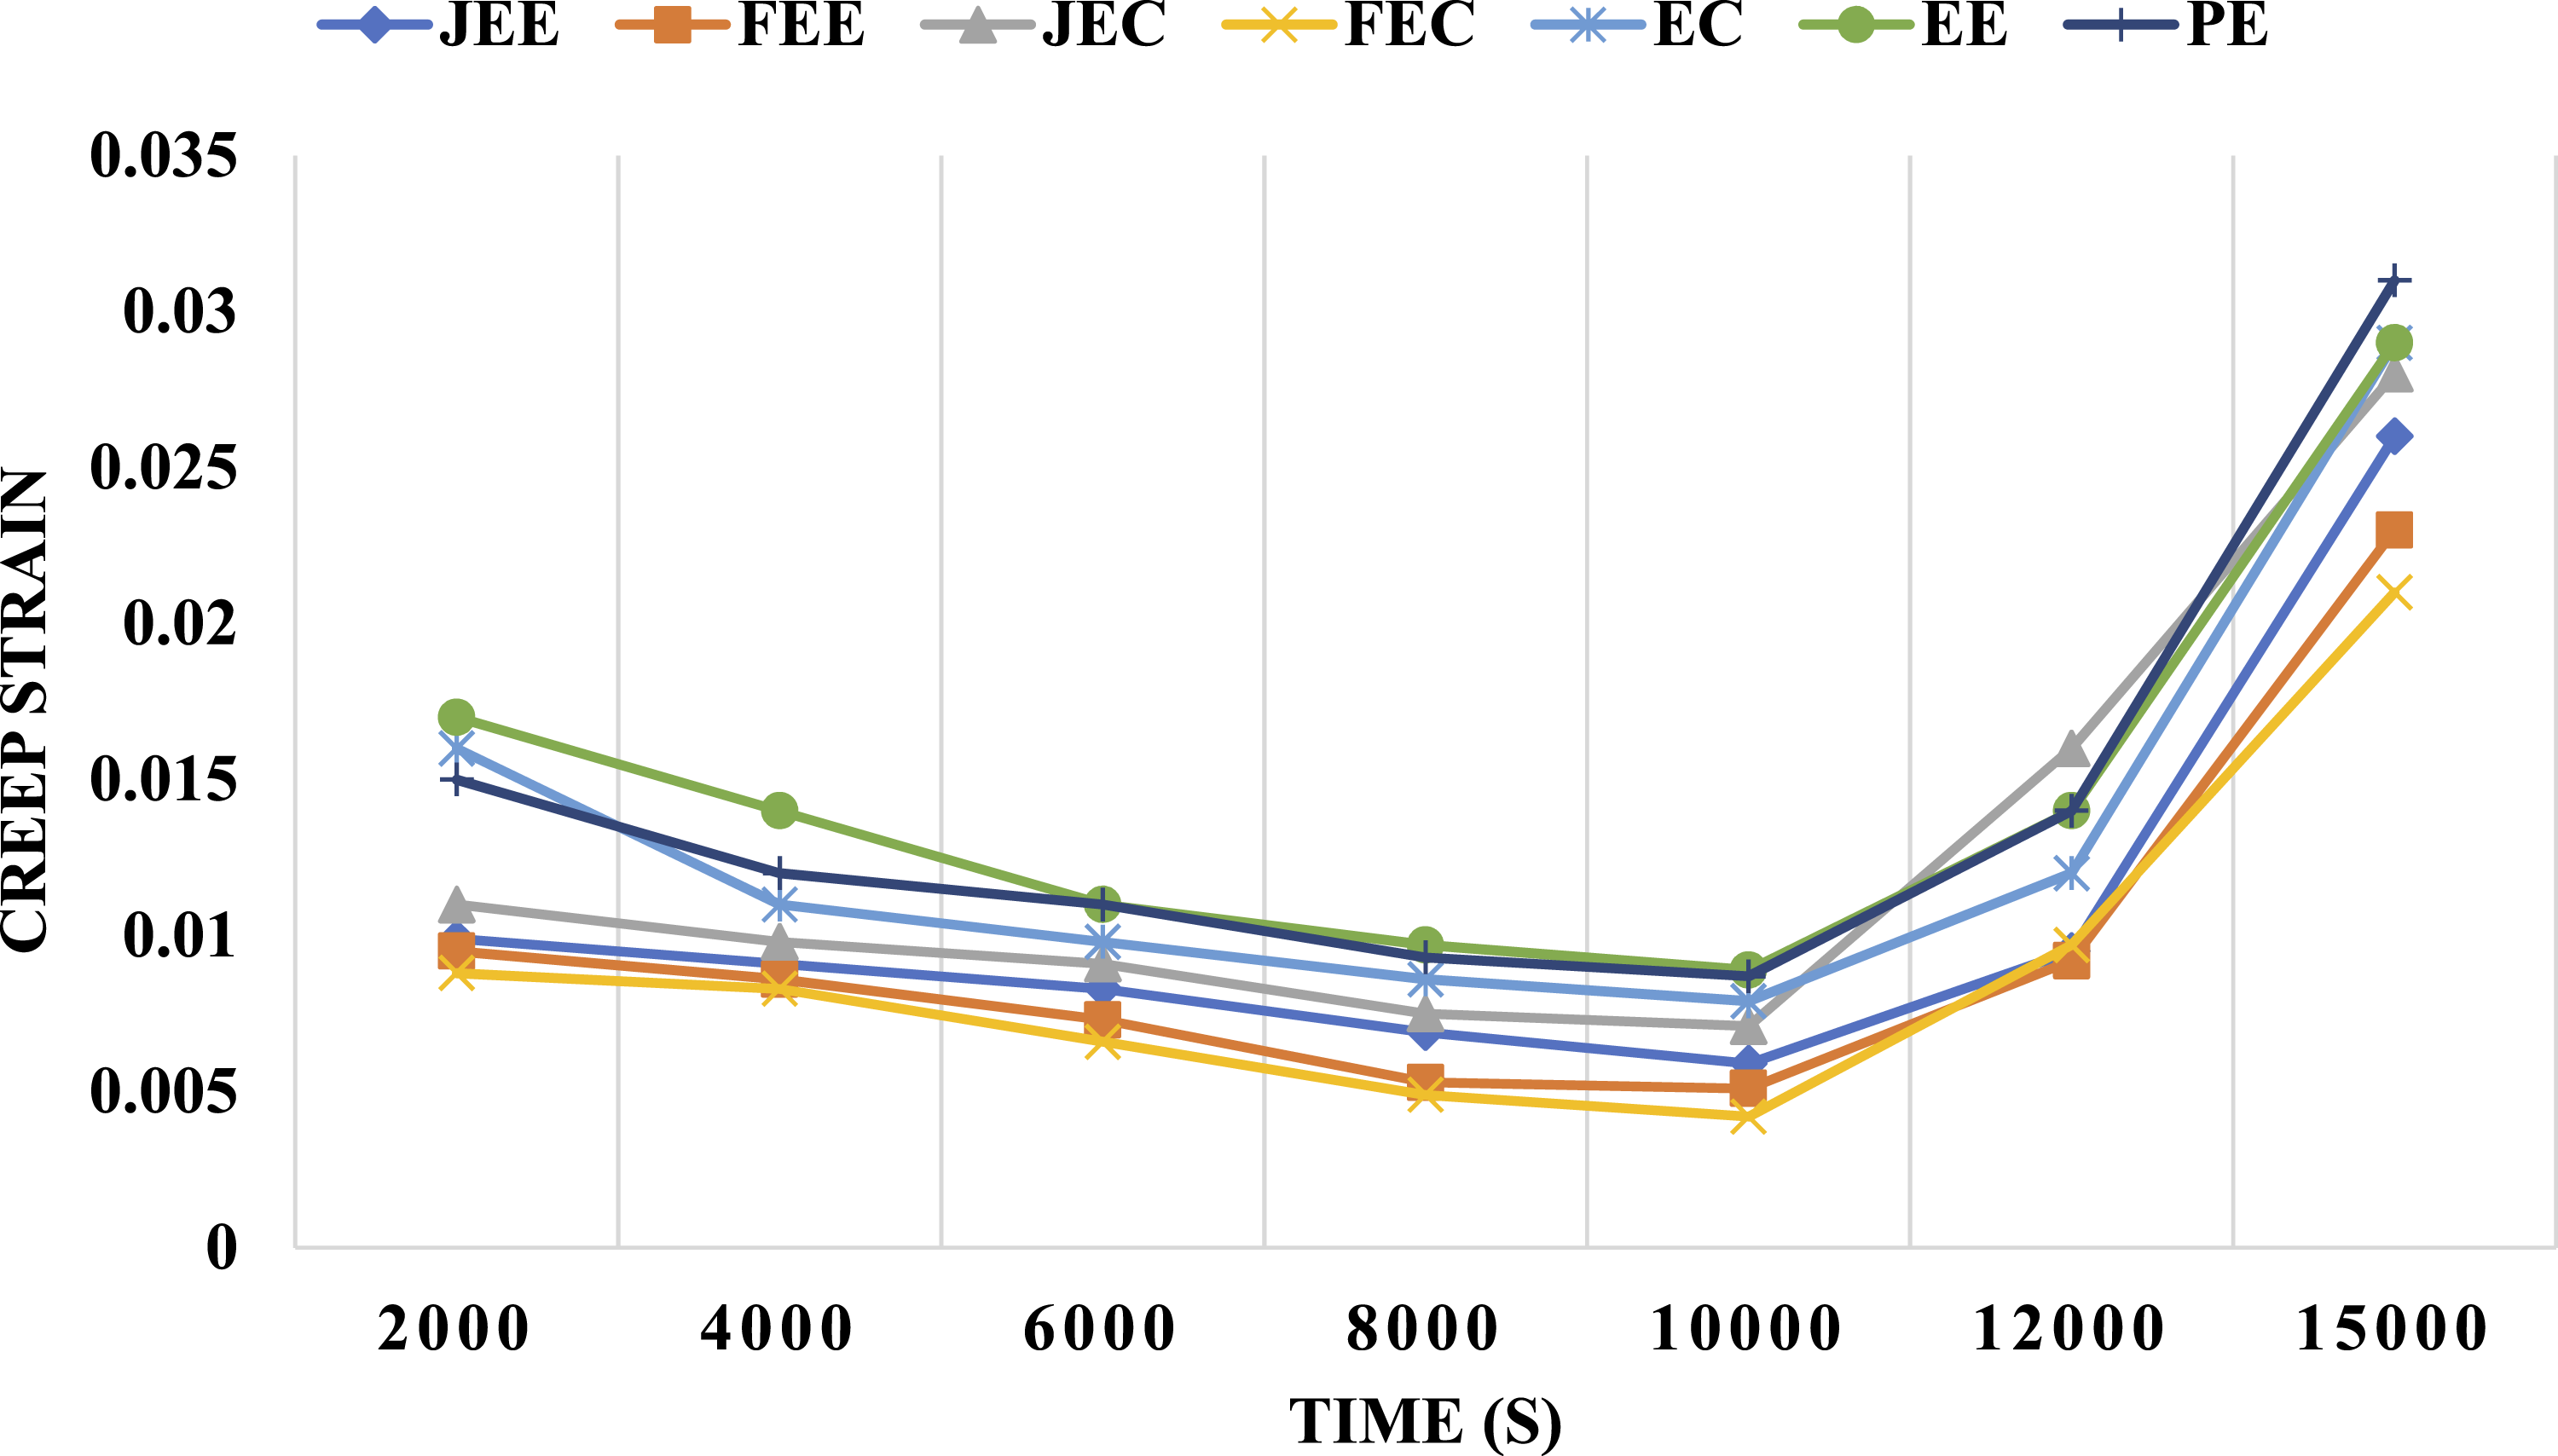
4.3. Friction force and coefficient
A computer-controlled tribometer measured the friction force of both the pure epoxy and all the composite specimens. The device recorded these friction force values repeatedly at intervals of 100 seconds. Figures 4–6 present these measurements. Friction force was recorded at the input parameters of different applied loads and a fixed sliding speed with respect to time. The applied load varied from 10 N, 30 N, and 50 N at a sliding speed of 5 m/s, as shown in Figures 4–6. For each applied load, friction force was plotted against time for all fabricated specimens at 5 m/s sliding speed. As the applied load increased from 10 N to 50 N, each developed composite specimen showed an increment in friction force. Moreover, friction force values for all samples increased rapidly from 0 to 500 s, and after that became constant for all samples at all applied loads. Frictional force at 10 N load and 5 m/s sliding speed. Frictional force at 30 N load and 5 m/s sliding speed. Frictional force at 50 N load and 5 m/s sliding speed.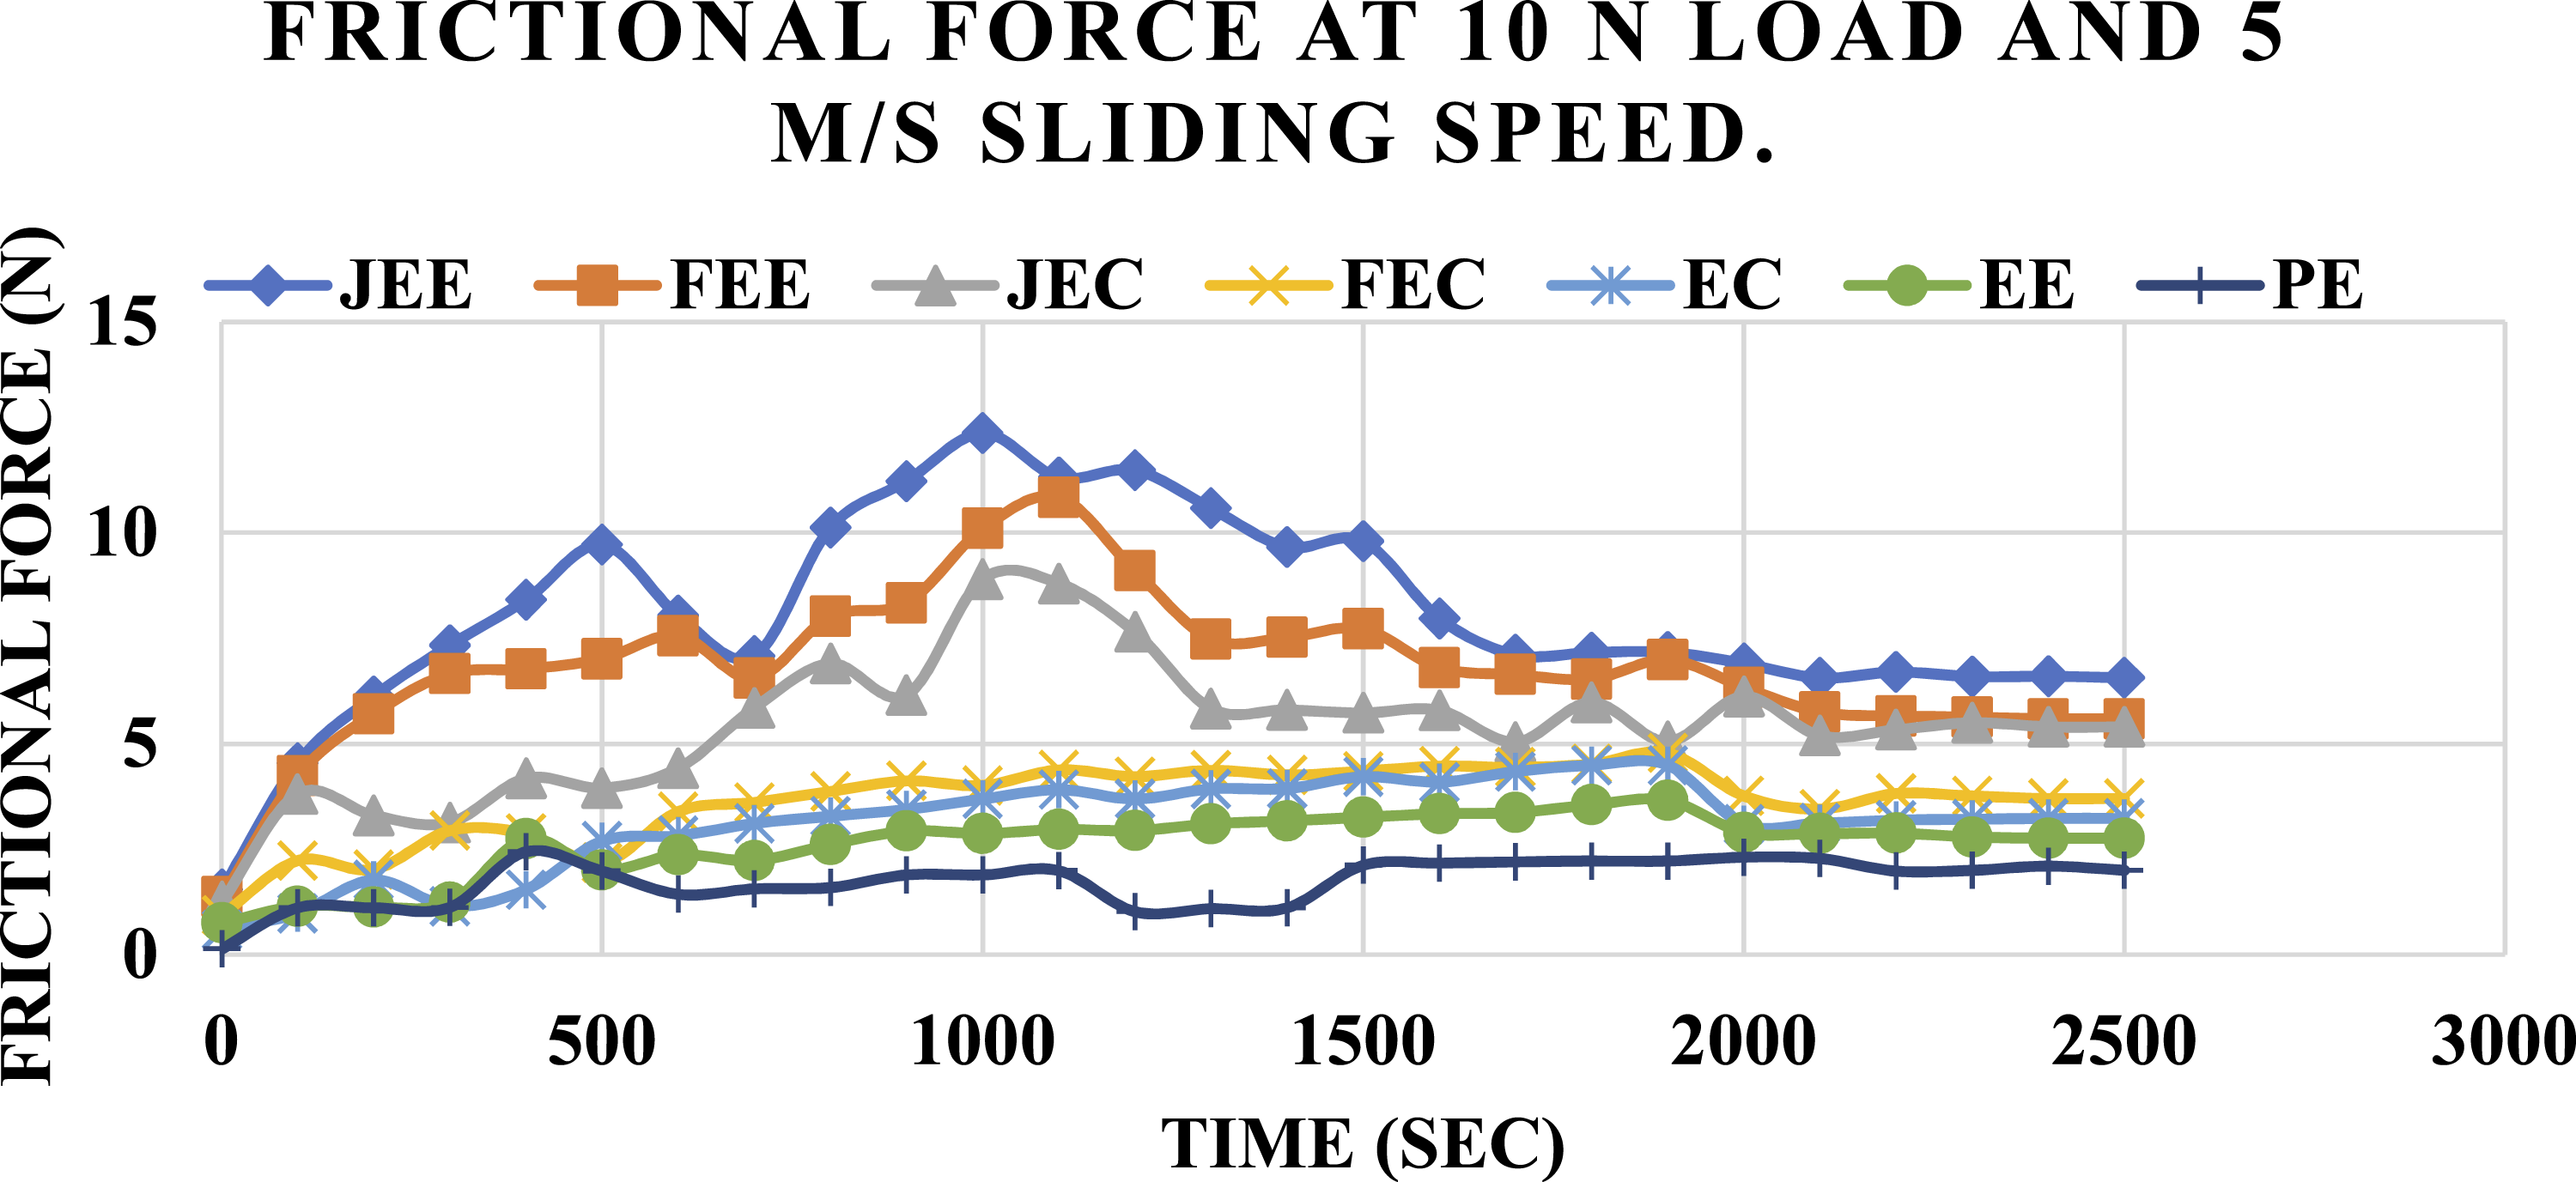
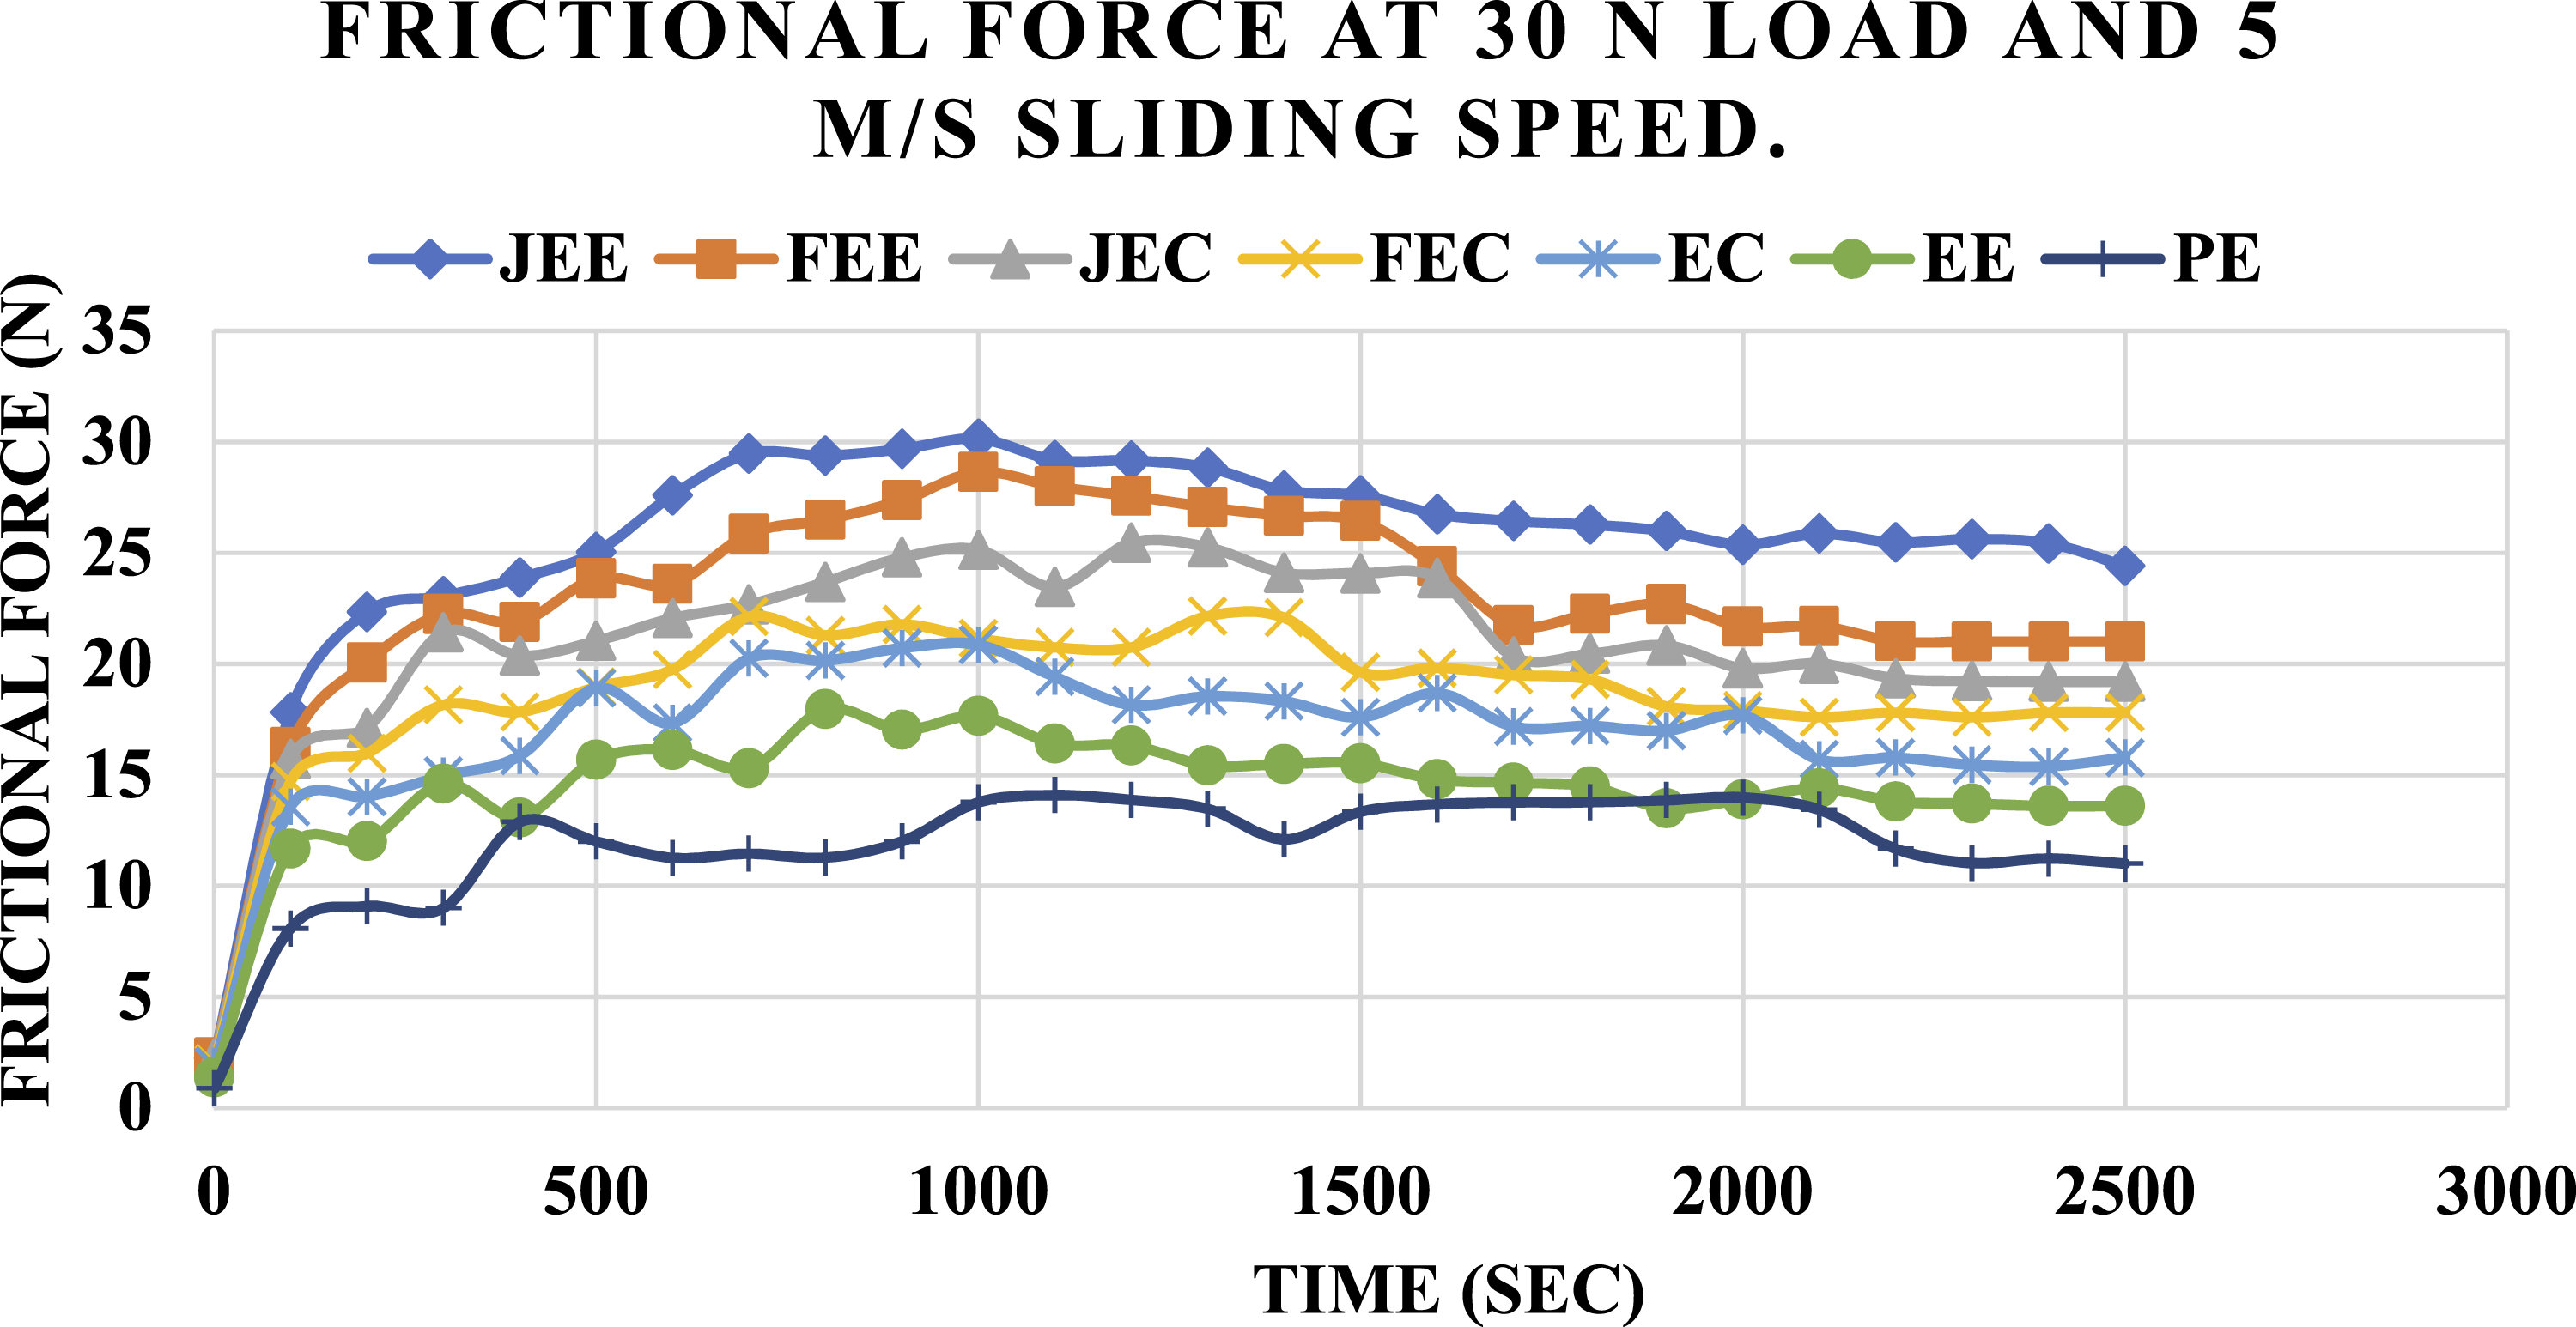
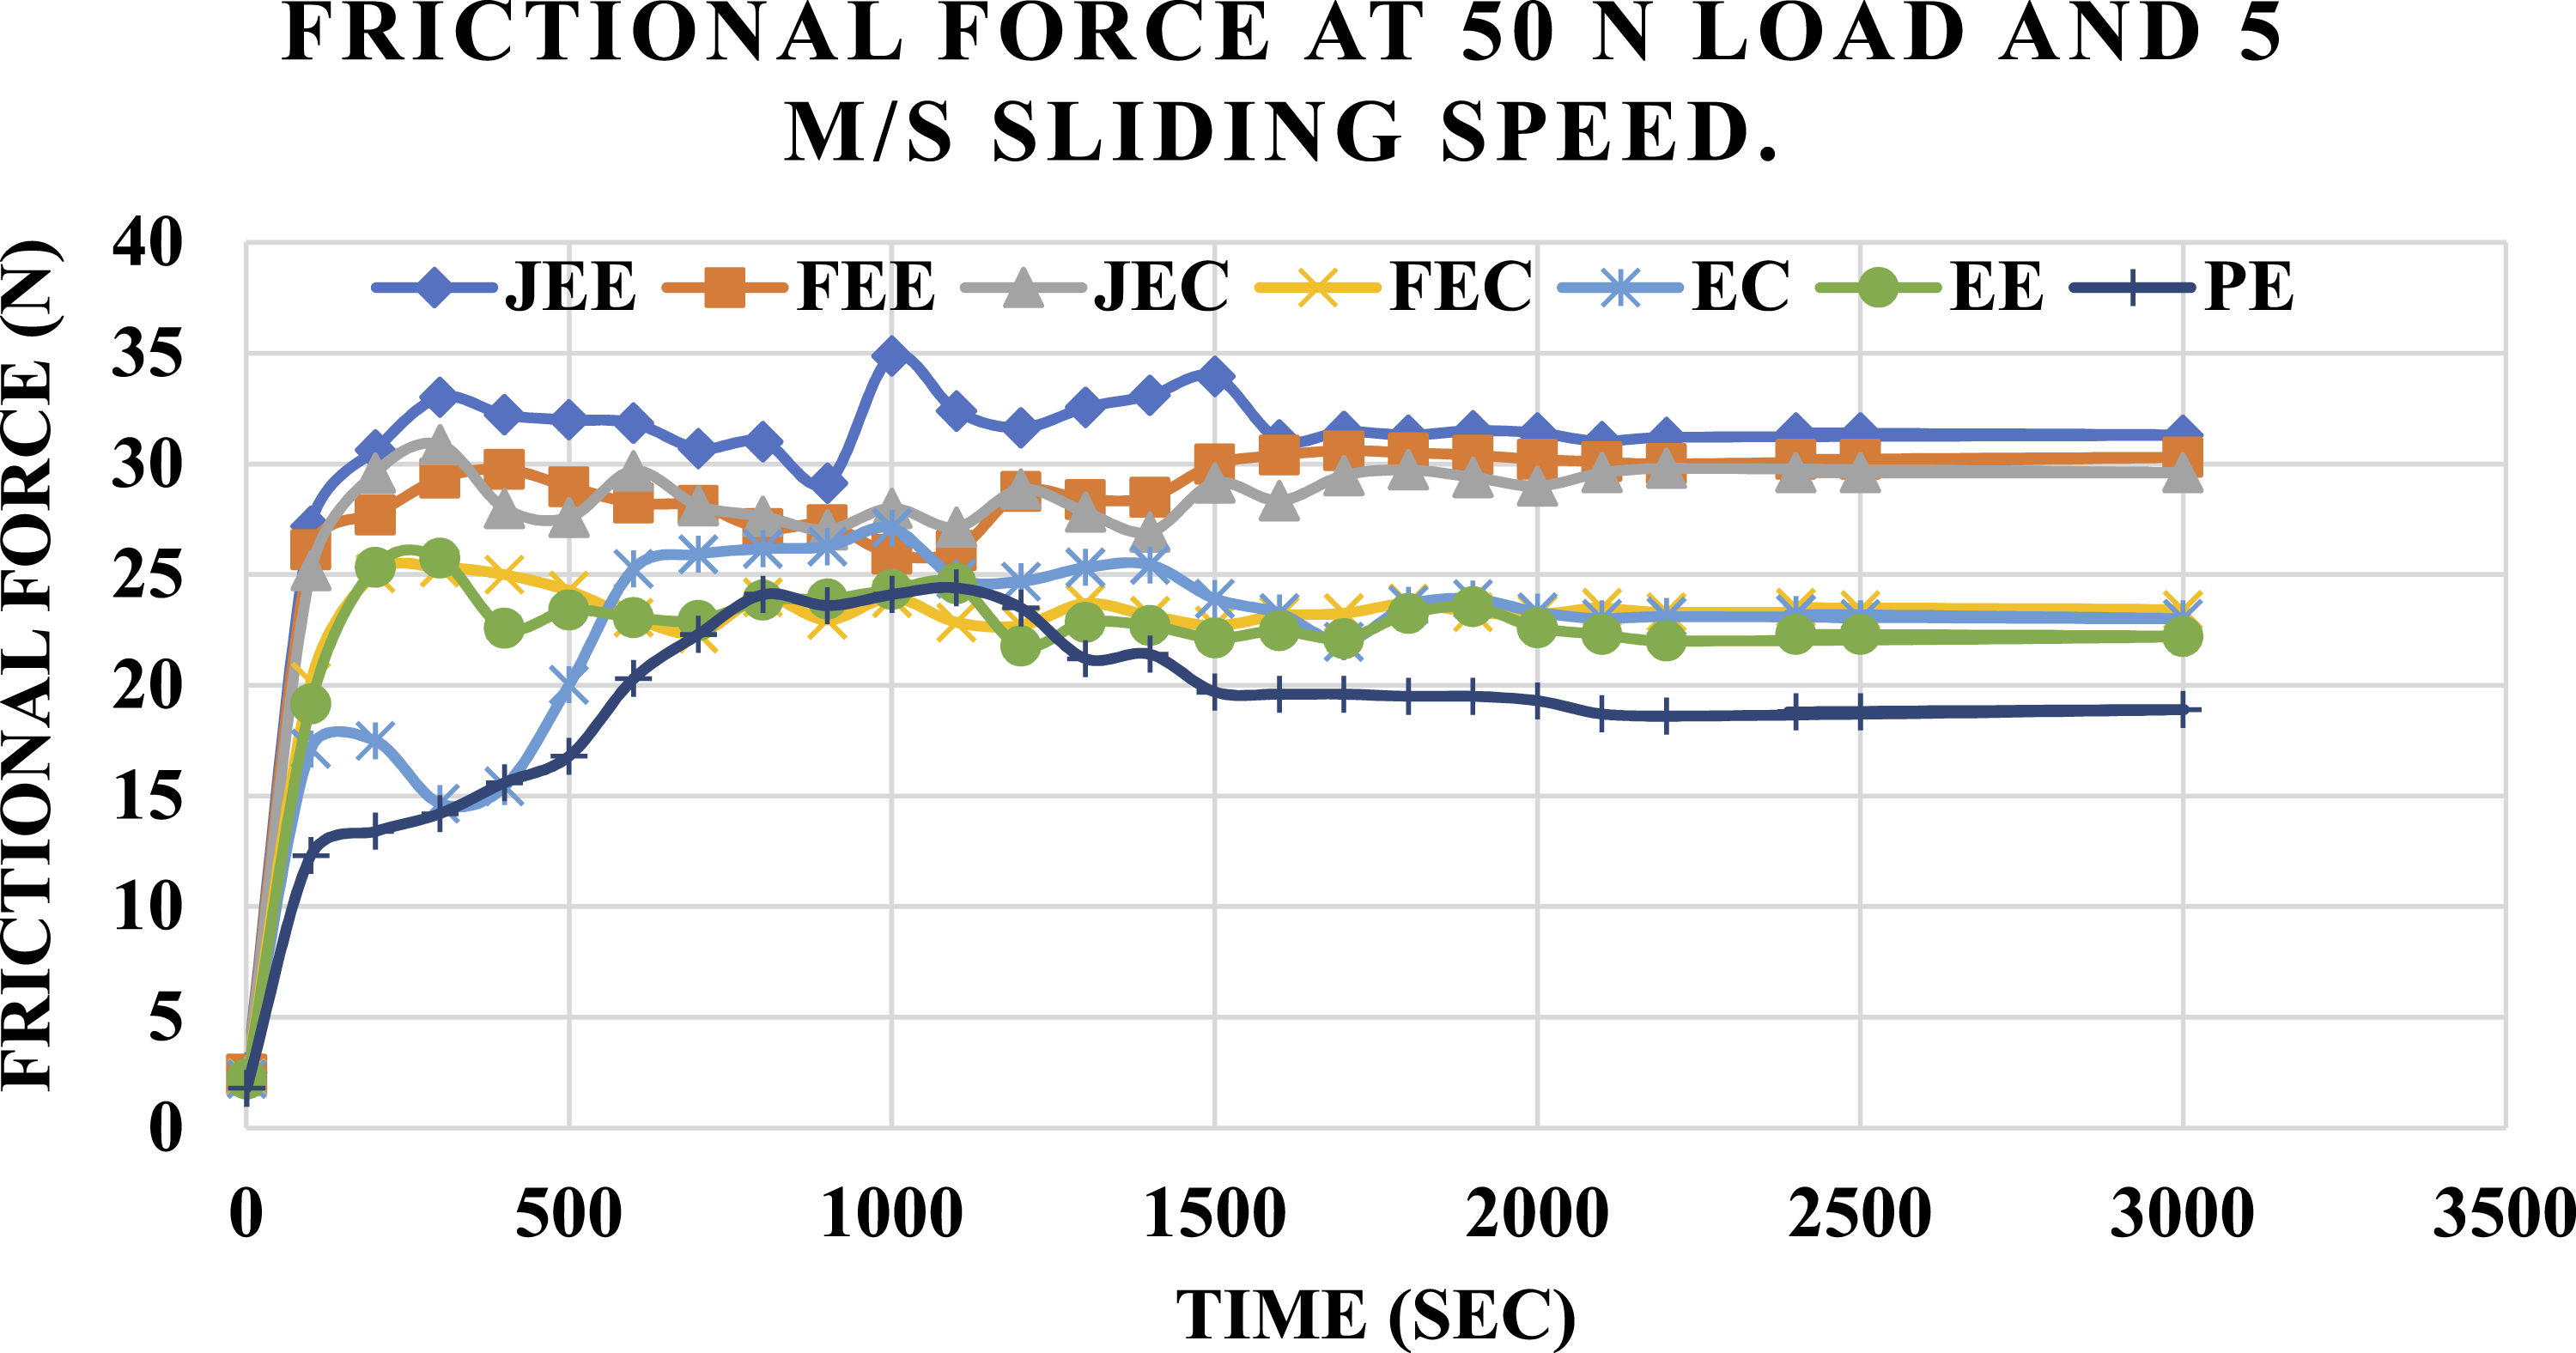
From the experimental findings of frictional force, the jute/epoxy/eggshell composite achieved the maximum frictional force for 10, 30, and 50 N loads as compared to all developed specimens. Among all the developed specimens, pure epoxy showed the minimum frictional force during tribological analysis. It is clear from the frictional force values that the incorporation of fiber reinforcement and nano filler enhanced the frictional properties as compared to pure epoxy. Epoxy reinforced with only fillers (coconut and eggshell) achieved lower frictional force values as compared to epoxy reinforced with both fillers and fibers. Hybridization of different fibers and fillers enhanced the interfacial adhesion between the fiber and matrix phases, and the incorporation of coconut and eggshell fillers minimized the possibility of void formation, which enhanced the friction force during tribological analysis. Better wettability of fibers and reinforcement due to low void content and good interfacial adhesion prevented the debonding of fibers from the matrix phase during sliding, which enhanced the frictional force of the developed composite specimens.20–23
For 10 N applied load, the maximum friction force was 12.36 N, 10.84 N, 8.90 N, 4.49 N, 4.45 N, 3.66 N, and 2.44 N for JEE, FEE, JEC, FEC, EC, EE, and PE composite specimens, respectively, at 5 m/s sliding speed. At 30 N load, the highest friction force recorded was 30.14 N, 28.64 N, 25.46 N, 22.15 N, 20.86 N, 17.96 N, and 14.09 N for JEE, FEE, JEC, FEC, EC, EE, and PE composite specimens, respectively, at 5 m/s sliding speed. Similarly, at 50 N applied load, maximum friction forces of 34.87 N, 29.76 N, 30.88 N, 25.33 N, 25.92 N, 25.73 N, and 24.40 N were achieved by JEE, FEE, JEC, FEC, EC, EE, and PE composite specimens, respectively, at 5 m/s sliding speed. At the higher applied load of 50 N, PE, EC, and EE exhibited almost similar maximum friction force values. At higher loads, fillers alone do not provide sufficient stability during sliding. Fiber reinforcement provides strength to the developed composite, which contributes to frictional resistance, as shown by the frictional force results. Similar work was conducted by Chaudhary et al. 24 for jute-, hemp-, and flax-reinforced epoxy composites. The authors concluded that fiber reinforcement in epoxy enhanced the frictional performance of developed composite specimens as compared to neat epoxy. Edoziuno et al. 15 investigated frictional force behavior for polyester matrix hybrid composites reinforced with particulate wood charcoal and periwinkle shell. The authors found that the addition of different fillers improved interfacial adhesion between the fiber and matrix phases, and the incorporation of fillers reduced void formation, which increased the friction force during tribological analysis.
The experimental results for the coefficient of friction (COF) obtained at sliding speeds of 3, 5, and 7 m/s were analyzed to understand how frictional behavior changes under different loading conditions. For each sliding speed, the COF values were measured under various applied loads and then plotted to illustrate the relationship between applied load and frictional response. Figures 7–9 present these plots, showing how COF trends vary with increasing load at each tested speed. From the figures, COF increased from 10 to 30 N load for 3, 5, and 7 m/s sliding speeds, but after 30 N load, all developed specimens showed a decrease in COF values. JEE achieved the highest COF values at all sliding speeds as compared to other developed composite specimens, while the pure epoxy composite specimen showed the minimum COF values. The effect of higher frictional force directly influenced the COF values, as higher frictional force for JEE and lower frictional force for pure epoxy corresponded to similar COF trends. Jute fibers in the epoxy matrix increased surface roughness during sliding due to fiber contact, fiber pull-out, and micro-fracture effects at the contact interface. As wear progressed, partially fractured jute fibers protruded from the matrix, increasing mechanical interlocking between the composite surface and the counterface. This enhanced interfacial interaction led to higher resistance to sliding, thereby resulting in an increased COF for the JEE composite.25,26 Coefficient of friction at 3 m/s sliding speed. Coefficient of friction at 5 m/s sliding speed. Coefficient of friction at 7 m/s sliding speed.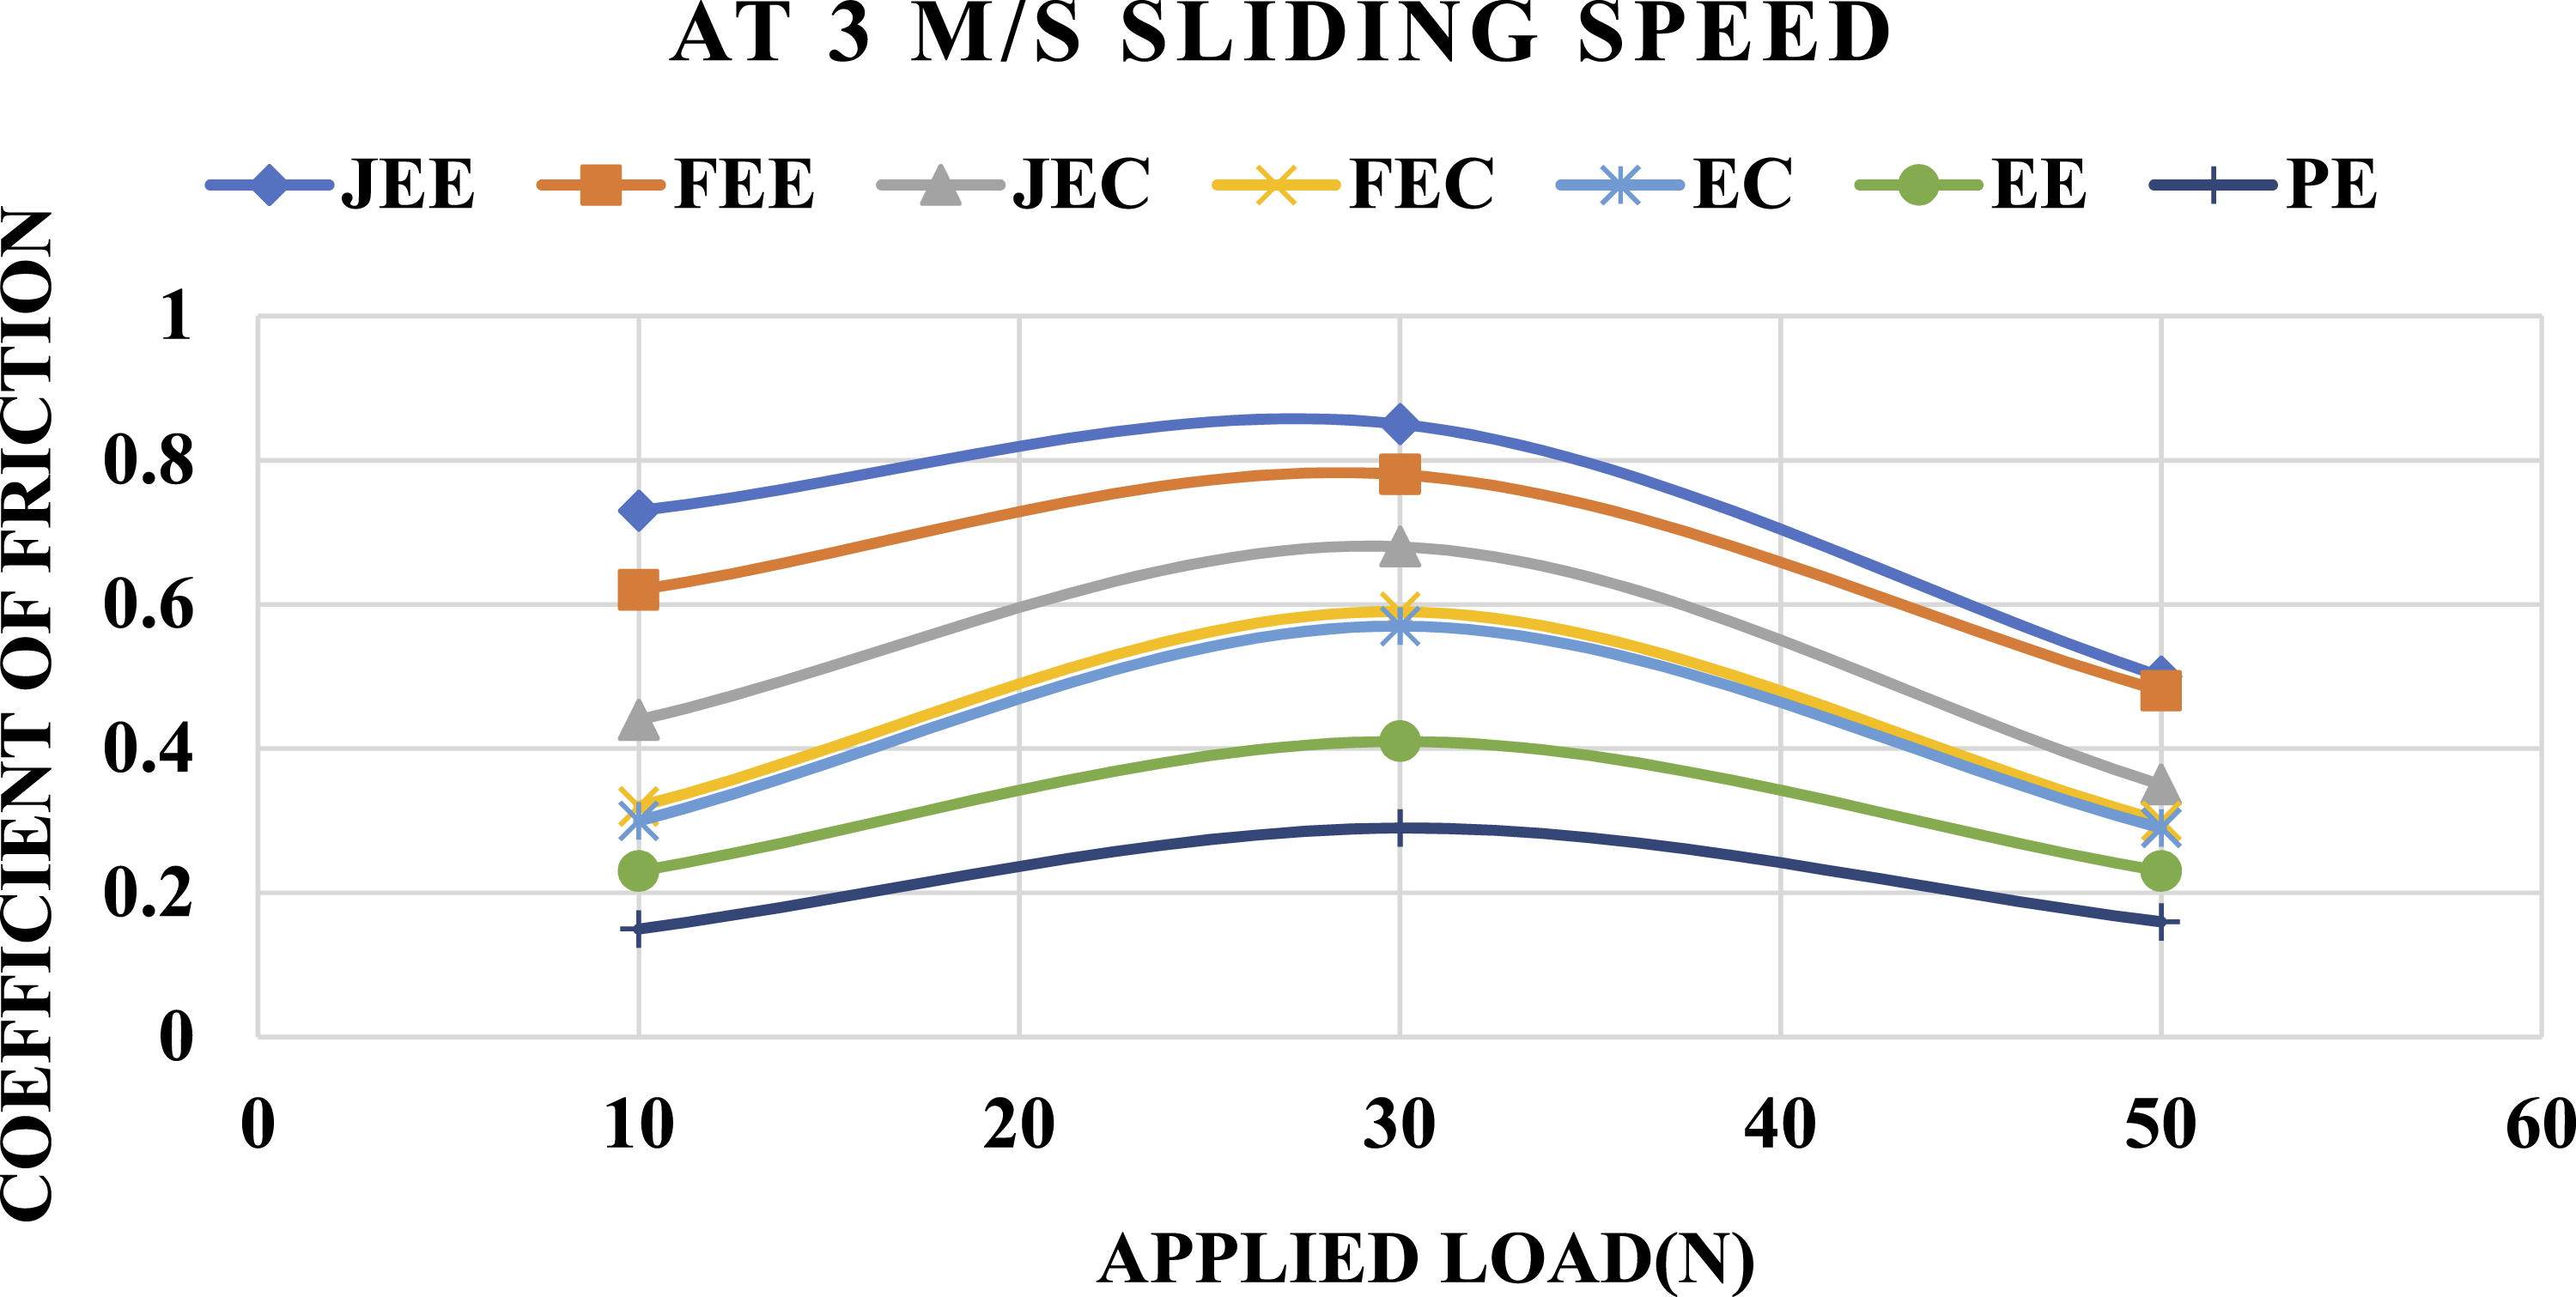
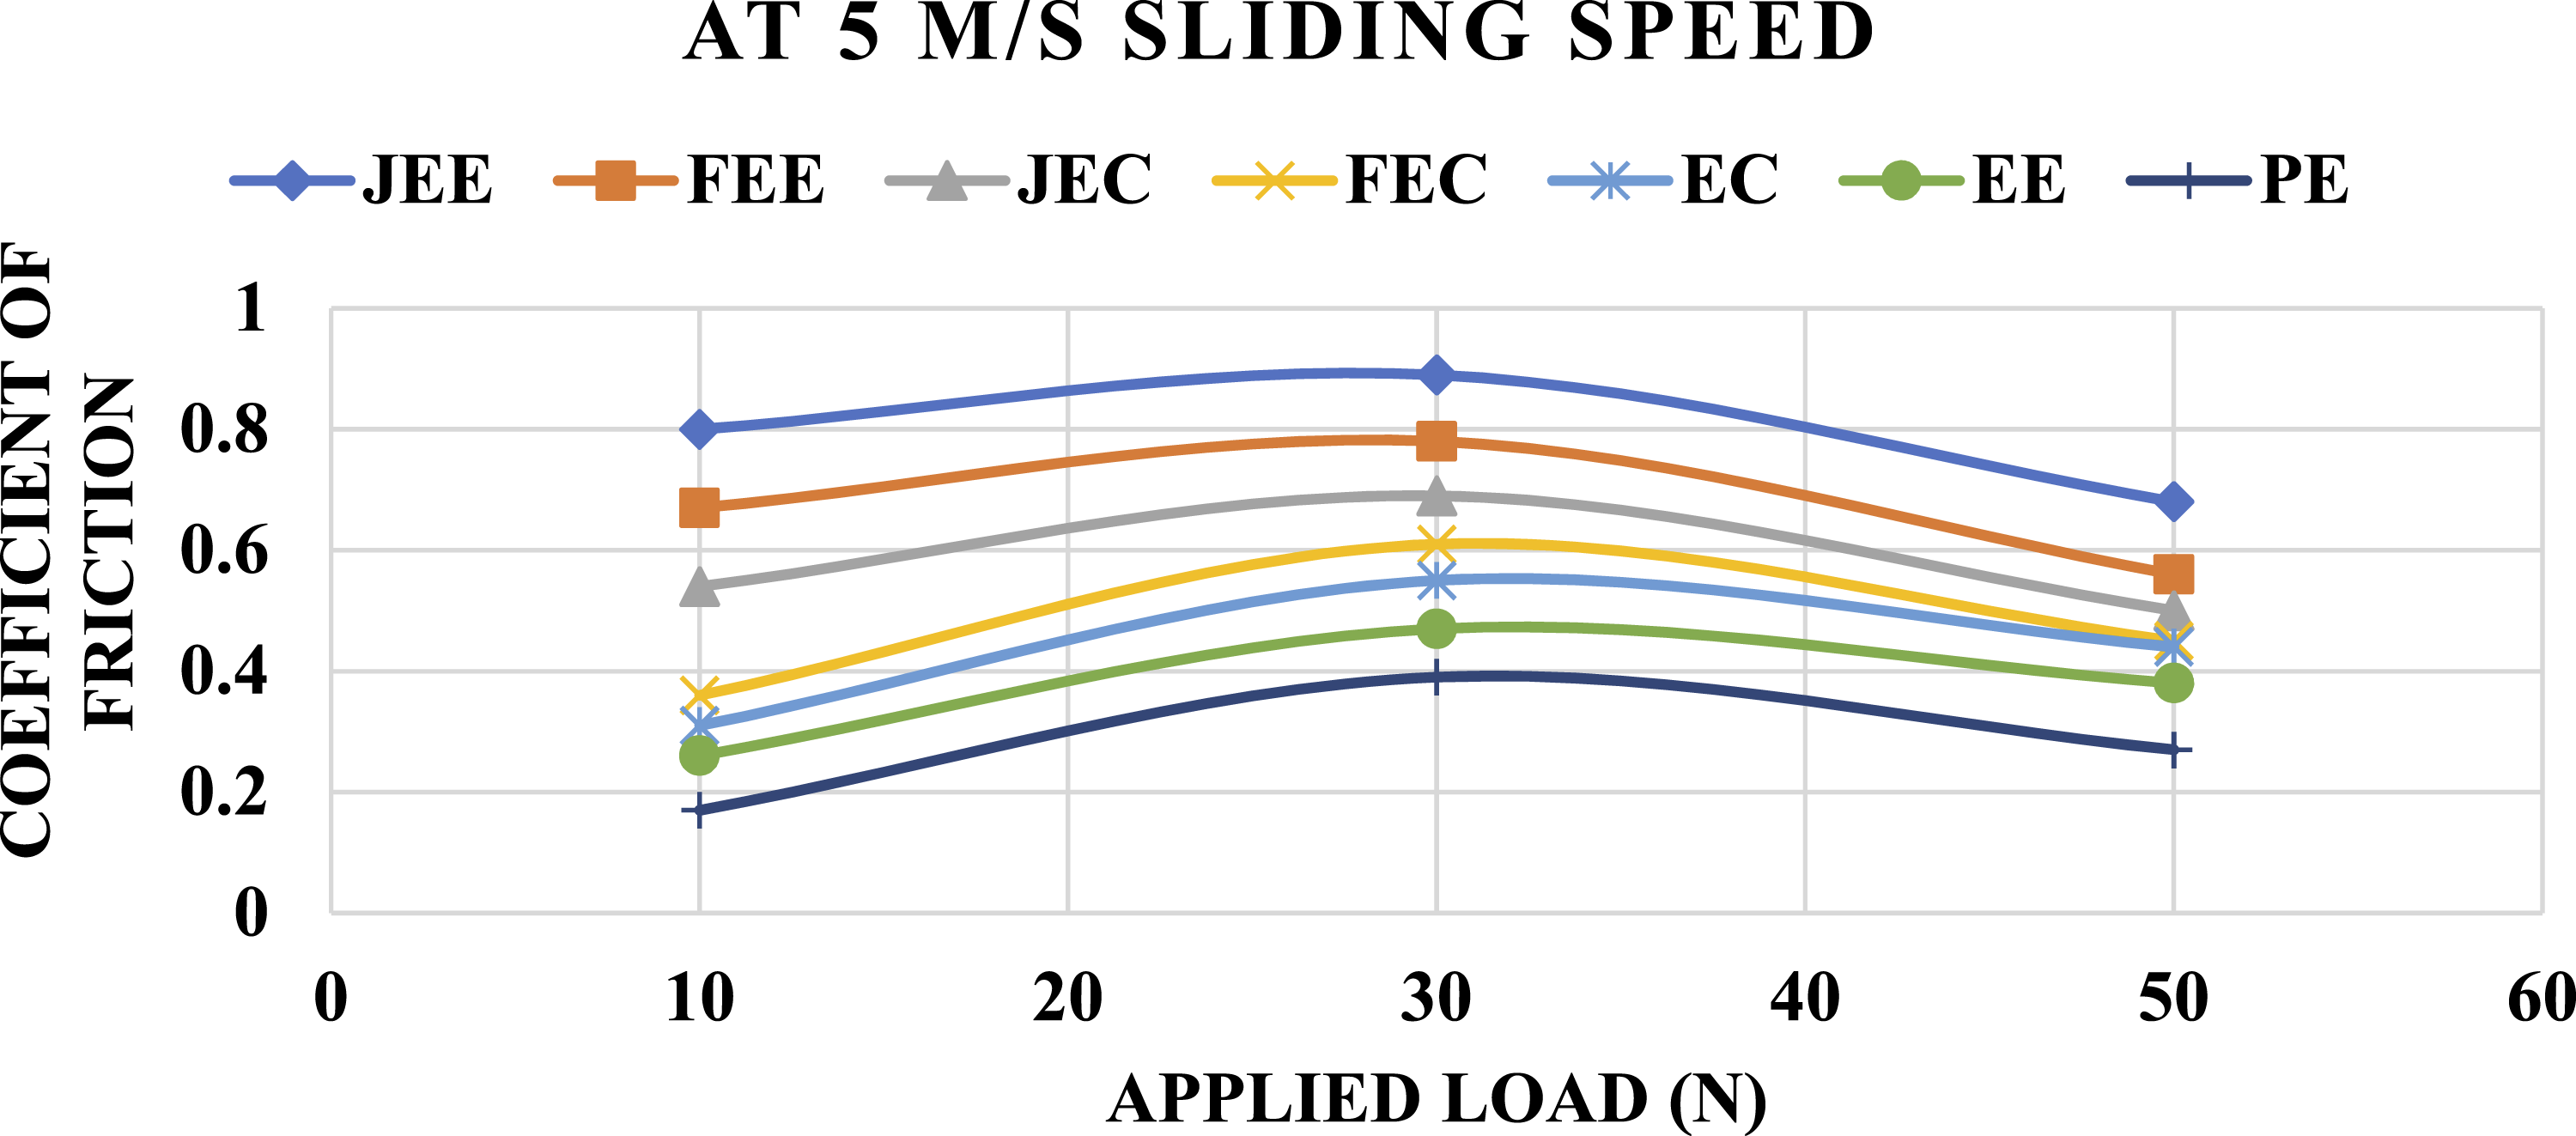
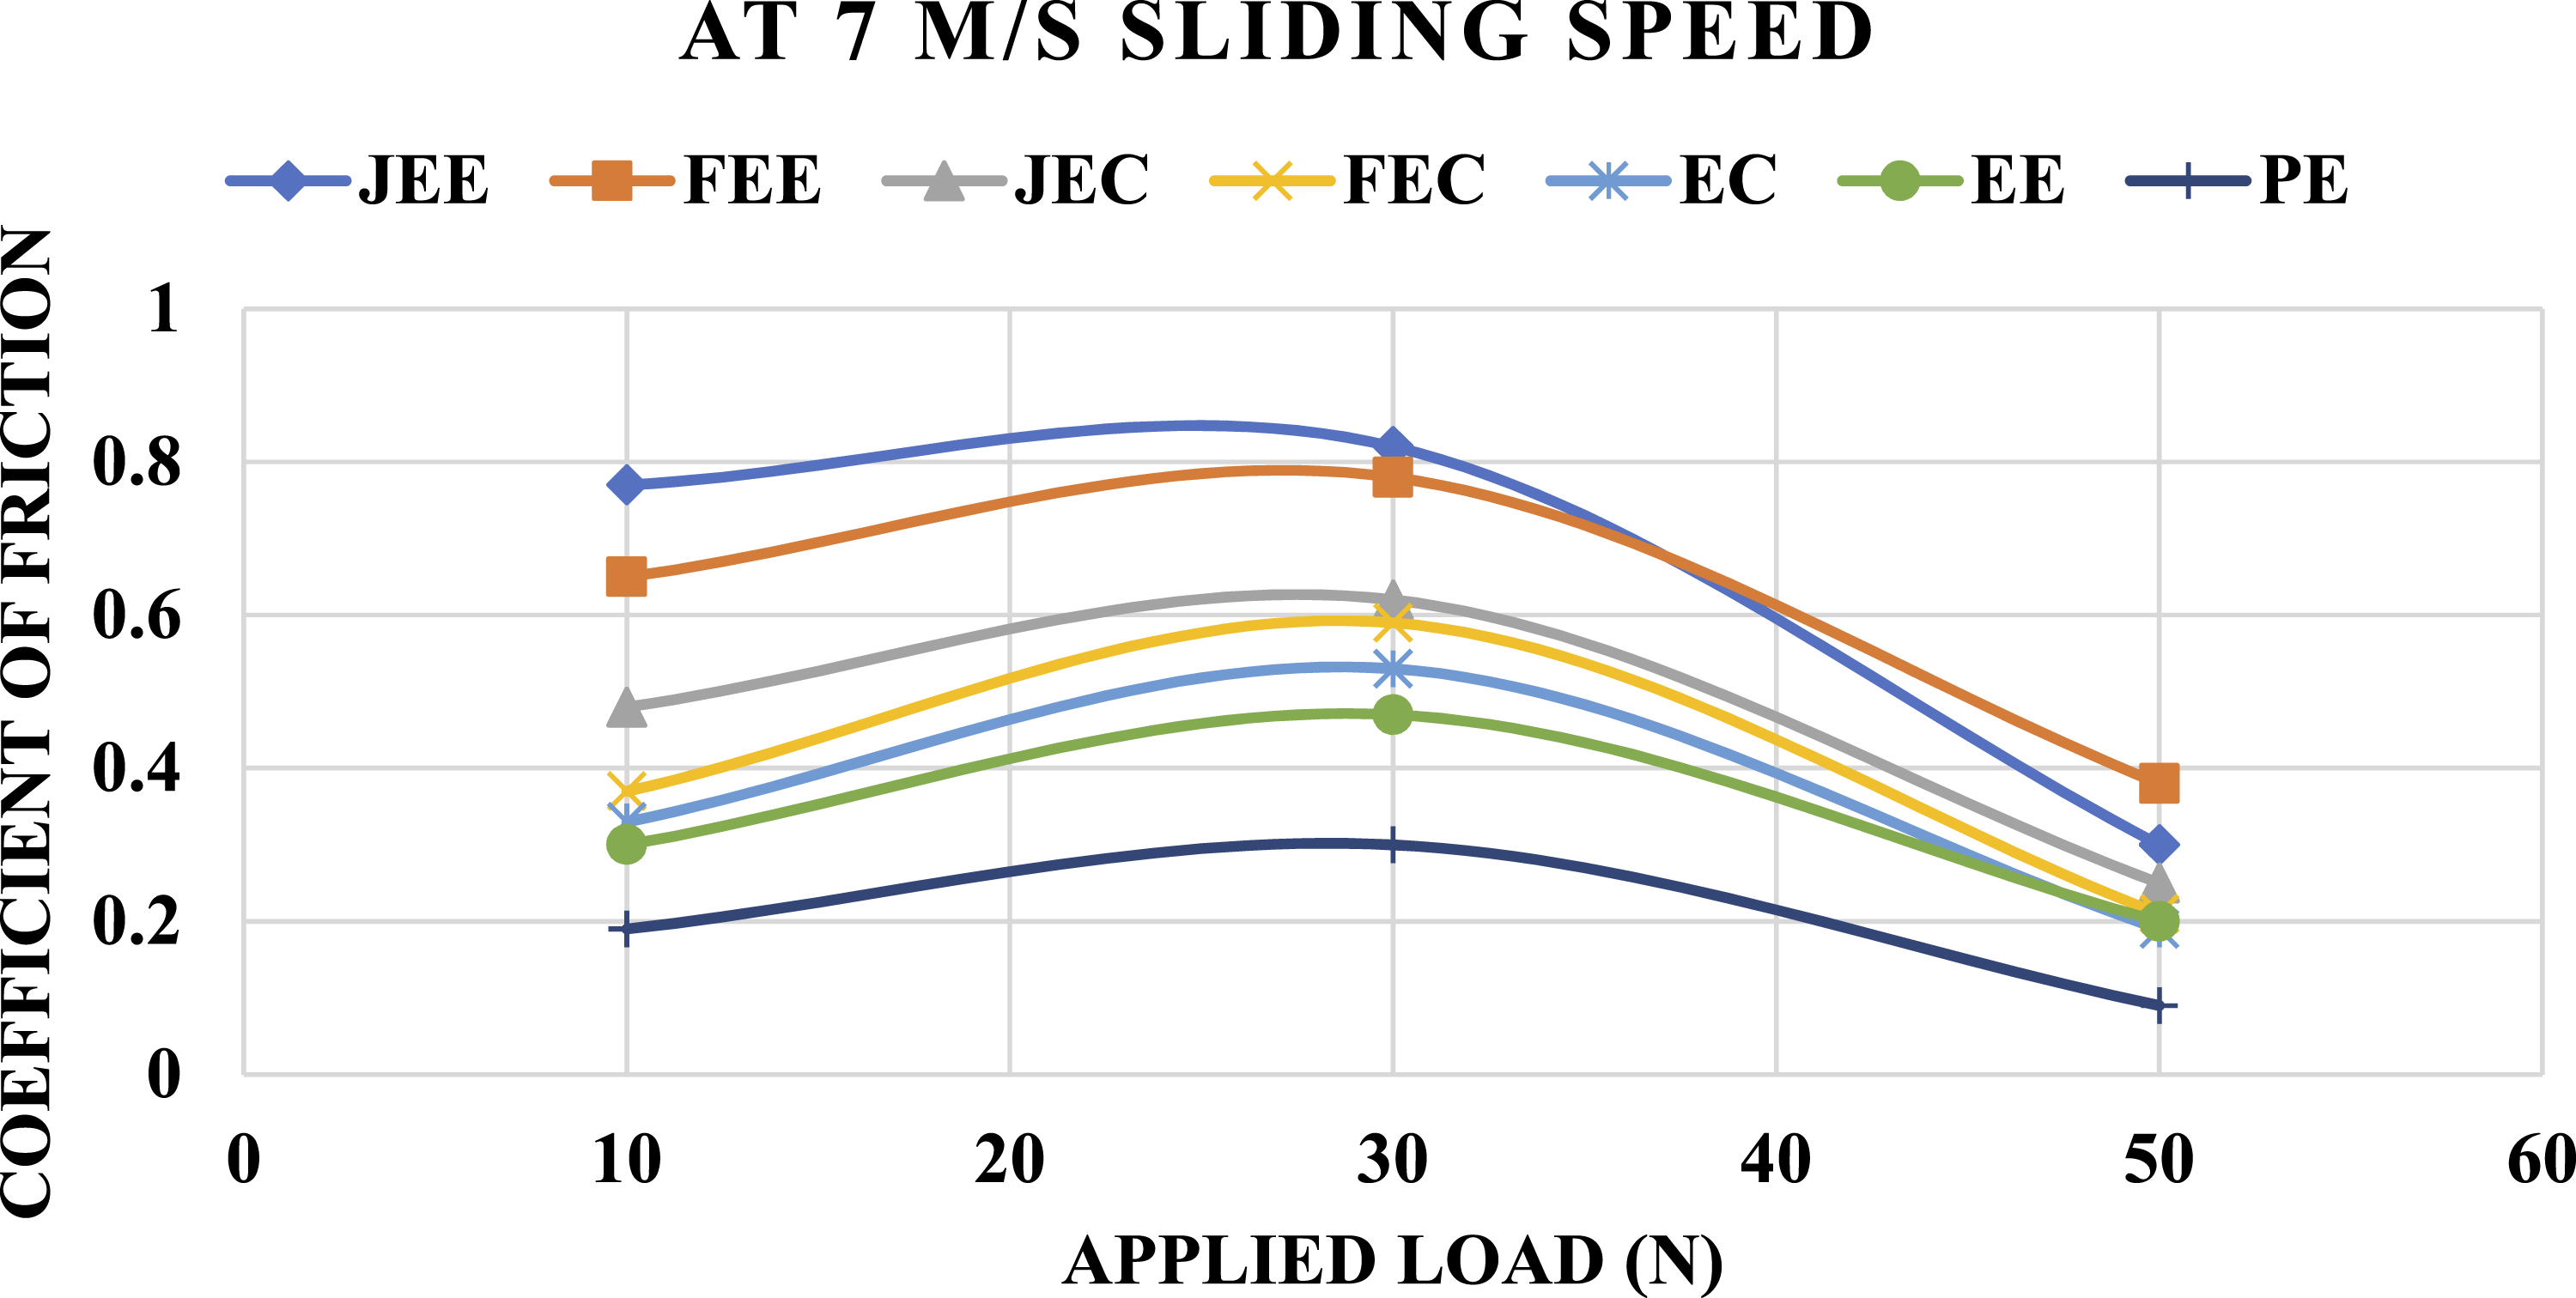
For 3 m/s sliding speed and 10 N load, all developed composites showed COF values ranging from 0.15 to 0.73. At 3 m/s sliding speed and 30 N load, COF values ranged from 0.29 to 0.85. At 3 m/s sliding speed and 50 N load, COF values ranged from 0.16 to 0.50. The eggshell-filler-based composite displayed higher COF values mainly due to the intrinsic characteristics of eggshell particles, which are rich in calcium carbonate (CaCO3). Eggshell particles are relatively hard and angular, and when incorporated into the epoxy matrix, they increase surface asperity and abrasive interactions during sliding.24–26 Ahmed et al. 25 reported similar results for jute/epoxy composites and found that prepared specimens exhibited increasing COF values with an increase in applied load (30–50 N) and sliding speed (3–6 m/s). In the present study, similarly, at 5 m/s sliding speed and 10 N load, all developed composite samples displayed COF values ranging from 0.17 to 0.80. At 5 m/s and 30 N load, COF values ranged from 0.39 to 0.89, while at 5 m/s and 50 N load, COF values ranged from 0.27 to 0.68. The results at 5 m/s for 10, 30, and 50 N loads showed that COF values initially increased from 10 to 30 N, but decreased at 50 N for all prepared specimens. This occurred because, at higher loads, the interfacial temperature increased, which converted the glassy state of the sample into a rubbery state. As a result, the sample adhered to the steel counterface during sliding, which reduced the frictional force and resulted in lower COF values. Similarly, at 7 m/s and 10 N applied load, all specimens exhibited COF values ranging from 0.19 to 1.77, while at 7 m/s and 30 N applied load, COF values ranged from 0.30 to 0.82. However, COF values decreased again at 7 m/s and 50 N applied load, ranging from 0.09 to 0.38. Similar findings were reported by Nirmal et al. 26 for bamboo-fiber-reinforced epoxy composites. They found that at higher sliding speeds and loads, composite specimens experienced thermal softening of the epoxy, which formed an intermediate layer between the specimen and the sliding counterface. This layer prevented fiber contact with the steel counterface, and the absence of fiber interaction reduced frictional force, resulting in lower COF values.
4.4. Specific wear rate
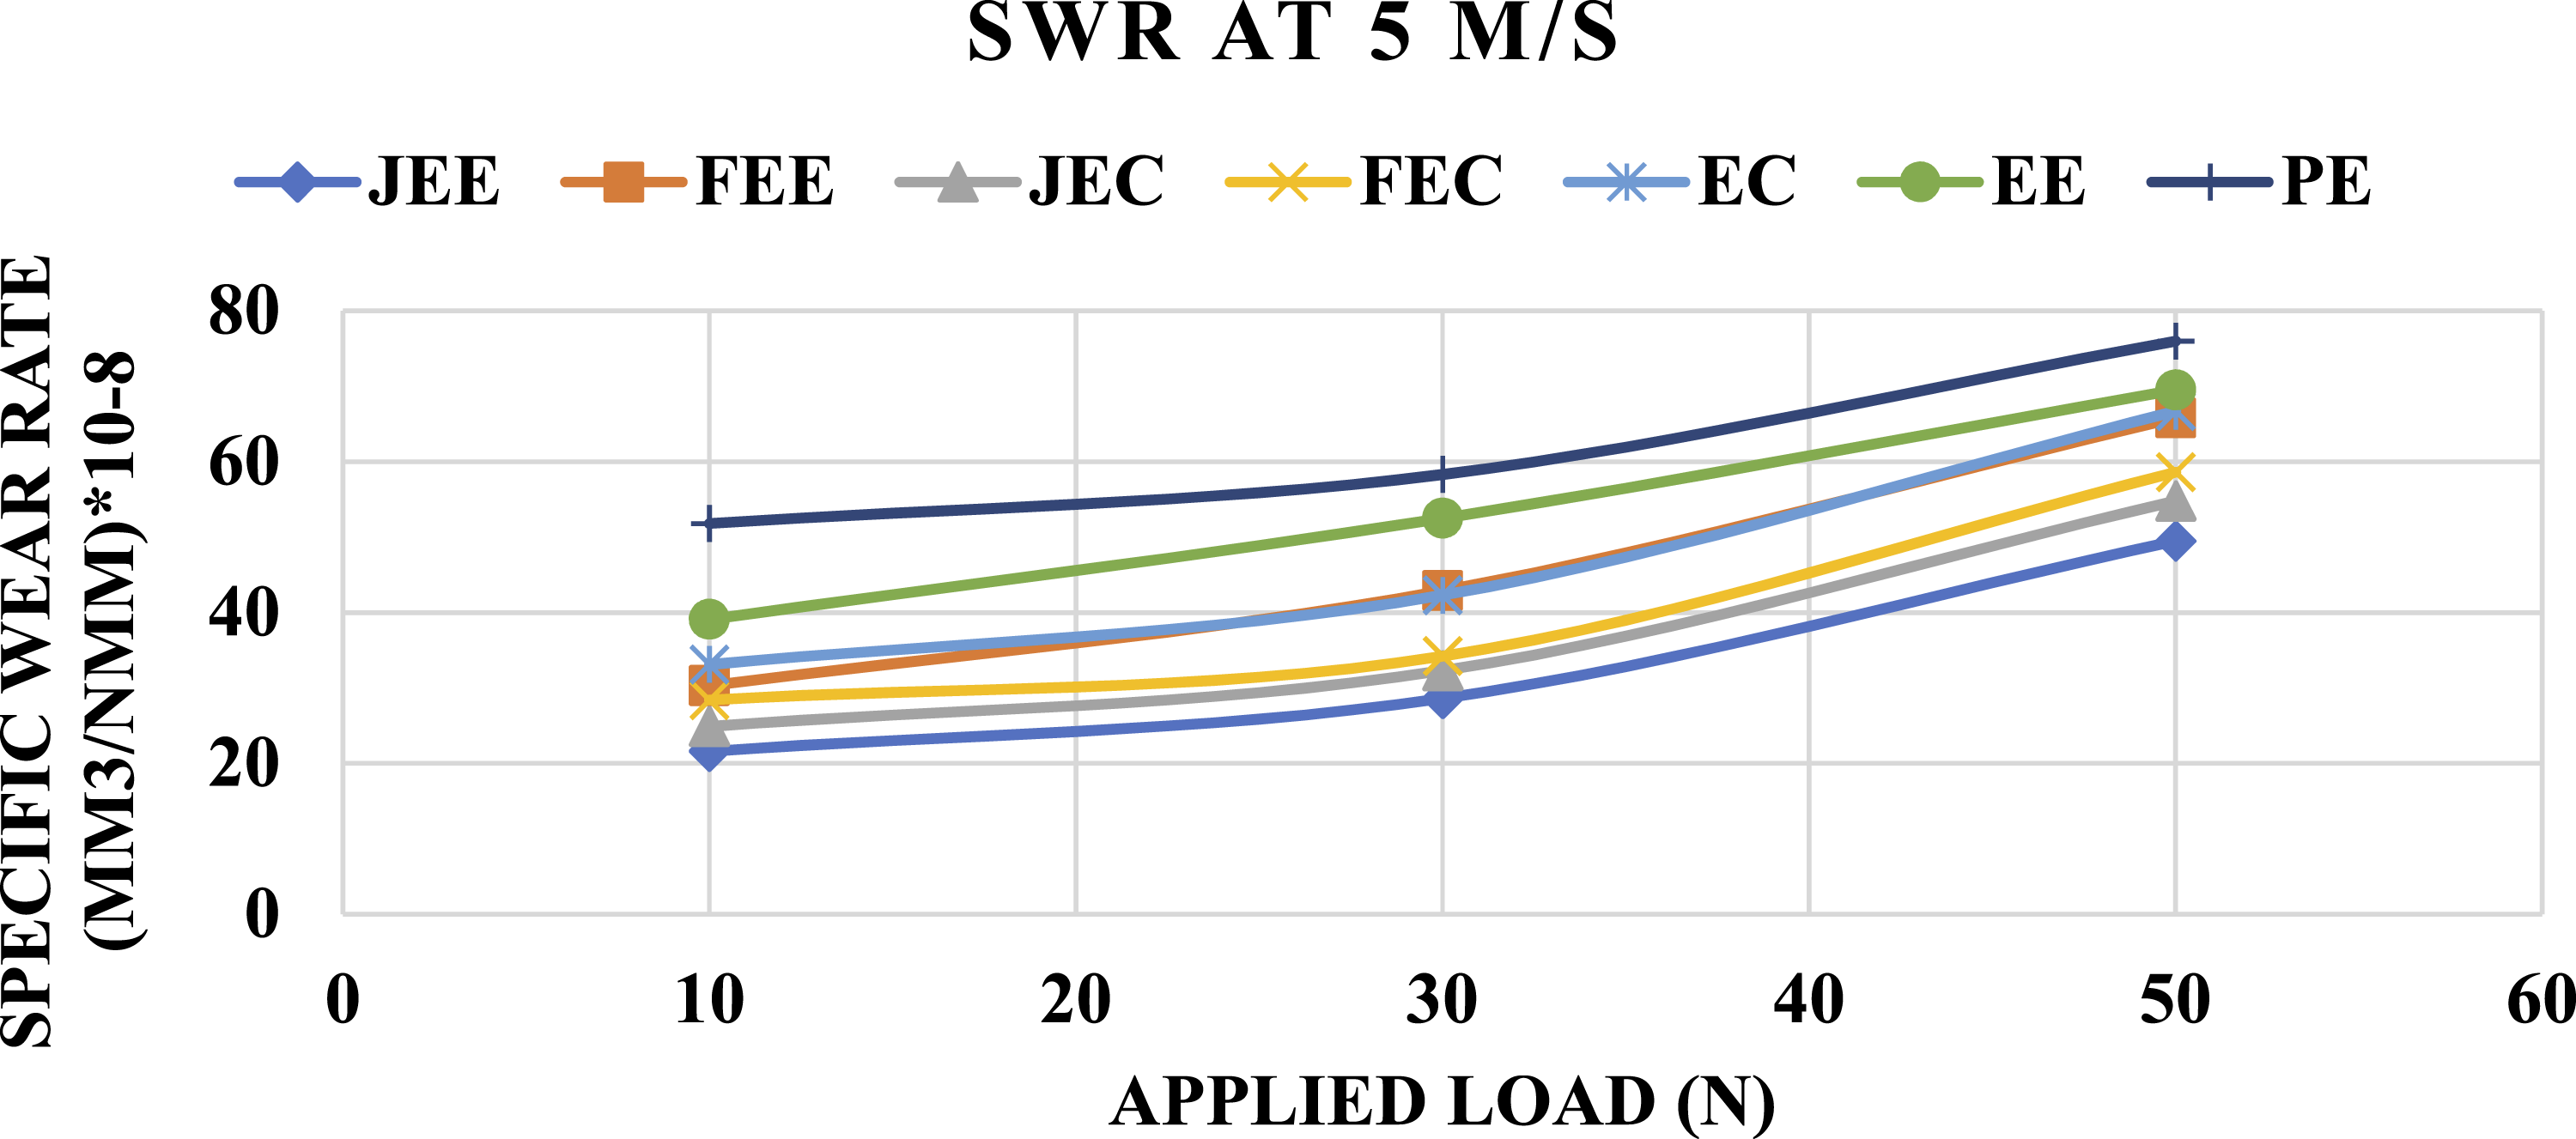
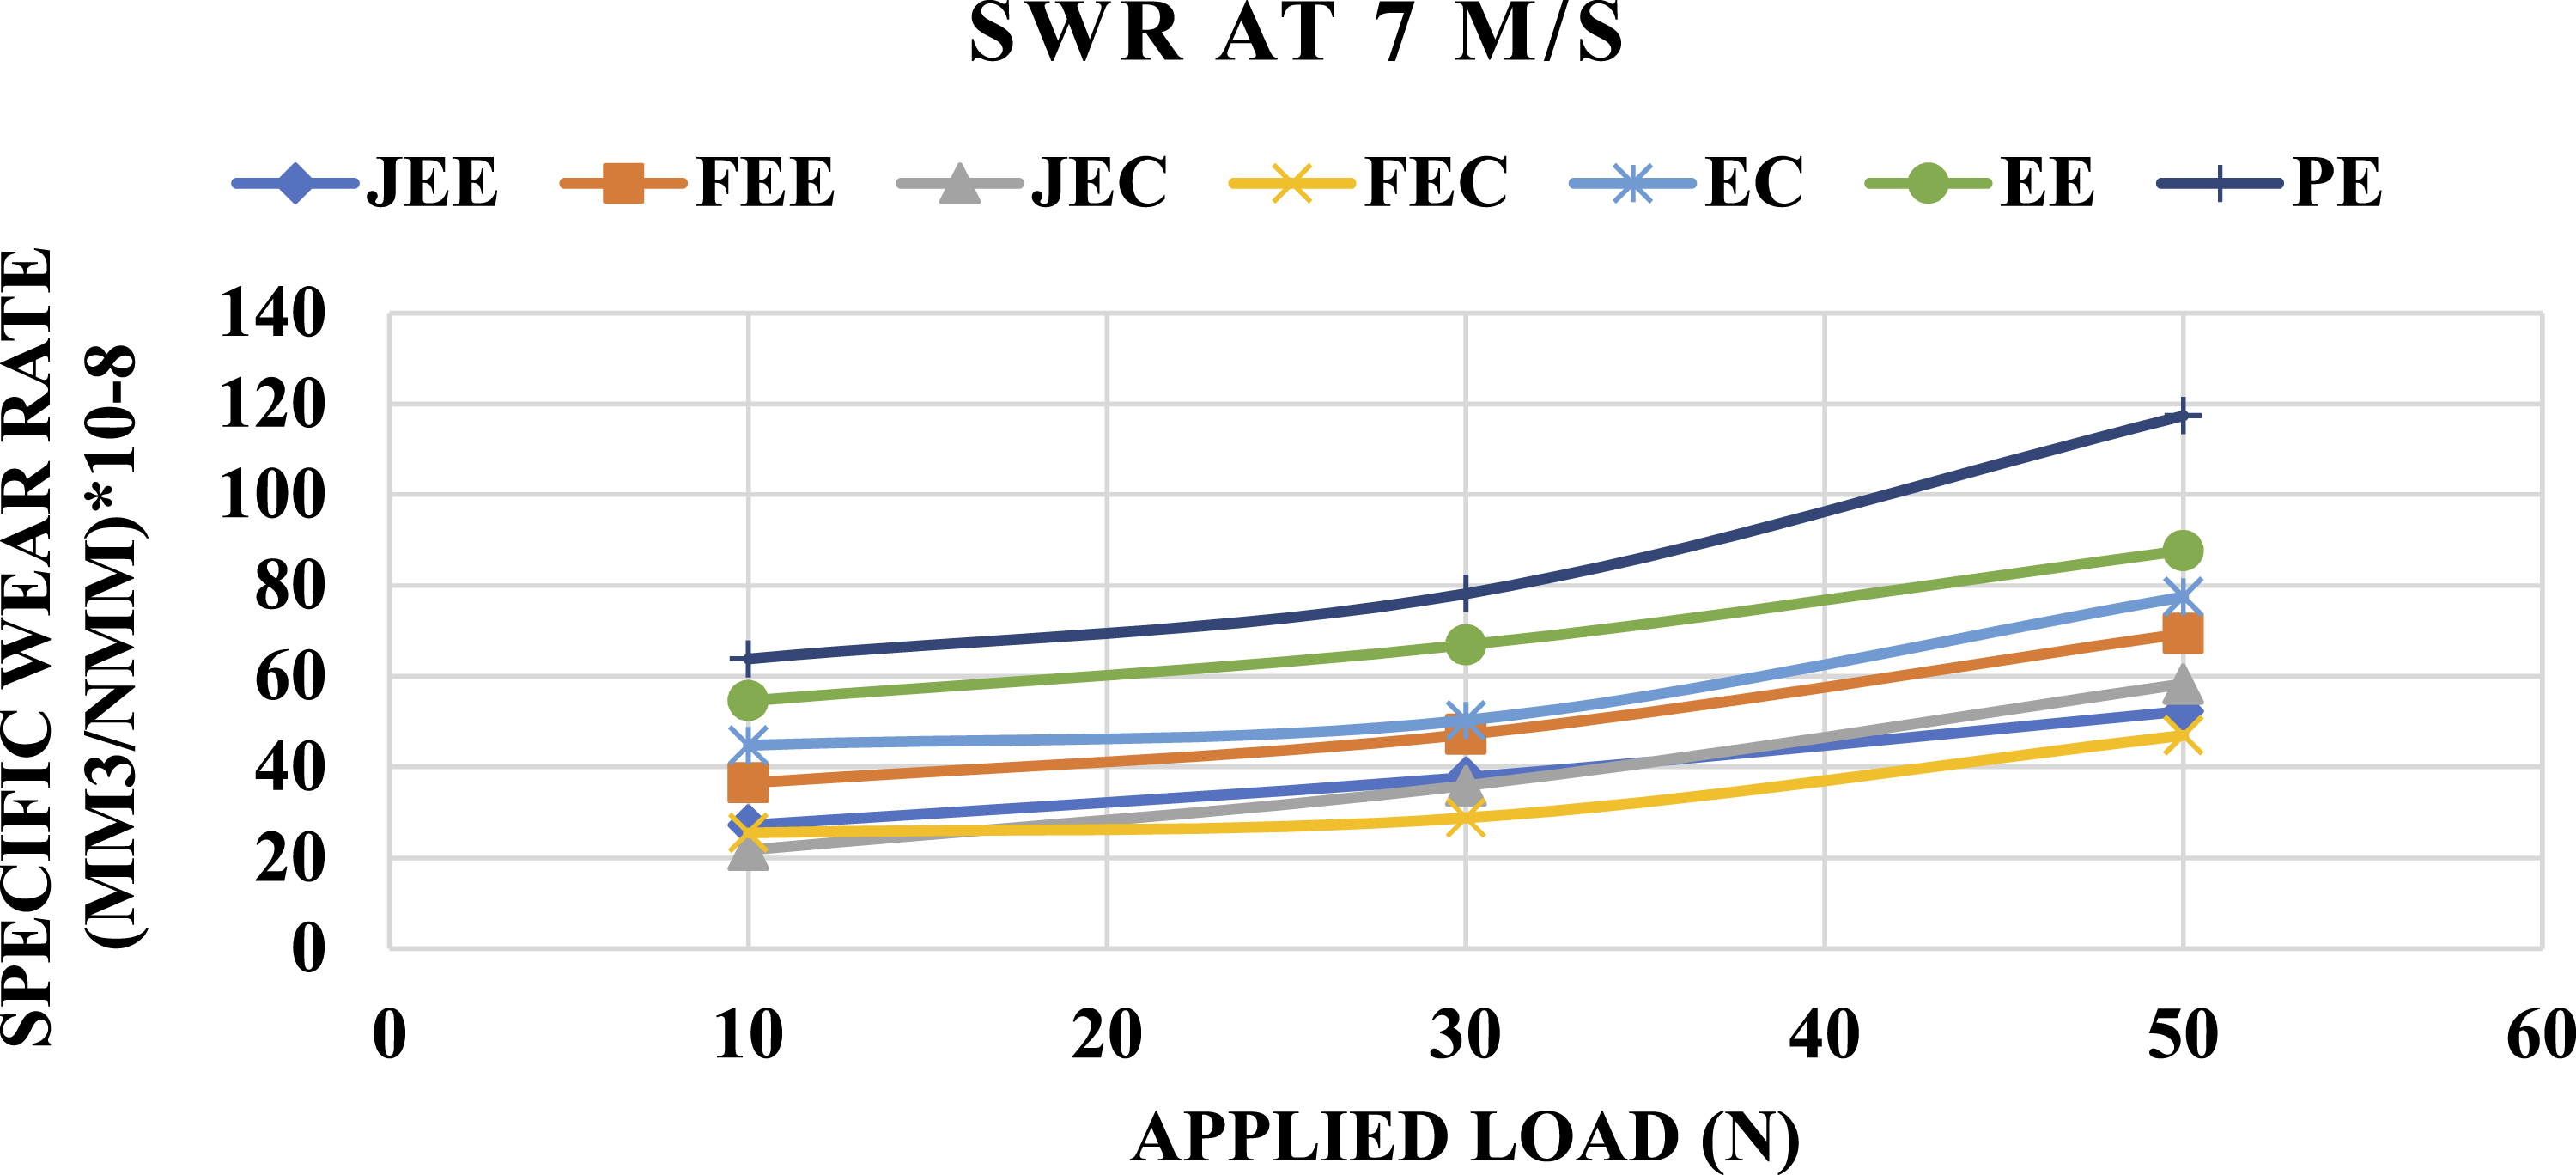
The specific wear rate represents how much material is lost when a specimen slides against a counterface under controlled conditions. It essentially indicates the material’s resistance to wear—lower values mean better wear performance. In this study, the specific wear rate was evaluated under different operating conditions to understand how speed and load affect material loss. Tests were conducted at sliding speeds of 3, 5, and 7 m/s and under applied loads of 10, 30, and 50 N. The results obtained from these experiments are presented in Figures 10–12, which show how the wear rate varies with changes in both load and sliding speed. As the load and sliding speed increase, the specific wear rate also increases for all prepared specimens. Experimental analysis of frictional force showed an increment in friction value between 500 and 1500 s. For 10 N applied load, the specific wear rate (SWR) showed a substantial increment from 3 m/s to 5 m/s sliding speed, but only marginal changes were observed from 5 to 7 m/s sliding speed at 10 N applied load for all prepared specimens. Similarly, for 30 N applied load, SWR exhibited a substantial increment from 3 m/s to 5 m/s, while only minor changes occurred from 5 to 7 m/s sliding speed. However, for 50 N applied load, SWR increased rapidly from 3 m/s to 5 m/s and 7 m/s sliding speeds. For 3 m/s, 5 m/s, and 7 m/s sliding speeds, the results show that the incorporation of fillers (eggshell and coconut shell) with fibers and polymer resin reduced the SWR values of the developed composites as compared to pure epoxy and only filler-based epoxy composites. For 3 m/s sliding speed and 10 N applied load, the minimum SWR of 3.82 mm3/N-mm was achieved by the JEE composite, while the maximum SWR of 15.08 mm3/N-mm was recorded for the pure epoxy sample. The second-highest SWR of 13.6 mm3/N-mm was achieved by the EE composite. Similar results of SWR were observed for 3 m/s sliding speed and 30 N applied load, where the minimum SWR of 4.0 mm3/N-mm was achieved by the JEE composite, while the maximum SWR of 18.76 mm3/N-mm was observed for the pure epoxy composite. The second-highest SWR of 14.1 mm3/N-mm was achieved by the EE composite. Similarly, for 3 m/s sliding speed and 50 N applied load, the minimum SWR of 13.1 mm3/N-mm was achieved by the JEE composite, while the maximum SWR of 26.36 mm3/N-mm was recorded for the pure epoxy composite. Specific wear rate at 3 m/s sliding speed. Specific wear rate at 5 m/s sliding speed. Specific wear rate at 7 m/s sliding speed.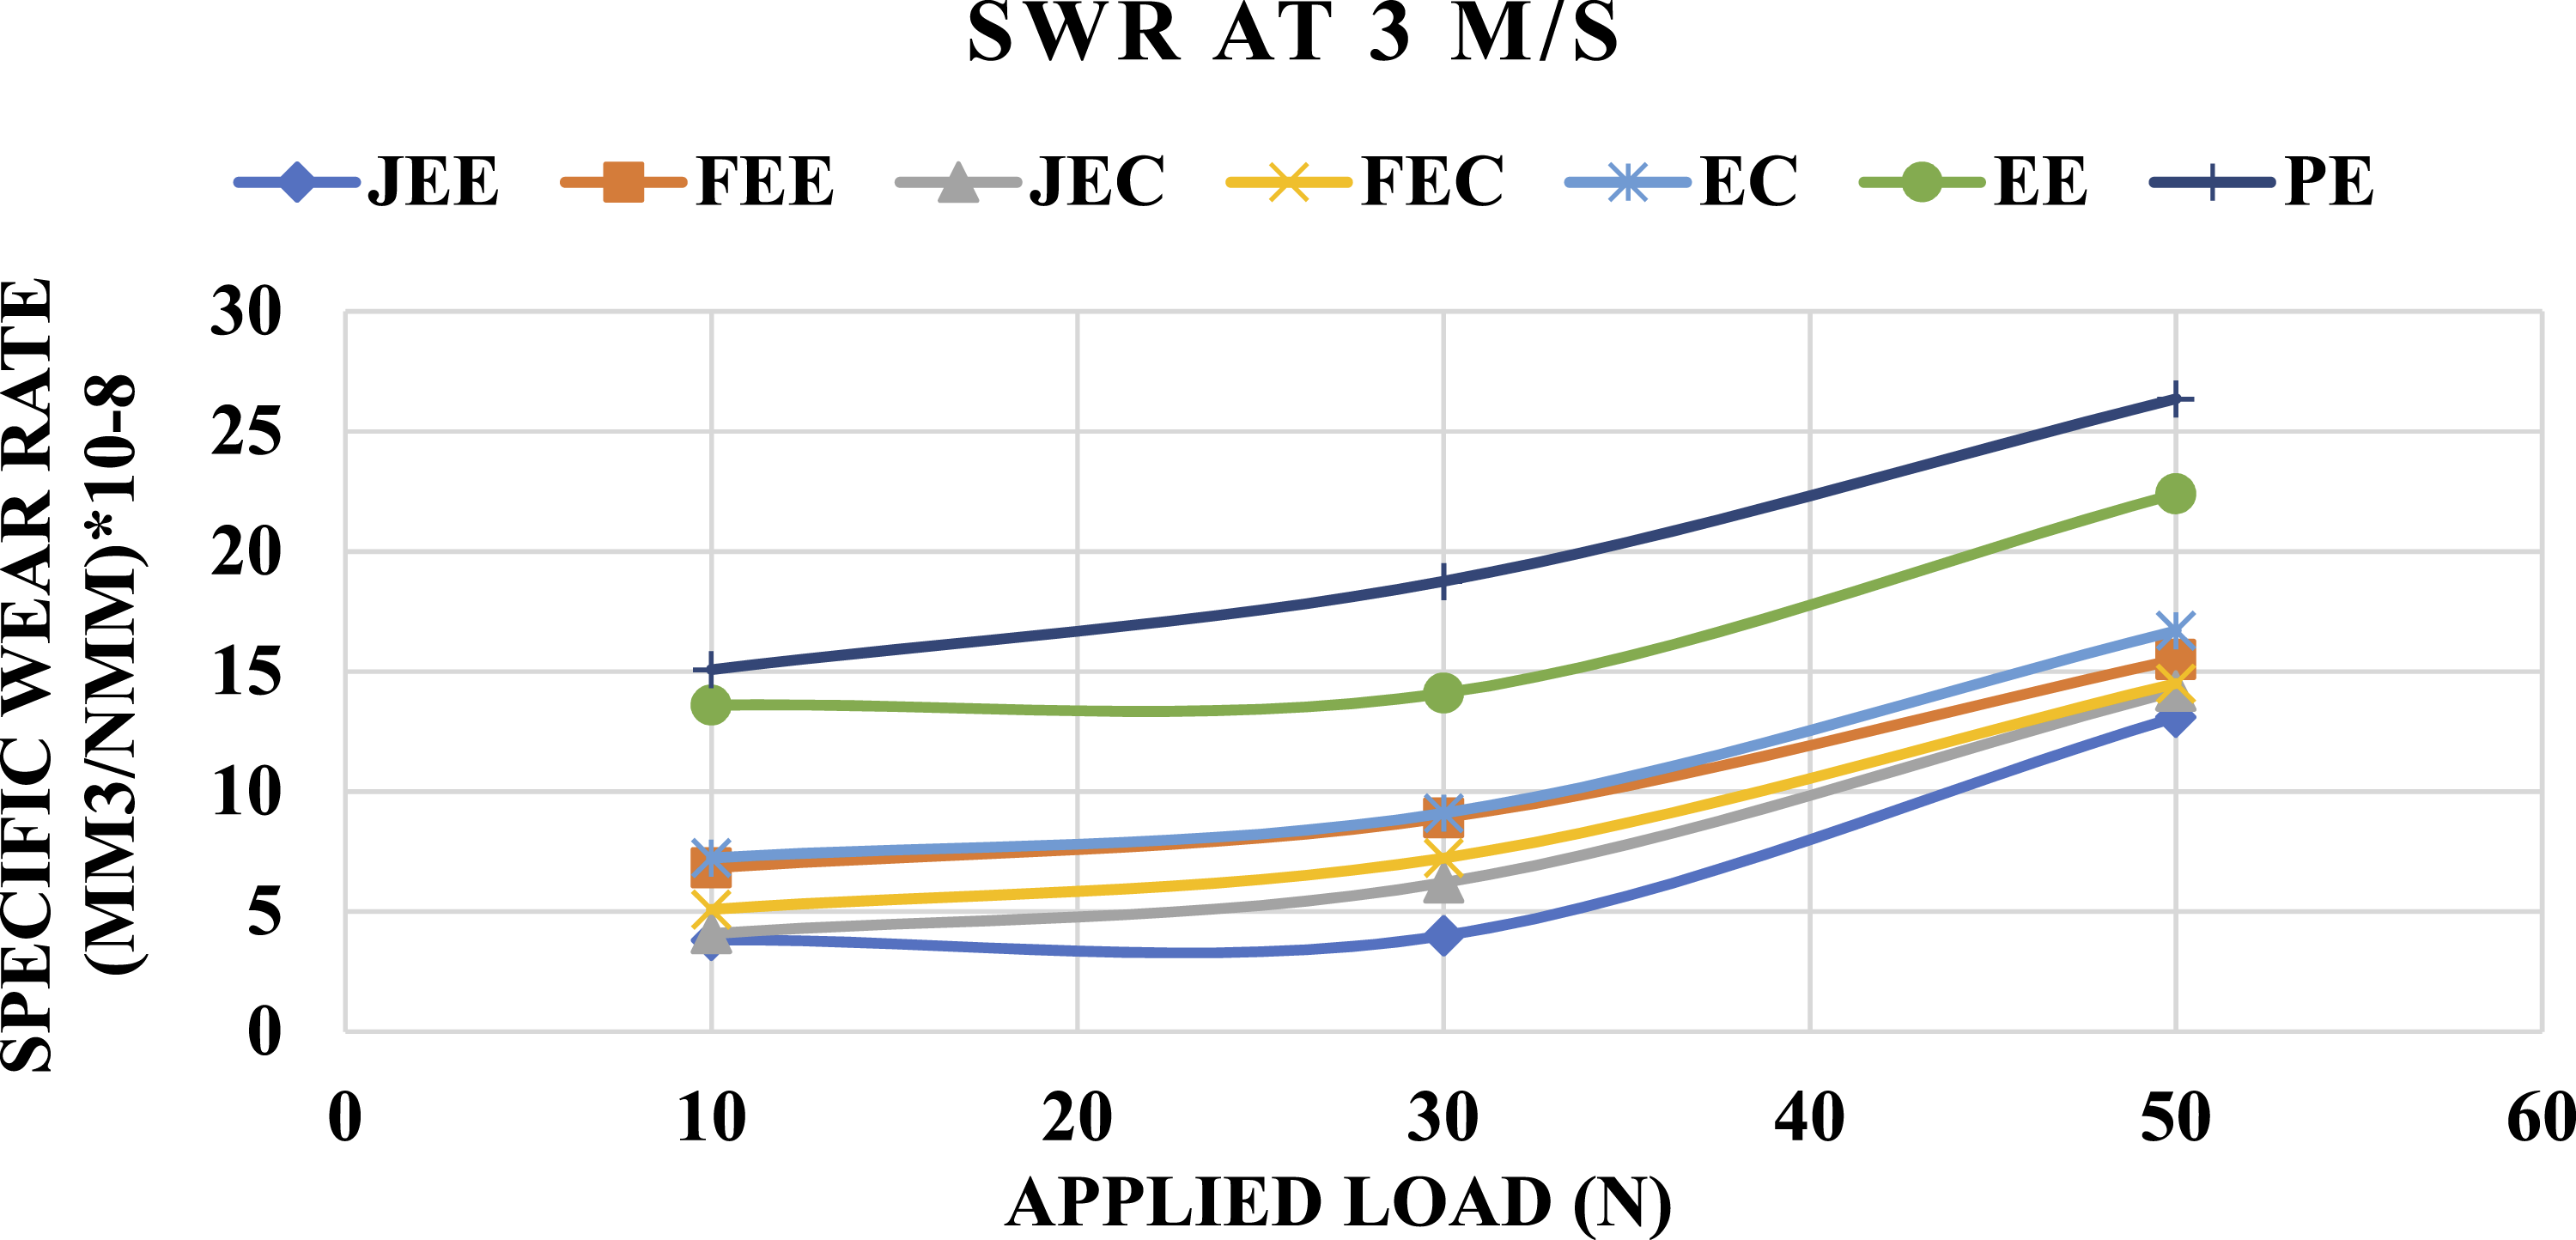
The higher specific wear rates observed in flax-reinforced epoxy composites compared to jute-reinforced epoxy composites are attributed to the smooth surface of flax fibers, which offers lower resistance to micro-abrasion and a greater tendency for fibrillation under sliding conditions. During wear, flax fibers undergo separation and fibril pull-out more readily than jute fibers, leading to enhanced material removal from the specimen surface. In contrast, jute fibers have a relatively higher lignin content and a rough surface, which improves their stiffness and resistance to fibrillation. This results in enhanced load-bearing capability at the sliding interface and better retention within the epoxy matrix. Effective interfacial adhesion and reduced fiber fragmentation in jute-fiber-reinforced epoxy composites limit material loss during sliding, resulting in lower specific wear rates.24–26
Hybridization of different fibers and fillers enhanced the interfacial adhesion between the fiber and matrix phases, and the incorporation of natural fillers minimized the possibility of void formation, thereby improving wear resistance during tribological testing. Better wettability of fibers and fillers and lower void content prevent fiber debonding from the matrix phase during sliding, which reduces the specific wear rate of the test specimens.20–23 Similar observations were reported by Ray et al. 21 in their investigation of glass/epoxy composites reinforced with eggshell powder. Their study demonstrated that the incorporation of eggshell particles enhanced the wear resistance of the composite, resulting in a lower wear rate compared with the unfilled material. However, they also reported that with increasing applied load, the composite exhibited a higher specific wear rate, indicating that the protective effect of eggshell filler diminishes under severe loading conditions.
For 5 m/s sliding speed and 10 N applied load, the minimum SWR of 21.6 mm3/N-mm was achieved by the JEE composite, while the maximum SWR of 51.8 mm3/N-mm was observed for the pure epoxy composite. The second-highest SWR of 39.1 mm3/N-mm was achieved by the EE composite. Similar SWR trends were observed for 5 m/s sliding speed and 30 N applied load, where the minimum SWR of 28.6 mm3/N-mm was achieved by the JEE composite, while the maximum SWR of 58.3 mm3/N-mm was recorded for the pure epoxy composite. The second-highest SWR of 52.5 mm3/N-mm was achieved by the EE composite. For 5 m/s sliding speed and 50 N applied load, the minimum SWR of 49.5 mm3/N-mm was achieved by the JEE composite, while the maximum SWR of 76.0 mm3/N-mm was recorded for the pure epoxy composite. For 7 m/s sliding speed and 10 N applied load, the minimum SWR of 27.2 mm3/N-mm was achieved by the JEE composite, while the maximum SWR of 63.8 mm3/N-mm was observed for the pure epoxy composite. The second-highest SWR of 54.6 mm3/N-mm was achieved by the EE composite. Similar SWR trends were observed for 7 m/s sliding speed and 30 N applied load, where the minimum SWR of 37.7 mm3/N-mm was achieved by the JEE composite, while the maximum SWR of 78.2 mm3/N-mm was recorded for the pure epoxy composite. Although for 7 m/s sliding speed and 50 N applied load, the minimum SWR of 52.3 mm3/N-mm was achieved by the JEE composite, the maximum SWR of 117.4 mm3/N-mm was observed for the pure epoxy composite.
4.5. Morphological analysis
After completing the tribological tests, the worn sliding surfaces of the specimens were examined to understand how the material behaved during frictional contact. These surfaces were carefully prepared for morphological analysis using scanning electron microscopy (SEM). The SEM images allowed for a detailed investigation of the wear mechanisms, including the nature of the worn surfaces, the deformation behavior of the reinforcing fibers, and the role of fillers during sliding against the steel counterface. The observed microstructural features and wear patterns are presented in Figure 13, which provides insight into the interactions occurring at the sliding interface. The SEM image of the PE specimen shows debris formation of pure epoxy and scratches on the epoxy surface after sliding against the steel counterface due to the brittle nature of solid epoxy. The EE composite shows worn surfaces along with plastic deformation and surface fractures. Similar deformation behavior was observed in the EC composite, where coconut fillers induced higher friction, resulting in more surface fractures during sliding as compared to the EE composite. Morphological analysis using SEM micrographs of established specimen after tribology test.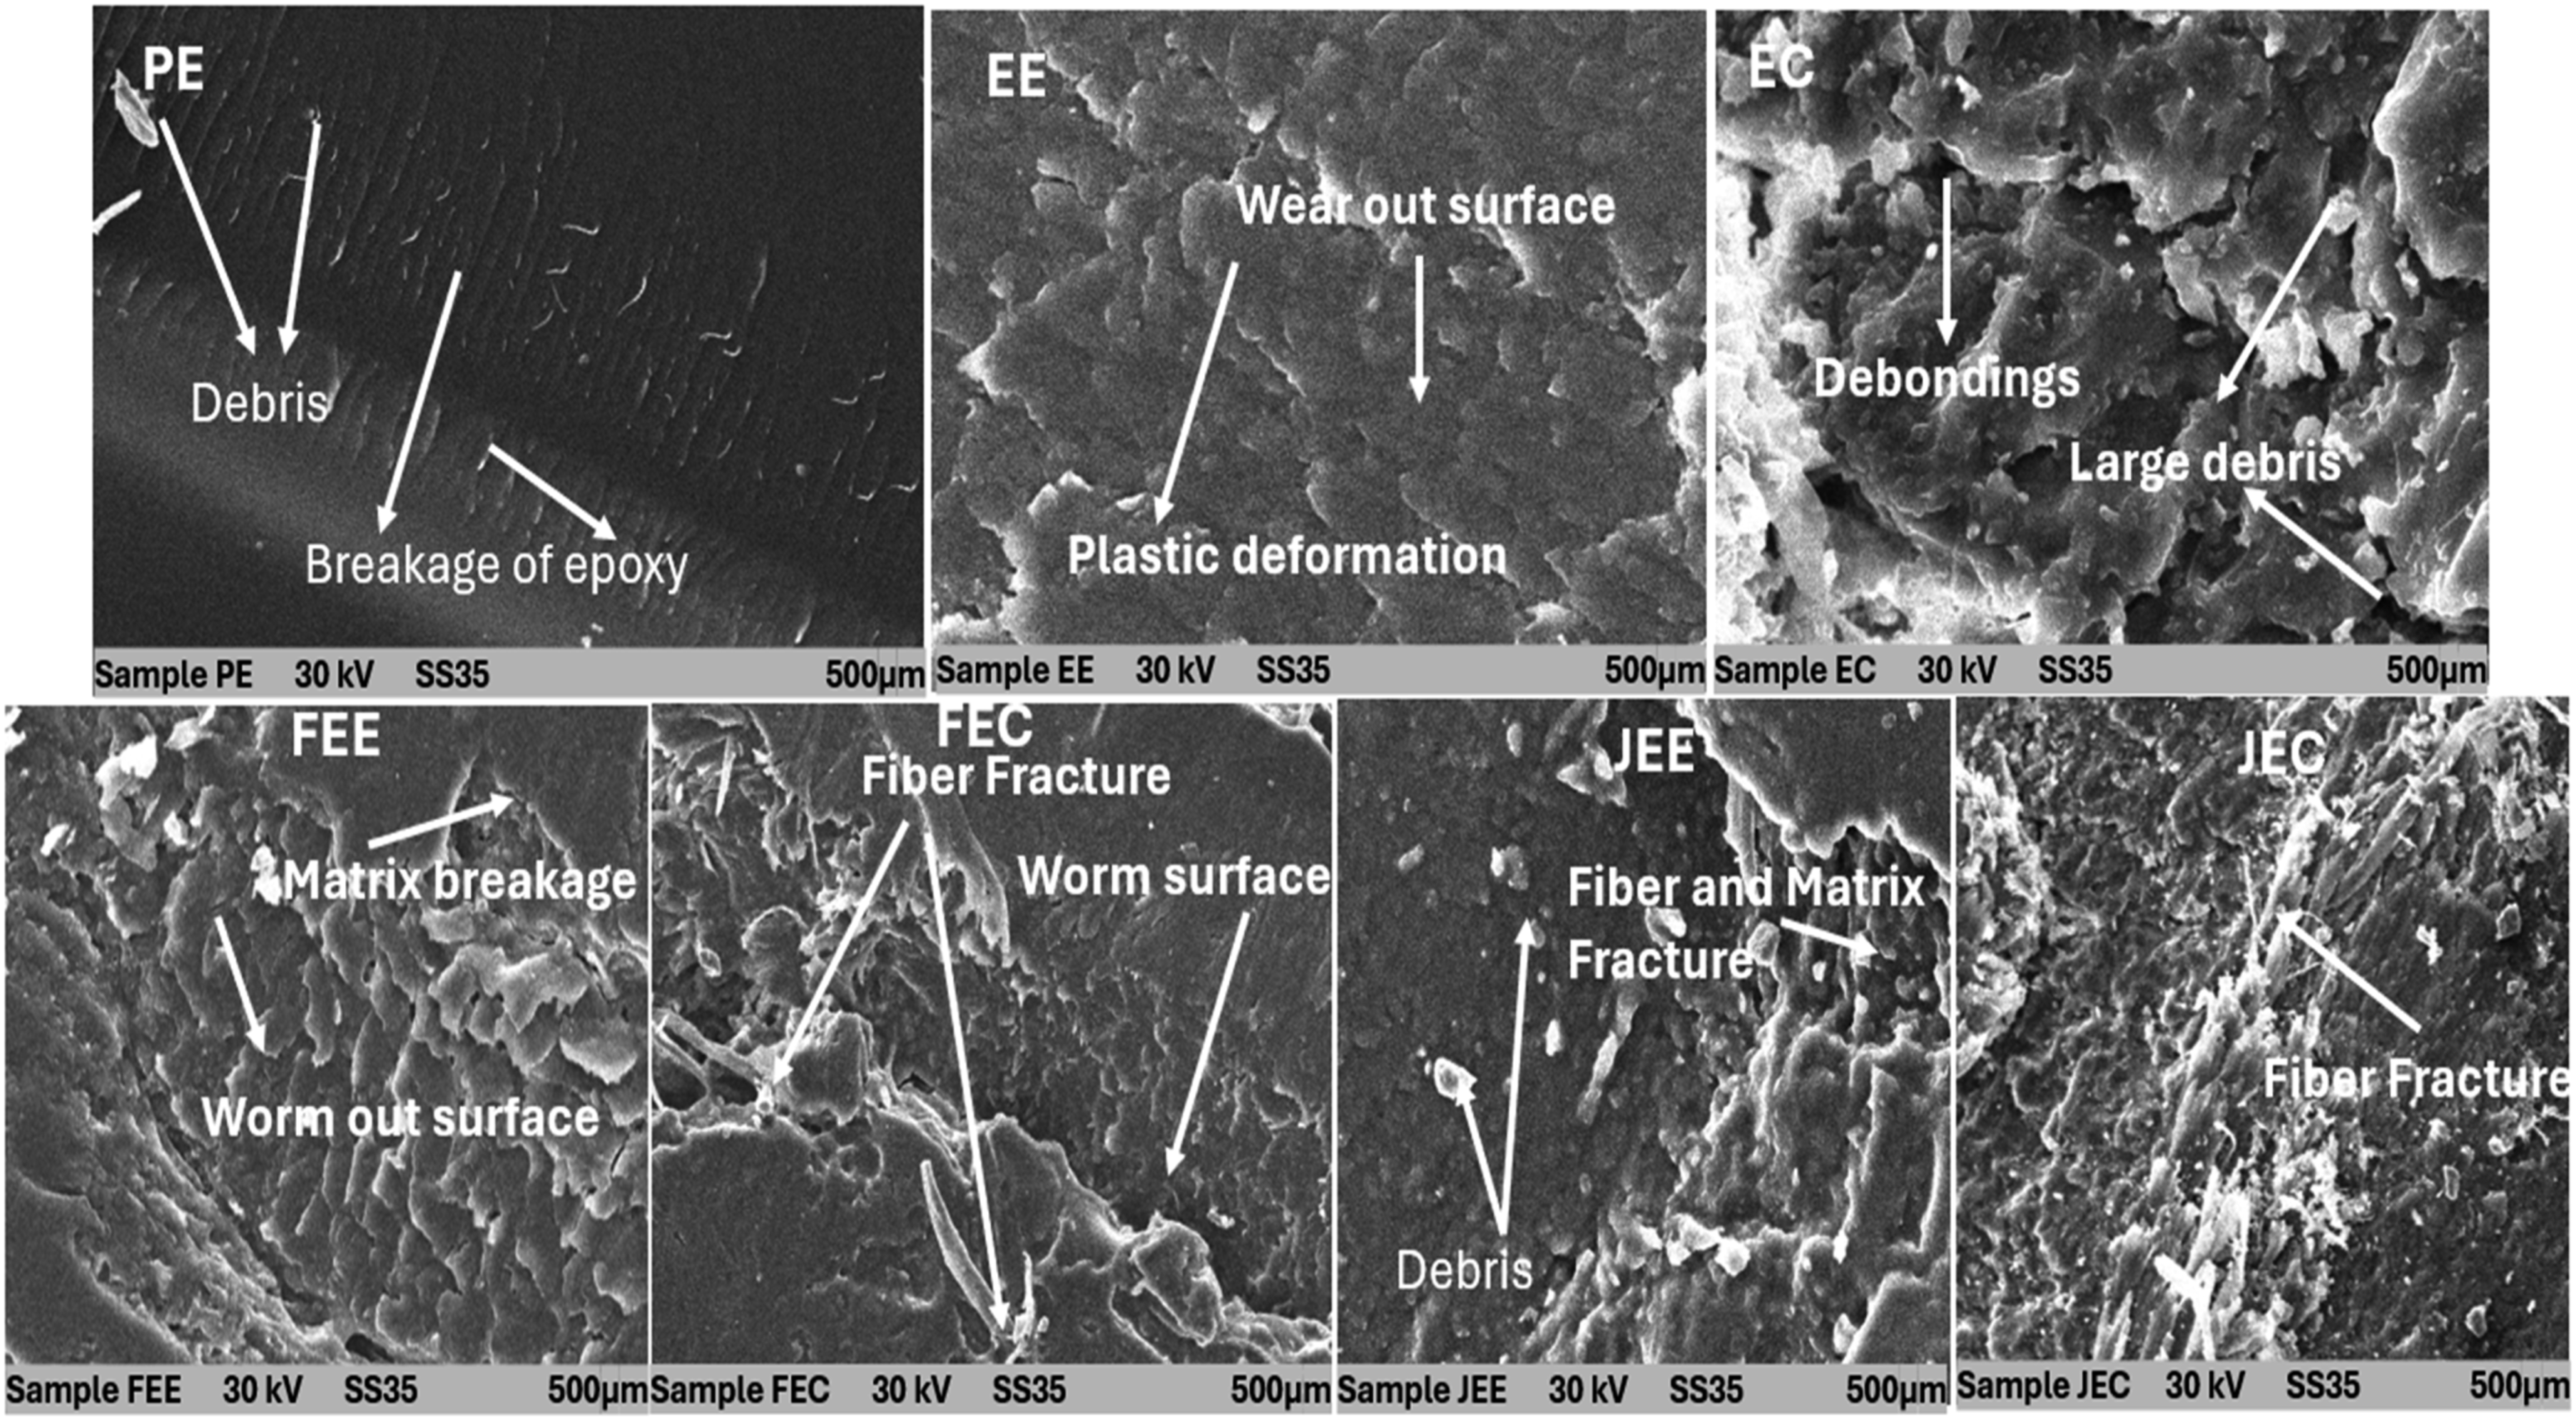
The incorporation of fibers provided reinforcement to the developed composites, as observed in the morphology of the FEE and FEC composites, which displayed long matrix fractures, matrix surface breakage, and fiber debonding, leading to large-scale matrix damage after sliding during tribological analysis. Flax, being a smooth fiber, exhibited minimal fiber fracture and fiber pull-out; however, these wear mechanisms were clearly visible in the SEM images of jute-reinforced composites due to the rough surface nature of jute fibers as compared to flax fibers. A similar behavior was observed between smooth eggshell and rough coconut shell fillers, where eggshell fillers showed compressed deformation, while coconut shell fillers exhibited greater fiber–matrix debonding during sliding, as observed in the SEM images of the JEE and JEC composites. SEM images of the JEC composite specimen revealed extensive fiber fracture, fiber debonding, and fiber pull-out, which corresponded to the highest frictional force observed during tribological analysis.
4.6. Interfacial temperature
Interfacial temperature plays a very vital role during tribological testing of all prepared specimens. Sliding in tribological analysis raises the temperature between specimen and steel counterface. As the applied load on specimen increases which enhanced the frictional force and increases the interfacial temperature. Figure 14 presents the interfacial temperature recorded for each of the developed composite materials during sliding at a speed of 5 m/s under applied loads of 10, 30, and 50 N. These temperature measurements illustrate how the thermal response of the composites changes with increasing load. By comparing the interfacial temperatures among the different composites, the figure helps identify materials with better thermal stability and lower heat generation during frictional contact. The incorporation of fibers with epoxy polymer and fillers increased the interfacial temperature as compared to pure epoxy and only filler-reinforced epoxy composites. Pure epoxy, EE, and EC composite samples showed almost similar interfacial temperatures at 10, 30, and 50 N applied loads at 5 m/s sliding speed. The PE sample achieved interfacial temperatures of 11°C, 23°C, and 33°C for 10, 30, and 50 N applied loads, respectively, at 5 m/s sliding speed. Similarly, the EE composite samples showed interfacial temperatures of 10°C, 21°C, and 31°C, while the EC composite samples achieved 9°C, 22°C, and 33°C for 10, 30, and 50 N applied loads at 5 m/s sliding speed. Interfacial temperature between composite specimen and tribometer sliding counterface.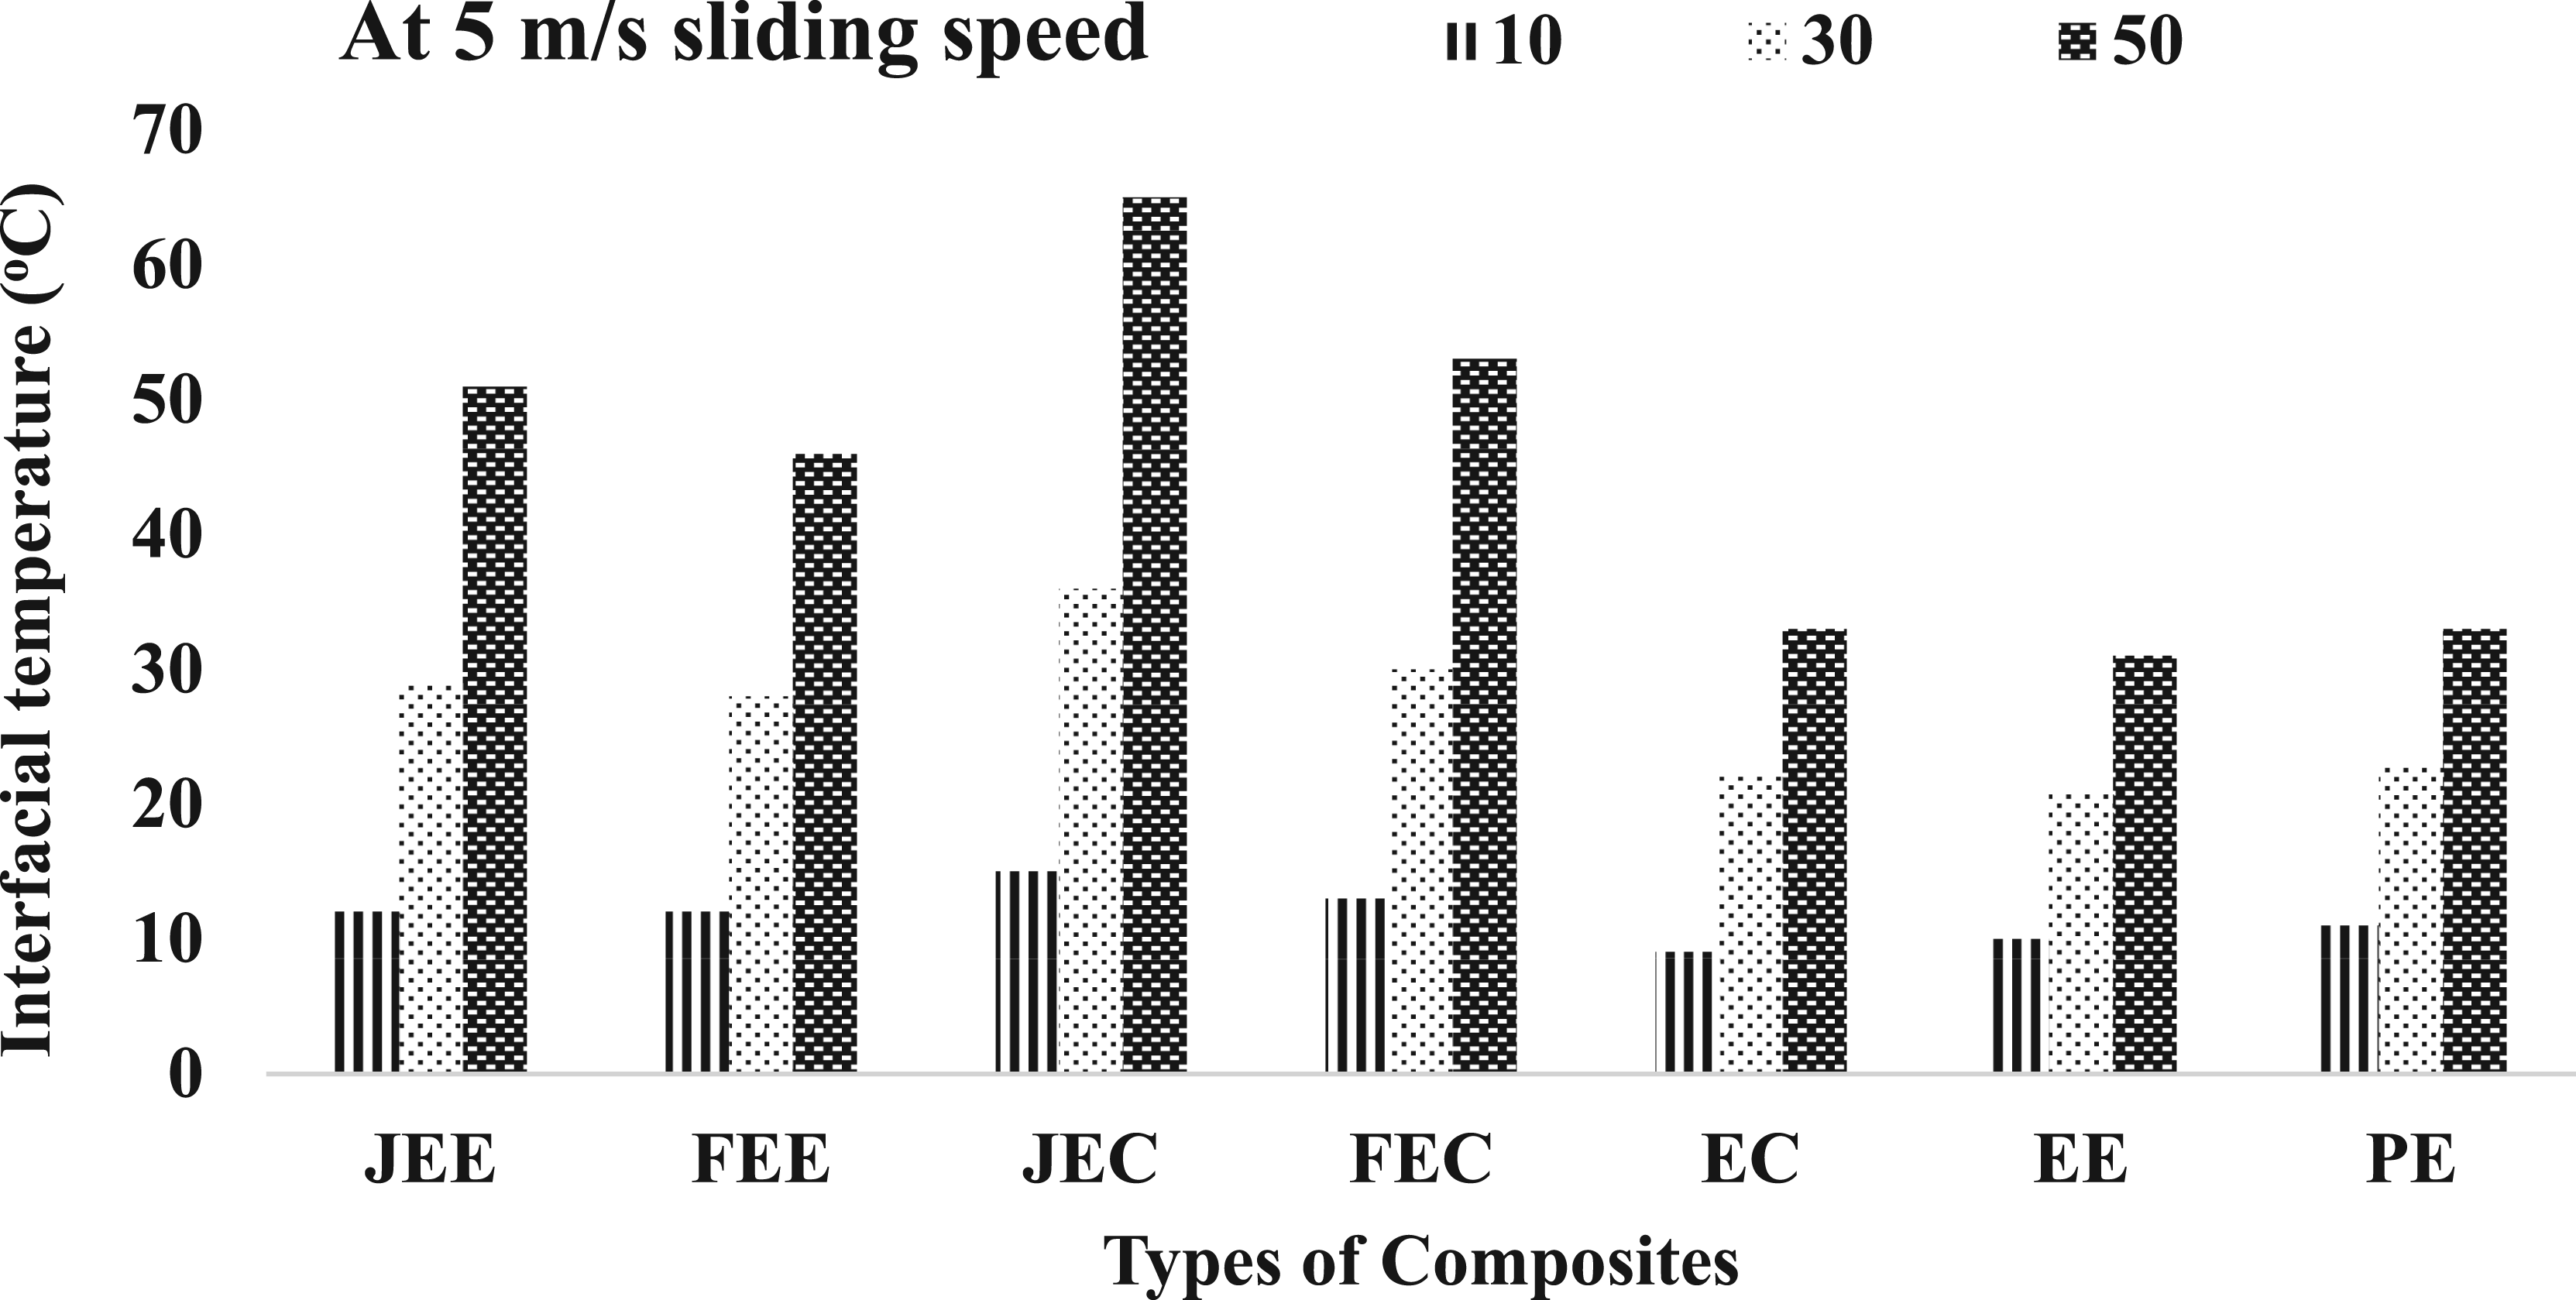
In composite samples, higher frictional force generated by rough jute- and coconut-reinforced epoxy composites resulted in higher interfacial temperatures as compared to smooth flax fiber- and eggshell filler-based polymer specimens. The FEE composite achieved interfacial temperatures of 12°C, 28°C, and 46°C, while the JEE composite displayed 12°C, 29°C, and 51°C for 10, 30, and 50 N applied loads at 5 m/s sliding speed. The FEC composite showed interfacial temperatures of 13°C, 30°C, and 53°C, whereas the JEC composite achieved the highest interfacial temperatures among all prepared specimens, namely 15°C, 36°C, and 65°C for 10, 30, and 50 N applied loads at 5 m/s sliding speed. Chaudhary et al. 24 examined the interfacial temperature generated between the steel counterface and various natural-fiber-reinforced composites, including jute, hemp, flax, and their hybrid laminates, during tribological testing. Their results showed that the interfacial temperature increased continuously as the specimen slid against the steel surface, indicating increased frictional heating. The authors further reported that at higher applied loads, particularly 30 N and 50 N, combined with a sliding speed of 5 m/s, the temperature rose sharply. This rapid rise in interfacial temperature caused softening and thermal distortion of the composite surface, ultimately leading to bending or warping of the specimen.
5. Conclusions
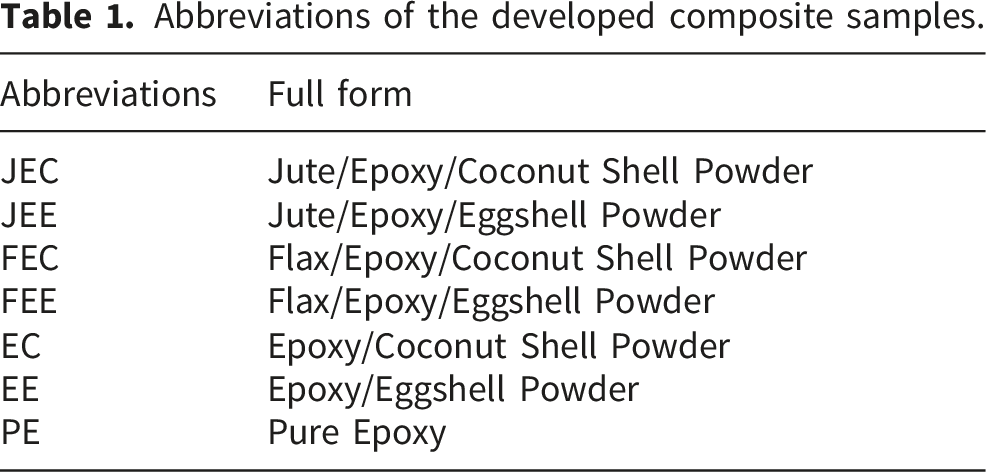
Tribological analysis, creep and fatigue tests of prepared composite demonstrate their potential application in the field of sliding surfaces and their suitability for loading and non-loading applications. Based on experimental findings, following are the concluding points as: i. Incorporation of natural fibers (jute and flax) and fillers (eggshell and coconut) with epoxy polymers improves the tribological performance of developed composite specimens. Experimental fatigue analysis revealed that pure epoxy exhibited the minimum number of fatigue cycles at each percentage of UTS. Maximum number of fatigue cycles 3750, 3189 and 2176 was achieved by Flax/Epoxy/Coconut Shell Powder composite at 25, 50 and 75% UTS of developed specimen. While inclusion of fillers and fiber reinforcement resist the creep strain as compared to neat epoxy which shows the highest value of creep strain 0.031 at 15000s. ii. In tribological tests, as the applied load mounts from 10 N to 50N, each developed composite specimens signify the rise in friction force. While friction force values for all samples increased rapidly from 0 to 500 sec and after that it becomes persistent for all samples at all applied loads. At 50 N applied load and 5m/s sliding speed, maximum friction forces were 34.87N, 29.76N, 30.88N, 25.33N, 25.92N, 25.73N and 24.4N by JEE, FEE, JEC, FEC, EC, EE, and PE composite specimens. iii. Coefficient of friction rises from 10 to 30 N applied load for 3, 5 and 7 m/s sliding speed but after 30 N applied load, all developed specimens indicate the decline in values of COF. JEE composite accomplished the highest value of COF for every sliding speed as compared to other developed composite specimen. iv. In Specific wear rate, the load and sliding speed affects the specific wear rate. SWR achieved substantial increment from 3 m/s to 5 m/s sliding speed, but very marginal changes occur from 5 to 7m/s sliding speed at 10 N applied loads for all prepared specimens. v. The frictional force and interfacial temperature enhanced by the increment in the applied load. JEC composite achieved the highest interfacial temperature among all prepared specimens at 15oC, 36oC, and 65oC for 10, 30 and 50 N applied load at 5 m/s sliding speed. vi. SEM analysis of PE specimen showed debris formation and scratches on the epoxy sample after sliding against steel counterface due to brittle nature of solid epoxy. EE composite appears the wear out surfaces and some plastic deformation and fracture of surfaces in SEM graphs. The morphology of FEE and FEC showed elongated fractures, matrix breakage, and fiber debonding due to sliding during tribological analysis. The abbreviations employed in this manuscript are illustrated in Table 1. Abbreviations of the developed composite samples.
6. Limitations, research directions and potential future
Overall, the study provides comprehensive insights into the properties of bio-fiber- and filler-based polymer composites, highlighting the effect of the composition of different fillers and fibers on fatigue, creep, and tribological (wear and friction) behaviour of polymeric composites. The limitations of the current study include the fact that only specific proportions of coconut shell powder and eggshell powder were tested, while the effects of fixed fiber orientation and fixed fabric architectures (woven, unidirectional, and mat) were not extensively explored. The developed composites also have constraints related to manufacturing techniques, such as manual lay-up, vacuum infusion, or simple moulding methods. These limitations create opportunities for future research and development of the fabricated composites.
The findings of the present study contribute to a better understanding of filler-based composite materials and offer valuable insights for potential applications in various industries, including automotive, aerospace, and construction. Further research could explore optimization strategies for improving specific properties of these polymer composites. Future studies can be focused on varying the proportions and hybridization of fillers and fibers, along with their surface treatment and chemical modification, to enhance applicability in terms of improved structural and thermal stability. Investigations into long-term environmental exposure, biodegradability, fire resistance, and acoustic performance will further expand the potential applicability of these composites in advanced defense systems and military equipment.
Footnotes
Acknowledgment
The authors extend their appreciation to Umm Al-Qura University, Saudi Arabia for funding this research work through grant number: 26UQU4300304GSSR05.

Consent for publication
All authors have read and approved this manuscript.
Author contributions
Conceptualization, Vijay Chaudhary, Shashi Prakash Dwivedi, Chanchal Ahlawat, Krishna Prakash Arunachalam, Rajeev Kumar; methodology, Vijay Chaudhary, Shashi Prakash Dwivedi, Chanchal Ahlawat, Krishna Prakash Arunachalam, Rajeev Kumar; formal analysis, Vijay Chaudhary, Shashi Prakash Dwivedi, Shubham Sharma, Chanchal Ahlawat, N. Beemkumar, Abinash Mahapatro, Krishnaraj Ramaswamy; investigation, Vijay Chaudhary, Shashi Prakash Dwivedi, Chanchal Ahlawat, Krishna Prakash Arunachalam, Rajeev Kumar; writing—original draft preparation, Vijay Chaudhary, Shashi Prakash Dwivedi, Chanchal Ahlawat, Krishna Prakash Arunachalam, Rajeev Kumar; writing—review and editing, Shubham Sharma, Mohamed Abbas, Saiful Islam, Aseel Smerat, Medhat M. Helal, Ishwar Bhiradi, Krishnaraj Ramaswamy; supervision, Mohamed Abbas, Saiful Islam, Aseel Smerat, Medhat M. Helal, Ishwar Bhiradi, Krishnaraj Ramaswamy; project administration, Mohamed Abbas, Saiful Islam, Aseel Smerat, Medhat M. Helal, Ishwar Bhiradi, Krishnaraj Ramaswamy. All authors have read and agreed to the published version of the manuscript.
Funding
The authors extend their appreciation to Umm Al-Qura University, Saudi Arabia for funding this research work through grant number: 26UQU4300304GSSR05.
Declaration of conflicting interests
The authors declared no potential conflicts of interest with respect to the research, authorship, and/or publication of this article.
Data Availability Statement
All the characterizations, analysis, testing’s related work and testing’s have solely been responsible by Vijay Chaudhary. Additionally, the raw data can be obtained on request from the corresponding author, Vijay Chaudhary. In addition, the datasets used and/or analysed during the current study available from the corresponding author (Vijay Chaudhary) on reasonable request.
AI assisted writing
AI Assisted Writing AI tools such as ChatGPT was used for the preparation of the manuscript for grammar and language editing, formatting.