
Abstract
The aim of this study is to investigate the manufacturability of Melilotus officinalis (L.) reinforced epoxy biocomposites as a renewable biofiller and to characterize the mechanical, thermal, and dielectric properties of these materials. For this purpose, composites containing biomass at 0, 3, 6, and 9 wt.% were prepared; the samples were examined by tensile testing, FTIR, SEM, EDX, XRD, Shore D hardness, thermal conductivity, and dielectric analysis. The findings showed that with increasing M. officinalis content, tensile strength, hardness, and density decreased, while ductility and elongation at break improved. The significant decrease in thermal conductivity revealed an increase in heat insulation efficiency. Dielectric analyses showed that strong interfacial polarization occurred at low frequencies, and the dielectric constant and loss values decreased as the frequency increased. SEM examinations confirmed that the plant-derived filler was homogeneously distributed and formed acceptable interfacial adhesion with the matrix. In conclusion, although the use of synthetic epoxy matrix and the decrease in mechanical strength limit load-bearing structural applications, M. officinalis is a promising biofiller for lightweight and partially bio-based epoxy composites thanks to its increased ductility and improved thermal insulation properties.
Introduction
In recent years, the demand for eco-friendly and sustainable materials has grown considerably, driven by increasing environmental awareness and the global shift toward green and circular technologies. Within this context, biocomposite materials have emerged as promising alternatives to conventional polymer-based systems. These materials offer notable advantages, including renewability, biodegradability, low environmental impact, and cost-effectiveness, rendering them suitable for diverse structural, packaging, and engineering applications. Among various natural resources, lignocellulosic plant-based materials are particularly attractive for biocomposite fabrication due to their abundance, renewability, low density, and favorable mechanical properties. Furthermore, their capacity to enhance interfacial adhesion and contribute to the overall sustainability of composite systems underscores their potential as next-generation reinforcement materials.1–3
The utilization of lignocellulosic resources derived from natural sources offers substantial environmental and sustainability benefits. Due to their primary constituents—namely cellulose, hemicellulose, and lignin—these raw materials can significantly contribute to the structural integrity and durability of biocomposites. Their inherent chemical composition promotes strong interfacial interactions with polymer matrices, thereby improving stress transfer efficiency and overall composite performance. This synergistic effect supports the development of high-performance, environmentally friendly materials that align with the principles of sustainable design. Moreover, the incorporation of lignocellulosic fibers into polymer systems enhances the mechanical, thermal, and dimensional stability of the resulting composites through effective natural fiber reinforcement.4,5
Moreover, the utilization of lignocellulosic materials contributes to waste reduction and supports recycling efforts within a circular economy framework. Agricultural by-products and wood-derived plant residues serve as valuable and sustainable sources of raw materials for biocomposite fabrication. This approach not only addresses waste management challenges but also offers considerable economic advantages by converting low-cost, renewable biomass into value-added materials. In addition, the widespread availability and compositional diversity of lignocellulosic feedstocks facilitate their large-scale application across various industrial sectors, further highlighting their potential as key components in sustainable material design.6,7 Furthermore, this approach can significantly reduce the overall production costs of biocomposites by utilizing low-cost natural resources and minimizing energy input during processing. The inherent advantages of such systems—including low energy consumption, ease of recyclability, and minimal environmental footprint—further enhance the sustainability of the production process. These features establish biocomposites as cost-effective and eco-efficient alternatives to conventional synthetic materials, in line with current global priorities for sustainable manufacturing and resource conservation. 8 Consequently, this contributes to the development of sustainable production systems by minimizing long-term environmental burdens. Given their biodegradable nature, biocomposites can undergo decomposition under natural conditions, thereby reducing waste accumulation and ecological impact at the end of their service life.9,10
Lignocellulosic biocomposites are widely used in the automotive, construction, and packaging sectors. Their prominence in these industries stems from their eco-friendly and lightweight material advantages. Both the uniform distribution of plant fibers in the matrix and the quality of fiber-matrix interfacial bonds directly influence the performance of biocomposites. 11 Accordingly, fiber surface modification and interfacial interactions play a critical role in enhancing the compatibility between lignocellulosic fillers and polymer matrices. The present study comprehensively investigates the influence of lignocellulosic plant-based raw materials on biocomposite production processes. Specifically, the effects of different fabrication techniques and processing parameters on the resulting material properties were systematically analyzed. A detailed evaluation of the physical, mechanical, and thermal characteristics of the produced biocomposites is presented to provide insight into their performance and structure–property relationships. Moreover, recent research on the environmental impacts and sustainability potential of biocomposites is examined to highlight their role in green material development. Among these materials, M. officinalis, a member of the Fabaceae family, is particularly noteworthy due to its invasive character, honey-producing capacity, and ability to accumulate heavy metals such as lead. It also serves as a soil conditioner and a rich natural source of coumarin, which exhibits significant medicinal properties. Lastly, the current and prospective industrial applications of lignocellulosic-based biocomposites are discussed to illustrate how these materials can be effectively utilized across various sectors.12–14
In this study, epoxy-based polymer biocomposites were fabricated using M. officinalis (scented clover) as a natural reinforcing material. The effects of varying biomass loadings (0, 3, 6, and 9 wt.%) on the mechanical, thermal, and dielectric properties of the composites were systematically investigated. The prepared samples were characterized using several analytical techniques, including tensile testing, FTIR, SEM–EDX, XRD, Shore D hardness, and bulk density measurements. The findings indicated that the incorporation of M. officinalis had a notable impact on the structural integrity, mechanical strength, thermal conductivity, and dielectric behavior of the epoxy composites. In addition, the dispersion of the plant-based filler within the polymer matrix and its interfacial bonding characteristics were examined through morphological analyses. This study offers a novel contribution to the design and development of next-generation, eco-friendly, lightweight polymer composites with enhanced thermal insulation performance.
Materials and methods
Raw material preparation and obtaining polymer composite
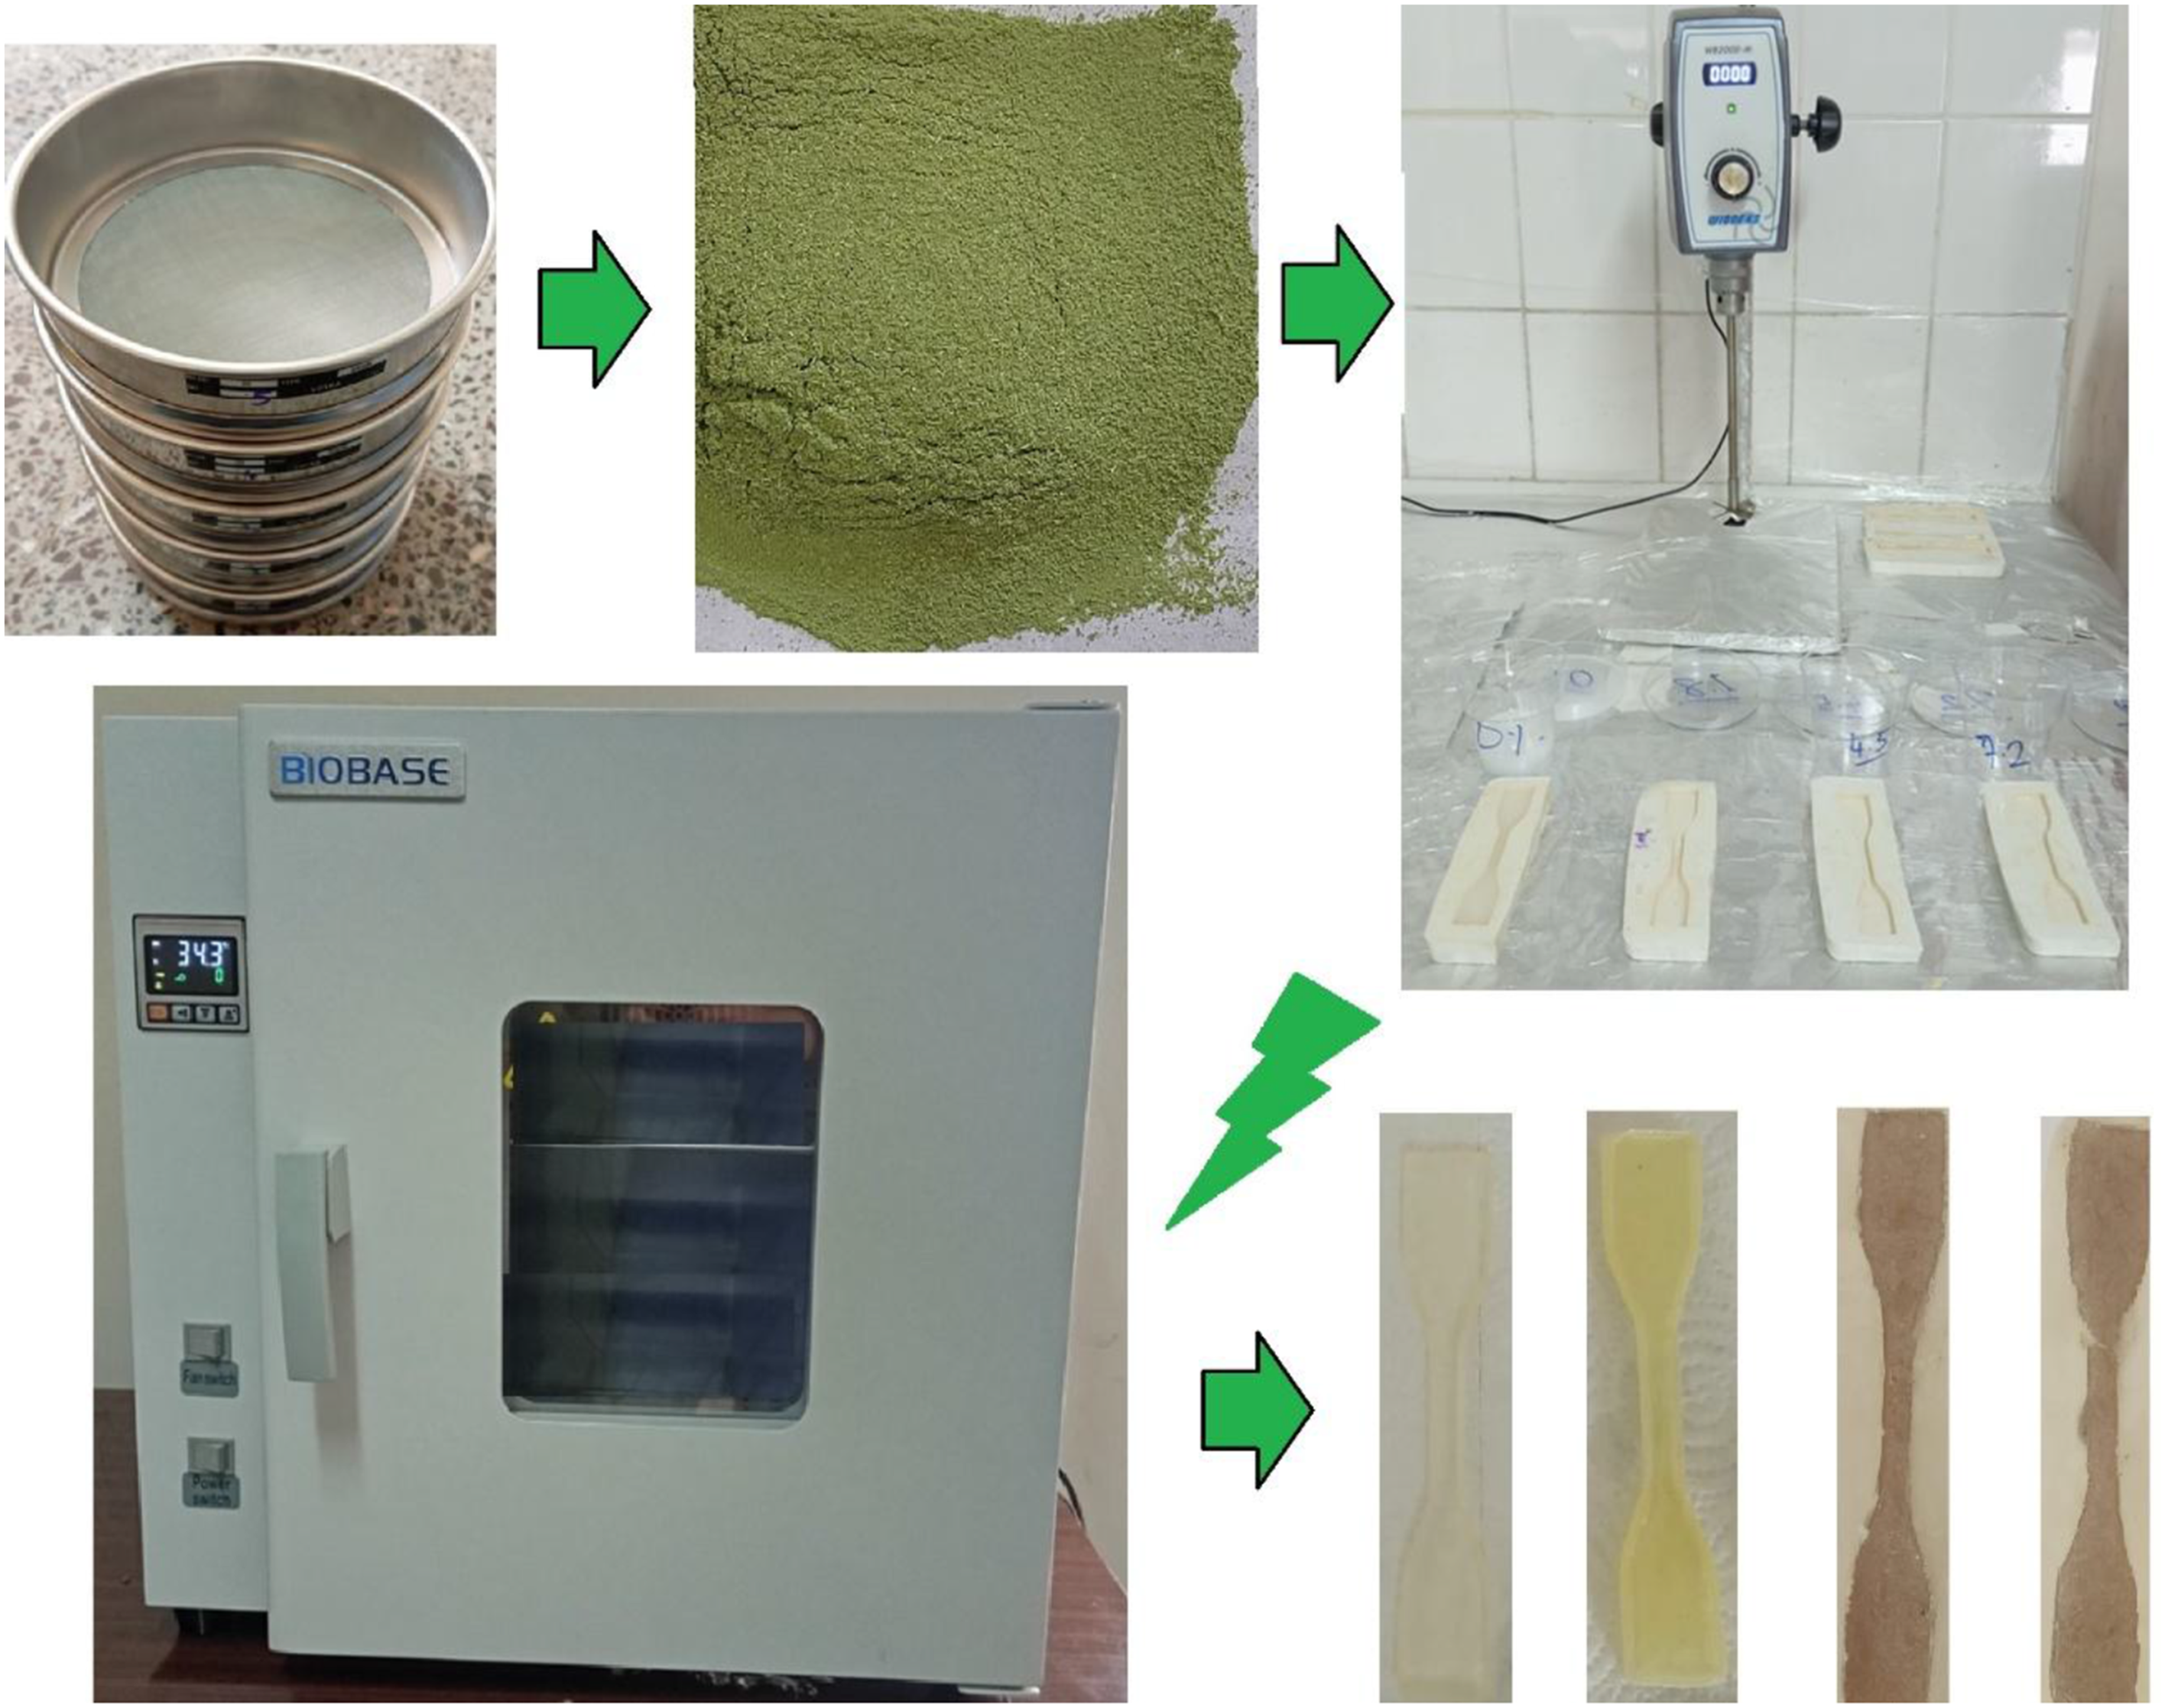
In this study, M. officinalis was used as a reinforcement material in the production of epoxy-based biocomposites. The plant material was collected from the Aktuluk neighborhood, Munzur University campus (Tunceli/Türkiye) during the flowering period. The collected specimens were subsequently appropriately dried and converted into herbarium specimens and were preserved in Munzur University laboratories (Voucher specimen: MA 2053). Following collection, the plants were cleaned to remove impurities and then dried in an oven at 55 °C to remove moisture. After the drying process, the biomass was subjected to sizing procedures. Dried M. officinalis samples were processed in a grinding device, and the resulting powder was obtained as a micrometric fraction with a particle size in the range of 149–297 µm after a standard sieving process. This particle size range was preferred because it provides a high surface area, increasing the interaction between the filler and the epoxy matrix, reducing the risk of agglomeration often observed in nanometer-scale fillers, and facilitating a more homogeneous mixing of epoxy resin and biomass, thus contributing to the formation of a more stable composite structure.15,16 This process was carried out to ensure a more homogeneous mixing of the biomass with the epoxy resin. Following size reduction, the ground biomass was used in composite preparation subsequent to activating the cellulosic compounds through physical activation.
In the present study, the epoxy system used for composite fabrication consisted of a two-component thermosetting resin (Epoxy A) and its corresponding hardener (Epoxy B), both supplied by Polisan. The resin and hardener were mixed at a fixed ratio of 2:1 by mass (Epoxy A: Epoxy B) in accordance with the manufacturer’s specifications to ensure optimal crosslinking. Initially, the ground M. officinalis powder was incorporated into Epoxy A at predetermined filler loadings (0, 3, 6, and 9 wt.%). The mixture was mechanically stirred at 500 rpm for 15 min at room temperature (∼25 °C) to achieve a homogeneous dispersion of the biofiller within the epoxy matrix. Subsequently, Epoxy B was added to the mixture and stirred further until a uniform and consistent mixture was obtained. No separate degassing step was applied; however, the mixing process was carefully controlled to minimize air entrapment. The prepared mixtures were processed within the practical pot life of the epoxy system to avoid premature curing and to ensure consistency across all formulations.
The homogeneous mixtures were then cast into silicone molds with geometries selected according to the intended characterization methods. Standard tensile test specimen (ASTM D638/ISO 527) samples were used for mechanical testing, while circular Petri dishes with a diameter of 90 mm were used for general sample preparation. In addition, cylindrical molds with a diameter of 5 cm and a depth of 5 cm were employed for bulk and dielectric measurements. After casting, all samples were cured in an oven at 50 °C for 24 h under controlled conditions to ensure complete crosslinking of the epoxy network. Following the curing process, the samples were allowed to cool naturally to room temperature. No post-curing treatment was applied, and all composite formulations were processed under identical curing conditions to maintain experimental consistency. This curing schedule was selected to provide sufficient thermal energy for network formation while avoiding excessive thermal degradation or internal stress development in the composite structure. The procedural steps are schematically shown in Figure 1, and photographs of the resulting samples are shown in Figure 2. Production scheme of M. officinalis reinforced epoxy-based biocomposite. Photographs of M. officinalis reinforced epoxy-based biocomposite.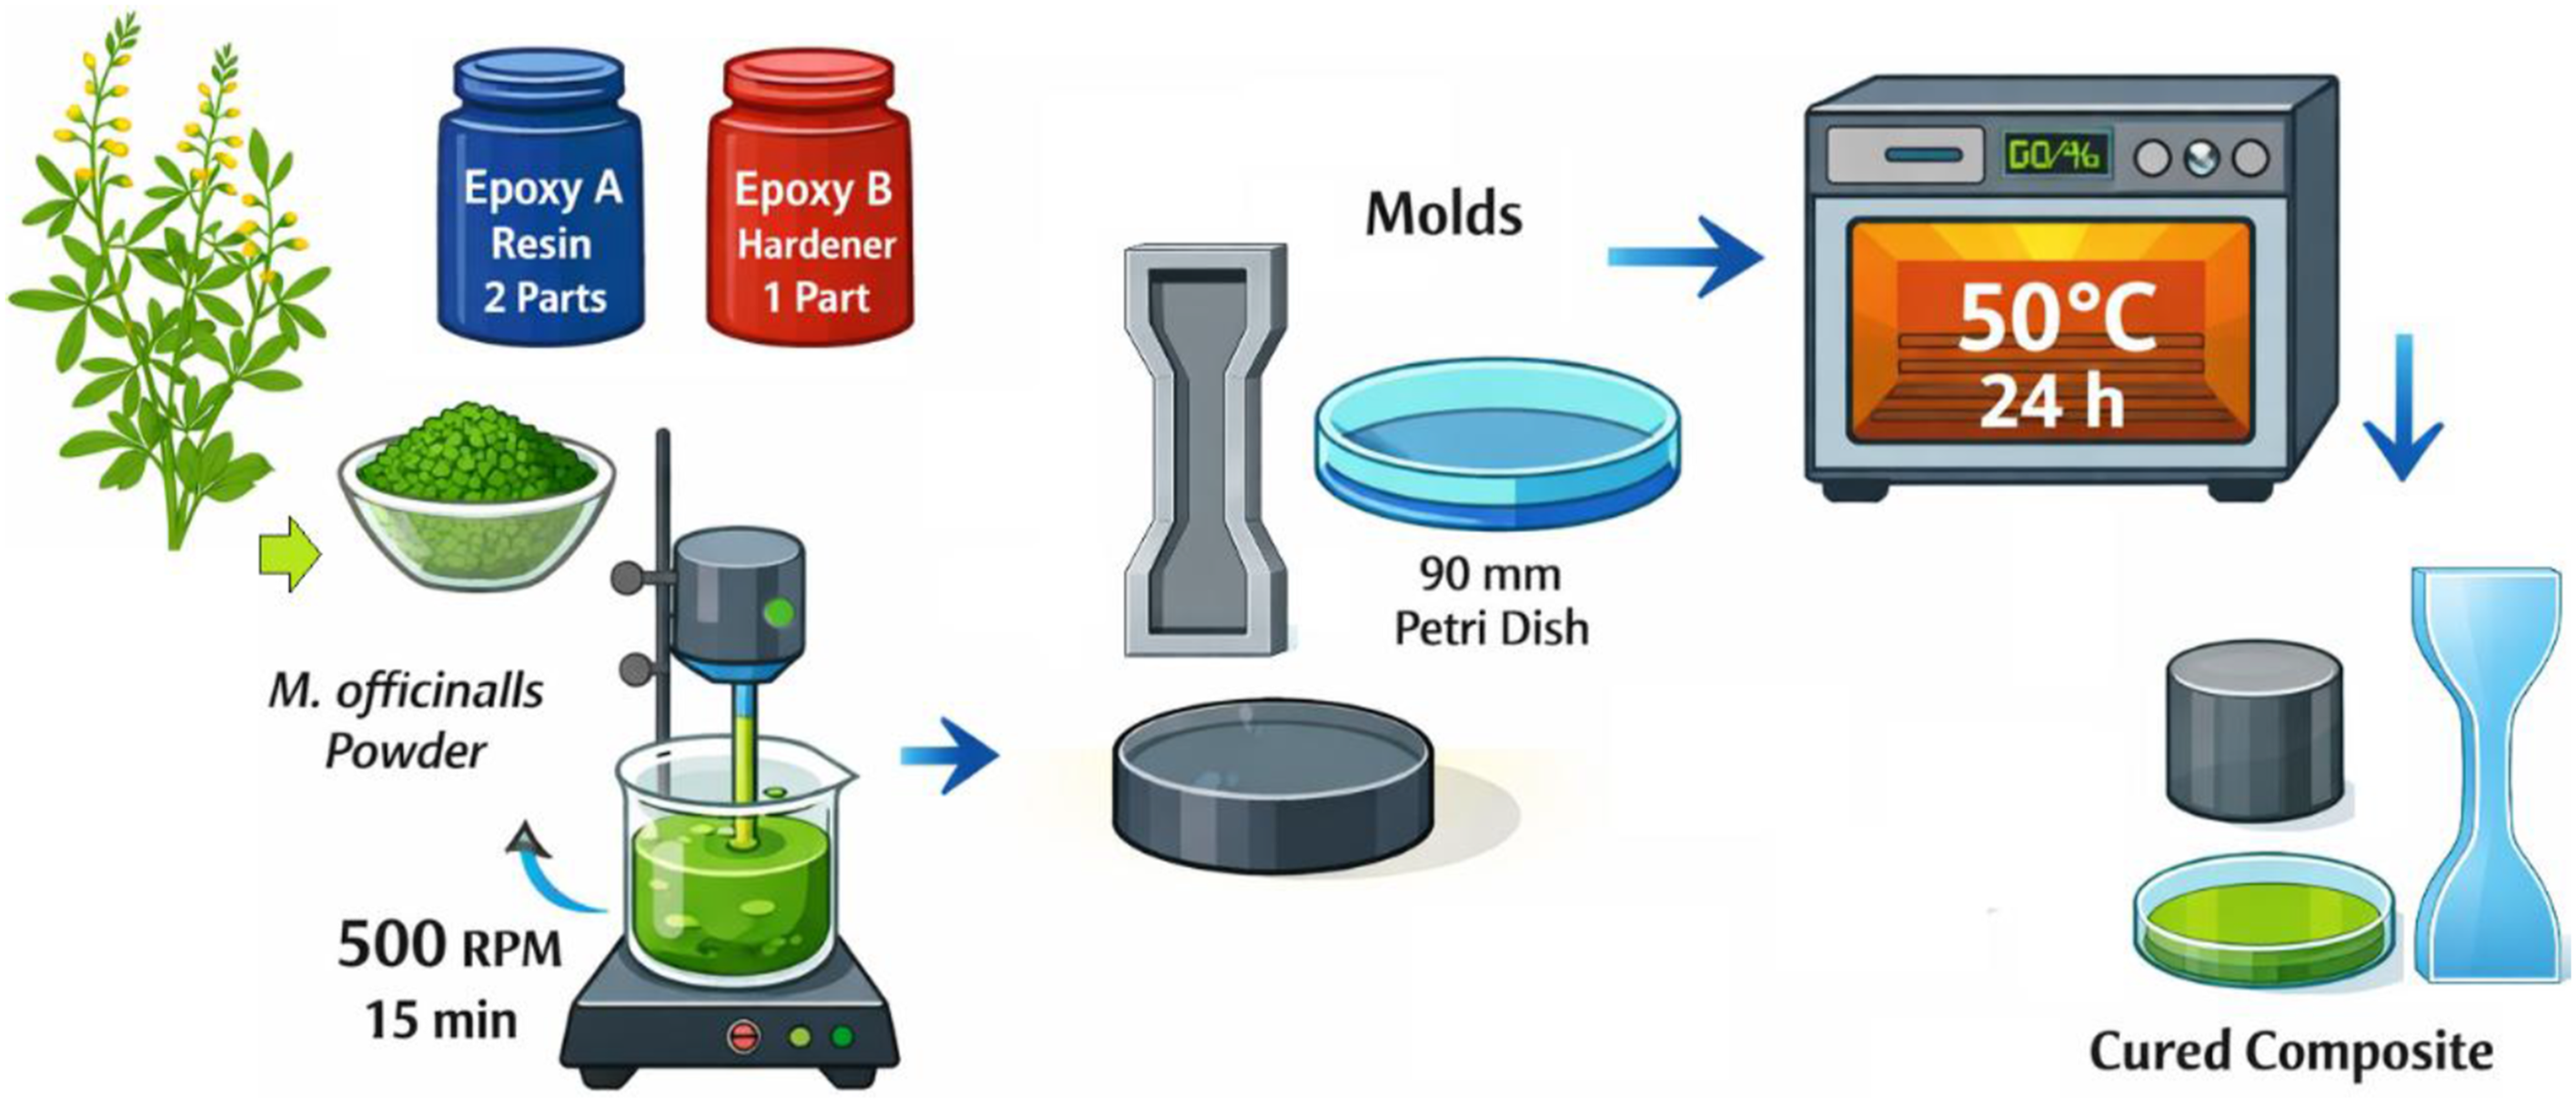
Characterization of the biocomposites
The bulk density of the biocomposite samples was determined from the ratio of mass to volume. The mass of each sample was measured using an analytical balance, while the dimensions were determined using a digital caliper. Cylindrical molds were used for sample preparation, and at least three measurements were performed for each formulation; average values were reported.
Surface hardness was evaluated according to ASTM D2240 using the Shore D hardness test. Before testing, the sample surfaces were cleaned and flattened as much as possible to ensure reliable contact between the indenter and the specimen. Measurements were performed at room temperature, and the average of at least three measurements was recorded for each sample.
The thermal conductivity coefficient was measured using a Thermtest TLS-100 instrument. The measurements were performed according to the Transient Line Source (TLS) method, and three consecutive measurements were carried out for each sample to ensure repeatability. The thermal conductivity coefficient (k) was calculated according to the relevant TLS relationship based on the temperature rise versus logarithmic time response of the sample. Besides, thermogravimetric analysis (TGA) analyses of the compounds were carried out with Perkin Elmer Diamond in nitrogen atmosphere (flow rate: 200 mL/min) between 20 and 550 °C with a heating rate of 10 °C/min.
FTIR analysis was carried out using a Shimadzu IRSpirit QATR-S spectrometer in the wavenumber range of 4000–400 cm-1. All spectra were recorded at room temperature, and the obtained spectra were used to identify the characteristic functional groups and possible interactions between the epoxy matrix and the lignocellulosic filler.
The tensile properties of the produced biocomposite samples were determined using a universal testing machine according to ASTM D638. Tensile strength and elongation at break values were measured at room temperature on specimens prepared in standard dimensions. At least three specimens were tested for each composite formulation, and the average values were reported.
To investigate the surface morphology and filler–matrix interface, SEM analysis was performed using a HITACHI SU3500 instrument. Prior to analysis, the samples were coated with a thin layer of gold to improve surface conductivity. Micrographs were recorded at an acceleration voltage of 5 kV and at different magnifications. The elemental composition of the selected samples was further analyzed using the EDX unit attached to the same instrument.
The structural characteristics of the composites were examined using a Rigaku MiniFlex 600 XRD diffractometer. The diffraction patterns were recorded in the 2θ range of 10°–30° in order to evaluate the amorphous nature of the epoxy-based composite structure.
Dielectric properties were measured in accordance with ASTM D150 using a FYTRONIX FY-FP-9000 instrument in the frequency range of 100 Hz–1 MHz at 25 °C. Disc-shaped samples with gold-plated surfaces were used for dielectric measurements. The samples were placed between two conductive electrodes and gently pressed under approximately 7 tons to ensure proper electrical contact. The thickness of each specimen was individually measured using a digital micrometer prior to analysis. From the measured capacitance and dielectric loss factor data, dielectric constant, dielectric loss, and electrical conductivity values were calculated.The dielectric constant (ε′) was calculated from the measured capacitance values using Eq. (1):

The capacitance (C), sample thickness (d), electrode surface area (A), vacuum permittivity (ε0), and dielectric constant (ε) are all represented in this equation. The dielectric loss coefficients of the epoxy-based thermoset composites were determined using Eq. (2):

Results
FTIR spectra results
Figure 3 shows the FTIR spectra of biocomposites based on pure epoxy resin and those reinforced with different proportions (0, 3, 6, and 9 wt.%) of M. officinalis powder. In the spectra of the pure epoxy resin, the bands between 3050–2870 cm-1 correspond to C–H stretching vibrations, while the characteristic peak around 915 cm-1 is attributed to the epoxy ring (–CH–O–CH2). This peak, belonging to the epoxy ring, was observed with a slightly reduced intensity in the reinforced biocomposites; such a reduction suggests that the epoxy rings were opened and partially consumed during the curing reaction. The appearance of a broad band around 3400 cm-1 in the spectra after M. officinalis reinforcement indicates that the –OH groups in the lignocellulosic structure undergo physical interaction with the epoxy matrix via hydrogen bonds. Similarly, the prominent peak observed in the 1720–1740 cm-1 range confirms the presence of carbonyl (C=O) groups originating from the lignocellulosic components. The presence of this carbonyl band further indicates that curing is complete in the epoxy composites and that partially oxygenated groups are formed in the matrix.17–20 In addition, the bands in the 1600–1500 cm-1 range correspond to aromatic C=C vibrations, and the peaks in the 1240–1050 cm-1 region are associated with C–O–C stretching vibrations. A significant increase in the intensity of the –OH band around 3400 cm-1 was observed with increasing M. officinalis content. This trend suggests that the number of hydroxyl groups in the matrix, and therefore the hydrogen bonding interactions with the epoxy matrix, increases proportionally with the amount of biomass. The absence of new functional group bands in the spectra indicates that no chemical reaction occurred between the M. officinalis powder and the epoxy matrix, implying that physical interactions dominate the system. These findings suggest that the biomass is homogeneously distributed within the epoxy matrix and forms effective physical interactions with the filler phase, which in turn contributes to the modification of the surface mechanical behavior of the epoxy composites with increasing biofiller content. This finding demonstrates that the biomass is homogeneously distributed within the epoxy resin and that strong bonds, based on physical interactions such as hydrogen bonds, are formed between the matrix and the filler phase; such interfacial characteristics contribute to the overall stability of the composite system and confirm that the obtained findings are consistent with the aim of the study.21,22 FTIR spectra of the epoxy-based thermoset resin samples with varying M. officinalis.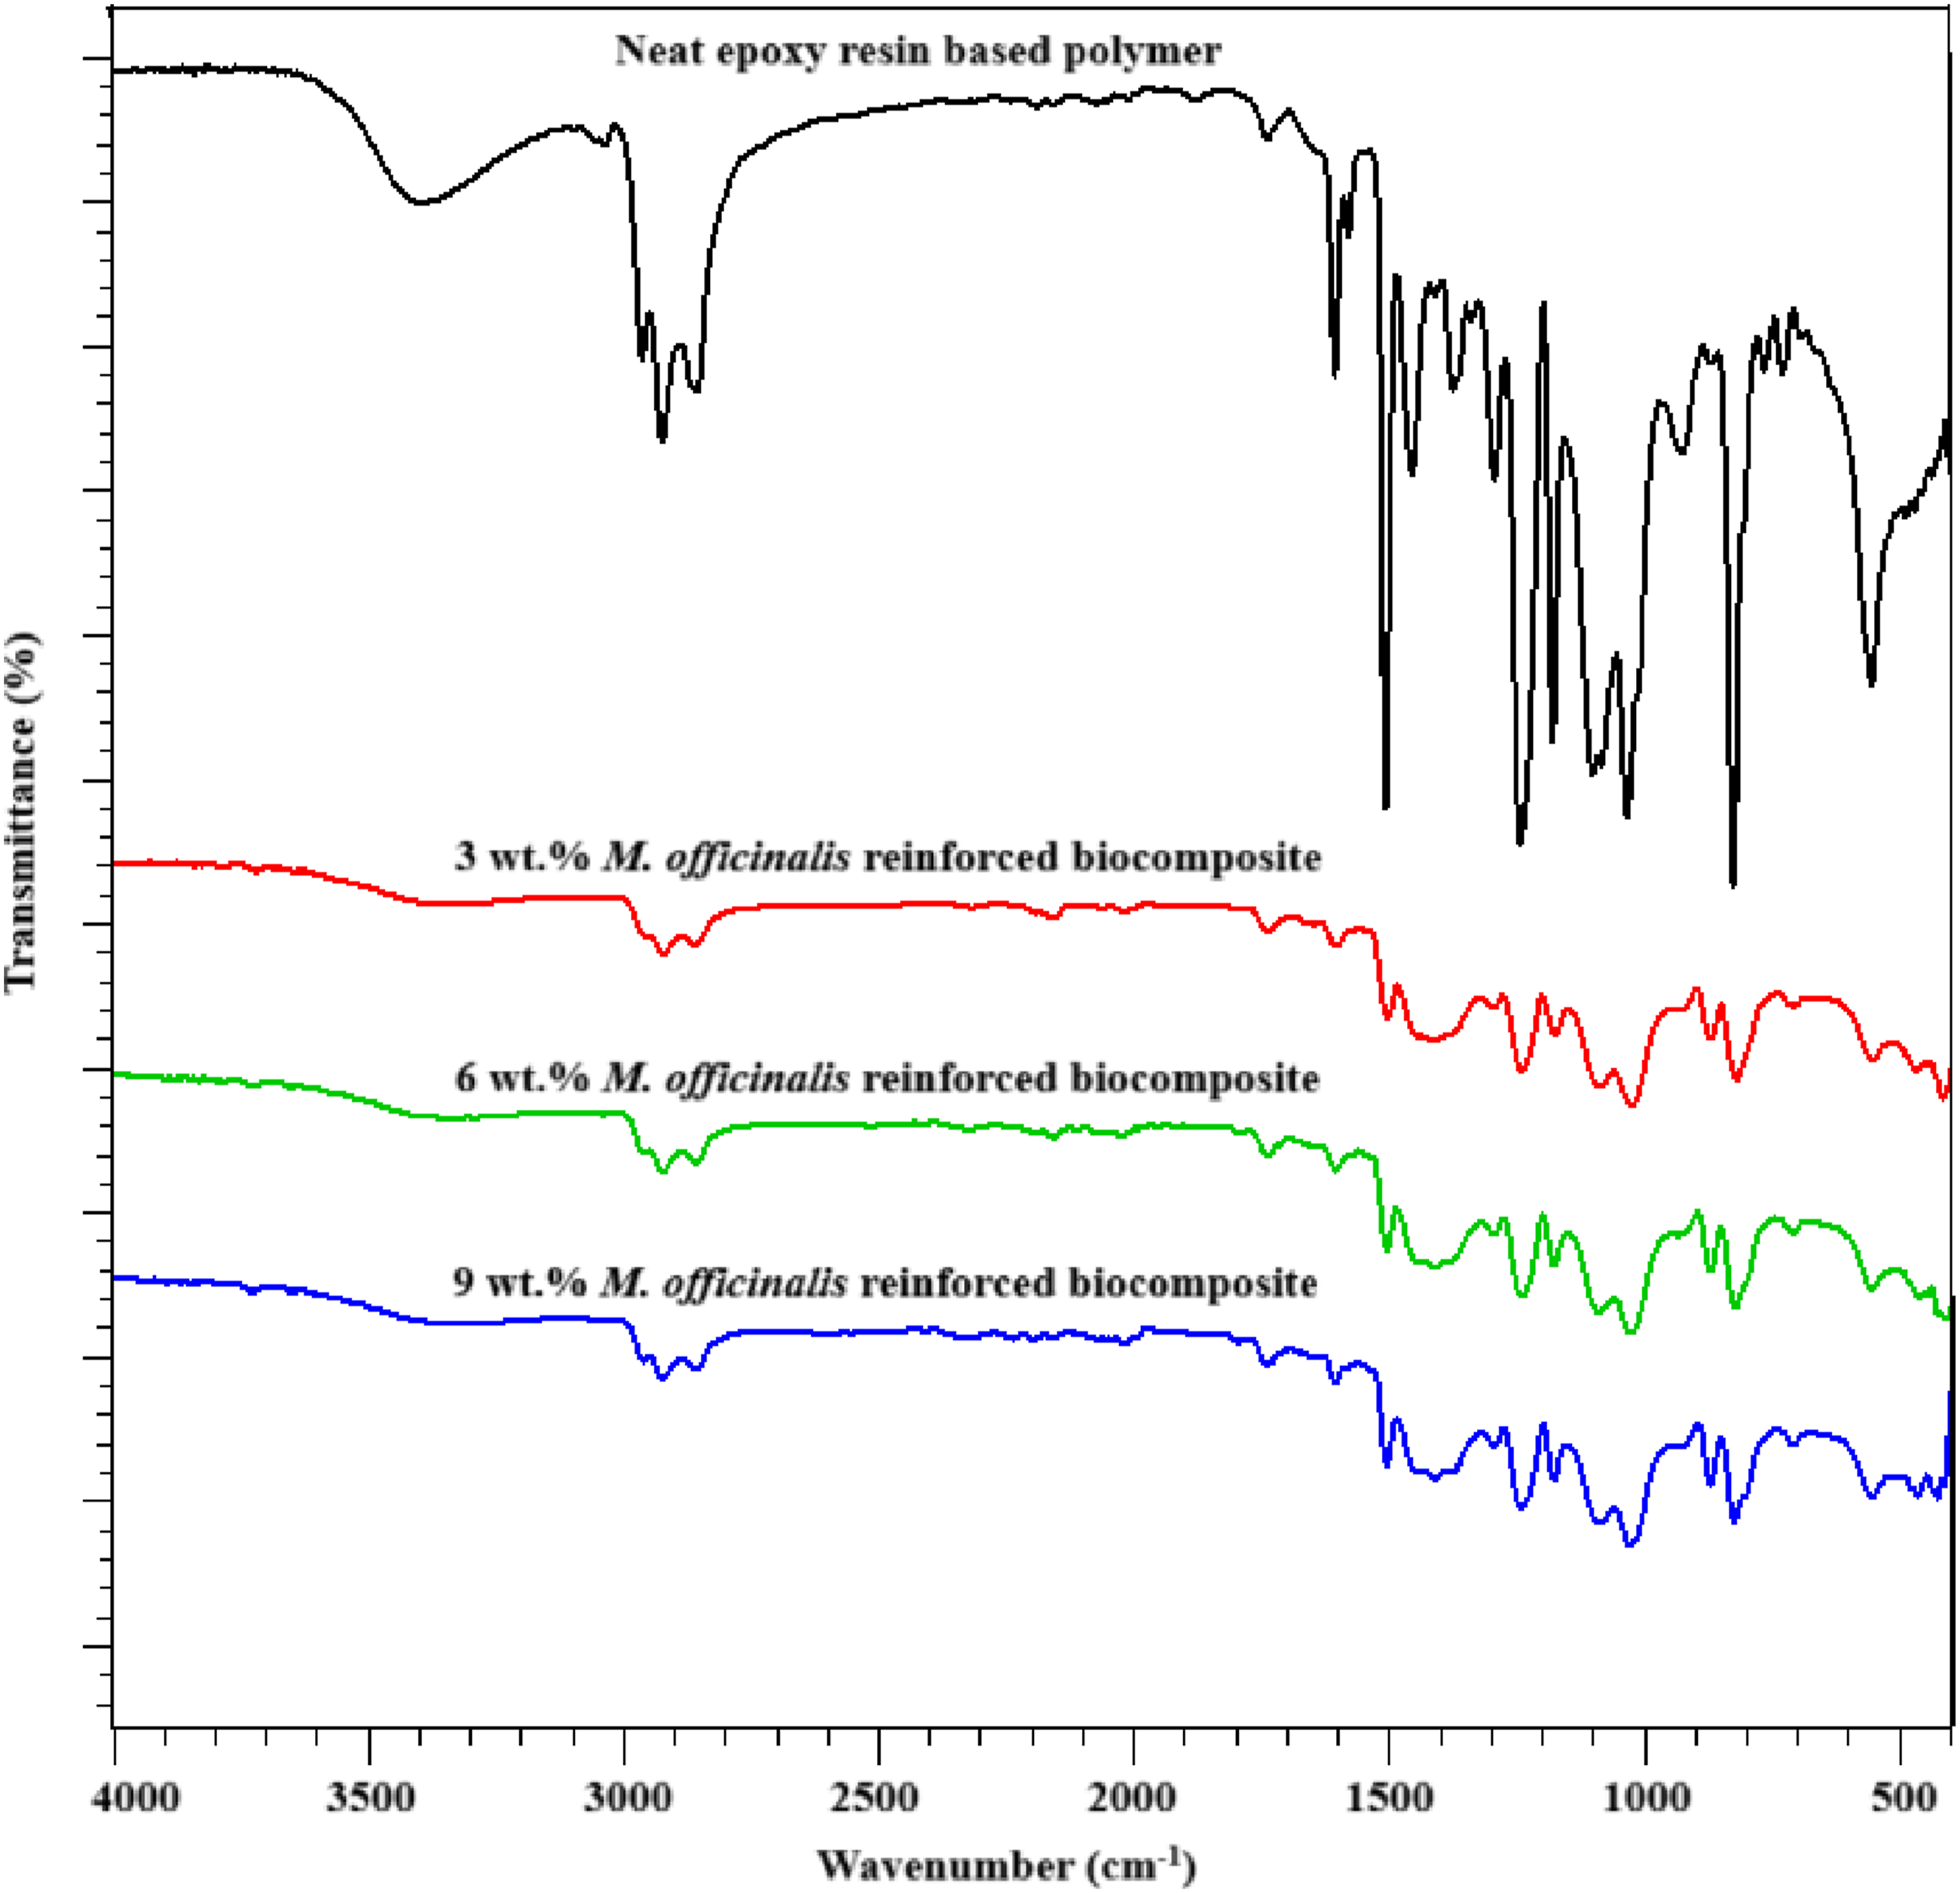
XRD analysis results
The XRD pattern of a biocomposite containing 3 wt.% MO is presented in Figure 4. Polymers produced from epoxy resins are generally amorphous in nature, meaning that molecules are arranged in an irregular pattern and do not exhibit any specific order or repeating structure. Because the atoms or molecules in such polymers lack a specific crystalline order, a broad diffraction band (a broad peak) is observed in XRD analysis. However, if additives or fillers are added to the epoxy resin or a specific curing process is applied, partially crystalline regions can form in these materials. In such cases, both an amorphous band and sharp peaks belonging to the crystalline phases can be observed in the XRD pattern.
23
Nevertheless, the basic structure of pure and undoped epoxy resin polymers is generally amorphous. Before proceeding to the quantitative and qualitative analysis of the XRD results of amorphous epoxy resin, it is important to understand the characteristics of the amorphous structure in XRD analysis. Amorphous structures do not produce sharp, distinct peaks in the XRD pattern, but rather broad peaks. This indicates that the atoms exhibit short-range order but not long-range order. The broad peak around 2θ ≈ 20°, seen in Figure 4, represents the typical amorphous halo location frequently observed in epoxy resins. Such a broad peak in an epoxy resin is characteristic of an amorphous structure and qualitatively confirms that the material is not crystalline. Analysis of XRD data in amorphous materials is generally based on peak location, width, and intensity.
24
For the sample obtained in the preliminary test in the figure, the amorphous peak was detected in the XRD curves between 10° and 30° 2θ. The peak location indicates the average atom-to-atom distances in the material’s atomic structure. A broad peak is indicative of a non-crystalline disordered structure. The peak width provides information about the degree of disorder of the atoms. Amorphous samples exhibit a higher background intensity compared to crystalline structures. This reflects the material’s disordered structure and the random scattering of X-rays. Analysis of the broad band here confirms that the material is qualitatively amorphous and provides quantitative information about short-range atomic order through properties such as the location, width, and intensity of this band. Thus, the XRD pattern obtained in Figure 3 clearly reveals that the sample does not contain a distinct crystalline phase and is predominantly amorphous. Confirmation of the amorphous structure is crucial for understanding the structure-property relationship targeted in this study, as the structural arrangement of the epoxy matrix directly influences the mechanical and dielectric behavior of the developed biocomposites. XRD pattern of the epoxy-based biocomposite containing 3 wt.% M. officinalis.
SEM-EDX results
Scanning electron microscopy (SEM) is a powerful characterization technique that provides detailed information on surface morphology, microstructural properties, and elemental composition at high magnification and resolution. This method is widely employed in polymer composites to evaluate the interaction between the filler and matrix as well as the overall structural integrity of the material. Figure 5 presents the SEM micrographs of the epoxy-based biocomposite containing 3 wt.% lignocellulosic biofiller derived from M. officinalis. The sample was coated with gold to enhance surface conductivity and examined at 250× and 500× magnifications at an acceleration voltage of 5.00 kV. The resulting micrographs reveal a heterogeneous structure with a distinct fibrous morphology on the surface. The particles were observed to be of various sizes and shapes; moreover, the lignocellulosic filler was homogeneously distributed within the polymer matrix, and good adhesion was achieved at the matrix-filler interface.25,26 This observation suggests that the M. officinalis additive exhibits compatibilit SEM-EDX images of the epoxy-based biocomposite reinforced with 3 wt.% M. officinalis. EDX data of the sample (3 wt.% M. officinalis).

Bulk density results
Bulk density is a fundamental parameter that reflects the mass per unit volume of a material and is critical for assessing its stiffness and overall integrity. Figure 6 shows the bulk density values of M. officinalis-reinforced biocomposites at different weight percentages (0, 3, 6, and 9 wt.%). The results clearly demonstrate an inverse relationship between the increase in M. officinalis content and the bulk density. Specifically, the bulk density, which was approximately 1130 kg/m3 in the neat sample, decreased to approximately 1115 kg/m3 and 1095 kg/m3 in the 3 wt.% and 6 wt.% samples, respectively, while the lowest value, approximately 1060 kg/m3, was observed in the 9 wt.% sample. This gradual decrease can be explained by the fact that the high M. officinalis content disrupts the dense packing within the polymer matrix, increasing microporosity and, consequently, free volume. In general, the addition of biomass-based fillers in biocomposite systems tends to reduce the bulk density of epoxy matrices, resulting in lighter structures. This characteristic is particularly advantageous for the design of lightweight, portable, and energy-efficient materials.27,28 However, this behavior can vary depending on the interaction of MO with the matrix, its distribution uniformity, and processing conditions. This reduction in bulk density has significant effects on the structural and functional performance of biocomposites. Lower-density structures can lead to a decrease in mechanical strength and dimensional stability, while increased porosity can contribute to thermal or acoustic insulation properties in some cases. Therefore, optimizing the M. officinalis additive ratio is critical for obtaining lightweight and partially bio-based composites due to their low density, while also improving the mechanical and functional performance of biocomposites in their target application areas. Bulk density of epoxy-based thermoset resin samples with varying M. officinalis.
Statistical analysis of the bulk density data was performed to evaluate the significance of the observed variations with increasing M. officinalis filler. All measurements were conducted in triplicate, and the results are presented as mean ± standard deviation. A one-way analysis of variance (ANOVA) was applied to determine whether the differences among the groups were statistically significant. The analysis revealed that the effect of filler reinforcing on bulk density is statistically significant (p < 0.05), indicating that the decrease in density with increasing biomass content is not attributable to random experimental variation. The relatively low standard deviation values (±2.5–2.8 kg/m3) further confirm the consistency and reliability of the measurements. Moreover, the differences between the mean values of each composition are considerably greater than the corresponding standard deviations, supporting the robustness of the observed trend. These results demonstrate that M. officinalis incorporation has a statistically significant and systematic influence on the bulk density of the epoxy-based biocomposites.
Tensile strength and strain results
The tensile strength tests were carried out according to ASTM D638 standard using a universal testing machine. Figure 7 shows the effect of M. officinalis content on the tensile strength of biocomposites. While the neat epoxy exhibited the highest tensile strength (∼25.8 MPa), it was observed that these values gradually decreased with increasing M. officinalis. In the sample with 3 wt.% M. officinalis, the tensile strength decreased to approximately 24 MPa, and to around 19 MPa at 6 wt.% M. officinalis. The lowest tensile strength value (∼14 MPa) was obtained in the biocomposite with 9 wt.% M. officinalis. This decrease can be attributed to the inhomogeneous distribution of the increased plant powder amount within the matrix phase, the weakening interfacial bonding, and increased pore formation. Similar behavior has also been reported in other studies, where increasing the filler content reduced the mechanical strength of epoxy composites by causing particle agglomeration and decreased interfacial cohesion.29,30 The results obtained indicate that M. officinalis addition at low rates can enhance the composite structure to a certain extent, but at high rates, it weakens the mechanical integrity and adversely affects the tensile strength.
31
Effect of M. officinalis content on the tensile strength of biocomposites.
Statistical analysis was conducted to evaluate the significance of the variation in tensile strength with increasing M. officinalis. All measurements were performed in triplicate, and the results are reported as mean ± standard deviation. The tensile strength decreased from 25.9 ± 0.45 MPa for the neat epoxy to 14.2 ± 0.64 MPa at 9 wt.% filler content, indicating a clear downward trend. A one-way analysis of variance (ANOVA) confirmed that the differences among the groups are statistically significant (p < 0.05), demonstrating that the reduction in tensile strength is not due to random experimental variability but is directly associated with increasing biofiller content. The relatively low standard deviation values (±0.45–0.64 MPa) indicate good repeatability and reliability of the measurements. Moreover, the differences between group means are substantially larger than the corresponding standard deviations, further supporting the statistical robustness of the observed trend. These findings confirm that M. officinalis incorporation has a significant and systematic effect on the mechanical performance of the epoxy-based biocomposites.
Figure 8 shows the effect of the M. officinalis additive ratio on the tensile elongation of the biocomposites. The results show that the elongation percentage of the biocomposites increases significantly with increasing the M. officinalis ratio. While the tensile elongation in the neat epoxy sample was approximately 2.9%, this value increased to 3.05% with an increase in the M. officinalis ratio to 3 wt.%. Tensile elongation was measured as 3.15% at 6 wt.% M. officinalis, and approximately 3.35% at 9 wt.% M. officinalis. This increase can be attributed to the fact that the plant filler particles increase the deformation capacity by reducing stress concentration in the epoxy matrix. In other words, the presence of M. officinalis powder created microvoids within the matrix, allowing the material to undergo greater elastic deformation. However, this increased flexibility came at the expense of decreased strength.
29
Therefore, while increasing the M. officinalis additive improved the ductility properties of the biocomposite, it exhibited a trend inversely proportional to the tensile strength. 330,31 These findings support the study’s primary goal, which was to assess how M. officinalis biofiller influences the mechanical properties of epoxy-based composites. The observed increase in elongation and decrease in tensile strength suggest that the plant-derived filler modifies the epoxy matrix’s deformation mechanism, leading to composite structures that are less rigid yet more flexible. Effect of M. officinalis content on the tensile strain of biocomposites.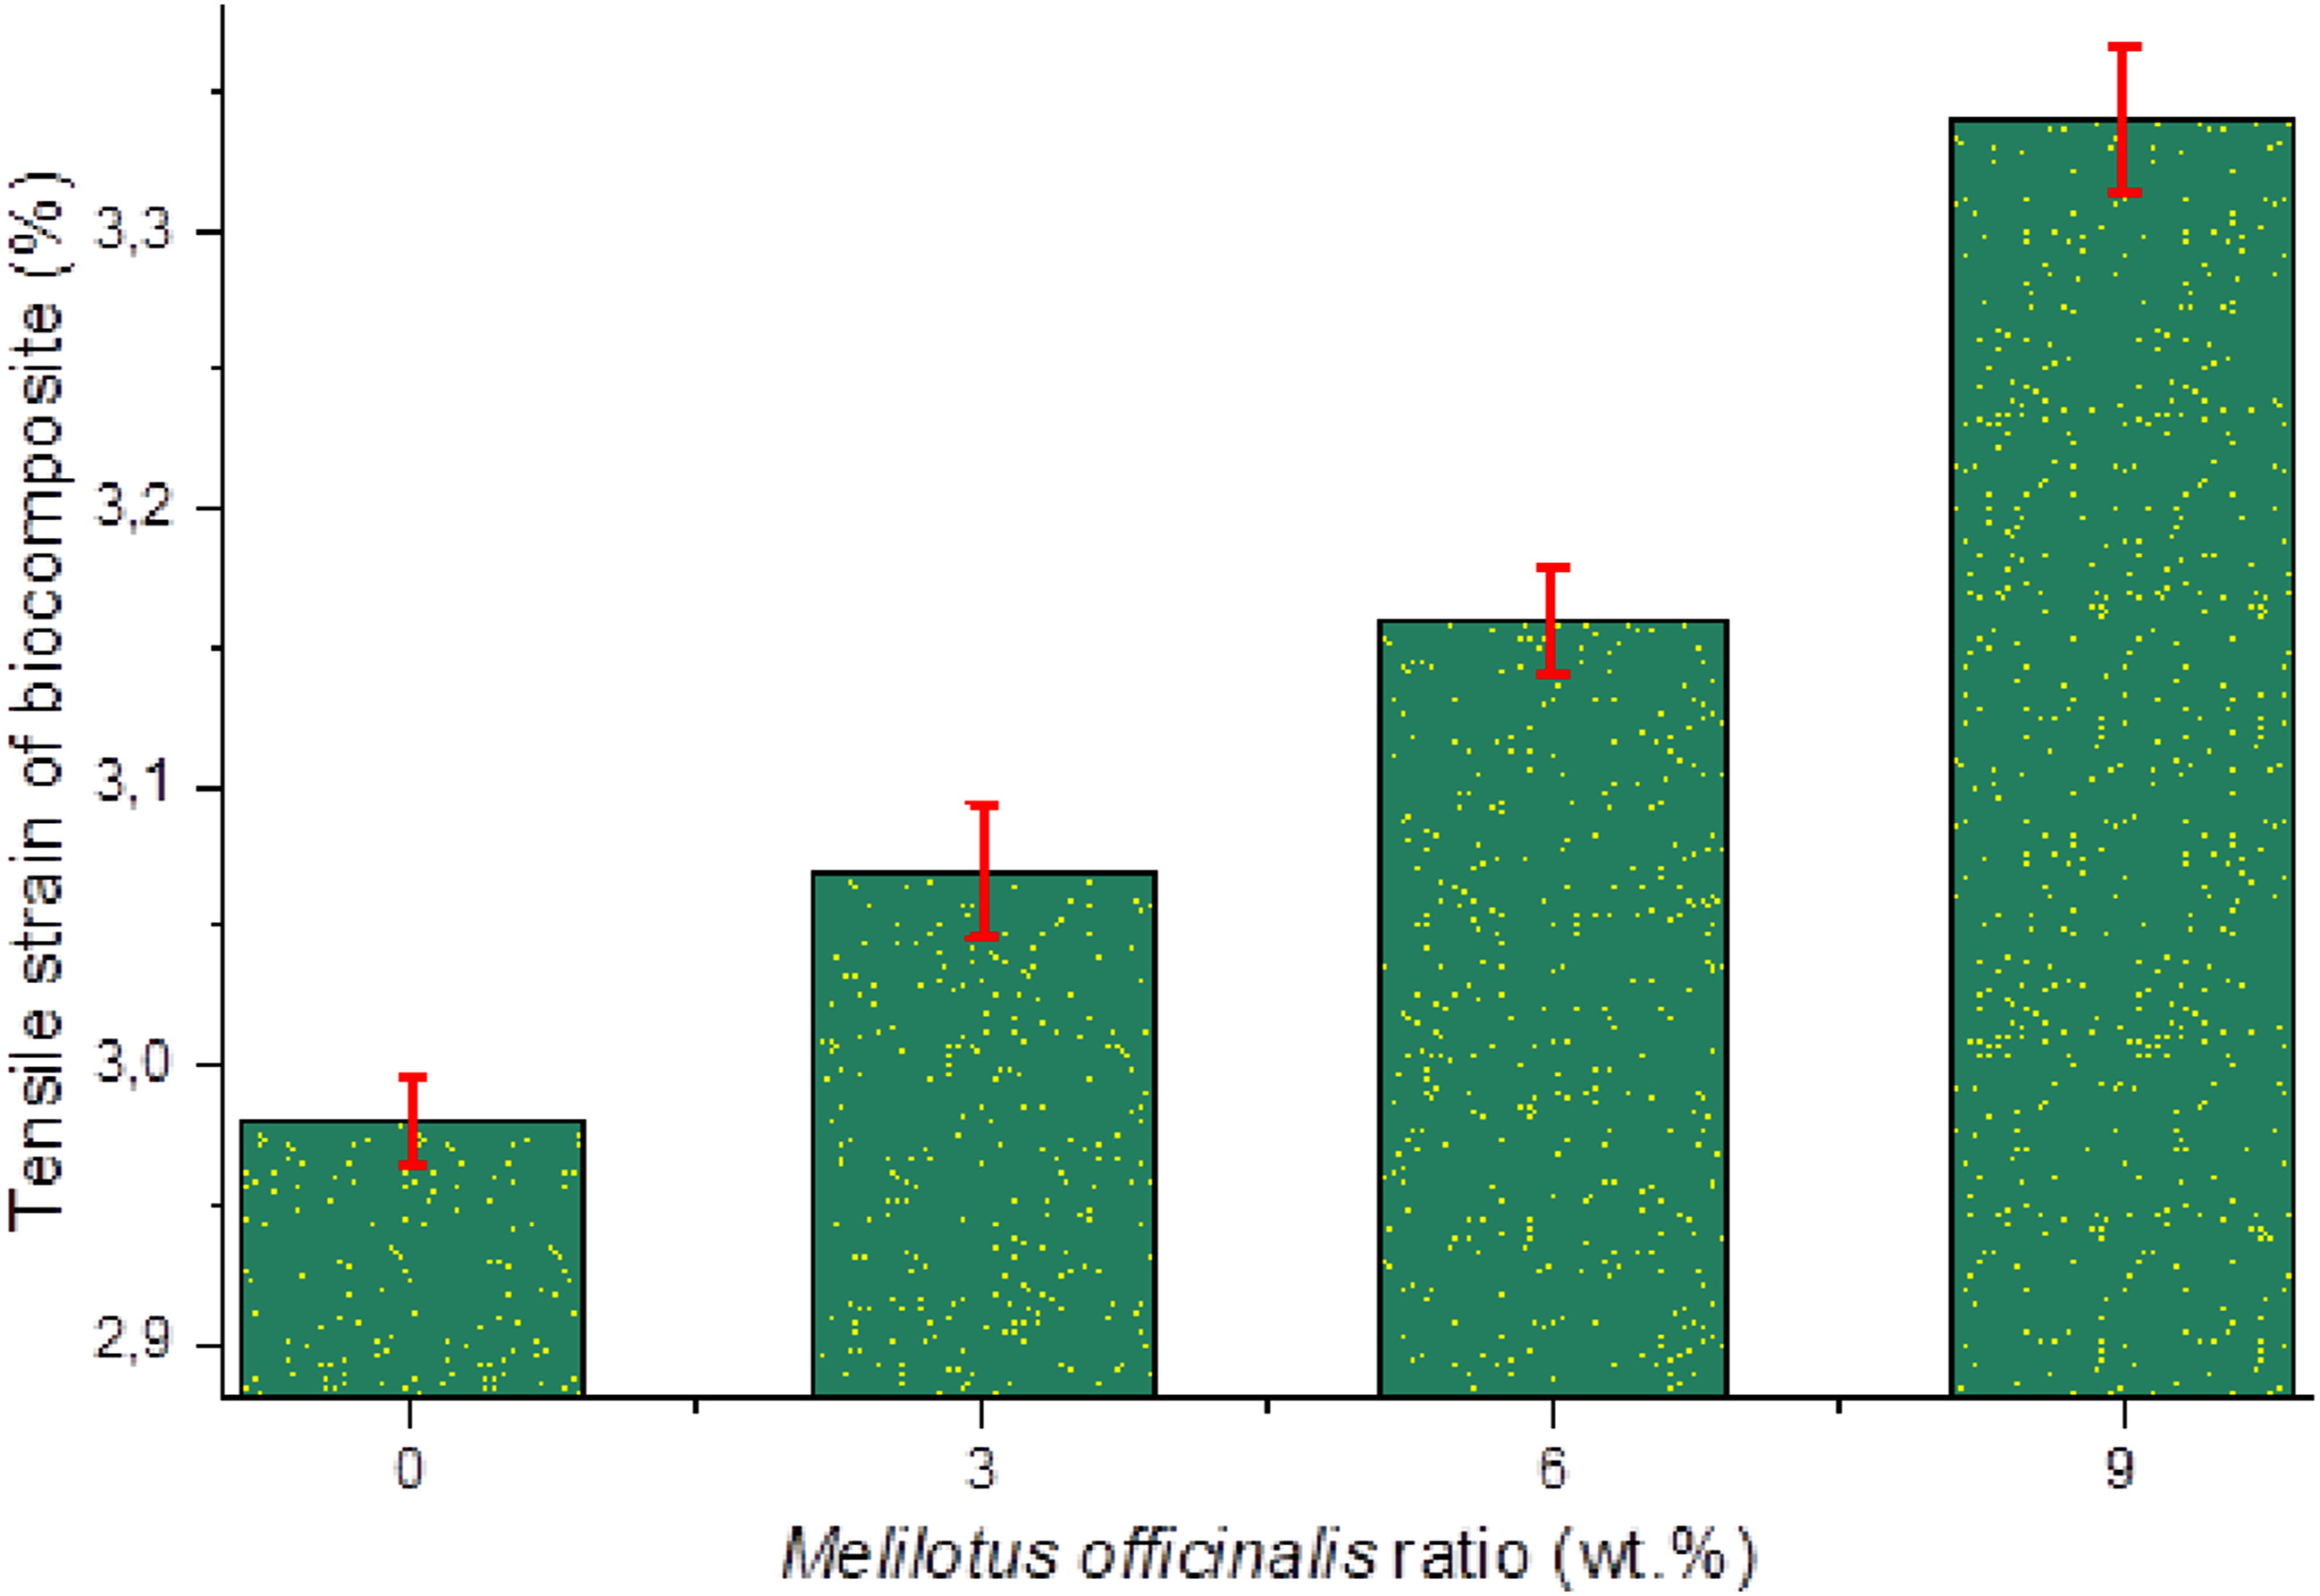
Statistical evaluation of the tensile strain data was performed to determine the significance of the observed increase with M. officinalis filler loading. All measurements were carried out in triplicate, and the results are expressed as mean ± standard deviation. The tensile strain increased progressively from 2.98 ± 0.016% for the neat epoxy to 3.34 ± 0.026% at 9 wt.% filler content, indicating a consistent enhancement in ductility. A one-way analysis of variance (ANOVA) demonstrated that the differences among the groups are statistically significant (p < 0.05), confirming that the observed increase in elongation is not due to random variation but is directly related to the incorporation of the biofiller. The low standard deviation values (±0.016–0.026%) indicate high measurement precision and excellent repeatability. Furthermore, the differences between the mean values of each composition are notably greater than the associated standard deviations, supporting the statistical reliability of the results. These findings clearly demonstrate that M. officinalis addition has a statistically significant and systematic effect on improving the deformation capability of the epoxy-based biocomposites.
Shore D hardness results
Shore D hardness is an important parameter widely used in evaluating the surface hardness and overall mechanical strength of polymer-based composites. The hardness measurements were performed according to ASTM D2240 (Shore D) standard. Figure 9 shows the Shore D hardness values of biocomposites modified with M. officinalis at different concentrations. The results reveal that the addition of M. officinalis has a significant effect on the hardness of the biocomposites. The hardness value of the control sample without M. officinalis was approximately 78, while this value was measured as approximately 77 with the addition of 3 wt.% M. officinalis. The hardness values of these two samples are quite similar, indicating that the low M. officinalis addition has a limited effect on matrix hardness. As the addition ratio was increased to 6 wt.%, the hardness value decreased to approximately 75, and the lowest hardness value was approximately 72 Shore D in the sample containing 9 wt.% M. officinalis. This observed decreasing trend can be attributed to the fact that the increased M. officinalis content disrupts the dense packing within the epoxy matrix, increases microporosity, and thus weakens the surface resistance of the material. At low additive levels, the homogeneous distribution of ground M. officinalis particles within the matrix does not cause a significant change in hardness, while at high additive levels, voids and weak bonding zones formed at the particle-matrix interface lead to significant decreases in hardness values. While such a decrease in hardness implies that biocomposites may be limited in terms of mechanical strength in some applications, these materials offer advantages such as light weight, sustainability, and ease of processing. Furthermore, the organic structure and relatively low density of M. officinalis can be considered among the factors contributing to the hardness reduction. Shore D hardness of epoxy based thermoset resin samples with varying M. officinalis.
As stated in the literature, the use of biomass-based fillers contributes to the production of lighter and more environmentally friendly materials by reducing the density of epoxy matrices.32,33 Therefore, appropriate optimization of the M. officinalis additive level and particle size is critical for improving the overall performance of biocomposites by minimizing hardness loss. The M. officinalis additive directly affects the mechanical properties of biocomposites; increasing additive levels lead to a decrease in hardness and, consequently, impact and wear resistance. However, in certain applications, this reduction could contribute to the development of lighter, more flexible, and more sustainable materials. These results further support the main aim of this research by showing how increasing biofiller content modifies the surface mechanical behavior of epoxy composites.
Statistical analysis was performed to evaluate the significance of the changes in Shore D hardness with increasing M. officinalis. All measurements were conducted in triplicate, and the results are presented as mean ± standard deviation. The hardness values decreased systematically from 78.1±0.3 for the neat epoxy to 71.9±0.4 at 9 wt.% filler content, indicating a clear reduction in surface hardness with increasing biofiller ratio. A one-way analysis of variance (ANOVA) confirmed that the differences among the groups are statistically significant (p < 0.05), demonstrating that the observed decrease is not due to random experimental variability but is directly associated with the incorporation of the lignocellulosic filler. The relatively low standard deviation values (±0.2–0.4) indicate good repeatability and reliability of the measurements. Furthermore, the differences between the mean hardness values of each composition are substantially greater than the corresponding standard deviations, supporting the statistical robustness of the observed trend. These results clearly indicate that M. officinalis addition has a significant and systematic effect on reducing the hardness of the epoxy-based biocomposites.
Thermal conductivity results
Figure 10 shows the relationship between M. officinalis content and the thermal conductivity coefficient of the biocomposites. When the thermal conductivity values of the biocomposites obtained by adding M. officinalis powder at different ratios (0, 3, 6, and 9 wt.%) to the epoxy-based matrix are examined, it is observed that the thermal conductivity gradually decreases with increasing M. officinalis ratio. While the neat sample had the highest thermal conductivity value (∼ 0.112 W/m‧K), this value decreased to approximately 0.096 W/m·K in the sample containing 9 wt.% M. officinalis. This decrease can be attributed to the increased porosity due to the increased M. officinalis in the composite structure, and the limitation of heat transfer by these pores. Furthermore, the low thermal conductivity of M. officinalis powder in its natural structure further reduces the overall heat conduction of the composite material. The results show that the addition of M. officinalis increases the thermal insulation capacity of the biocomposite, enhancing the potential of epoxy-based composites for applications requiring low thermal conductivity; however, it should be considered that this improvement may lead to a certain decrease in some mechanical properties.
34
Effect of M. officinalis ratio on the thermal conductivity coefficient of the biocomposite.
The thermal conductivity decreased progressively from 0.113 W/m·K for the neat epoxy to approximately 0.096 W/m·K at 9 wt.% filler content, indicating a consistent reduction with increasing biofiller ratio. A one-way analysis of variance (ANOVA) revealed that the differences among the groups are statistically significant (p < 0.05), confirming that the observed decrease is not due to random experimental variation but is directly associated with the incorporation of the lignocellulosic filler. The very low standard deviation values (on the order of 10-3–10-4 W/m·K) indicate high measurement precision and excellent repeatability. Furthermore, the differences between the mean values of each composition are significantly greater than the associated standard deviations, supporting the statistical robustness and reliability of the observed trend. These findings demonstrate that M. officinalis incorporation has a statistically significant and systematic effect on reducing the thermal conductivity of the epoxy-based biocomposites.
Dielectric properties results
The dielectric properties of epoxy-based biocomposites were evaluated by measuring capacitance (Cp) and dielectric loss factor (DF) using gold-plated conductive electrodes. The dielectric measurements were carried out in accordance with ASTM D150 standard. For dielectric measurements, disc-shaped samples were prepared from cured epoxy-based biocomposite plates. The samples were placed between two conductive electrodes and gently pressed under a pressure of approximately 7 tons to ensure good electrical contact between the sample and the electrodes during the measurement. The thickness of the samples varied between 0.90 and 1.5 mm, depending on the cutting and surface preparation of the cured composite plates. The exact thickness of each sample was individually measured using a digital micrometer and subsequently used in dielectric constant calculations.
Figure 10–12 illustrate the dielectric properties of epoxy-based thermoset biocomposites reinforced with different ratios of M. officinalis biofill. Dielectric constant (ε′), dielectric loss (ε″), and electrical conductivity (σ) values were measured at 25 °C in the frequency range of 100 Hz–1 MHz. The obtained frequency-dependent dielectric behavior is presented in Figures 11–13. Specifically, Figure 11 shows the frequency-dependent variation of the dielectric constant (ε′), Figure 12 shows the frequency-dependent variation of the dielectric loss (ε″), and Figure 13 shows the frequency-dependent variation of the electrical conductivity (σ). These results provide information about polarization mechanisms, interfacial interactions, and charge transport behavior in composite systems. For comparison and a clearer evaluation, representative dielectric parameters obtained at 10 kHz and 100 kHz frequencies are summarized in Table 2. Dielectric constant (ε′) of epoxy-based thermoset resin samples with varying M. officinalis. Dielectric loss (ε″) of epoxy-based thermoset resin samples with varying M. officinalis. Electrical conductivity of epoxy-based thermoset resin samples with varying M. officinalis. Representative dielectric constant (ε′), dielectric loss (εʺ), and AC conductivity (σ) values of epoxy/MO biocomposites measured at 10 kHz and 100 kHz at 25 °C.


The dielectric constant (ε′) indicates the energy storage capacity of a material under an external electric field. The figure shows the change in dielectric constants of polymer composites containing 3, 6, and 9 wt.% reinforcing with frequency. It is observed that the dielectric constant values are high for all samples at low frequencies, and that they decrease significantly with increasing frequency.35–37 This can be explained by the ability of the dipole and interface polarizations, which are active in the low-frequency region, to adapt to changes in the electric field, while at high frequencies these mechanisms cannot respond to rapid field changes. Indeed, at 10 kHz, the dielectric constant values were measured as 2.79, 2.86, and 2.93 for 3, 6, and 9 wt.% reinforcing, respectively. As the frequency increased to 100 kHz, these values decreased to 2.47, 2.52, and 2.59, respectively. Furthermore, a general upward trend in the dielectric constant was observed as the filler loading increased. In particular, the 9% filler-loaded composite has the highest ε′ value at low frequency and exhibits higher polarization capacity compared to other samples across all frequency ranges. This finding suggests that increasing the filler loading enhances polarization capacity by increasing the polar group density and interfacial interactions within the material. 38
Dielectric loss (εʺ) is one of the fundamental parameters to be considered in material selection and represents the rate at which applied energy is converted into heat within the material. According to the table, the dielectric loss values for the 3, 6, and 9 wt.% reinforced composites were measured as 0.510, 0.517, and 0.541 in the low frequency region (10 kHz), respectively. This is due to the dominance of free charge carriers and dipole polarization at low frequencies. A significant decrease in dielectric loss values was observed with increasing frequency, reaching 0.316, 0.324, and 0.338 at 100 kHz, respectively. This decrease can be explained by the inability of dipoles to adapt to the rapid changes in the electric field at high frequencies. The results reveal that the 9 wt.% reinforced composite exhibits the highest εʺ value at low frequencies, and that increasing the filler reinforcing strengthens the energy loss mechanisms within the material. However, it was found that at high frequencies, εʺ values in all samples reached a more constant level, and energy losses decreased significantly. This finding suggests that the additive ratio has an increasing effect on losses in the low-frequency region, but that losses decrease as frequency increases, as the dominant mechanisms become limited.39,40
Conductivity (σ) is an important parameter in evaluating the electrical properties of polymeric composites. According to the table, the AC conductivity values of the 3, 6, and 9 wt.% reinforced composites measured at 10 kHz are 2.36×10⁻⁵, 2.59×10⁻⁵, and 2.66×10⁻⁵ S/cm, respectively. A steady and significant increase in conductivity values as observed with increasing frequency, reaching 2.36×10⁻⁴, 2.41×10⁻⁴ and 2.48×10⁻⁴ S/cm at 100 kHz, respectively. This increase is attributed to the limited mobility of free charge carriers at low frequencies and the faster adaptation of these carriers to electric field changes at high frequencies. The data obtained show similar trends across all composites, with conductivity values increasing by approximately one order of magnitude as frequency increases. Moreover, the additive ratio slightly increases conductivity at low frequencies, while at higher frequencies, the differences between samples decrease, and the values tend to converge. This behavior can be explained by the increased mobility of charge carriers along the chains as frequency increases, resulting in more stable conductivity values.41,42 In summary, the dielectric behavior observed in this study enhances understanding of how plant-based biological fillers affect the electrical performance of epoxy composites, addressing one of the main objectives of this research.
Thermogravimetric analysis (TGA) results
TGA curves of the epoxy-based composites reinforced with varying amounts (0–9 wt.%) of M. officinalis exhibit a typical multi-stage thermal decomposition behavior (Figure 14). At low temperatures (approximately 25–150 °C), all samples show negligible mass loss, indicating minimal moisture content and good initial thermal stability.
43
The slight weight reduction observed in this region can be attributed to the evaporation of physically adsorbed water and volatile impurities. The similarity of the curves in this region suggests that the incorporation of M. officinalis does not significantly affect the initial thermal resistance of the epoxy matrix. Thermal stability of epoxy-based thermoset resin samples with varying M. officinalis.
In the intermediate temperature range (150–300 °C), a gradual mass loss is observed, which is associated with the onset of thermal decomposition of low-molecular-weight components and partial degradation of hemicellulosic and extractive constituents from the plant additive. The composites containing higher M. officinalis content (particularly 6 wt.% and 9 wt.%) exhibit slightly earlier degradation onset compared to the neat epoxy (0 wt.%), indicating that the natural filler introduces thermally less stable components into the system. 44 However, this shift is relatively small, suggesting that the filler is reasonably well integrated within the polymer matrix and does not drastically compromise thermal integrity.
The main degradation stage occurs between approximately 300 °C and 450 °C, where a sharp mass loss is evident for all samples. This stage corresponds to the decomposition of the epoxy network along with the cellulose and lignin fractions of M. officinalis. Notably, the presence of the plant additive slightly accelerates the degradation rate, as seen by the earlier and steeper decline in mass for higher filler loadings. Despite this, the residual char content at temperatures above 450 °C remains comparable or slightly increased for reinforced composites, indicating enhanced char-forming ability due to lignocellulosic components. This behavior suggests that while M. officinalis marginally reduces thermal stability at high temperatures, it may contribute positively to char formation, which is beneficial for improving thermal resistance and potential flame retardancy of the composite material.
Conclusions
In this study, sustainable epoxy-based biocomposites reinforced with M. officinalis were successfully fabricated, and their structural, mechanical, thermal, and dielectric properties were systematically investigated. The results clearly demonstrated that the incorporation of lignocellulosic biofiller has a significant and statistically meaningful influence on the overall performance of the composites. Increasing filler loading (0–9 wt.%) led to a gradual reduction in bulk density, tensile strength, and hardness, while simultaneously enhancing ductility, as evidenced by the increase in elongation at break. These changes are primarily attributed to microstructural modifications such as increased free volume, reduced matrix continuity, and weaker interfacial bonding at higher filler contents. Statistical analyses (ANOVA, p < 0.05) confirmed that all observed trends are significant and not due to random experimental variation, thereby strengthening the reliability of the findings.
Structural and morphological analyses further supported these results. FTIR spectra indicated that the interaction between the epoxy matrix and M. officinalis is predominantly physical, mainly through hydrogen bonding, without the formation of new chemical bonds. XRD analysis confirmed the amorphous nature of the epoxy-based system, which remained unaffected by biofiller incorporation. SEM–EDX observations revealed relatively homogeneous filler dispersion and satisfactory interfacial adhesion at the optimum loading (3 wt.%), whereas higher filler contents led to agglomeration and microvoid formation. TGA showed that although the addition of M. officinalis slightly reduced the onset degradation temperature due to the presence of thermally less stable lignocellulosic components, it contributed to increased char formation at elevated temperatures, which may be beneficial for thermal resistance.
From a functional perspective, the incorporation of M. officinalis significantly improved the thermal insulation performance of the composites by reducing thermal conductivity, which was statistically validated. This behavior is attributed to the inherently low thermal conductivity of the biomass and density-related structural changes within the composite. In addition, dielectric analysis revealed that interfacial polarization mechanisms dominate at low frequencies, while dielectric constant and loss values decrease with increasing frequency. The increase in dielectric constant with filler loading suggests enhanced polarization due to the presence of polar functional groups and interfacial effects.
The findings indicate that M. officinalis is a promising bio-based filler for the development of lightweight and partially sustainable epoxy composites. However, a clear trade-off exists between improved thermal/dielectric properties and reduced mechanical strength. Among the studied compositions, 3 wt.% filler loading was identified as the optimum condition, providing a balanced combination of mechanical integrity, dispersion quality, and functional performance. These materials are therefore more suitable for non-structural, low-load, and thermal insulation applications rather than load-bearing uses.
Finally, it should be noted that certain limitations exist in the present study, including the absence of direct porosity measurements, advanced mechanical parameters (e.g., modulus and yield behavior), and adhesion strength tests. Future work will focus on addressing these aspects, along with surface modification of the biofiller and optimization of interfacial interactions, to further enhance composite performance and expand potential application areas.
Footnotes
Acknowledgement
The authors express their sincere gratitude to Firat University and Munzur University for their support of this research.
Funding
The authors disclosed receipt of the following financial support for the research, authorship, and/or publication of this article: This research was funded by Fırat University Scientific Research Projects (BAP) Unit (Grant number MF.25.141) and Munzur University Scientific Research Projects (BAP) Unit (Grant number GPMUB023-03). The APC was funded by Fırat University Scientific Research Projects (BAP) Unit.
Declaration of conflicting interests
The authors declared no potential conflicts of interest with respect to the research, authorship, and/or publication of this article.
Data Availability Statement
The data presented in this study are available upon request from the corresponding author.