
Abstract
The regions of the European Union are currently experiencing a period of seismic change that has transformed their established voting patterns and increased anti–European Union voting. Applying objective economic measures, spatial econometrics and municipal voting data from recent elections and a referendum, this study examines the factors shaping anti–European Union votes in Greece. The results indicate a strong link between the country’s changing economic geography and the geography of the anti–European Union vote, providing evidence not only of the ‘geography of discontent’ and the ‘left-behind hypothesis’ but also of the ‘geography of austerity’ associated with the heterogeneous effects of fiscal consolidation and austerity policies.
Introduction
The European Union (EU) regions are currently experiencing a period of rapid change and extensive transformation as a result of greater globalisation, the acceleration of European integration and the 2008 and 2020 economic crises, as well as the 2015 refugee and migrant crisis. In this new setting, spatial inequalities tend to increase (or persist), especially within countries (Bailey et al., 2020; Camagni et al., 2020; Iammarino et al., 2019). Several places have been marginalised (Bailey et al., 2020; Rodríguez-Pose, 2018), while the levels of scepticism, anger and despair, as well as feelings of being left behind and fears about the future, are prevalent among EU citizens (Petrakos et al., 2020).
These seismic changes have transformed the established voting patterns in many EU regions (Dijkstra et al., 2020), resulting in the most serious questioning of the EU’s very existence since the Treaty of Rome (Camagni et al., 2020). Although no consensus exists concerning the gains and losses of left- and right-wing parties in recent years (Lindvall, 2014), there is agreement on the increase of Euroscepticism and the electoral success of anti-EU parties (Giuliani and Massari, 2019; Teperoglou and Belchior, 2020). This is evident not only from Eurobarometer surveys but also from the rise of discontent expressed by political radicalisation across Europe (and beyond) and the anti-EU vote (Dijkstra et al., 2020; Edo et al., 2019; Johnston et al., 2019; Rodrik, 2018; Rodríguez-Pose, 2018; Tubadji and Nijkamp, 2019). The length, extent, intensity, depth and severity of the 2008 crisis contributed to politicising the European issue, ‘opening up new political opportunities for challenger parties’ (Beaudonnet and Gomez, 2017: 322), increasing ‘Euroscepticism’ and reducing public support for European integration (Statham and Trenz, 2015).
Using the literature of the economic geography of voting as a benchmark and applying spatial econometric models, this article aims to shed light on the factors shaping anti-EU votes by analysing municipal voting data (namely local administrative units [LAUs]) from the elections and a referendum held during the period of the economic crisis in Greece. In this new, complex and volatile environment, critical questions associated with whether and how economic effects shape the geography of voting remain more or less unanswered, resulting in incomplete and inconclusive literature. Understanding the drivers of the anti-EU vote is crucial, not only for Greece and other countries presenting similar socioeconomic and political conditions but also for the very existence of the EU.
Although not new, the research on the geography of voting is limited because political scientists and economists, rather than regional scientists and geographers, have dominated the literature (Ragusa and Tarpey, 2016). Moreover, such an endeavour requires data that are typically difficult to obtain, especially at a low level of spatial aggregation. However, researchers have recently begun to systematise the field (Nicoli and Reinl, 2020). Such an investigation is essential for several reasons, but mostly because economic factors are geographically uneven within countries (Essletzbichler et al., 2018; Johnston and Pattie, 2001). This is highly relevant for Greece, a country with large and persistent spatial inequalities both at inter- (Organisation for Economic Co-operation and Development (OECD), 2020) and intra-regional (Artelaris and Kandylis, 2014) levels. Interestingly, the process of European integration has not been evenly distributed across the spatial units of the country or at least was not in the 1980s and 1990s (Petrakos and Artelaris, 2008; Petrakos and Saratsis, 2000). Furthermore, the ramifications of the 2008 crisis have proved anything but spatially uniform (Artelaris, 2017; Giannakis and Bruggeman, 2017; Monastiriotis, 2011; Petrakos and Psycharis, 2016; Psycharis et al., 2014), without changing, however, the polarised character of the regional Greek system (Artelaris, 2020). Meanwhile, public investment has not contributed to closing the gap (Rodríguez-Pose et al., 2012, 2016).
This study aims to contribute to the existing literature in several ways. First, it examines the anti-EU vote in Greece, an EU member state that was at the epicentre of the 2008 crisis, which plunged it into the deepest recession in its history with geographically differentiated effects. Second, this study focuses on the subnational level, especially at a very low spatial division, using appropriate spatial techniques. This analysis lays bare the unequal sociopolitical geographical pattern within the country, alleviates the potential problem of ecological fallacy and offers new insights into this issue. Third, it contributes by including the elections and the referendum held in the years of the 2008 crisis to understand the (possible) similarities and differences between them. Finally, it contributes by examining separately the short-, medium- and long-term economic effects, thus bridging the main bodies of literature.
Euroscepticism and the anti-EU vote in Greece
Greece used to be one of the most Europhile, or ‘pro-European’, countries in the EU in terms of both party support and public opinion (Katsanidou and Lefkofridi, 2020); in essence, no parties posed a threat to the country’s European orientation (Vasilopoulou, 2018). However, the economic crisis and austerity measures fuelled the rise of Euroscepticism reflected by public attitudes and electoral strength (Verney, 2015). During the crisis, Euroscepticism ‘appeared to have become a mainstream position’, rising to levels that exceeded those of the United Kingdom, traditionally the most Eurosceptic EU country (Verney, 2015: 280). The results of Eurobarometer surveys show that during the crisis, Greeks were the most discontented and distrustful citizens among EU member states, considering EU membership ‘a bad thing’ (Clements et al., 2014; Dijkstra et al., 2020; Vasilopoulou, 2018). The election outcomes reflect this attitude, as Figure 1 reveals: the share of votes for parties expressing any sort of Euroscepticism (hard or soft) greatly increased in the years of the crisis, reaching almost 60 per cent in the recent elections (one of the highest in the EU; see Dijkstra et al., 2020). The Eurosceptic votes of the figure are added using the overall orientation of party leaderships towards European integration as a benchmark. The data are obtained by the Chapel Hill expert survey (CHES), which estimates party positioning on European integration, ideology and policy issues for national parties in several European countries (Bakker et al., 2020).
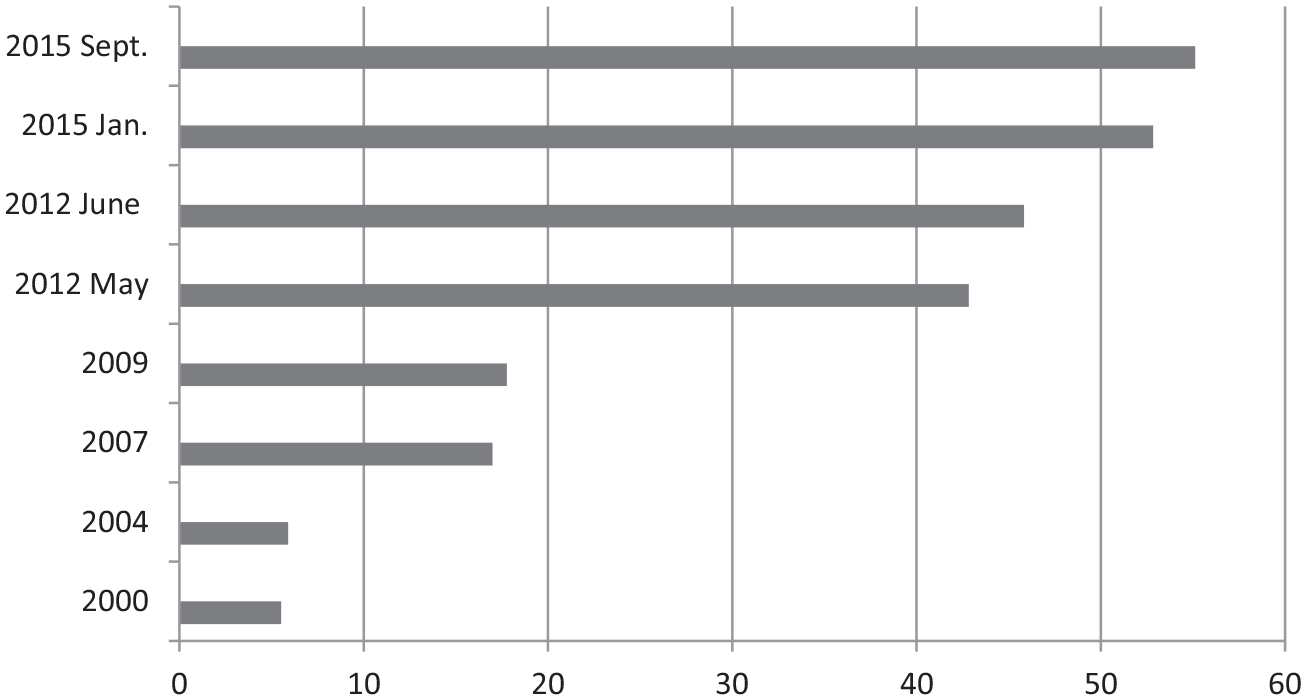
Share of the votes for parties expressing Euroscepticism in Greece in the elections of the period 2000–2015.
The rise of the anti-EU vote in Greece cannot be considered an expression of domestic discontent; ‘the EU has not been a victim of collateral damage in Greece, but one of the electorate’s main targets’ (Verney, 2015: 293). The ‘bailout packages’ and austerity policies adopted by the national governments but imposed by other actors – such as the European Commission (EC) and European Central Bank (ECB) – increased the negative image of the EU and contributed to the creation of several anti-EU parties. Furthermore, they led voters to greater awareness of the EU economic constraints over national economic policies (Lobo and Pannico, 2020). The ballot box was a unique opportunity for voters to express their negative feelings and ‘punish’ the EU for being ‘responsible’. Indeed, the 2012 elections signalled a peak of fluidity, dealignment and fragmentation of the Greek party system (Teperoglou and Tsatsanis, 2014), leading to the creation of a ‘novel’ coalition government three years later, united by a Eurosceptic anti-austerity agenda (Vasilopoulou, 2018), as detailed below.
Recent economic and political changes in Greece
Since the collapse of the dictatorship in 1974, the Greek party system had been highly stable, with two political parties dominating – Nea Dimokratia (ND) and the socialist party (PASOK). 1 However, that changed in the years of crisis. A few weeks after PASOK won the elections in October 2009, Greek Prime Minister (PM) Giorgos Papandreou publicly announced a very high budget deficit, creating uncertainty in financial markets and, eventually, leading to the onset of a severe economic downturn. After a short period of strong but vain efforts to reduce the budget deficit, and while Greece was the first country to be shut out of the bond market, the government reached a €110bn bailout agreement in May 2010 with the International Monetary Fund (IMF), ECB and EC (together known as the ‘Troika’) to avoid default. The bailout agreement included a prolonged fiscal consolidation imposing harsh austerity measures (such as salary and pension cuts, as well as tax increases) and drastic structural reforms. The role of the IMF was significant in Greece in terms of both financing (its contribution was more than one-third of the total financial assistance) and monitoring the economic adjustments programmes (in close cooperation with the EC and the ECB). Its role was also important in several other EU countries, such as Ireland, Portugal and Spain, probably because of the failure of the European institutions to react immediately and adequately to this situation by developing appropriate mechanisms and adopting efficient policies. It is worth noting that the form and type of (austerity) policies were not unilaterally dictated or imposed by the Troika. They were instead the result of complex negotiation processes between the national government and the Troika; in essence, the Greek actors had a significant role to play in the formulation, adoption and implementation of policies (Sapir et al., 2014).
Thereafter, the agreement became the dominant political topic. All opposition parties – including the major opposition party, ND – voted against the agreement, except for a populist radical-right party, the Popular Orthodox Rally (LAOS), that voted for it. Meanwhile, almost 10 new parties formed in response to the agreement, most of them expressing hard or soft Euroscepticism (Nezi and Katsanidou, 2014).
In October 2011, amid a worsening recession and anger over austerity measures that culminated in frequent strikes and violent demonstrations across the country, PASOK, ND and LAOS formed a coalition government with Loukas Papademos, a former president of the Greek central bank and former vice president of the ECB, as PM. ND’s participation in the government marked a change in the party’s stance, which was then in favour of austerity measures. The new government negotiated the second bailout package with Troika, worth about €130bn, which passed through parliament in February 2012.
In May 2012, a national election was held in a time of harsh recession and austerity, political instability, uncertainty and major discontent. The electoral debate focused on economic issues, austerity and bailout packages, as well as pro- and anti-Europeanism. The election’s most notable feature was that no party got more than 19 per cent of the votes, breaking the country’s pattern of two-party domination, while several anti-bailout, anti-EU and populist forces had substantial gains. As no government formed from the May election, a political ‘earthquake’ led to the election of June 2012, from which a pro-austerity, pro-European coalition government formed, comprising ND, PASOK and DIMAR, with Antonis Samaras, the president of ND, as PM. These double elections signalled the consolidation of the pro-/anti-austerity division and escalated a political conflict between Europeanism versus Euroscepticism (Tsatsanis, 2020; Vasilopoulou and Halikiopoulou, 2013).
In December 2014, the Greek Parliament failed to endorse the coalition government’s candidate for the presidency, leading to early parliamentary elections in January 2015. 2 In these elections, the anti-austerity camp finally gained office; Syriza (Coalition of the Radical Left), an anti-austerity, populist, radical left-wing party with soft-Eurosceptic views that started to gain popularity after the outbreak of the crisis, had a resounding election victory with 36.3 per cent of the vote. This marked the end of more than four decades of two-party rule. Among other commitments, Syriza promised to renegotiate the terms of the agreement and associated reforms that creditors imposed, even moving towards debt cancellation and the end of austerity. It formed a coalition government with the (populist) radical far-right party ANEL, which also shared anti-austerity and anti-EU views, and Syriza’s leader, Alexis Tsipras, became PM. The coalition immediately started prolonged and challenging negotiations for a new agreement with Greece’s lenders.
Six months later, as Greece missed a payment deadline, the EU proposed a new austerity package in exchange for further economic assistance. PM Tsipras proposed a referendum, scheduled for July 2015, that shut down banks, introduced capital controls, limited foreign transactions and revived the recession. This period represented the peak of the polarisation between the pro- and anti-EU camps. How the referendum was prepared and organised has come under immense criticism: the short time between its announcement and the vote, the technical character of the two documents of the agreement, the placement of the options on the ballot paper (the ‘No’ vote was placed before the ‘Yes’), the complex way in which the question was phrased and the fact that citizens would vote for a draft offer that had already been withdrawn provoked strong reactions from national and international experts and political parties (Gerodimos, 2015; Rori, 2016; Tsatsanis and Teperoglou, 2016). Concerns have also been raised about a statement of the minister of defence in the Syriza–ANEL coalition government Panos Kammenos regarding the role of the military as the guarantor of domestic stability, mainly because this contradicts the Greek Constitution.
According to the supporters of the referendum, a ‘No’ vote would mean the end of austerity by providing the government with extra power to negotiate. According to the ‘Yes’ camp, a ‘No’ vote would more or less force Greece to leave the Eurozone (termed ‘Grexit’). The parties that supported the ‘No’ vote included Syriza, ANEL and Golden Dawn (an extremist far-right party 3 ), as well as several small parties from the left that were not represented in the parliament. The parties that called for a ‘Yes’ vote were ND, PASOK and To Potami. The Communist Party of Greece (KKE) encouraged voters to ‘cancel out’ this dilemma by casting the proposal of the KKE as their vote into the ballot box; in other words, it called for invalid ballots. With 61.3 per cent of the vote, the referendum was blocked. A majority voted ‘No’ in every one of the 56 electoral constituencies, but with large variations throughout the country, revealing the presence of significant geographical, societal and political divisions (Artelaris and Tsirbas, 2018). This further confirmed the anti-EU sentiments among the Greek electorate and kept the euro-vs-drachma/Grexit debate alive. One week later, PM Tsipras realised that he was not in a position to deliver the best of both worlds – that is, the end of austerity and keeping Greece in the Eurozone. Finally, he pressed Parliament to approve new austerity measures, keeping Greece in the Eurozone. In July 2015, Greece’s lenders agreed on a third bailout agreement and a harsh austerity package.
Determinants of anti-EU vote: theoretical background and hypotheses
To identify the main drivers of anti-EU votes in a period when economic issues were more significant, salient and visible, a natural starting point is economic factors. Several strands of the literature focus on these, providing different – but not necessarily mutually exclusive – explanations.
In the field of political science, the theory of retrospective economic voting is an important tool for understanding voting behaviour (Kramer, 1971). Although its importance varies across electoral contexts, the economy represents one of the most fundamental and persistent drivers of voting. Its main idea is the ‘responsibility hypothesis’, which suggests that electorates tend to hold governments responsible for the economic situation in a given country, rewarding them for economic expansion and punishing them for economic decline (Dassonneville and Lewis-Beck, 2020). This hypothesis has received much attention lately – due to the Great Recession – calling for a re-examination of the field in these extraordinary times (Lewis-Beck and Lobo, 2017). This theory also extends to the subnational level, linking the changing geography of voting patterns to variations in a country’s economic geography (Pattie and Johnston, 2008). However, the scant empirical research at the regional level is in its infancy, focusing almost exclusively on the United States and the United Kingdom (Leib and Quinton, 2011: 12).
The literature on Euroscepticism highlights the role of economic factors because the process of European integration is likely to benefit more ‘advantaged’ citizens, for example, people with higher levels of income (Gabel and Palmer, 1995; Hobolt and De Vries, 2016). As a result, citizens predictably have different views concerning European integration: those who benefit from it generally hold a more pro-EU position while the ‘left-behinds’ – those who are typically hurt by the process – are more likely to oppose it (Tucker et al., 2002). From this perspective, this approach has been linked with the ‘left-behind’ thesis, which focuses on people’s (personal) characteristics such as income, education, age and ethnicity (Ford and Goodwin, 2014).
Another more recent strand of the literature examines the effects of austerity on election outcomes. This research suggests that fiscal consolidation and austerity can act as major drivers of anti-establishment and anti-EU voting (Alesina et al., 2019; Eichengreen, 2018; Fetzer, 2019; Ponticelli and Voth, 2020), mainly because they can reduce the role and capacity of the local state and intensify territorial inequality and injustice (Gray and Barford, 2018). Several recent studies support this link (Artelaris and Tsirbas, 2018; Essletzbichler et al., 2018; Fetzer, 2019; Galofré-Vilà et al. 2021), giving rise to a ‘geography of austerity’.
Yet another strand, known as the ‘geography of discontent’ came to the fore after the UK’s vote to leave the EU. This research primarily suggests that anti-EU and anti-establishment sentiments usually occur in economically weaker and more stagnated areas (Los et al., 2017, McCann, 2018, 2020; OECD, 2019: 43–45) and/or in the more affluent areas that experienced economic decline before the onset of the crisis (Dijkstra et al., 2020). In other words, discontent is strongly associated with places ‘left behind’ (rather than people ‘left behind’). According to this line of thinking, the anti-EU vote may also have been driven by more well-off and educated people living in relatively poor areas. In a similar vein, Rodríguez-Pose (2018) speaks about the revenge of the ‘places that don’t matter’ (not the ‘people that don’t matter’) – the revenge of declining, disadvantaged and left-behind areas whose residents use the ballot box as a ‘weapon’. In this sense, the term places ‘left-behind’ (or ‘places that don’t matter’) represents a contemporary manifestation of long-standing processes of geographically uneven development (MacKinnon et al., 2021).
A comparison of the various theoretical approaches reveals that studies focusing on the ‘responsibility hypothesis’ and the ‘geographies of austerity’ both take a short-term view of the economy in the sense that voters follow the business cycle or the economic effects of austerity; however, their emphasis is different. The former is examined extensively by political scientists who highlight that voters hold the government responsible for the economy. The latter is associated with the geographically heterogeneous effects of fiscal consolidation and austerity policies. On the other hand, the ‘places left behind’ and ‘geography of discontent’ both take a longer term view of the economy, focusing on the geographical dimension and territorial characteristics of the discontent. Poor economic prospects, (long-term) economic stagnation and decline and persistent levels of spatial inequality can all give rise to a profound geography of discontent. As McCann and Ortega-Argilés highlight, ‘the “geography of discontent” reflects the extent to which a large number of citizens in certain localities sense that their communities are being “left behind”’ (McCann and Ortega-Argilés, 2021: 550). In this context, these strands are differentiated from the literature on Euroscepticism and the people ‘left behind’ hypothesis, which mainly highlights the role of individual factors (e.g. economic and cultural) rather than the particular characteristics of territories.
Apart from the economic effects, several other factors have been acknowledged as important determinants of the anti-EU vote. Education, geography and immigration are among the most important factors considered in relevant studies. A lower level of education is associated with more vulnerable and less-skilled workers, poorer information about political issues and more culturally closed attitudes (Nieto, 2000: 307; Van Elsas, 2017). On the contrary, a higher level of education accompanies a greater level of trust in national governments and the EU, more support for European integration and less Euroscepticism (Arnorsson and Zoega, 2018; Foster and Frieden, 2017; Gabel and Palmer, 1995), as shown in many studies (Alabrese et al., 2019; Becker et al., 2017; Goodwin and Heath, 2016; Hobolt and De Vries, 2016).
Moreover, especially in terms of peripherality and rurality, geography has recently arisen as an important driver of anti-EU voting (Dijkstra et al., 2020; Rodríguez and Pose, 2018). While urban areas are typically more integrated into the national and EU space and more cosmopolitan in outlook, rural areas are usually more inward-looking and deprived of significant social facilities, more often experiencing a sense of being ‘left behind’ (Essletzbichler et al., 2018; Nicoli and Reinl, 2020). In this way, people living in less dense areas are likely to show a higher level of discontent, irrespective of the area’s wealth (McKay, 2019).
Finally, the anti-EU vote has also been linked with immigration; in many cases, anti-immigration sentiments are one of the most salient features of all political parties that engage in anti-EU rhetoric (Arnorsson and Zoega, 2018; Dąbrowski et al., 2019; Dijkstra et al., 2020; Goodwin and Milazzo, 2017). Several anti-EU parties perceive immigration as a disruptive socioeconomic and cultural force. For native citizens, especially the most vulnerable, immigrants might pose both an economic threat due to competition over scarce resources (mainly jobs and wages; (Margalit, 2019; Nicoli and Reinl, 2020) and a cultural threat to their national identity (Barone et al., 2016; Oesch, 2008).
Based on the above discussion, we formulate the following hypotheses related to (local) economic conditions and their effects on the anti-EU vote:
Hypothesis 1. Places hit harder by the 2008 crisis are more likely to support anti-EU parties.
Hypothesis 2. Places that experienced economic decline before the onset of the 2008 crisis are more prone to supporting anti-EU parties.
Hypothesis 3. Places with less favourable long-term economic situations tend to vote more often for anti-EU parties.
The first hypothesis addresses short-term dynamics and is related to the ‘responsibility hypothesis’ and ‘geographies of austerity’; the second hypothesis targets the medium-term economic effects; and the third hypothesis focuses on longer term economic effects, mainly associated with the ‘geography of discontent’ and the ‘left-behind hypothesis’.
From theory to empirics
Drawing on the discussion above, we use a multivariate model to explore the effects of economic conditions on electoral outcomes, tested by the following cross-sectional 4 regression model:
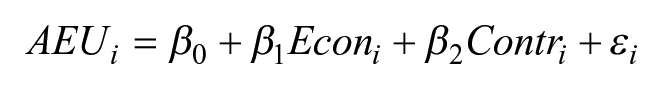
where
Figure 2 maps the geographical distribution of this variable in the last elections held during the crisis (September 2015) at LAUs. These units are subdivisions of the nomenclature of territorial units for statistics (NUTS) 3 regions covering the whole economic territory of each EU member state. In Greece, LAUs are the lowest level of government in the organisational structure of the country and are divided into 325 municipalities in total. The figure shows large variations among municipalities (28%–78%), portraying a deeply divided country. Moreover, Figure 3 maps the change of taxable per capita income during the crisis (2008–2014), also revealing large geographical differences. Interestingly, comparison of the maps reveals that there is a moderate negative link between the share of the votes for parties expressing Euroscepticism and the change of taxable per capita income.
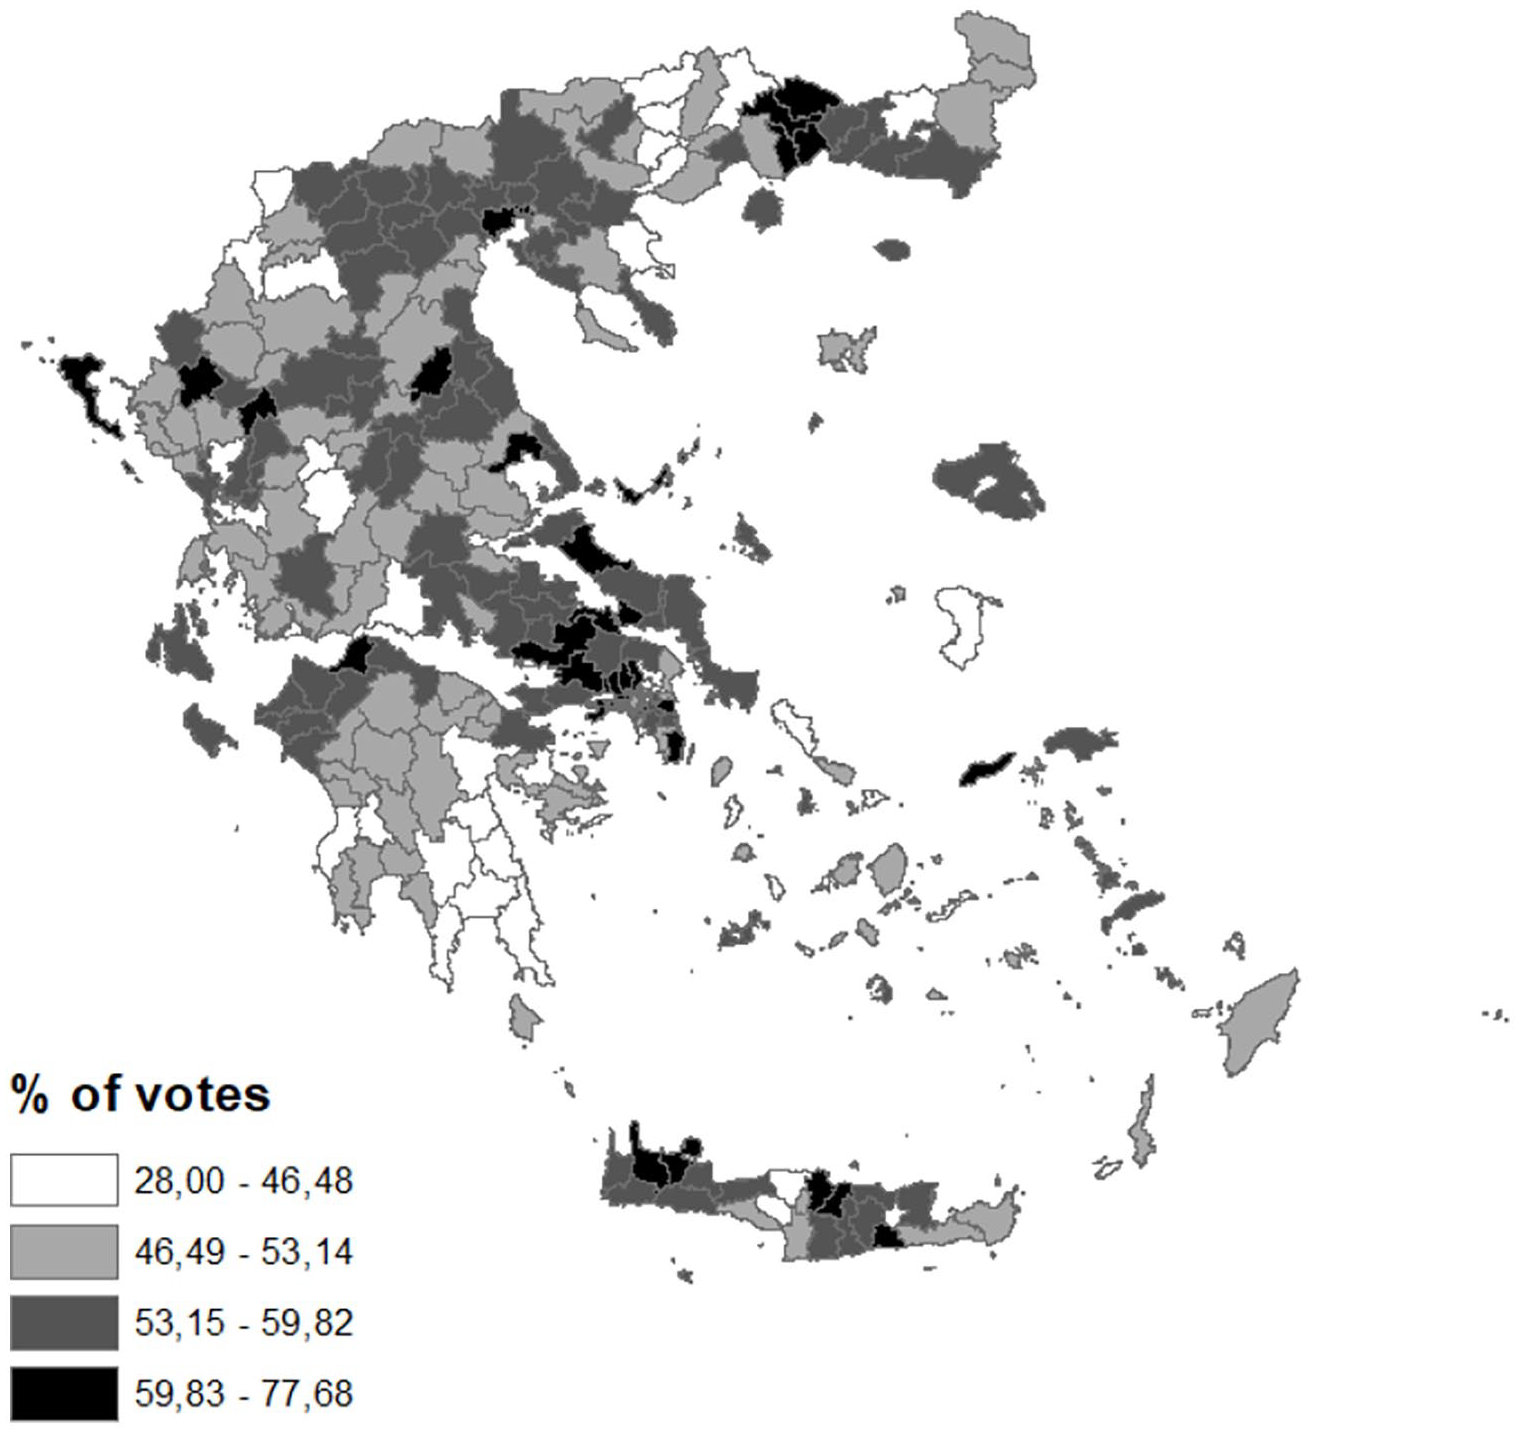
Share of the votes for parties expressing Euroscepticism at municipal level in Greece, September 2015 elections.
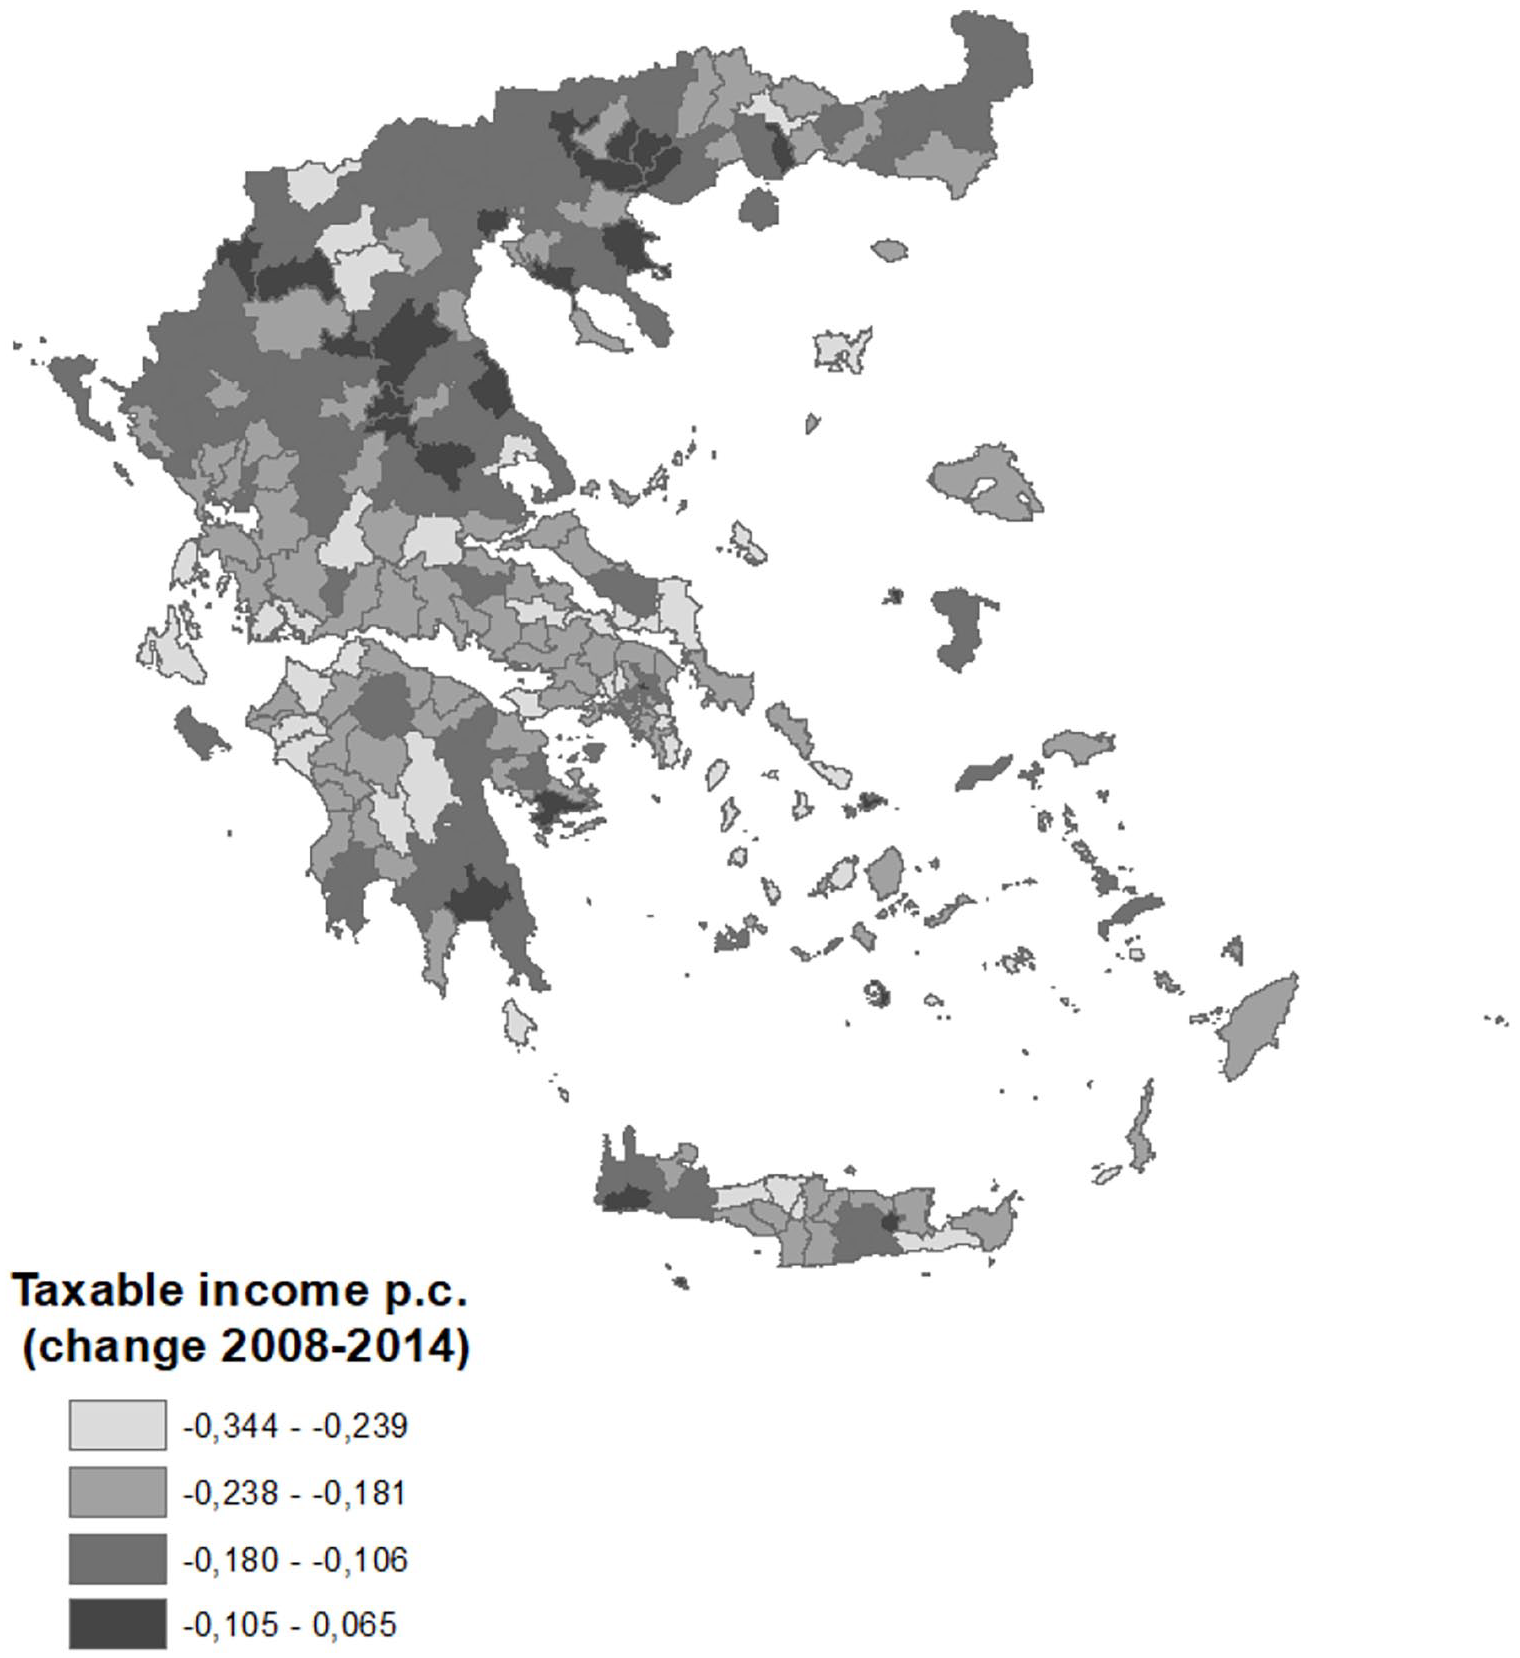
Taxable income per capita at municipal level in Greece, Change 2008–2014.
It is important to note that the use of aggregated data is known to suffer from two problems, namely ecological fallacy and the modifiable areal unit problem (MAUP). The former refers to the possibility of making false inferences from aggregate data to explain individual behaviour (Robinson, 1950), while the latter refers to how the results of an analysis can change when the areal units change (Openshaw, 1984). Thus, it has been argued that individual-level data analysis is more appropriate because associations at the individual level are considered to be more valid and truthful. However, despite the ‘individualistic primacy’ (Loney and Nagelkerke, 2014) among social researchers, the advantages and importance of the aggregate-level approach have long been recognised (Alabrese et al., 2019; Wellhofer, 1991). For instance, an aggregate analysis using objective measures and real voting data avoids problems related to measurement error and non-response in survey data as well as other problems raised by the subjectivity of survey responses (Elinder, 2010). Moreover, the direction of associations revealed at the aggregate level is usually the same as the direction discovered at the individual level (Alabrese et al., 2019; Loney and Nagelkerke, 2014) suggesting that ecological fallacy might be of limited concern. In our case, we think that the use of LAU regions, which present much less heterogeneity than would be observed in the larger NUTS 2 or 3 regions, can further alleviate this problem.
Key explanatory variables
Building on insights from previous studies, we use a set of indicators as key explanatory variables to measure economic effects at the municipal level. In the absence of data on spending and disposable income or other relevant data such as per capita gross domestic product (GDP) (used by Dijkstra et al., 2020) 6 or wages (used by Becker et al., 2017) at a low level of spatial aggregation, and following Galofré-Vilà et al. (2021), who suggest that changes in taxes have an impact analogous, if not proportional, to cuts in spending, we use the change of average taxable income as a measure of austerity 7 (i.e. short-term economic effects). Although tax data in Greece suffer from under-reporting and frequent changes to tax laws, they are typically more appropriate for the investigation of short-term changes (Atkinson et al., 2011). The tax data used in this study come from a relatively new database that includes data by zip code, resulting in some modifications. 8 The data are provided, upon request, by the Ministry of Economy and Finance. Table 1 presents a description of all variables used in the analysis.
Description of the variables used in the regression analysis.
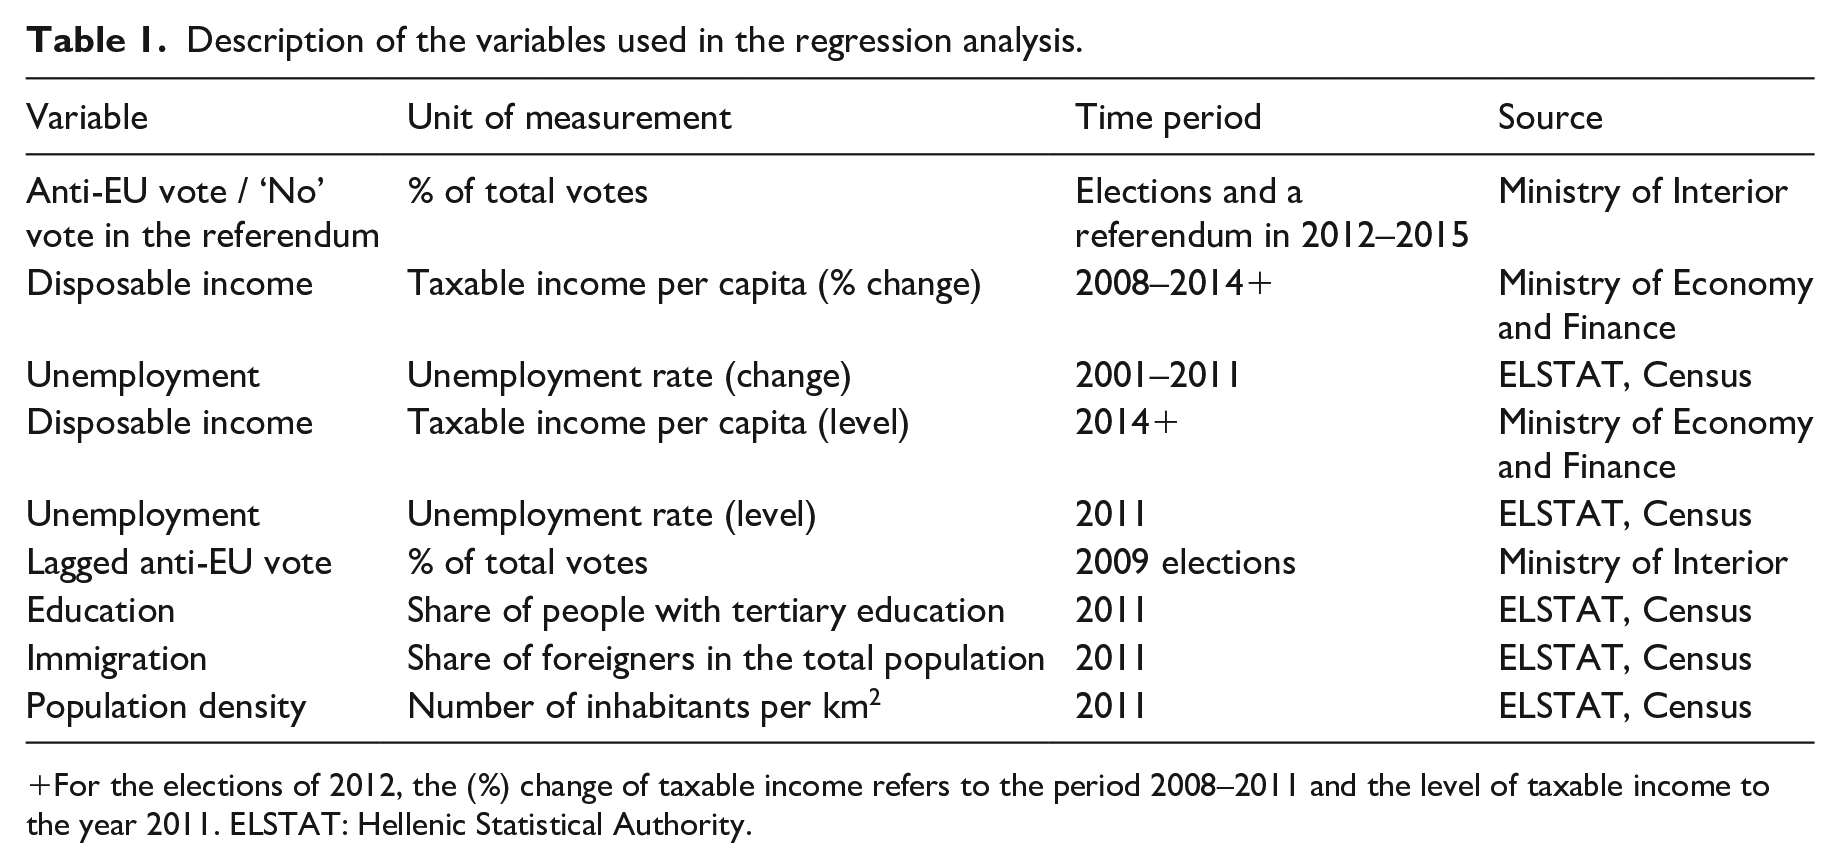
For the elections of 2012, the (%) change of taxable income refers to the period 2008–2011 and the level of taxable income to the year 2011. ELSTAT: Hellenic Statistical Authority.
To capture the economic effects and decline that started before the onset of the (deep) crisis (i.e. medium-term economic effects), we use the change in the unemployment rate from 2001 to 2011. Data for this variable are provided, upon request, by the Hellenic Statistical Authority (ELSTAT). This indicator provides a good measure of local economic conditions (Pattie and Johnston, 2008). It also lies at the heart of the theory of economic voting and its rise has been linked to the dramatic decline in European trust (Foster and Frieden, 2017). It has further been acknowledged as a significant determinant of anti-establishment votes. For instance, Algan et al. (2017) found that increases in unemployment (rather than the level of unemployment) during 2007–2015 were strong predictors of the Brexit vote. In a similar vein, Rombi (2016) shows that the performance of the Eurosceptic parties can be greatly attributed to the increase in unemployment rates. This indicator seems to have also played a significant role in the rise of the Nazi party (Nannestad and Paldam, 1994). 9 The longer term economic effects on the anti-EU vote are captured by using the levels of the aforementioned variables – that is, the average taxable income and unemployment rates.
Control variables
To prevent omitted variable bias leading to overestimating the effects of economic conditions, we also include the lagged anti-EU vote in our model. This variable is operationalised by adding the anti-EU vote shares in the elections before the onset of the economic crisis (i.e. 2009) using the CHES categorisation. This way, we neutralise the contextual effects, including, inter alia, history, cultural and religious features and ideological predisposition. In essence, this is a very strict control variable; many studies indicate that once this variable is considered, other important economic, social, political or demographic variables are no longer significant (Bouvet and King, 2016; Fernández-Durán et al., 2004; Martinsson, 2013). Furthermore, as mentioned above, education, geography and immigration 10 are potentially critical variables and can also be included in the model. This is important not only for ruling out potential sources of spuriousness and enhancing the control for variable omission bias but also for assessing their effects on the anti-EU vote.
Estimation results
Models 1–10 in Tables 2 and 3 test our hypotheses for each of the four elections and the referendum. Table 2 presents the results including only our key explanatory variables: the first series of models (Models 1–5) includes the variables reflecting economic changes, and the second series (Models 6–10) additionally contains the variables capturing economic levels. We also examine the presence of spatial autocorrelation using a spatial weight matrix. Given that there are several islands in our dataset, we rely on a k-nearest neighbours criterion where k = 15 (calculated from the distance between region centroids). Since all estimated models present problems with the hypothesis of spatial autocorrelation, ordinary least squares (OLS) regression is not appropriate (Anselin, 1988). In the presence of spatial autocorrelation, (spatial) models are estimated by employing the maximum likelihood (ML) method. However, since ML is sensitive to deviations from homoscedasticity and our results show problems of heteroscedasticity (see Breusch–Pagan test in Table A1 in the Supplemental Appendix), the models presented in the tables are estimated using the generalised method of moments (GMM) (Arraiz et al., 2010). The spatial error model seems to perform better than any other spatial model used (e.g. the spatial lag, spatial Durbin and cross-regressive models). Tables A1–A4 in the Supplemental Appendix report the full OLS and ML results.
Determinants of anti-EU vote, Basic Model (Economy only), SEM-GMM estimations.
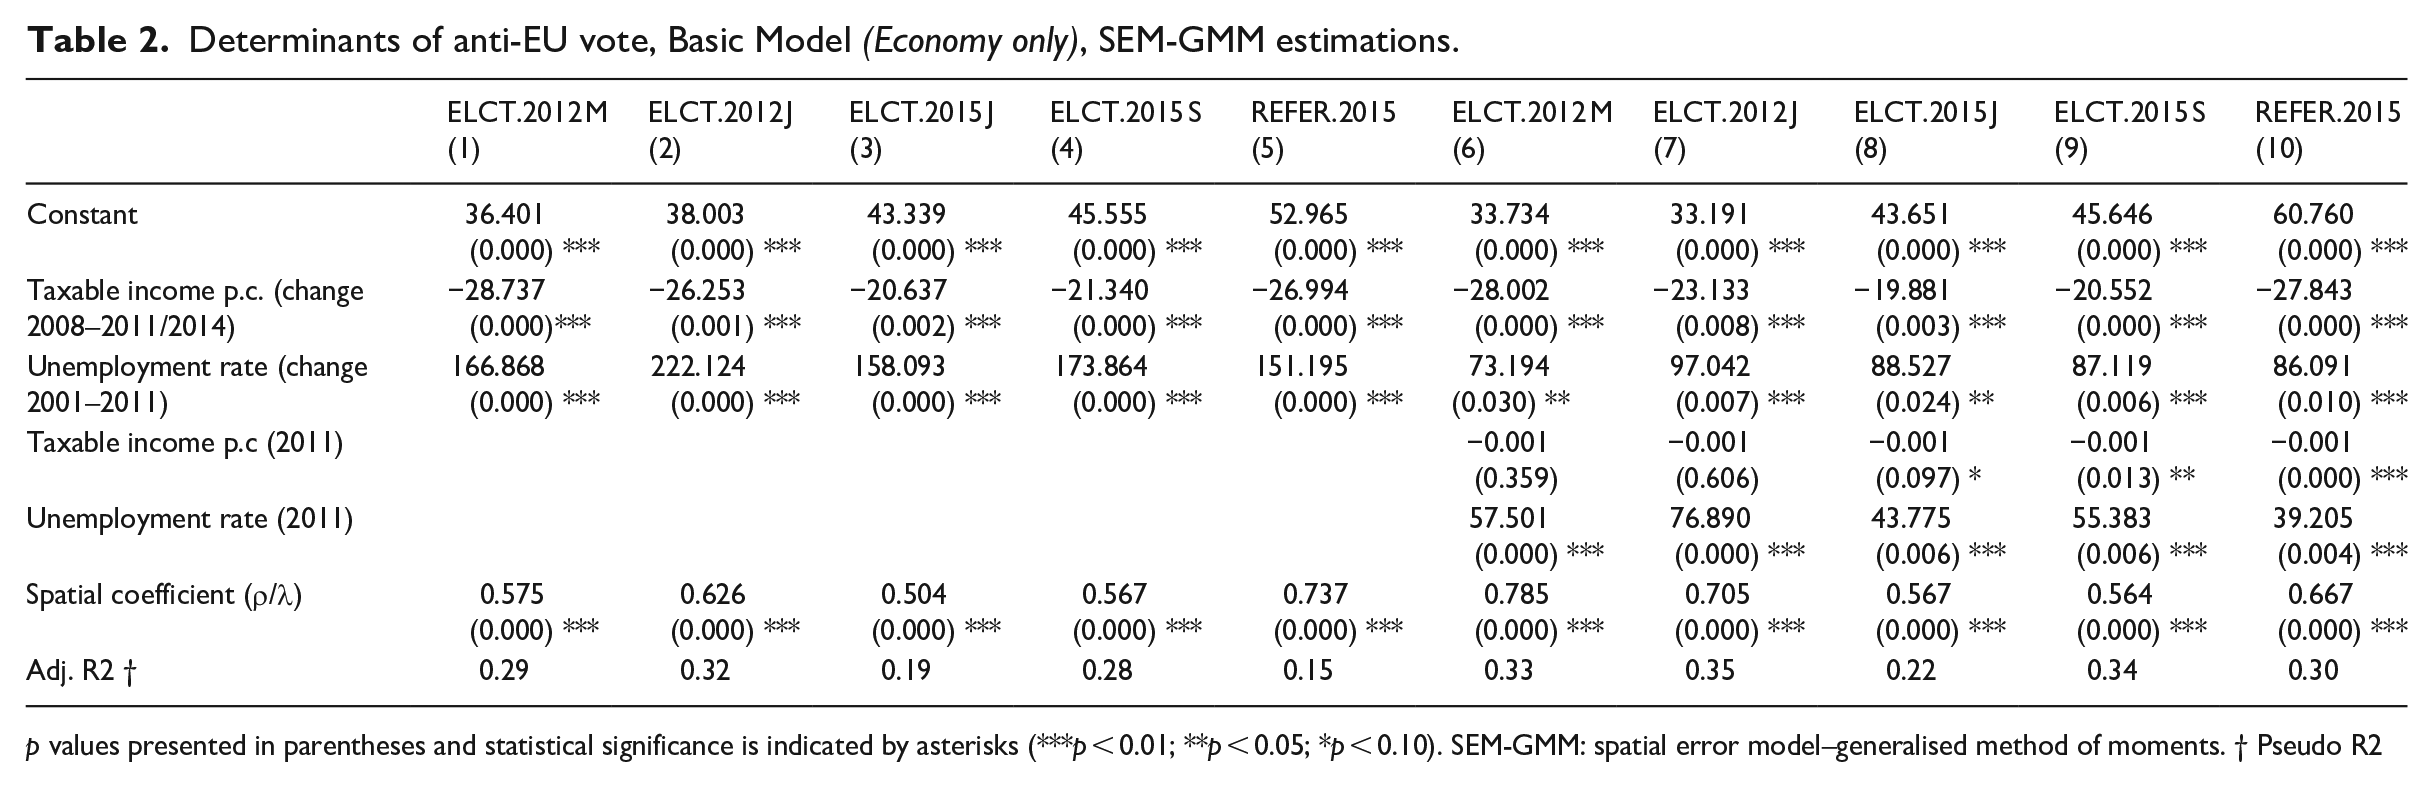
p values presented in parentheses and statistical significance is indicated by asterisks (***p < 0.01; **p < 0.05; *p < 0.10). SEM-GMM: spatial error model–generalised method of moments. † Pseudo R2
Determinants of anti-EU vote, Extended Model, SEM-GMM estimations, k = 10.
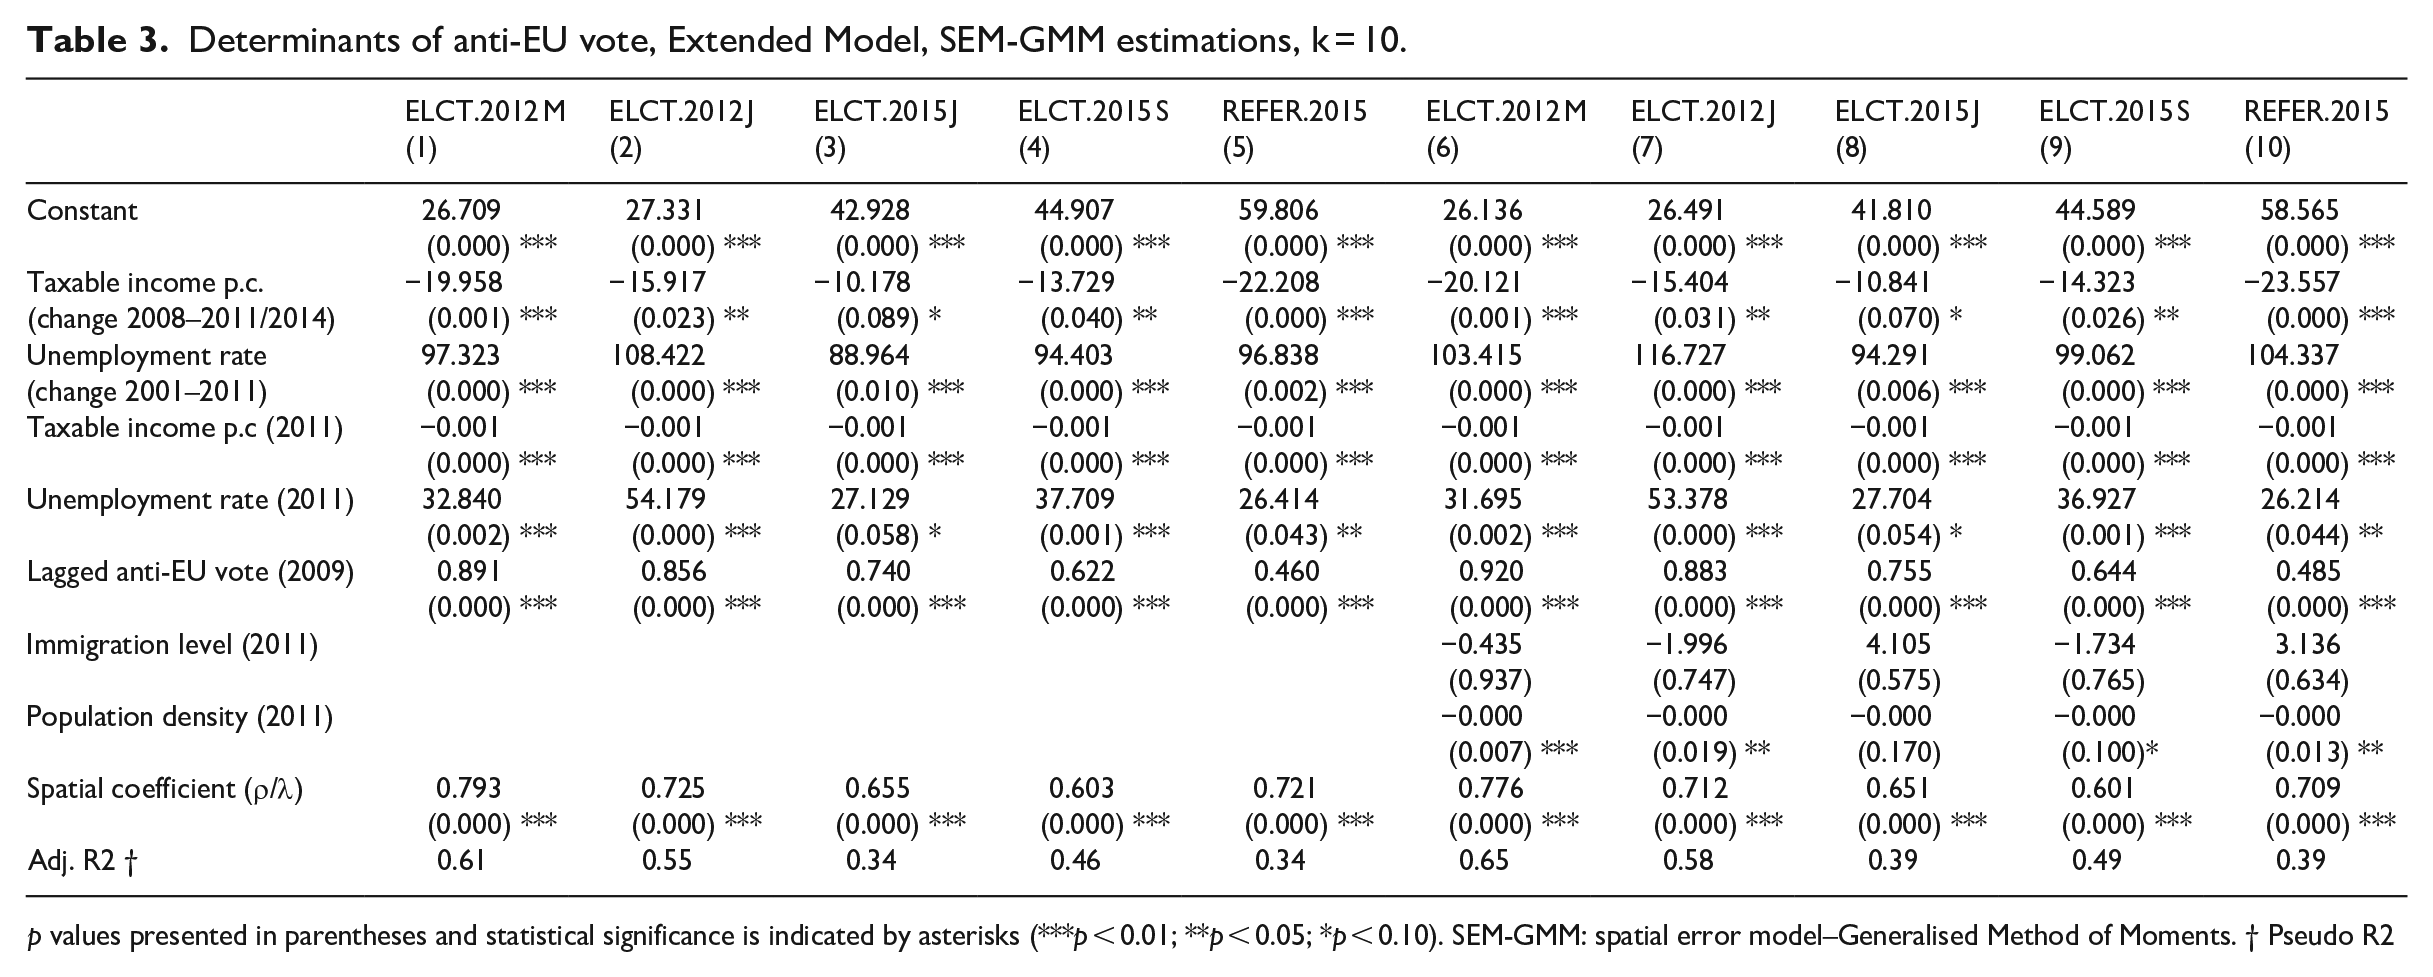
p values presented in parentheses and statistical significance is indicated by asterisks (***p < 0.01; **p < 0.05; *p < 0.10). SEM-GMM: spatial error model–Generalised Method of Moments. † Pseudo R2
As Table 2 shows, in our initial models capturing only the economic changes (Models 1–5), the estimated parameters have the expected signs and are highly significant according to the conventional criteria. Moreover, the spatial coefficient is positive and highly significant, implying evidence of spatial dependence. The model fits the data well, explaining 15%–30% of the variance. The additional economic variables (Models 6–10) that capture the longer term effects are also highly significant in most of the models and have the expected signs. Table 3 presents the results including also the control variables. The first series of models (Models 1–5) only contains the ‘strong’ variable of the lagged anti-EU vote while the second (Models 6–10) also contains the rest of the variables. As is evident, our (initial) results remain almost identical even after controlling for the ‘strong’ variable of the lagged anti-EU vote (Models 1–5), as well as immigration 11 and geography (Models 6–10). Economic conditions still seem to play a significant role. Most of these models fit very well, explaining 45%–60% of the overall spatial variation.
Tables 2 and 3 reveal some (rather minor) differences between the models. More specifically, we can see from both tables that the magnitudes of the coefficients differ across specifications, though the differences are small. These changes can be explained, for instance, by the different voting contexts, measurement errors or some other unidentified factors. Interestingly, the variable of taxable income per capita is not significant for the elections of 2012 (Models 6 and 7 in Table 2) but is highly significant for the rest. This is likely evidence of omitted bias since this variable is highly significant in all (full) specifications of Table 3. More pronounced differences can be detected from the results of OLS and ML (Tables A1–A4 in the Supplemental Appendix) not only in terms of the magnitude of the coefficients but also their significance; they can be explained, however, by the presence of spatial autocorrelation and heteroscedasticity, making OLS and ML regressions inappropriate. This is a significant finding for studies analysing election results. Overall, economic changes seem to have a discernible and consistent effect on the anti-EU vote in all our models. Even if the significance and the magnitude of the coefficients vary across different models, the data show a significant link between our key explanatory variables and the anti-EU vote.
Finally, it is important to note that the level of taxable income strongly correlates with the level of education, as confirmed by the correlation matrix, variance inflation factors and coefficient variance decomposition. 12 This means that it cannot be included in the same model. Since the main aim of our study is to examine the economic effects on the anti-EU vote, we chose to include the level of taxable income in our main models. In Table A5 in the Supplemental Appendix, however, we show the results using education instead of taxable income; as is evident, this variable is also a highly significant factor in the anti-EU vote.
Robustness analysis
To assess the robustness of the baseline findings, several issues need consideration before drawing conclusions. For this reason, we estimate alternative models with different specifications. First, we consider the changes (increases), rather than the levels, of the anti-EU vote as a dependent variable, using the elections of 2007 as a benchmark. Second, we address the concern of endogeneity by employing an instrumental variables approach. Although it is likely not a serious problem in our study because anti-EU voting is a recent phenomenon and has a negligible effect on past economic performance (Dijkstra et al., 2020), we address endogeneity to assess and minimise potential risks. In the absence of good instruments due to the unavailability of data at a low aggregation level, taxable per capita income is treated as endogenous and past levels of this variable are used as instruments. Third, we use an alternative proxy for education, defined and estimated as the share of people with basic or no education in the total population. Fourth, various alternative weight matrices are tested (k = 5, 10 and 20). Fifth, the lagged anti-EU vote is also estimated using the anti-EU voting shares in the previous three national elections (i.e. 2000, 2004 and 2007). Sixth, we include several geographical variables, such as distance to the capital of the country and/or NUTS 2 region. Finally, we add a dummy variable for the municipalities belonging to the region of Attiki, to control for the potentially different behaviour of this area. This region accounts for about 50 per cent of the national GDP and 40 per cent of the population and has a very high population density – by far the highest in the country. In general, the results remain essentially unchanged for all these alternative specifications, with no significant differences compared to the results reported in Tables 2 and 3.
Discussion
The empirical analysis supports our basic hypotheses, showing a robust link between the country’s changing economic geography and the geography of the anti-EU vote. More specifically, the results obtained using several GMM models can be translated into four main findings. First, places hit harder by the 2008 crisis, captured by the change of average taxable income in 2008–2014, were more likely to support anti-EU parties (Hypothesis 1). This finding aligns with previous studies on the ‘geographies of austerity’ (Artelaris and Tsirbas, 2018; Essletzbichler et al., 2018) and the ‘responsibility hypothesis’. Second, places that experienced economic decline before the outbreak of the 2008 crisis, captured by the change in unemployment rates during 2001–2011, were more prone to supporting anti-EU parties (Hypothesis 2). This finding agrees with the studies considering local economic decline, starting before the onset of the crisis, as a significant driver of the anti-EU vote (Dijkstra et al., 2020). Third, places with less favourable long-term economic situations, captured by the levels of average taxable income and the unemployment rate, tend to vote for anti-EU parties (Hypothesis 3). This finding agrees with the literature on Euroscepticism and the ‘geography of discontent’ as well as the ‘left-behind hypothesis’, suggesting that the anti-EU vote usually occurs in economically disadvantaged places. However, it contrasts with the finding of Dijkstra et al. (2020) that once the analysis controls for economic decline before the crisis, well-off places are more likely to vote for anti-EU parties.
Interestingly, our results are robust even after controlling for the ‘strong’ variable of the lagged anti-EU vote. Previous similar studies almost totally ignore this important variable. Concerning the rest of the factors used in the models, education and population density seem – as other recent studies have also highlighted (Di Matteo and Mariotti, 2020; Dijkstra et al., 2020; McKay, 2019) – to be significant drivers of the anti-EU vote. In this sense, the ‘geography of discontent’ can be further related to areas that are marginal not only in economic terms but also in physical and social ones. On the contrary, although migration has frequently been a significant source of Eurosceptic sentiments and anti-EU voting (Dąbrowski et al., 2019; Dijkstra et al., 2020; Nicoli and Reinl, 2020), it was not statistically significant in any econometric specification of our study. This finding aligns with the fact that, in contrast to other EU countries, Greek citizens do not mention migration as a critical issue (Eurobarometer, 2015) as well as with previous findings highlighting the small explanatory power of immigration for the UK referendum vote (Becker et al., 2017; Colantone and Stanig, 2018; Crescenzi et al., 2018).
Two additional interesting findings emerged from the analysis, including the similarity of our estimation results in different voting contexts and the strong evidence of spatial autocorrelation. The former highlights the key role of economic effects in both elections and the referendum. The latter indicates that voting analysis should comprehensively and explicitly consider the spatial dimension. The selection of the spatial error model as the most appropriate specification implies that certain areas might vote in a certain manner due to local customs or historical reasons (Lacombe and Shaughnessy, 2007).
On a broader empirical level, future research efforts should focus on an exhaustive analysis of a range of socioeconomic characteristics such as EU transfers, trade, public services provision, commuting, public sector jobs, age structure and sector structure. This type of analysis could also be complemented with individual data. Moreover, more efforts should be directed to comprehending the spatial effects (i.e. spatial autocorrelation and heterogeneity) in the anti-EU vote. This is an under-researched area of study that has not been addressed by several anti-EU vote studies such as the studies of Becker et al. (2017) and Dijkstra et al. (2020).
Conclusion
The recent seismic changes in the EU coincided with the rise of disruptive political attitudes, electoral instability and strong anti-EU sentiments, resulting in the dramatic transformation of the EU political landscape. Applying objective economic measures, spatial econometrics and municipal voting data from recent elections and a referendum, we explored the economic factors shaping anti-EU votes in Greece. The empirical analysis revealed a robust link between the country’s changing economic geography and the geography of the anti-EU vote. To a great extent, the anti-EU vote reflects both the economic changes that started before the outbreak of the 2008 crisis and the economic changes fuelled by post-2009 austerity policies. Our findings – which are robust even after controlling for other ‘strong’ variables, such as the lagged anti-EU vote – provide further evidence of not only the ‘places that don’t matter’ and the ‘geography of discontent’ hypotheses, both related to the ‘places left behind’, but also the ‘geography of austerity’, associated with the heterogeneous effects of fiscal consolidation and austerity. Moreover, our findings illustrate the deep geographical socioeconomic divide. As Hendrickson et al. (2018) suggest, ‘the economic divide fuelling political discontent may not be between the poorest and richest members of society, but between prosperous and lagging regions’ (p. 16).
Our findings have some important policy implications since the geography of EU discontent is probably ‘a symptom of an underlying policy failure’ (OECD, 2019: 44), which can severely affect the process of EU economic integration. Policymakers should consider this when designing policies; to combat it, ‘development policies for lagging and declining areas offer the most realistic and viable option’ (Rodríguez-Pose, 2018: 206). In the context of the EU Cohesion Policy, this does not necessarily mean more policies and spending but, rather, better and more effective policies (Crescenzi et al., 2020; Rodríguez-Pose, 2018). Money cannot buy trust in the EU (Crescenzi et al., 2018; Fidrmuc et al., 2019), but ‘its capacity to generate new local opportunities certainly can’ (Crescenzi et al., 2020: 1). Although examining the EU as a whole seems to link cohesion policy to a diminished anti-EU vote (Rodriguez-Pose and Dijkstra, 2021), recent empirical evidence suggests that this policy may be less effective in countries like Greece that include many areas that are less socioeconomically advanced (Crescenzi and Giua, 2016) and where policymakers cannot address the needs of the people (Dotti, 2013). For countries like Greece, the problem is greater due to the possible inefficiency of public investment in less developed areas (Rodríguez-Pose et al., 2012) and the fact that regional policy is significantly dependent on EU Cohesion Policy (Christofakis and Papadaskalopoulos, 2011).
Since the recession accompanying the pandemic will probably test the unity and solidarity of the EU once again, what we can anticipate in the post-Covid-19 era remains an open question. The economic effects of the pandemic are expected to be not only spatially uneven but also more extensive and profound than those of the 2008 crisis (Bailey et al., 2020). The adoption of fiscal discipline and austerity measures does not seem a likely scenario in the near future. However, the recent EU initiatives (that is, the EU’s long-term budget coupled with the Next Generation EU initiative) indicate that the scenario cannot be ruled out for the coming years because the initiatives will likely be insufficient to fully offset the economic effects of the pandemic. As a result, a new surge of political tension, discontent and anti-EU voting could appear in many EU regions. The Greek case is a good example of how this may provide a unique opportunity for further understanding and insight into an understudied area of social science, calling for further integration of political science, regional science and economic geography.
Supplemental Material
sj-docx-1-eur-10.1177_09697764221101742 – Supplemental material for The economic geography of European Union’s discontent: Lessons from Greece
Supplemental material, sj-docx-1-eur-10.1177_09697764221101742 for The economic geography of European Union’s discontent: Lessons from Greece by Panagiotis Artelaris in European Urban and Regional Studies
Footnotes
Declaration of conflicting interests
The author(s) declared no potential conflicts of interest with respect to the research, authorship, and/or publication of this article.
Funding
The author(s) received no financial support for the research, authorship, and/or publication of this article.
Notes
Supplemental material
Supplemental material for this article is available online.
References
Supplementary Material
Please find the following supplemental material available below.
For Open Access articles published under a Creative Commons License, all supplemental material carries the same license as the article it is associated with.
For non-Open Access articles published, all supplemental material carries a non-exclusive license, and permission requests for re-use of supplemental material or any part of supplemental material shall be sent directly to the copyright owner as specified in the copyright notice associated with the article.