
Abstract
The logical connection between financial literacy (FL) and household well-being (HWB) has been a subject of economic debate among academics and policymakers for a long time. The World Bank considers FL as a tool for poverty eradication and reducing income inequality across the globe. The present study aims to assess the impact of FL on HWB among rural households in the Cachar district of Assam state. We have constructed the HWB index (HWBI) by considering educational background, health status (HLT), wealth information (WLT) and water, sanitation and hygiene (WASH) facilities as holistic measures of HWB. Further, the composite FL index (CFLI) has been measured by considering knowledge of multiple dimensions of financial services. The sub-dimensions under the HWBI and CFLI were constructed using the percentage present score (PPS) approach based on multiple binary response questions under each dimension. Multi-stage sampling has been utilised for data collection through personal interviews using structured schedules in rural and urban areas, and logit-transformed regression has been used to investigate the impact of FL on HWB. The findings of the study report that urban households have significantly higher degrees of FL and HWB than rural households in the study area. We found that heterogeneity exists in FL based on gender and marital status. The results reveal that FL significantly impacts HWB and indicate that demographic variables such as education, income, internet-enabled mobile phones and social media promote HWB. This study bridges the literature gap by investigating the real-world association between FL and HWB. It provides empirical insights for policy-making to improve HWB by increasing financial inclusiveness in society.
Keywords
Introduction
Financial literacy (FL) is the ability of people to manage financial resources effectively, make informed decisions, and navigate complex economic systems. There are numerous definitions of FL. The National Financial Educators Council defines FL ‘as possessing the skills and knowledge on financial matters to confidently take effective action that best fulfils an individual’s personal, family and global community goals’. FL has emerged as a critical factor influencing household well-being (HWB) across diverse socio-economic landscapes. The relationship between FL and HWB has become an important focus of research, especially in examining the differences between rural and urban populations. FL refers to the knowledge and abilities required for sound financial management, enabling individuals to make well-informed financial decisions. This dissertation explores the impact of differing levels of FL on HWB across various geographical settings, highlighting the contrasting experiences of urban and rural households.
Financial well-being is influenced by key factors such as financial security, saving habits, access to credit and overall economic stability. Urban households, in particular, display unique financial behaviours shaped by enhanced access to financial services, educational opportunities and broader economic prospects. At the same time, they encounter specific challenges, including higher living costs and exposure to complex financial products. This makes FL essential for navigating and effectively managing their financial landscape. According to Atkinson and Messy (2012), urban households with greater FL are better able to handle complicated financial systems, which improves saving habits, lowers excessive debt and increases investment in health and education. In order to reduce economic disparities, their study emphasised that urban FL programmes should concentrate on filling in low-income populations’ knowledge gaps.
In contrast, rural households frequently encounter specific obstacles, such as restricted access to financial institutions, lower levels of FL and distinct cultural attitudes toward money management. Research has demonstrated that individuals with greater financial knowledge are better equipped to navigate economic challenges, reduce debt and improve their financial situation. This study seeks to shed light on these differences, offering a detailed analysis of how FL impacts HWB in varied settings. Karlan et al. (2016) investigated the connection between HWB in rural areas and financial education initiatives. They discovered that training in FL remarkably improved rural families’ debt management, savings rates and financial planning. These outcomes were attributed to improved budgeting abilities and heightened knowledge of financial products, which eventually enhanced household welfare. The study concluded that increasing FL in rural areas is crucial to rural development strategies because it improves economic stability and fosters resilience against financial shocks.
This dissertation aims to enrich the discourse on FL and its impact on household welfare by emphasising the pressing need for tailored financial education programmes. By addressing the unique needs and circumstances of urban and rural households, the study’s findings will provide valuable insights for policymakers and practitioners. These insights can guide the development of effective strategies to enhance FL, ultimately improving HWB and fostering a more financially resilient society while narrowing the gap between urban and rural demographics.
This research on the impact of FL on HWB, with an emphasis on rural–urban differences, holds important implications for policymakers, financial institutions and households alike. By shedding light on the gaps in FL and HWB between rural and urban regions, the study can guide the development of targeted strategies to enhance financial inclusion, alleviate poverty and foster economic growth. Furthermore, the findings can equip households, especially those in rural areas, with the knowledge to make informed financial choices, ultimately contributing to greater well-being and financial security.
Review of Literature
FL helps individuals make sound financial decisions by improving their financial knowledge, attitude and skills, leading to effective financial management. Several research studies have explored the concept, components, measurement and problems related to FL and HWB. Previous researchers have highlighted the beneficial impact of education and one’s educational background in enhancing FL levels among women in India. It has been observed that although it is imperative that women should be given equal power to make financial decisions as taken by men, many Indian women are facing several cultural, financial, psychological and physical barriers that are creating hindrances in becoming financially literate (Baluja, 2016; Kaur et al., 2015; Kumar & Anees, 2013). A study was conducted on employed individuals in rural and urban areas of the Majha region of Punjab, and it was discovered that higher income levels (INCs) boost awareness and opportunities for investment options (Aulakh & Saluja, 2017). Jana et al. (2017) found that respondents working in the unorganised rural sectors generally had low FL, with women being in a worse situation than men. Similarly, Chen and Volpe (1998) revealed lower financial knowledge among college students. The main reason for the lower level of FL was that young students are exposed to only a limited number of financial issues at this early stage of life. Another study discovered that the working youth in the Punjab district possess a relatively good basic FL but lack proficiency in advanced FL. It indicated that three dimensions of FL, that is, financial knowledge, financial behaviour and financial attitude, positively impact the FL of the individuals attending FL programmes in northern India (Thakur & Mago, 2018). Bansal and Kaur (2024) reported lower FL among rural households in Punjab state and observed a gender divide in FL. Similarly, Jayaraman and Jambunathan (2018) also found a low level of FL among school students in India. Women and younger individuals in the United States have been observed to possess lower levels of FL (Lusardi & Mitchell, 2011). FL levels have been shown to vary based on family income, with children from wealthier families exhibiting higher FL (Aizcorbe et al., 2003). Multiple studies have highlighted significant disparities by race and ethnicity, showing that African Americans and Hispanics have the lowest levels of financial knowledge in the United States (Lusardi & Mitchell, 2007b, 2011). FL was also positively associated with parental education and whether parents owned stocks and retirement accounts during their children’s upbringing (Lusardi et al., 2010). Lusardi and Mitchell (2007b) have reported that individuals without a college degree demonstrated lower FL. While cognitive ability is linked to FL, it did not completely account for the differences in FL based on educational attainment. Klapper and Panos (2011) have previously noted a geographical disparity in FL across many countries, with urban areas exhibiting higher levels of FL than rural regions. Another previous study has indicated that FL can reduce relative household poverty by encouraging participation in entrepreneurial activities, involvement in commercial insurance, and selecting appropriate lending channels (Wang et al., 2022). Another study has shown that the FL of rural communities significantly influences financial inclusion. When individuals can make informed financial decisions and demonstrate responsible financial behaviour, they tend to experience greater financial inclusion, leading to improved socio-economic empowerment (Panakaje et al., 2023). Numerous researchers have also demonstrated that FL programmes for high school students have successfully improved financial knowledge and its practical use (Carlin & Robinson, 2012; Danes, 2006; Danes et al., 2013; Gellman & Laux, 2011; Morton & Schug, 2001; Walstad et al., 2010). Nevertheless, Mandell (2008), in their study on high school seniors, observed that classes on money management and personal finance did not consistently result in higher levels of FL. Walstad and Rebeck (2012) utilised data from the High School Transcript Study carried out by the National Center for Education Statistics (NCES) at the US Department of Education. They discovered that only 7.9% of students enrolled in some financial education course at their high school. However, these low figures could be attributed to students receiving FL instruction through other courses that were not explicitly labelled as FL classes (Walstad et al., 2016). Thus, some evidence suggests that rigorous financial education at the high school level is lacking. A study by Agarwalla et al. (2013) emphasised that the low numeracy skills of the Indian population contribute to their lower levels of FL, which is largely attributed to the country’s inadequate educational system. Gender has been found to significantly influence the FL levels of the respondents (Agarwalla et al., 2015; Arif, 2015; Bhushan & Medury, 2013;). The gender gap in education affects women’s financial knowledge and behaviour (Aterido et al., 2013). Asaad (2015) examined the impact of FL on financial behaviour and discovered that both financial knowledge and confidence are crucial components and statistically significant predictors of financial behaviour. The economic literature on FL frequently emphasises its impact on savings behaviour and participation in the stock market (Deuflhard et al., 2019; Van Rooij, et al., 2011b), retirement planning (Bucher-Koenen & Lusardi, 2011; Lusardi & Mitchell, 2007a; Van Rooij, et al., 2011a) and financial well-being (Xue et al., 2020). Another study emphasised that FL affects both formal and informal savings for men and women. It also revealed that urban respondents possess higher FL levels than their rural counterparts (Murendo & Mutsonziwa, 2017). Lusardi and Klapper proposed that FL enhances financial resilience, while their studies lacked empirical support and in-depth exploration of mechanisms, particularly during economic shocks. Kumar and Kulal (2021) highlight the impact of globalisation in promoting FL among rural investors and examine their FL levels by gathering data from 50 randomly chosen participants. D’silva et al. (2012) examined the FL levels of women in Mumbai, emphasising their roles in financial security and decision-making in urban areas, while stressing the need for increased awareness about investment opportunities. Choudhary and Kamboj (2017) study examined the FL of 500 respondents from Haryana, finding that although many have the basic financial knowledge and demonstrate positive financial behaviour, a considerable number lack a positive financial attitude, especially among individuals with lower incomes, income instability and younger age. Ali et al. (2016) investigated the FL levels of Australian secondary school students, uncovering differences between urban and rural participants and analysing how factors like socio-economic status and language background affect their knowledge levels.
Research Gap
The previous studies found that despite the growing body of literature on FL and HWB, a significant research gap exists in understanding the impact of FL and HWB in rural and urban settings. While previous studies have explored the relationship between FL and HWB, they have primarily focused on urban areas, neglecting the unique challenges faced by rural households. Furthermore, few studies have examined the differential impact of FL on below poverty line (BPL) and above poverty line (APL) households, which is critical for developing targeted interventions. This study aims to address these gaps by exploring the impact of FL on HWB in rural and urban settings, focusing on household-level primary data.
The broad objective of the study is to assess the effect of FL on households’ well-being in the Cachar district of Assam. More specifically, this study attempts.
To access the status of FL and HWB among households. To identify the rural–urban disparity in FL and HWB among households. To evaluate the role of FL in promoting HWB.
Research Questions
What is the status of FL and HWB among households?
Is there any rural–urban disparity in FL and HWB?
What is the role of FL in promoting HWB?
Research Methodology
A multi-stage sampling method is employed to gather data from respondents using a structured schedule. Data have been collected through personal interviews, taking into account the low levels of education among the targeted respondents. Sample households are selected through a multi-stage random sampling method to analyse the impact of FL on HWB among rural households in Barak Valley, Assam. The first stage randomly selected five blocks (Barjalenga, Kalain, Katigorah, Silchar and Udharbond) from the Cachar district. In the second stage, one village was randomly chosen from each block. Finally, in the third stage, we interviewed 25 households from each selected village using simple random sampling, totalling 125 responses. Interviews are conducted with one adult member, the head of the household.
The study attempted to measure FL encompassing four dimensions general financial matter (GFM), digital financial apps (DFAs), savings and investment (SI) and banking aspect (BA). Similarly, to measure HWB, we have considered the four important dimensions of human well-being: water, sanitation and hygiene (WASH), education, health and wealth. The survey consists of 52 questions. The demographics section obtained standard information such as age, gender, education, marital status, monthly household expenditure, income and savings, occupation, family size, family type, number of earning members, BPL/APL, caste and religion. The survey also asks respondents if they have mobile phones with internet access, have any social media accounts, and face any difficulty reaching banks for banking transactions. The survey included questions that asked households to self-assess their financial knowledge using a binary response mode. The survey covers rural and urban areas in the Cachar district of Assam. The survey was administered to 125 households, of which 57 were from rural areas and 68 were from urban areas.
To measure the composite FL index (CFLI), we first assessed the different sub-dimensions of FL using percentage present scores (PPS), which represents the proportion of positive answers to the number of financial knowledge questions. We calculated the PPS separately for four key dimensions of FL: GFM, DFAs, SI and BA.
GFM = (Total number of positive responses/Total number of questions) – 1 [0 ≤ GFM ≤ 1]
DFA = (Total number of positive responses/Total number of questions) – 2 [0 ≤ DFA ≤ 1]
SI = (Total number of positive responses/Total number of questions) – 3 [0 ≤ SI ≤ 1]
BA = (Total number of positive responses/Total number of questions) – 4 [0 ≤ BA ≤ 1]
Finally, we computed the CFLI, taking equal weight from each dimension (i.e., GFM, DFA, SI and BA), comprehensively measuring the respondents’ FL levels.
CFLI = ¼ (GFM + DFA + SI + BA) – 5 [0 ≤ CFLI ≤ 1]
The HWB presents the overall standard of living. To compute the HWB index (HWBI), we first assessed the PPS, representing the proportion of positive responses related to four key dimensions of HWB: WASH, educational quality (EDUQ), HLT and WLT.
WASH = (Total number of positive responses/Total number of questions) – 6 [0 ≤ WASH ≤ 1]
EDUQ = (Total number of positive responses/Total number of questions) – 7 [0 ≤ EDU ≤ 1]
HLT = (Total number of positive responses/Total number of questions) – 8 [0 ≤ HLT ≤ 1]
WLT = (Total number of positive responses/Total number of questions) – 9 [0 ≤ WLT ≤ 1]
Finally, we computed HWBI taking equal weight from each dimension, that is, WASH services (WASH), EDUQ, HLT and WLT, providing a comprehensive understanding of the respondents’ overall well-being and the factors contributing to it.
HWBI = ¼ (WASH + EDU + Health + Wealth) – 10 [0 ≤ HWBI ≤ 1]

Two sample t-tests are used to identify the rural–urban disparities in FL and HWB. Further, following the study of Debnath and Paul (2024), we used a logistic-transformed linear regression model, considering the HWBI as the response variable and five explanatory variables CFLI EDUQ, social media use (SMU), internet use (IU) and INC. This statistical analysis aimed to identify the relationship between the response variable and exploratory variables and to determine the degree to which the independent variables accounted for the variance in the dependent variable. The logistic transformation allowed for modelling a binary outcome variable, making it possible to estimate the probability of an event occurring based on the values of the independent variables. The response variable in the regression model is the HWBI, calculated based on four dimensions (health, wealth, education and WASH), and the index value lies between 0 and 1. The 0 value represents the worst and 1 represents the best. Therefore, the linear regression model cannot be applied since the response variable is non-linear. So, we have transformed the response variable into a logistic form in Ln [HWBI/(1 – HWBI)]. Out of five exploratory variables, two variables, such as internet and SMU, are dummy values where we have assigned ‘1’ use of social media and internet and ‘0’ otherwise.
The following regression equation has been used to assess the impact of regressor variables on outcome variables:

where HWBI = Household Well-being Index; CFLI = Composite Financial Literacy Index; EDU = Education; SMU = Social media use; IU = Internet use; INC = Income.
Findings and Discussion
This chapter presents the findings and results of the data collected during the survey. The analysis is discussed in relation to the research questions. The respondents were interviewed face-to-face to collect the required information to complete the schedule, and the following conclusions were drawn.
Respondents’ Profile.
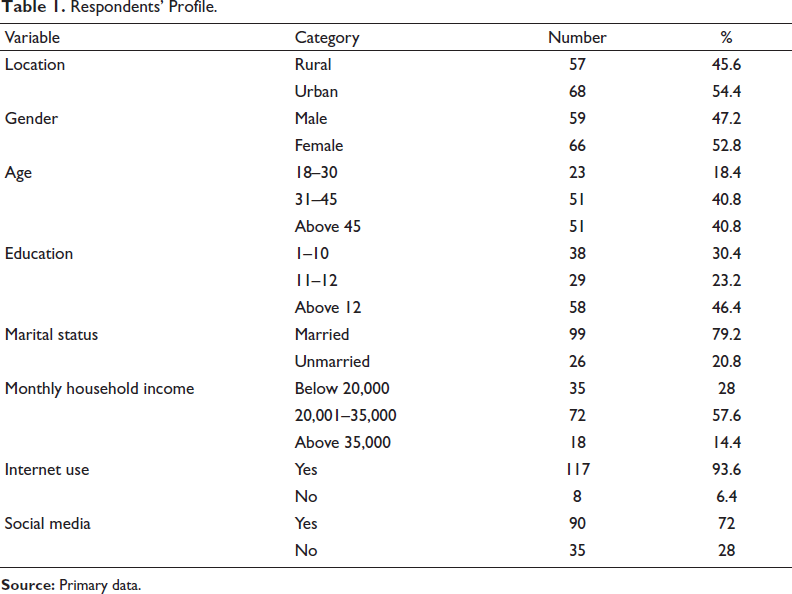
Table 1 data offers an insightful look into the socio-demographic profile of people in the Cachar district categorised across various factors. In terms of location, 54.4% of the respondents reside in urban areas, while 45.6% are from rural regions. Gender distribution is fairly even, with females constituting 52.8% and males accounting for 47.2%. Regarding age, most respondents fall within the 31–45 age group (40.8%) and above 45 age group (40.8%), while younger individuals aged 18–30 make up 18.4%. In terms of education, nearly half (46.4%) of the respondents have education levels above grade 12, while 30.4% have completed grades 1–10, and 23.2% have education levels between grades 11 and 12. Marital status indicates that most respondents are married (79.2%), with a smaller proportion (20.8%) unmarried. The monthly household income distribution shows that the majority (57.6%) earn between 20,001 and 35,000, 28% earn below 20,000, and 14.4% earn above 35,000. Notably, mobile phones with internet usage are extremely high, with 93.6% of respondents reporting IU, while 6.4% do not use mobile phones with internet access. Similarly, 72% of respondents use social media platforms, while 28% do not. These findings suggest that despite moderate INCs and educational qualifications, digital adoption remains limited among the respondents.
Descriptive Statistics of Composite Financial Literacy Index (CFLI) and Household Well-being Index (HWBI).
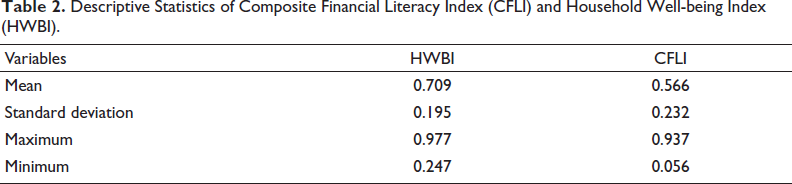
Table 2 summarises the descriptive statistics for the HWBI and the CFLI, revealing key insights for the study. The average HWBI is 0.709, with CFLI being 0.566, suggesting moderate FL and relatively high HWB. The standard deviation of HWBI is 0.195, and CFI is 0.232. The maximum and minimum values for HWBI are 0.977 and 0.247, while those for CFLI are 0.937 and 0.056, respectively. These statistics highlight the central tendencies and variability of the two indices.
Households Distribution Based on Composite Financial Literacy Index (CFLI) and Household Well-being Index (HWBI).
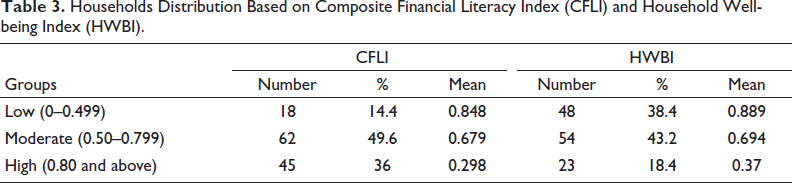
Table 3 presents the distribution of households based on the CFLI and the HWBI across three categories: low, moderate and high. For CFLI, 14.4% of households fall into the low category with a mean score of 0.848, 49.6% in the moderate category with a mean score of 0.679, and 36% in the high category with a mean score of 0.298. For HWBI, 38.4% of households are in the low category with a mean score of 0.889, 43.2% in the moderate category with a mean score of 0.694, and 18.4% in the high category with a mean score of 0.370. This distribution reveals that most households have moderate FL and well-being, with fewer achieving high scores in either index. The results highlight potential disparities in FL and well-being, suggesting that improving FL may enhance HWB, especially for those in lower categories.
Two-sample t-test for Composite Financial Literacy Index (CFLI) by Gender.
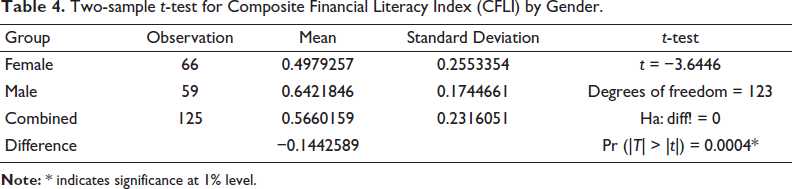
Table 4 compares the FL scores between male-headed households and female-headed households. The overall combined mean was 0.5660, with a standard deviation of 0.2316. Among the 66 female-headed households, the average FL score was 0.4979, with a standard deviation of 0.2553. In contrast, the 59 male-headed households had a higher average score of 0.6422 and a lower standard deviation of 0.1745. The difference in average scores between male-headed and female-headed households was calculated to be −0.1443.
A t-test was performed to assess the statistical significance of this difference, yielding a t-value of −3.6446 with 123 degrees of freedom. The corresponding p value was .0004, far below the standard threshold of 0.05. This result confirms that the difference in FL scores between male-headed and female-headed households is statistically significant, with male-headed households demonstrating higher FL on average.
Two-sample t-test for Composite Financial Literacy Index (CFLI) by Marital Status.
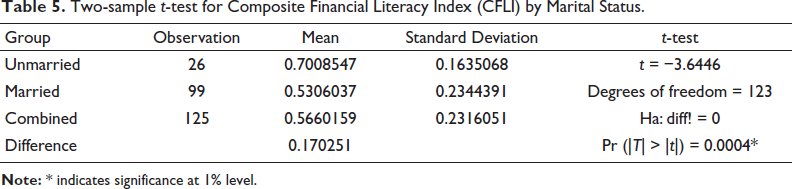
Table 5 examines the difference in FL scores between unmarried and married respondents. The overall combined mean of FL score was 0.5660, with a standard deviation of 0.2316. Among the 26 unmarried participants, the average FL score was 0.7009, with a standard deviation of 0.1635. Meanwhile, the 99 married participants had a lower average score of 0.5306, with a standard deviation of 0.2344. The calculated difference in mean scores between unmarried and married respondents was 0.1703. A t-test was conducted to evaluate the statistical significance of this difference. The test produced a t-value of −3.6446 with 123 degrees of freedom; the corresponding p value was .0004. Since the p value is far below the conventional threshold of 0.05, the null hypothesis is rejected—that there is no difference in FL scores between unmarried and married individuals. This indicates that the observed difference in scores is statistically significant, with unmarried respondents demonstrating an average higher level of FL than married respondents.
Two-sample t-test for Household Well-being Index (HWBI) by Gender.
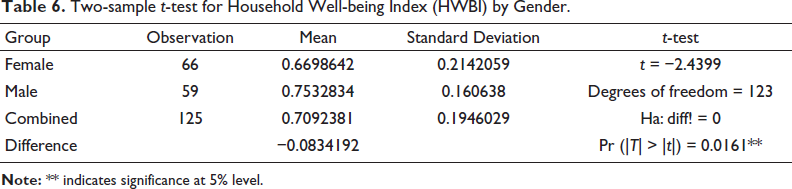
Table 6 investigates the difference in FL scores between male and female-headed households. The overall mean FL score was 0.7092, with a standard deviation of 0.1946. Among the 66 female-headed households, the average FL score was 0.6699, with a standard deviation of 0.2142. In contrast, the 59 male-headed households had a higher average score of 0.7533, with a smaller standard deviation of 0.1606. The difference in mean scores between male and female-headed households was calculated as −0.0834.
A t-test was conducted to determine whether this difference was statistically significant. The test yielded a t-value of −2.4399 with 123 degrees of freedom and a p value of .0161.
Since the p value is less than the standard significance threshold of 0.05, the null hypothesis of no difference in FL scores between male-headed and female-headed households is rejected. This indicates that the observed difference in FL scores is statistically significant, with male-headed households having higher average scores than female-headed households.
Table 7 examines the difference in FL scores between unmarried and married respondents. When combining both groups, the overall mean FL score was 0.7092, with a standard deviation of 0.1946. Among the 26 unmarried participants, the average FL score was 0.7859, with a standard deviation of 0.1272. The average score for the 99 married participants was 0.6891, with a higher standard deviation of 0.2045. The difference in mean scores between unmarried and married respondents was calculated as 0.0968, meaning unmarried individuals scored, on average, 0.0968 points higher than married individuals.
Two-sample t-test Household Well-being Index (HWBI) by Marital Status.
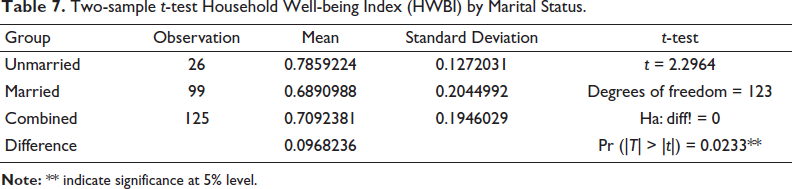
A t-test was performed to assess the statistical significance of this difference, yielding a t-value of 2.2964 with 123 degrees of freedom and a p value of .0233.
Since the p value is below the standard significance level of 0.05, the null hypothesis is rejected—that there is no difference in FL scores between unmarried and married individuals. This result indicates that the observed difference in FL scores is statistically significant, with unmarried respondents showing higher FL on average compared to their married counterparts.
Two-sample t-test for Composite Financial Literacy Index (CFLI) by Rural–Urban.
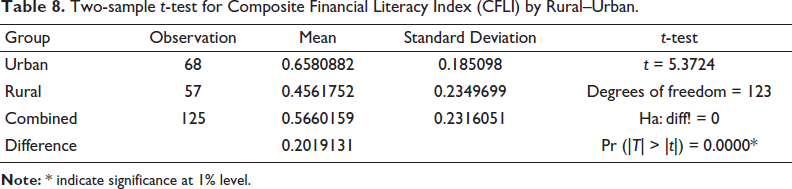
Table 8 evaluates the difference in FL scores between urban and rural respondents. The overall mean FL score was 0.5660, with a standard deviation of 0.2316. Among the 68 urban participants, the average FL score was 0.6581, with a standard deviation of 0.1851. In contrast, the 57 rural participants had a lower average score of 0.4562, with a standard deviation of 0.2350. The calculated difference in mean scores between urban and rural respondents was 0.2019. A t-test was conducted to determine the statistical significance of this difference. The test yielded a t-value of 5.3724 with 123 degrees of freedom and a p value of .0000.
Since the p value is significantly smaller than the standard threshold of 0.05, the null hypothesis is rejected—that there is no difference in FL scores between urban and rural respondents. This result indicates that the observed difference in FL scores is statistically significant, with urban respondents demonstrating significantly higher FL on average than rural respondents.
Two-sample t-test for Household Well-being Index (HWBI) by Rural–Urban.
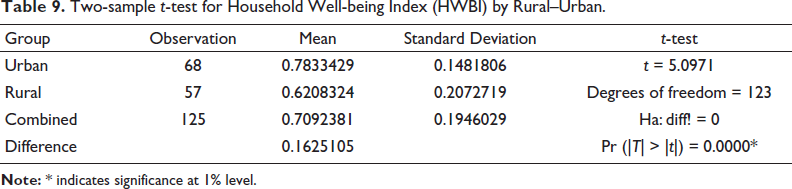
Table 9 compares FL scores between urban and rural respondents. The overall mean FL score was 0.7092, with a standard deviation of 0.1946. Among the 68 urban participants, the average FL score was 0.7833, with a standard deviation of 0.1482. Meanwhile, the 57 rural participants had a lower average score of 0.6208, with a higher standard deviation of 0.2073. The difference in mean scores between urban and rural respondents was calculated as 0.1625.
A t-test was performed to assess the statistical significance of this difference, yielding a t-value of 5.0971 with 123 degrees of freedom and a p value of .0000.
Since the p value is far below the standard threshold of 0.05, the null hypothesis is rejected—that there is no difference in FL scores between urban and rural respondents. This indicates that the difference in scores is highly statistically significant, with urban respondents showing significantly higher FL on average compared to their rural counterparts.
Regression Result.
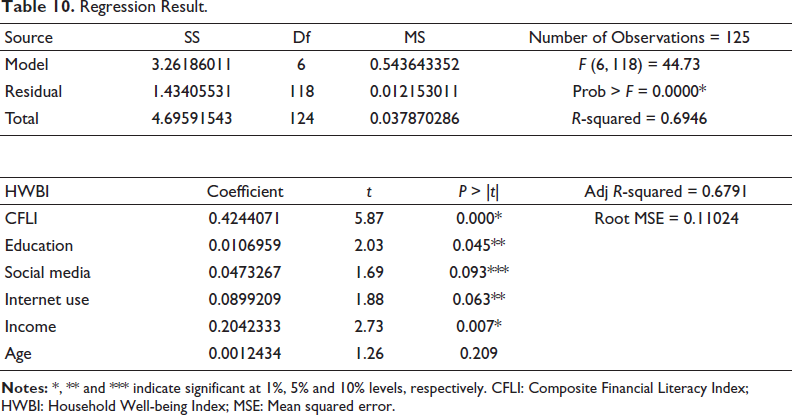
Table 10 presents the regression analysis result, which investigates the relationship of FL on HWB, while accounting for other socio-economic variables such as age, education, income, mobile phone with internet and social media. The adjusted R-squared value (0.6946) indicates that approximately 69.46% of the variability in the HWBI is jointly explained by the explanatory variables, and the model’s F-statistic (44.73) and its p value (.0000) reflects a good model fit. The CFLI significantly contributes to HWB, with a coefficient of 0.4244 and a highly significant p value (.000). Among the other socio-economic variables, education (p = .045) and income (p = .007) also show significant positive effects on HWBI. Age is not statistically significant at any conventional level (e.g., 0.05, 0.01), with p value = .209. Internet usage (p = .063) and social media (p = .093) significantly positively affect HWBI at a 10% conventional level. The model’s F-statistic (44.73) and p value (.0000) confirm the overall statistical significance of the regression, demonstrating that FL plays a critical role in shaping HWB.
Variance Inflation Factor (VIF) and Breusch–Pagan Test Result.
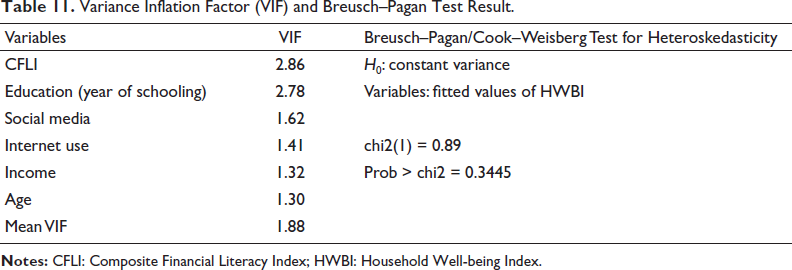
Table 11 summarises the results of the multicollinearity and heteroskedasticity test as diagnostics test in a regression model. The variance inflation factor (VIF) values indicate the degree of multicollinearity among the independent variables. All variables have VIFs below the critical threshold of 10, with the highest VIF being 2.86 for CFLI and a mean VIF of 1.88. This suggests that multicollinearity is not a significant concern in the model.
The Breusch–Pagan/Cook–Weisberg test for heteroskedasticity tests the null hypothesis (H0) of constant variance in the residuals. The test yields a chi-squared value of 0.89 and a p value of .3445, greater than the standard significance level (e.g., 0.05). Therefore, we fail to reject the null hypothesis, indicating that heteroskedasticity is absent in the data.
Conclusion
FL significantly enhances financial understanding, access to services, and management skills, leading to better financial outcomes. However, few studies explore the rural–urban divide and how unique challenges in these areas affect FL and HWB. Research highlights the need for tailored financial education, expanded access to financial services, and digital tools to reduce disparities. Rural areas face systemic barriers that delay visible benefits, and long-term impacts on HWB are often overlooked.
This study aimed to evaluate the status of FL and HWB, examine the disparities in FL and HWB between rural and urban households, and analyse the impact of FL on HWB. The study aimed to assess four dimensions of FL: GFMs, DFAs, SI and BAs. Similarly, HWB was evaluated across four dimensions: WASH, education, health and wealth. Data were collected through a convenience sampling method using a structured questionnaire and personal interviews. The survey included binary-response questions where households self-assessed their financial knowledge. It covered rural and urban areas within the Cachar district of Assam and was conducted among 125 households. To calculate the CFLI and the HWBI, the PPS were used, representing the proportion of positive answers to the number of financial knowledge questions. Further, a two-sample t-test is employed to examine the disparities in FL between rural and urban areas. Additionally, a regression analysis is conducted to evaluate the influence of FL on HWB.
The findings reveal that urban households demonstrate significantly higher levels of FL and HWB compared to their rural counterparts. Additionally, the study highlights heterogeneity in FL based on gender and marital status. Notably, the results confirm that FL significantly impacts HWB among the surveyed households. The findings further indicate that demographic variables such as education, income, internet-enabled mobile phones and social media positively impact HWB, highlighting the interconnectedness of socio-economic factors in driving HWB.
Adopting targeted and inclusive approaches to enhance FL in rural and urban areas is crucial. In rural regions, community-driven initiatives, collaborations with non-governmental organisations (NGOs), and local advocacy efforts can promote financial awareness while addressing challenges related to digital access through affordable internet and smartphone programmes, which is vital. For urban areas, digital platforms, workplace-based initiatives and financial education in schools can significantly contribute to progress. Integrating FL into formal education, utilising media campaigns and providing training on digital financial tools are critical for achieving sustainable outcomes in both settings.
Suggestions
Tailored interventions are crucial for improving FL in rural and urban areas. Community programmes are vital in rural regions, where financial education access is limited. Workshops through schools, community centres or self-help groups enhance awareness. Additionally, partnerships with microfinance institutions and NGOs can improve access to formal financial services. Digital platforms can effectively deliver smooth financial services in urban areas. Mobile applications and online courses focusing on FL can cater to the tech-savvy population. Initiatives like FL drives in schools and colleges can encourage good financial habits at a young age. Collaborating with banks and fintech companies to provide accessible and user-friendly digital financial tools is also crucial.
Incorporating financial education into the formal education system can ensure long-term, sustainable improvement in FL in rural and urban areas. Schools and colleges can introduce curriculum modules on savings, investments, budgeting and digital financial services. Regular awareness campaigns through media channels, such as television, radio and social media, can further reinforce FL messages.
To address the challenges of digital access and inclusion, efforts should be made to provide affordable internet and smartphones, particularly in underserved rural regions. Training programmes on DFAs and platforms can empower individuals to access and utilise financial services effectively. For marginalised groups, such as women and low-income families, targeted programmes and incentives can help reduce disparities in FL and improve overall HWB.
Finally, monitoring and evaluation of FL programmes are critical to measure their effectiveness and adapt strategies based on outcomes. Policymakers, financial institutions and community organisations should work collectively to ensure that FL programmes are inclusive, accessible and aligned with the socio-economic realities of diverse populations. By addressing these areas, FL levels can be significantly enhanced, contributing to better financial management and improved well-being for households across rural and urban settings.
This study has several limitations that should be acknowledged. Potential issues with the sampling method and measurement errors could affect the accuracy and generalisability of the results. Moreover, the cross-sectional design and dependence on self-reported data may restrict the study’s ability to examine dynamic relationships or establish causal connections. The emphasis on rural-urban disparities may also overlook cultural and contextual factors influencing FL and HWB. These limitations underscore the need for future research to validate and build upon the study’s conclusions.
Footnotes
Declaration of Conflicting Interests
The authors declared no potential conflicts of interest with respect to the research, authorship and/or publication of this article.
Funding
The authors received no financial support for the research, authorship and/or publication of this article.