
Abstract
The study aims to explore how to measure firms’ open innovation from financial statements. So, our research question is as follows: How can we determine firms’ open innovation signals directly or indirectly from financial statements? This study used data from the US financial statements and patent registration database from 2016 to 2018 to answer this research question. Three manifest signals of open innovation in financial data were found. First, subsidiary or related firm investment in financial data may have a negative relationship with open innovation because open innovation (i.e., the co-application of patents) could decrease subsidiary or related firm investment. But there are differences between the top and bottom twenty firms. Second, internal R&D investment (I R&D) in financial data may have a positive relationship with open innovation because I R&D could trigger inward open innovation. If I R&D combines with an open innovation strategy, it increases the size of subsidiary or related firm investment as a kind of inward open innovation. Third, free cash flow (FCF) in financial data may have a positive relationship with open innovation because high FCF could support outward open innovation.
Keywords
Introduction
Research Aim and Novelty of This Study
Many studies have been measuring firms’ open innovation by calculating open innovation depth and breadth using survey results based on the Frascati manual (Laursen & Salter, 2006). Until now, one of the most popular basic topics in open innovation research is to measure open innovation easily and objectively (Davila et al., 2012). However, the way to measure open innovation by survey requires a lot of research funds and time to obtain enough survey results.
Another representative method to measure open innovation is to calculate it from the perspective of interorganisational knowledge flows (Chiang & Hung, 2010). An example of this is to measure open innovation from the collaboration patent ratio of firms, or by averaging the co-application numbers of patents by firms (Yun et al., 2014). Like this, open innovation can be measured by using the intellectual capital flow from exogenous inflows and outflows (Michelino et al., 2014). Even though patent-based measuring of open innovation is more objective than the survey-based method, it has other limits as follows: (a) patent-based open innovation measures could not be applied to firms that do not have enough patents and (b) the patent amounts and quality of any firm are not always close to the market situations of the firms (Remneland-Wikhamn & Wikhamn, 2011).
By the way, open innovation dimensions and indicators like innovation funds, open innovation employees, collaboration costs, collaboration revenue, importing costs and exporting revenue suggest a high relationship between financial statement data and open innovation levels (Lamberti et al., 2017). However, financial statements have not been used to guide decision-making on diverse firm strategies like open innovation (Carraher & Van Auken, 2013).
There are big research gaps between the requirement of open innovation measures and the methods that are being used to measure open innovation currently, even though the requirement of open innovation measurement research is increasing in digital transformation. First, a survey-based open innovation measure is the most popular way; it requires a lot of research funds and a long time from the survey to calculate the open innovation level of firms. Second, though patent-based open innovation measures could be used without too much research funding and so long time to measure, they have limits in applying to firms because firms may not have enough patents that could be used to measure. Third, even though financial statement data has a lot of information on open innovation measures, research on measuring open innovation through financial data has nearly never been utilised until now.
This research proposes the following research question to fill up the research gaps:
How can we find out firms’ open innovation signals directly or indirectly from financial statements?
This research question has the focal point of measuring several aspects of open innovation, like the quantitative level or the qualitative content of open innovation at the target firm from the financial statement, which is totally different from existing literature. The novelty of this research is to find out the way to measure several aspects of open innovation from financial data, which does not require additional research funds to obtain; in addition, most firms announce and publish it every year. Thus, the financial statements could be approached freely and easily to measure open innovation.
Data Source and Boundary
First, we collected the 2016–2018 financial statement data of the top 1,164 US firms, including yearly internal R&D investment (I R&D), total sales, free cash flow (FCF), subsidiary or related firm investment (SRI) and so on, from the Wharton Research Data Services database on 7 November 2022.
Second, we collected open innovation-related patent data, including the total number of patents, co-applicant patents and total applicants’ for each firm per year (2016–2018). In this step, we accessed the Korea Institute of Science and Technology Information (KISTI) Patent Search database (
From these two steps, we selected 512 US case firms from 2016 to 2018 with the highest total sales per year. We began this study in December 2021. At the time, the completed data from financial statements and patent registrations were from 2018; thus, we used the preceding three years of data.
Literature Review and Research Framework
Literature Review
Patent Open Innovation Measures
Intellectual property plays a core role in open innovation, even though the determinants of successful tradable patents still must be identified due to the minimal reporting of patent transactions, which are also highly idiosyncratic (Gassmann et al., 2010). Using patent citation information, the knowledge flow between technology fields and firms is identified because the patent citation structure shows open innovation patterns such as inbound, outbound or coupled (Suh & Jeon, 2019).
In addition, firms’ open innovation can be measured using the depth and breadth of joint patent applications (Yun et al., 2014, 2016). During the organisational change process from closed to open innovation, knowledge management systems shift from filing patents that leverage existing knowledge within a firm to assessing patenting activities, which will eventually be explicitly included in a firm’s strategic plan (Chiaroni et al., 2010).
In the era of open innovation, the potential of a patent for a promising technology can be assessed using three criteria: technological impact, standardisation and licencing (Noh & Lee, 2020). Firms find it more important to patent when engaged in open innovation than closed innovation (Holgersson & Granstrand, 2017). Depending on the situation, an intellectual property strategy might kill open innovation activities. Alternatively, it may make open innovation an enabler or even a builder of industrial ‘ecosystems’ (Alexy et al., 2009).
I R&D patents boost sales, profits and corporate value. However, purchased patents only have minor, immediate positive effects on market value and profit but do not increase sales. This is because they only boost short-term growth, and university–industry collaboration is necessary for mid-term and long-term growth (Lee et al., 2015).
Open Innovation Clues in Financial Statements
Calculative practices trigger the mobilisation of knowledge, which becomes part of innovation (Revellino & Mouritsen, 2015). In addition, adopting management accounting can measure and motivate innovation through compatibility and perceived outcomes (Ax & Greve, 2017). Based on the analysis, accounting in biotech innovation development shapes the linkages between scientific and economic ideas and different actors (Christner & Strömsten, 2015).
Parts of financial statement data, such as financial leverage, capital turnover, asset composition and firm size, are significant factors associated with fraudulent financial reporting (Persons, 1995). By the way, R&D expenditure in financial statements positively affects firm value and profitability (Chen et al., 2005). Measures of financial performance, such as return on assets, have an inverted U relationship with open innovation adoption (Michelino et al., 2015b). An accounting-based framework was suggested for defining open innovation adoption modalities by analysing annual reports regarding the cost, revenue and new investments and divestments in intangibles and knowledge assets related to open innovation (Michelino et al., 2015c). Furthermore, a research study on the biopharmaceutical industry measured the pecuniary dimensions of inbound and outbound open innovation processes by analysing annual reports (Michelino et al., 2015a).
Increases in profitability that occur by focusing on cost reduction and operational efficiency were the main financial aspects of a closed innovation paradigm. However, in the era of an open innovation paradigm, new factors such as the increase in profitability through new revenue streams, balancing risk and growth strategies, sustainable and profitable growth or customer profitability are appearing as the primary financial topics (Fasnacht, 2009, pp. 153–172).
Biodiversity is the total sum of all biotic variation from genes to ecosystems; similarly, open innovation can exist from the firm or industry to the regional, sectoral or national innovation system (Purvis & Hector, 2000; Yun et al., 2015).
Corporate venture capital can be used as a strategic objective, such as a tool for open innovation (Pinkow & Iversen, 2020). Customers’ attitudes towards Fintech applications during COVID-19 and the possibility of mobile money as a sustainable alternative for small-sized and medium-sized enterprises in less developed financial markets can be understood as a possible additional or transferred understanding of firms’ financial statements (Tengeh & Gahapa Talom, 2020).
Research Framework, Hypotheses, Method and Scope
First, open innovation is the independent variable in this research framework. Open innovation can be measured by the ratio of the number of co-applicant patents among the total number of patents, which represents the breadth of open innovation because it shows the width of collaboration among firms when they apply for patents (Figure 1) (Laursen & Salter, 2006).
Research Framework.
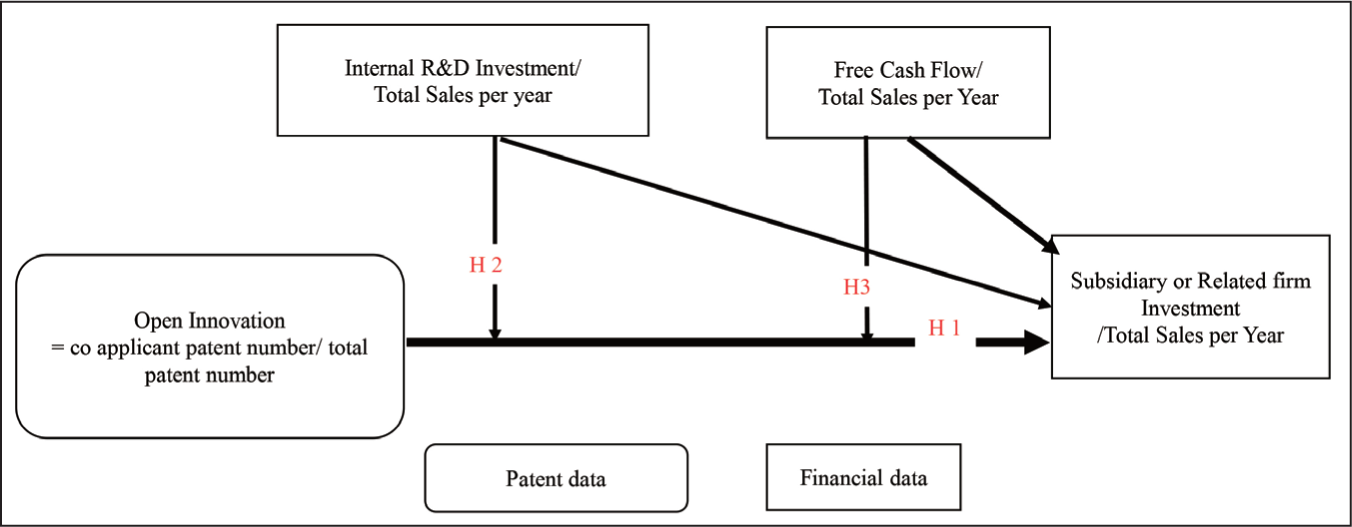
Second, the ratio of SRI among total sales per year (SRI ratio) is used as the dependent variable because it shows the internal expansion level of a firm under the business network context of financial statements (Nell & Andersson, 2012; Oh & Oetzel, 2011).
H1: Open innovation will decrease SRI.
Third, the ratio of I R&D among total sales per year (I R&D ratio) is used as the negative moderating variable between open innovation and SRI. The tension between knowledge sharing and protection in R&D collaboration exists within the open innovation paradox, with knowledge characteristics at the core and knowledge embodiment and relational dimension as mediating factors (Bogers, 2011). Thus, open innovation has important implications for new and emerging methods of R&D management (Enkel et al., 2009). For example, the open innovation strategy type (vertically integrated, inbound, outbound or coupled) is related to the R&D intensity (Schroll & Mild, 2011).
H2: I R&D negatively moderates the relationship between open innovation and SRI.
Fourth, the FCF ratio is the remaining cash flow after a firm has invested in all available net present value projects among the total sales per year. This ratio is used second and is the positive moderating variable between open innovation and SRI. The bidder’s abnormal return is negatively related to firms’ cash flow with poor investment opportunities and unrelated to firms’ cash flow with good investment opportunities (Lang et al., 1991). However, the sales growth for firms with FCF is less profitable than the growth for firms without FCF (Brush et al., 2000). Notably, FCF could incur agency costs due to perquisite consumption and shirking behaviour; however, the generation of FCF resulting from internal operating efficiency could lead to better firm performance (Wang, 2010).
H3: The FCF among the total sales per year positively moderates the relationship between open innovation and SRI.
Regarding the research method, this research is based on statistical analyses, including explanation-statistical analysis and multiple regression analysis on the relationship among independent variables, moderating variables and dependent variables. Through statistical analysis, these three hypotheses will be tested.
First, this research analyses the explanation-statistical analysis of the main valuables in the following order: (a) SRI, (b) I R&D and (c) FCF. The chronological order of this analysis is as follows: (a) the total data table and total data trend line, (b) the data tables on the top and bottom twenty firms and (c) the data trend line on the top and bottom twenty firms. The reason for selecting the top and bottom twenty firms as the target of explanation-statistical analysis is to obtain in advance information on hypotheses under the understanding of the possibility of totally different statistical trends between the top-level firms and the bottom-level firms in financial statements (Chen et al., 2018; De Franco et al., 2011; Jermakowicz, 2004).
Second, this research analyses three hypotheses on the relations among variables, such as (a) open innovation as an independent variable, (b) the per-year ratio of the subsidiary or relational firm investment among total sales as a dependent variable, (c) the per-year ratio of I R&D among total sales as a moderating variable and (d) the per-year ratio of FCF among total sales as a moderating variable.
Third, this study discusses the total understanding of the financial data as well as the open innovation level and contents.
Last, this study explores the implications, the future research targets and the limits of this research.
Descriptive Financial Data Analyses
SRI
Among all firms from 2016 to 2018, there were 512 cases characterised by patents, co-applicant patents, sales, SRI and FCF. These firms had an average of 188 patents, an average co-application patent ratio of 11.66, an average SRI of 73.57 and an average SRI ratio of 0.19, as seen in Table 1. The standard deviation (SD) of the co-applicant patents is relatively low compared to the SRI ratio; the ROI mean is 13.41, and the ROI SD is 22.42. The SRI ratio mean is 0.19, and the SRI ratio SD is 13.04 (Table 1).
ROI and the SRI Ratio.
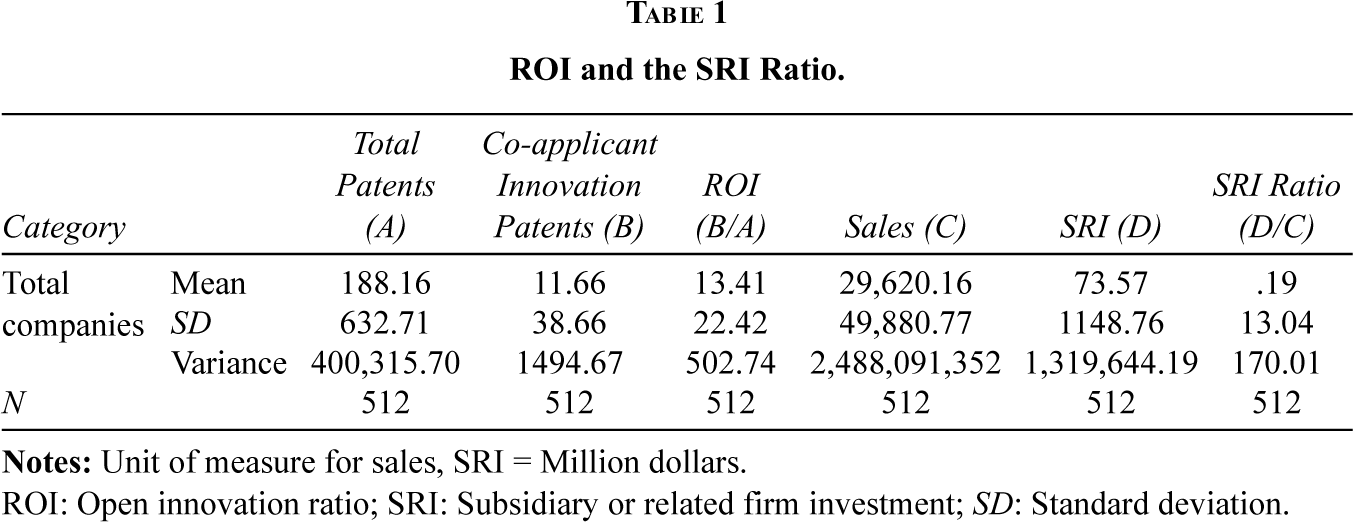
ROI: Open innovation ratio; SRI: Subsidiary or related firm investment; SD: Standard deviation.
The scatterplot of the relationship between ROI and the SRI ratio is shown in Figure 2. The trend line for the relationship between the SRI ratio and ROI is Y = 1.03 – 0.06X, as seen in Figure 2. In other words, a weak negative relationship exists between the SRI ratio and ROI.
Total Relationship Between ROI and the SRI Ratio.
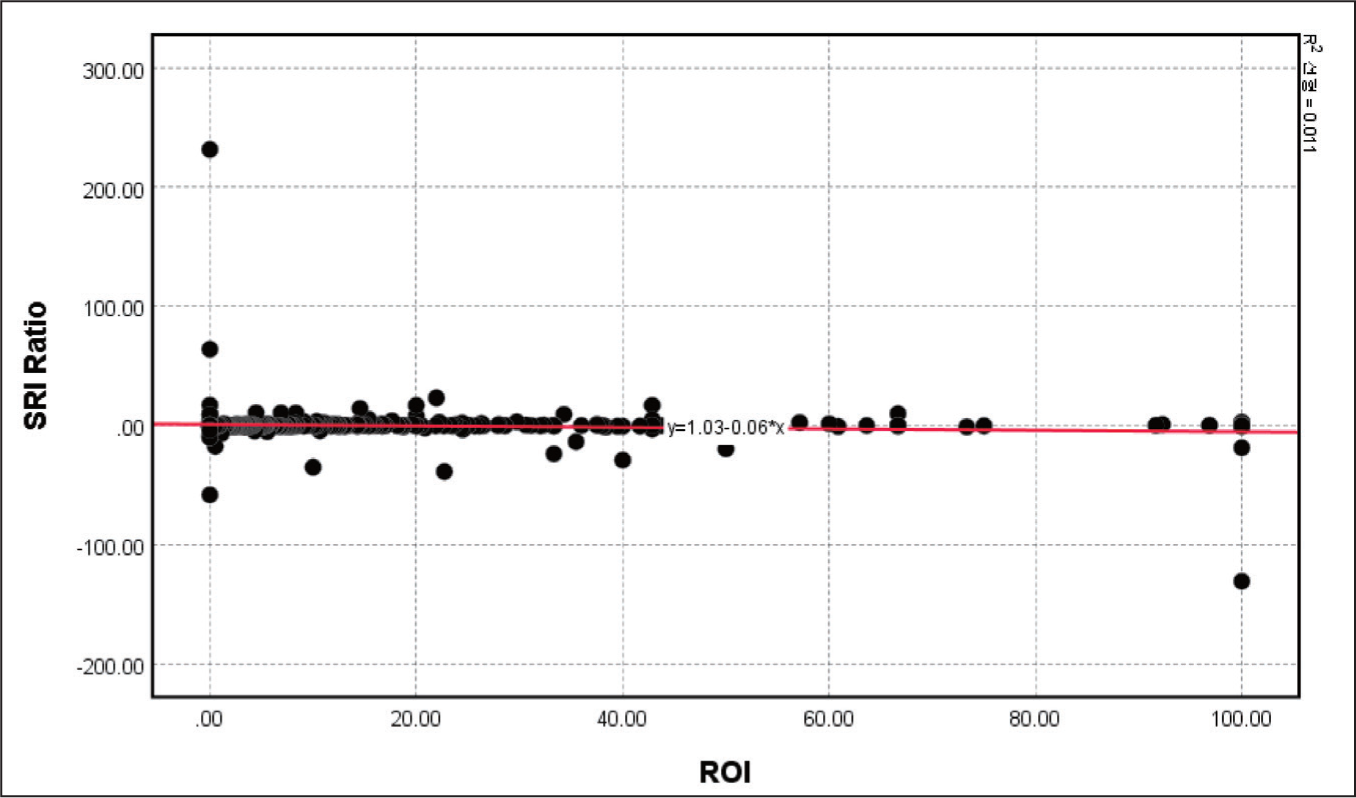
ROI: Open innovation ratio. SRI: Subsidiary or related firm investment.
The top twenty firms’ ROI is 61.47%. However, the bottom twenty firms’ ROI is zero, as seen in Table 2. The SRI ratio mean and SD of the top twenty firms are –7.68 and 1785.44, respectively, which is much higher than those of the bottom twenty firms, which are –0.11 and 4.249, respectively, at the absolute level (Table 2). In other words, there is a significant difference in ROI and the SRI ratio between the top and bottom twenty firms.
The SRI Ratio of the Top and Bottom Twenty Firms.
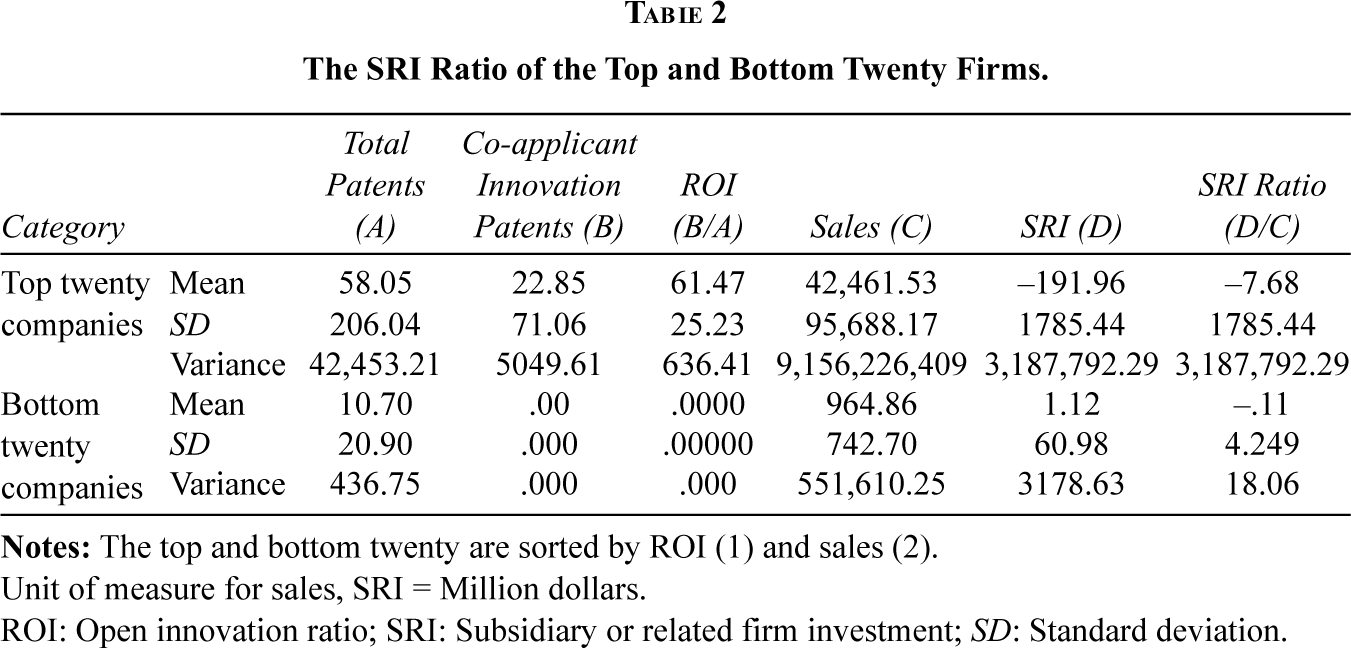
Unit of measure for sales, SRI = Million dollars.
ROI: Open innovation ratio; SRI: Subsidiary or related firm investment; SD: Standard deviation.
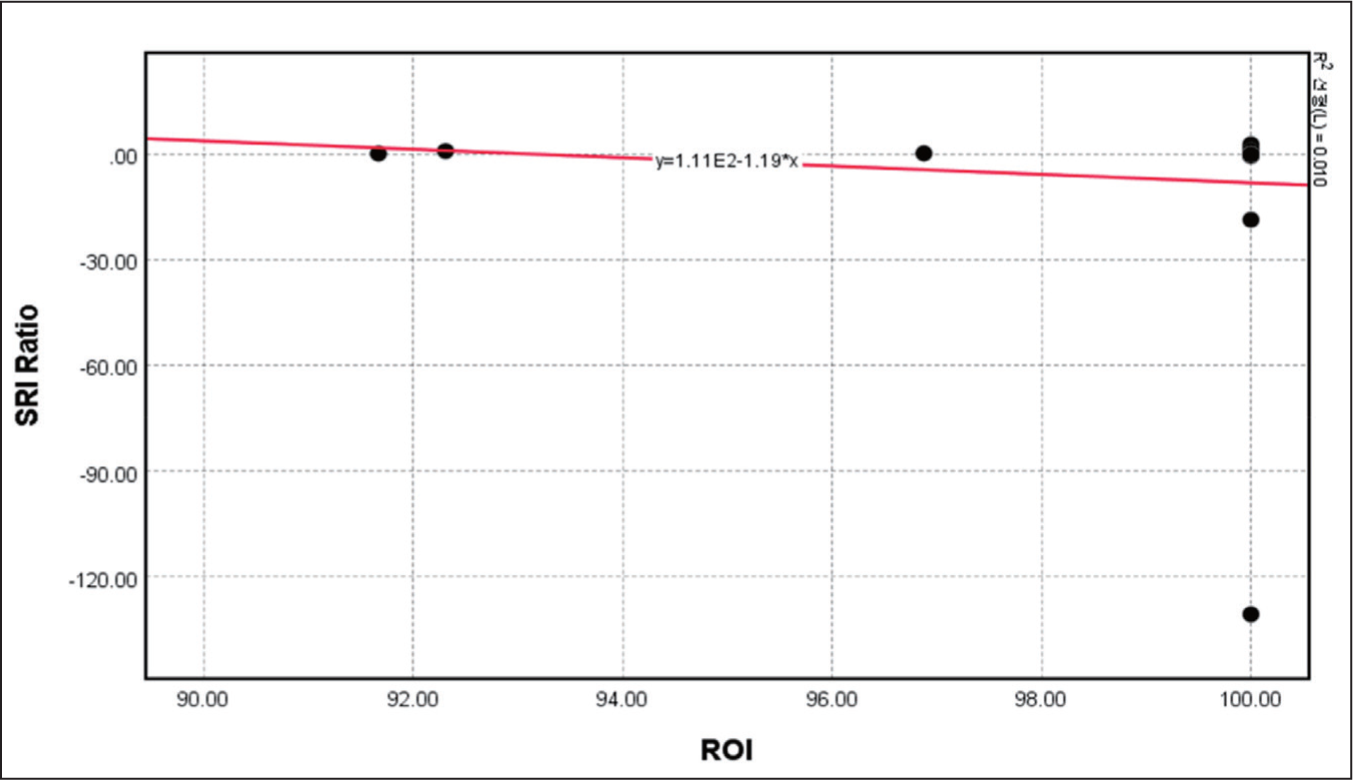
The scatterplot of the relationship between ROI and the SRI ratio of the top twenty firms is shown in Figure 3, which includes several global firms, as indicated in Appendix A. The trend line of the relationship between the SRI ratio and the ROI of the top twenty firms is Y = 1.11E2 – 1.19.X, as seen in Figure 3. In other words, there is a weak negative relationship between the SRI ratio and ROI in the top twenty firms.
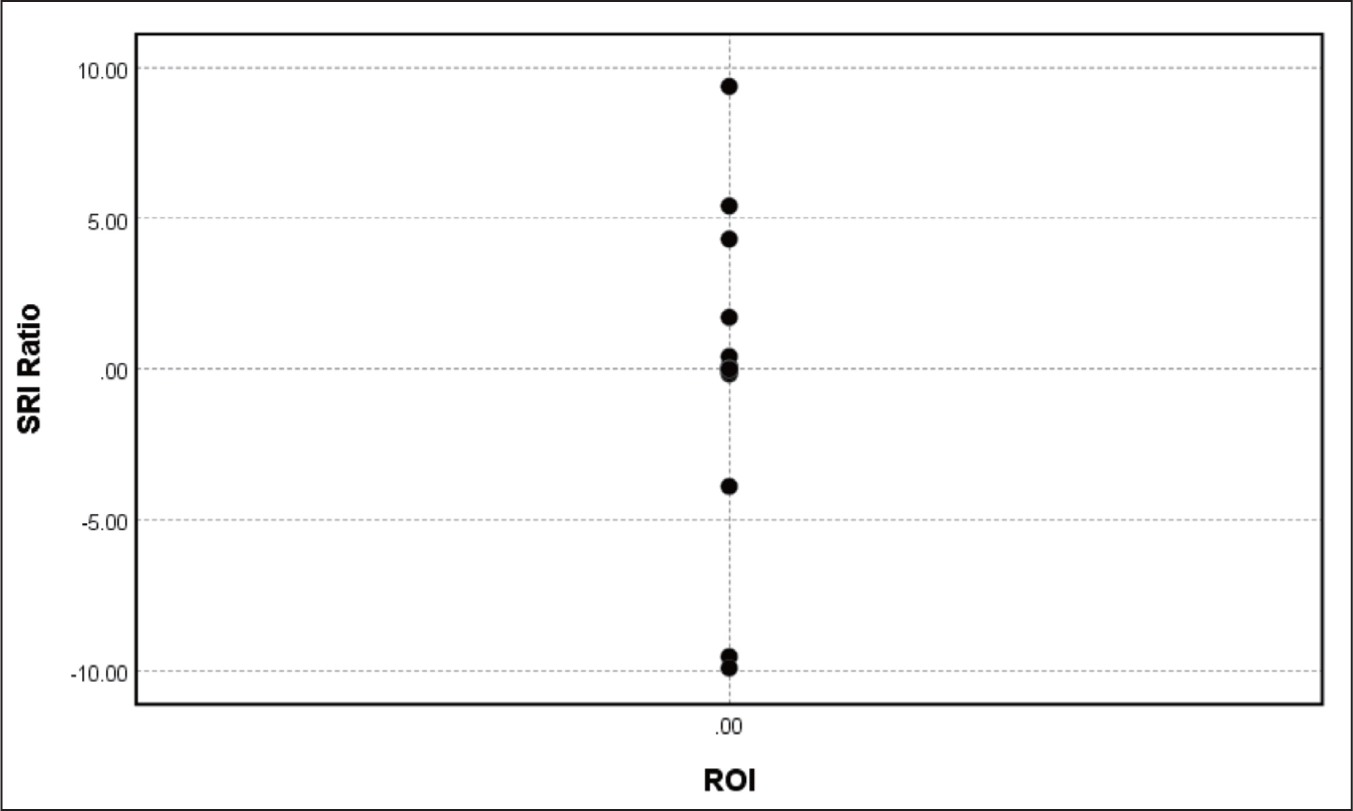
The scatterplot of the relationship between ROI and the SRI ratio of the bottom twenty firms is shown in Figure 4. We were unable to draw the trend line for the relationship between the SRI ratio and the ROI of the bottom twenty firms, which include diverse global firms, as indicated in Appendix B. In other words, there is no relationship between the SRI ratio and ROI in the bottom twenty firms.
I R&D
Regarding I R&D, the mean (29,620.16) is half the SD (49,880.77). The I R&D ratio’s SD (51.25) is 5.21 times the mean (9.82) (see Table 3). This means there are substantial differences in the I R&D ratio among firms’ per-year sales.
I R&D Ratio.
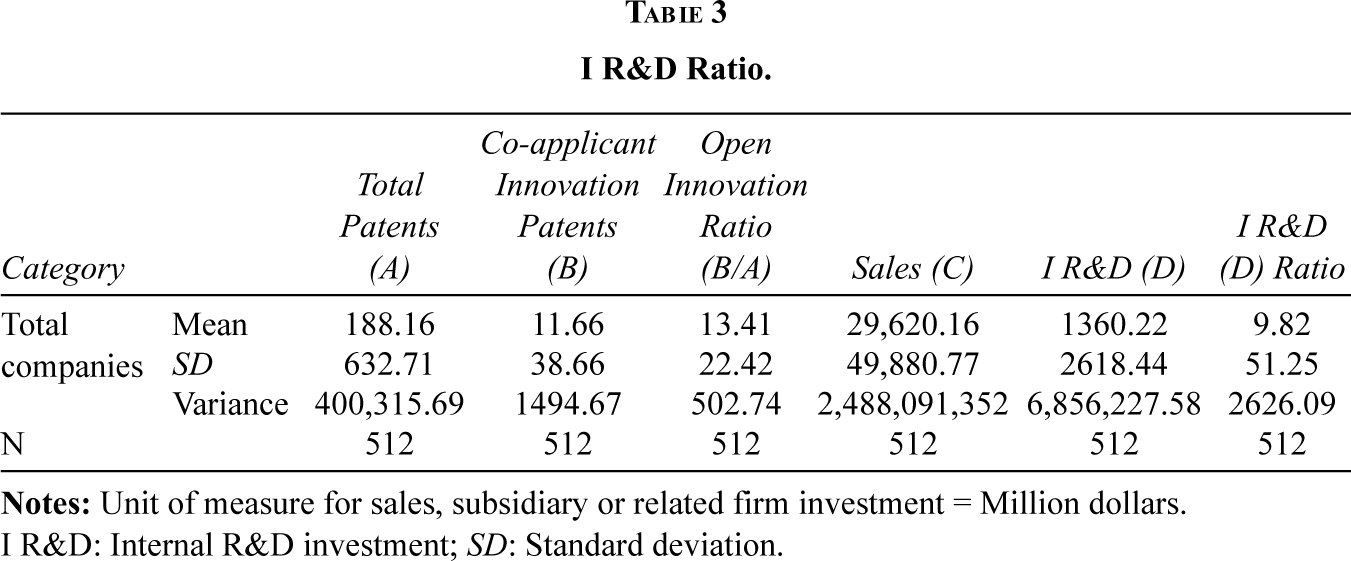
I R&D: Internal R&D investment; SD: Standard deviation.
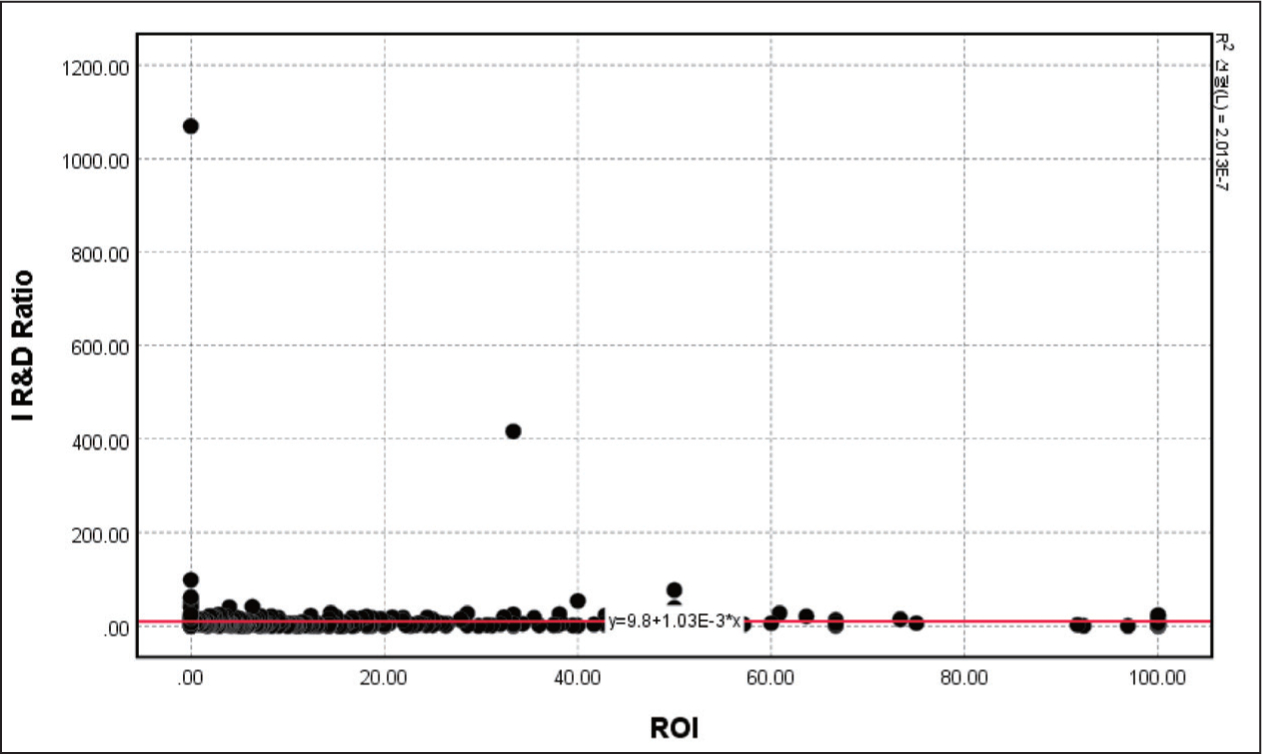
The relationship between I R&D and ROI on the scatterplot shows a very weak positive correlation, where Y = 9.8 + 1.03E – 3X, as seen in Figure 5.
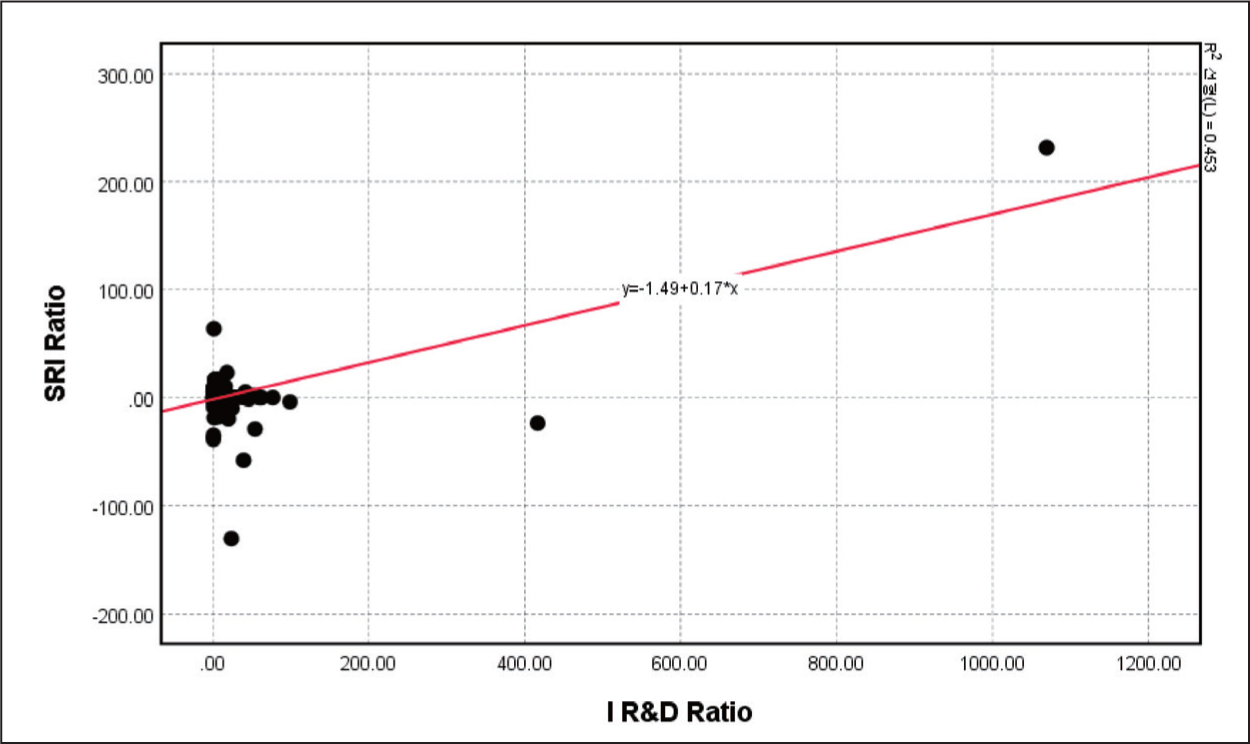
However, the relationship between I R&D and SRI on the scatterplot shows a somewhat weak positive correlation, where Y = –1.49 + 0.17X, as seen in Figure 6.
The I R&D of the top twenty firms (with a mean of 2150.59) is thirty-one times higher than the bottom twenty firms (with a mean of 87.52); however, the gap in the I R&D ratio among sales per year is less, at 1.8 times higher for the top twenty than the bottom twenty (at 29.92/16.54) (Table 4).
The I R&D Ratio of the Bottom and Top Twenty Firms.
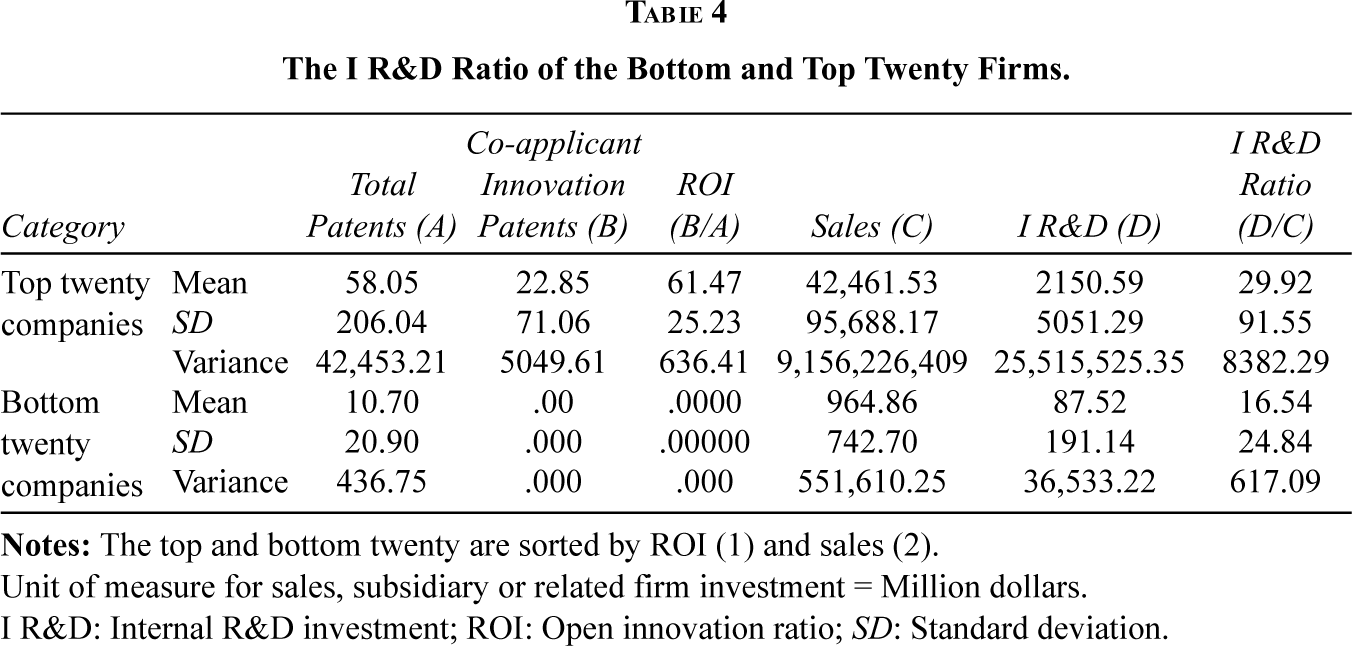
Unit of measure for sales, subsidiary or related firm investment = Million dollars.
I R&D: Internal R&D investment; ROI: Open innovation ratio; SD: Standard deviation.
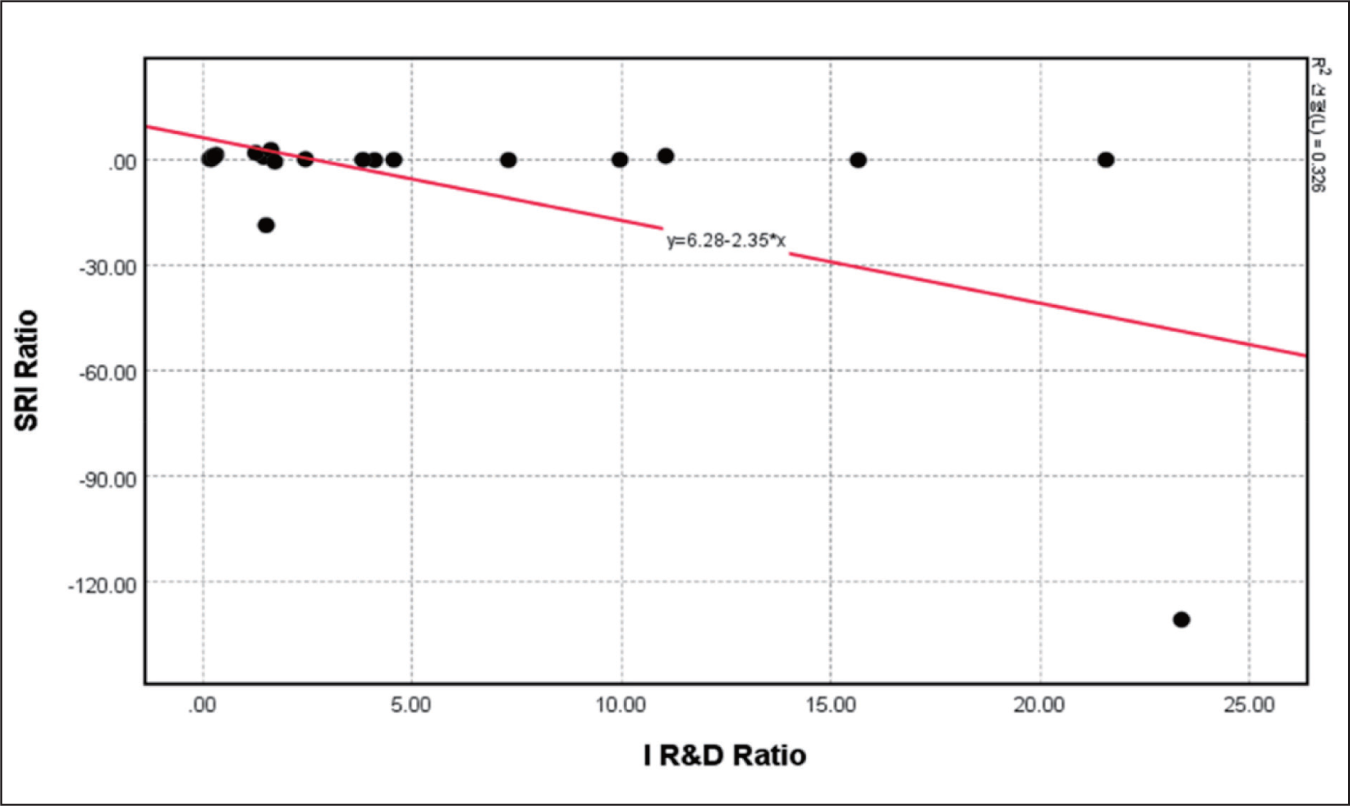
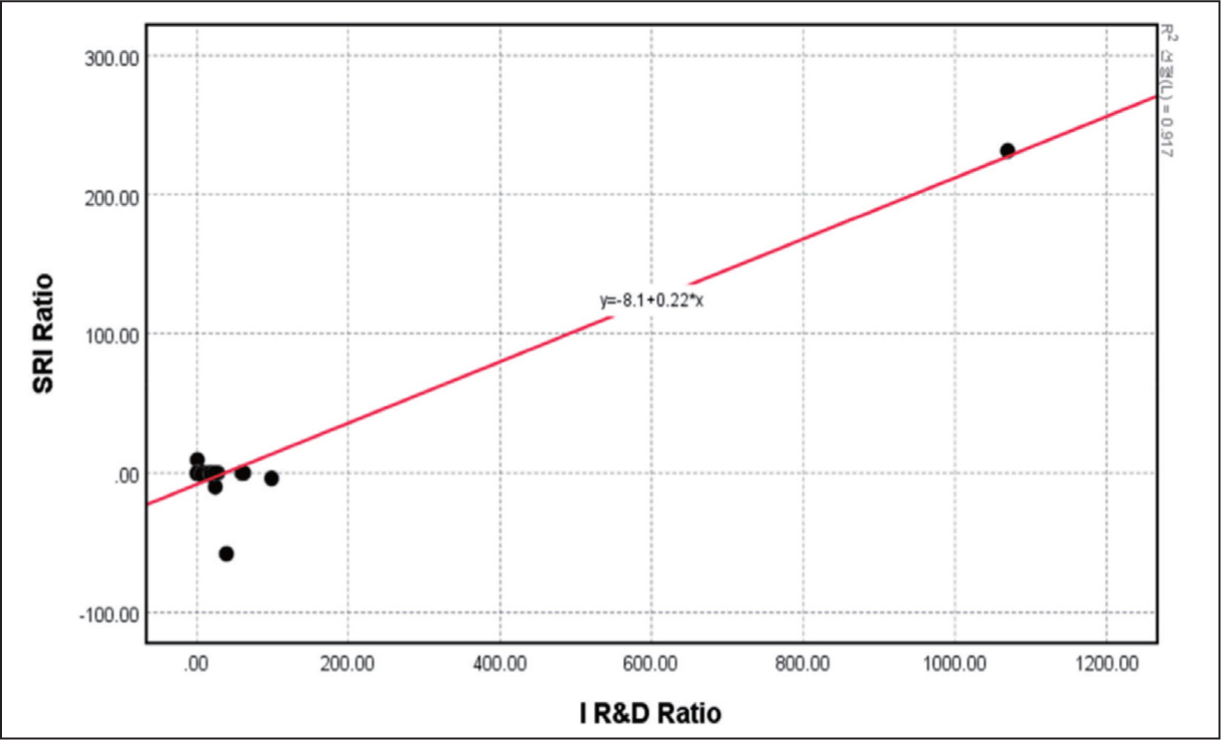
According to the scatterplot of the top twenty firms on the correlation between the SRI ratio and the I R&D ratio, a negative correlation exists, where Y = 6.28 – 2.35X, as seen in Figure 7. However, according to the scatterplot of the bottom twenty firms on the relationship between the SRI ratio and the I R&D ratio, a positive correlation exists, where Y = 8.1 + 0.22X, as seen in Figure 8. If we compare Figure 6, which shows the positive relationship between the SRI ratio and the I R&D ratio of the total firms, and Figure 7, which shows the negative relationship between the SRI ratio and the I R&D ratio of the top twenty firms, we can conclude that other than the top twenty firms, most firms have a positive relationship between the SRI ratio and the I R&D ratio.
FCF
Although the SD of the FCF (4407.44) is only 2.12 times bigger than its mean (2072.27), the SD of the FCF ratio (53.83) is 16.82 times larger than its mean (3.20) (Table 5). This means that the FCF ratios among the per-year sales are significantly diverse based on the difference in sales.
FCF.
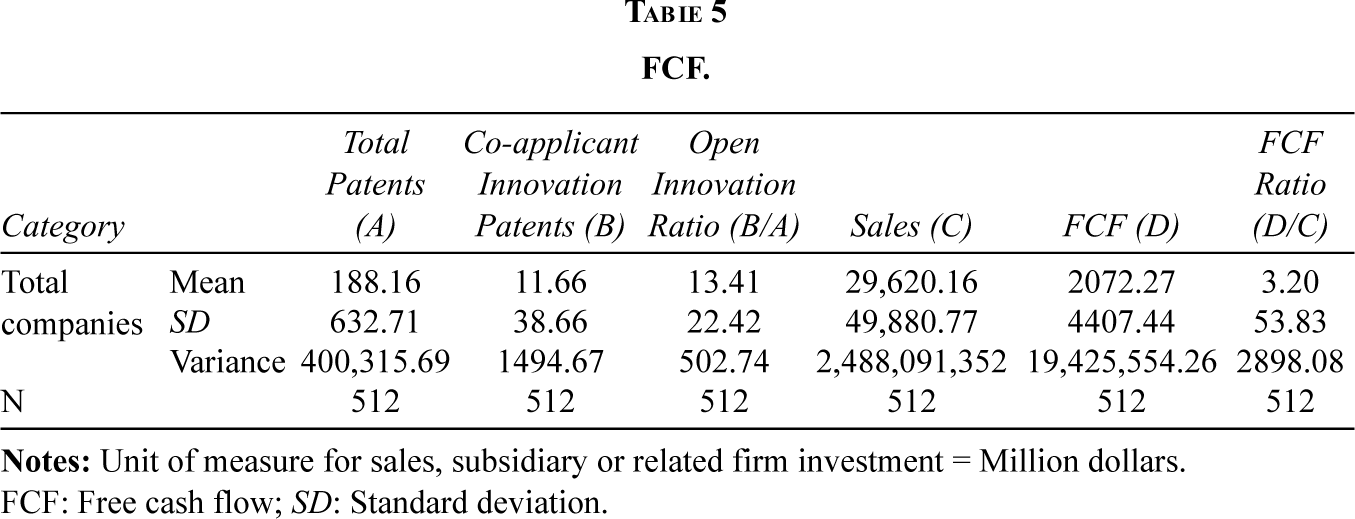
FCF: Free cash flow; SD: Standard deviation.
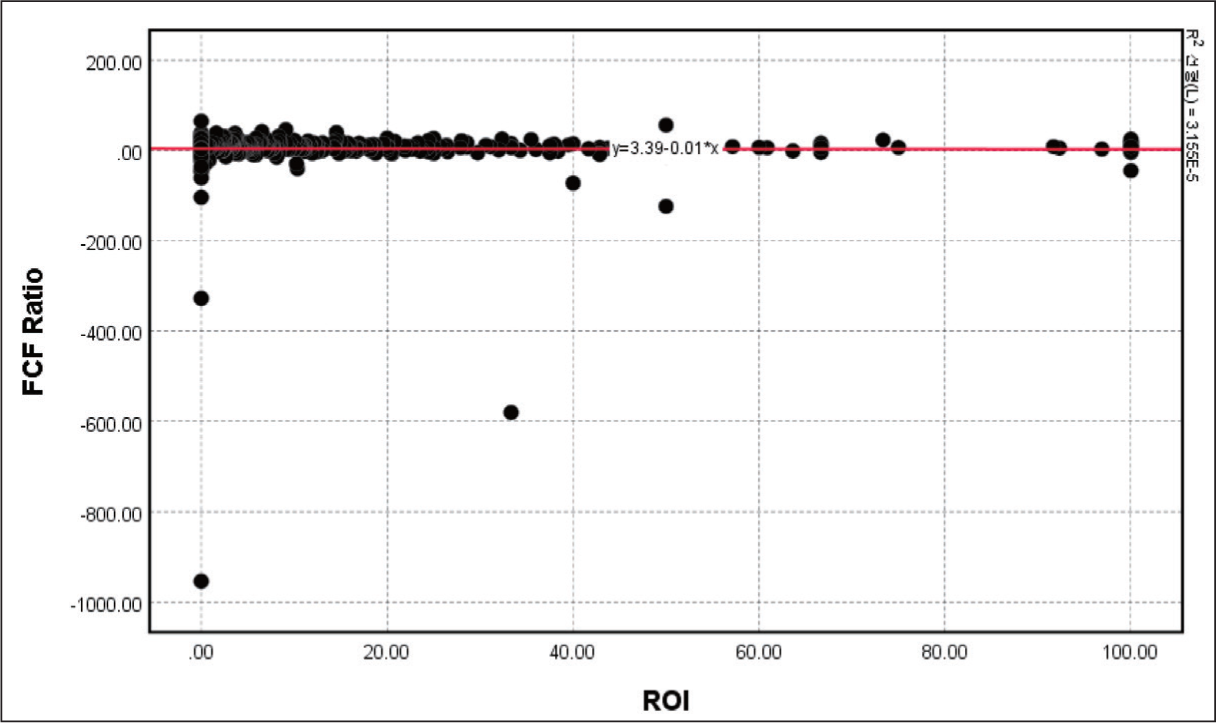
The relationship between the FCF ratio and the ROI on the scatterplot has a correlation value of nearly zero, where Y = –3.39 – 0.01X, as seen in Figure 9. This suggests that the correlation is potentially affected if any other variables are added between these two variables.
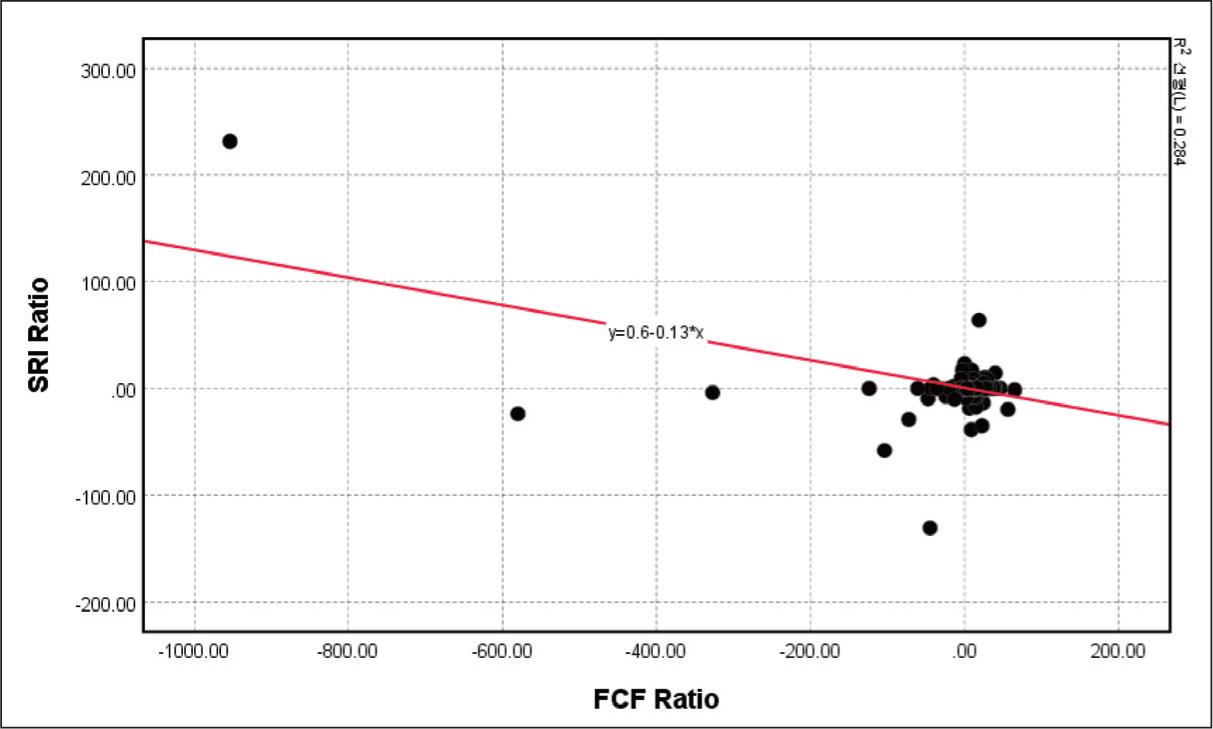
However, the relationship between the FCF ratio and the SRI ratio on the scatterplot shows a negative correlation, where Y = 0.60 – 0.13X, as seen in Figure 10. We must examine this relationship further, as many firms are grouped in a similar location on the scatterplot.
The FCF of the top twenty firms (with a mean of 3412.94) is 132.54 times higher than the bottom twenty firms (with a mean of 25.75), as seen in Table 6. However, the FCF ratio of the top twenty firms (with a mean of –24.48 and an SD of 131.68) shows less of a difference from the bottom twenty firms (with a mean of –17.12 and an SD of 76.00) (Table 6). This means that a firm’s FCF ratio is typically located in any scope, which could represent a form of a firm’s general financial actions.
The FCF of the Top and Bottom Twenty Firms.
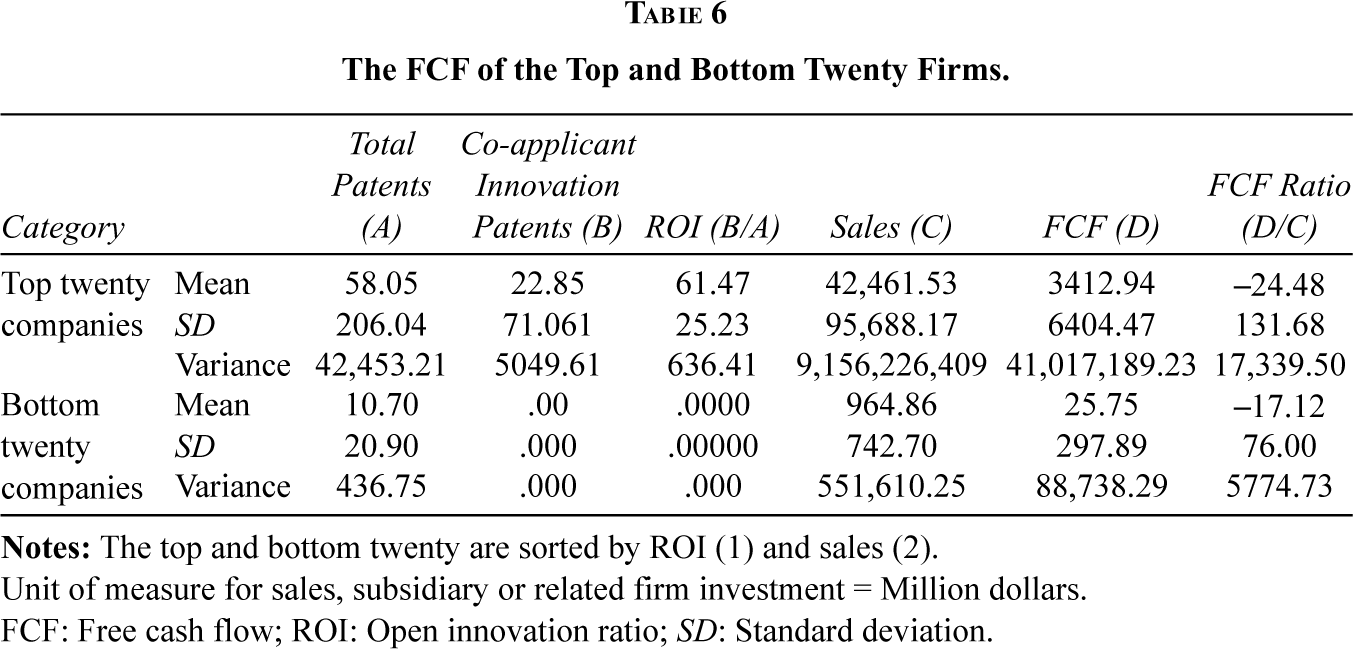
Unit of measure for sales, subsidiary or related firm investment = Million dollars.
FCF: Free cash flow; ROI: Open innovation ratio; SD: Standard deviation.
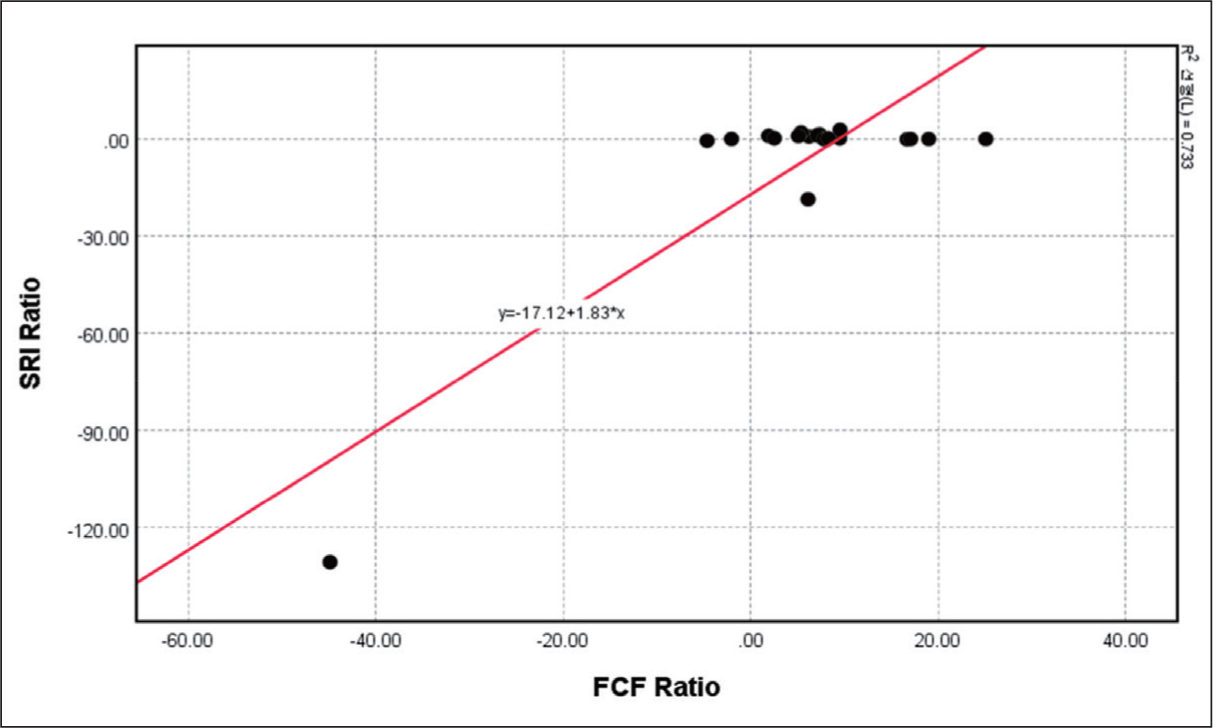
Notably, Figure 11 displays a positive correlation between the SRI ratio and the FCF ratio of the top 20 firms, where Y = 17.12 + 1.83X, the reverse of the total correlation between the SRI ratio and the FCF ratio. Large firms with enough FCF can invest more in subsidiaries and related firms.
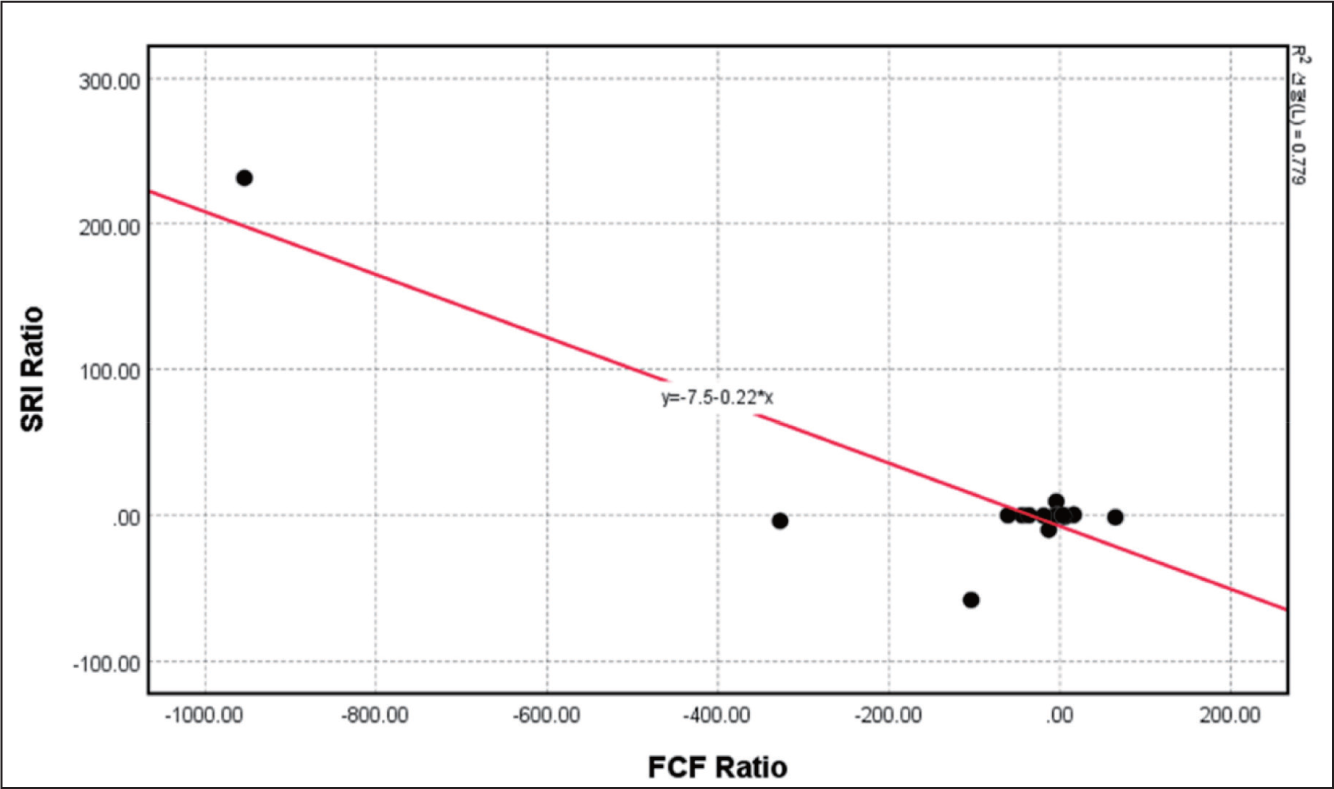
However, according to Figure 12, the bottom twenty firms show a negative correlation between the SRI and FCF ratios, where Y = 7.5 – 0.22X, similar to the total trend of Figure 12. This suggests that a higher FCF ratio may come with a smaller SRI ratio, except for very large firms. Alternatively, this could also indicate that because of the higher FCF ratio, firms could not escape a smaller SRI ratio.
Analysis of the Relationship Between Open Innovation and Financial Data
All variables in these analyses, including the ROI (co-applicant innovation patent numbers/total patent numbers), the SRI ratio (SRI/per year total sales), the I R&D ratio (I R&D/per year total sales) and the FCF ratio (FCF/per year total sales), are ratio variables, as seen in Table 7.
Descriptive Statistics of the Relationship Between Open Innovation and Financial Data.
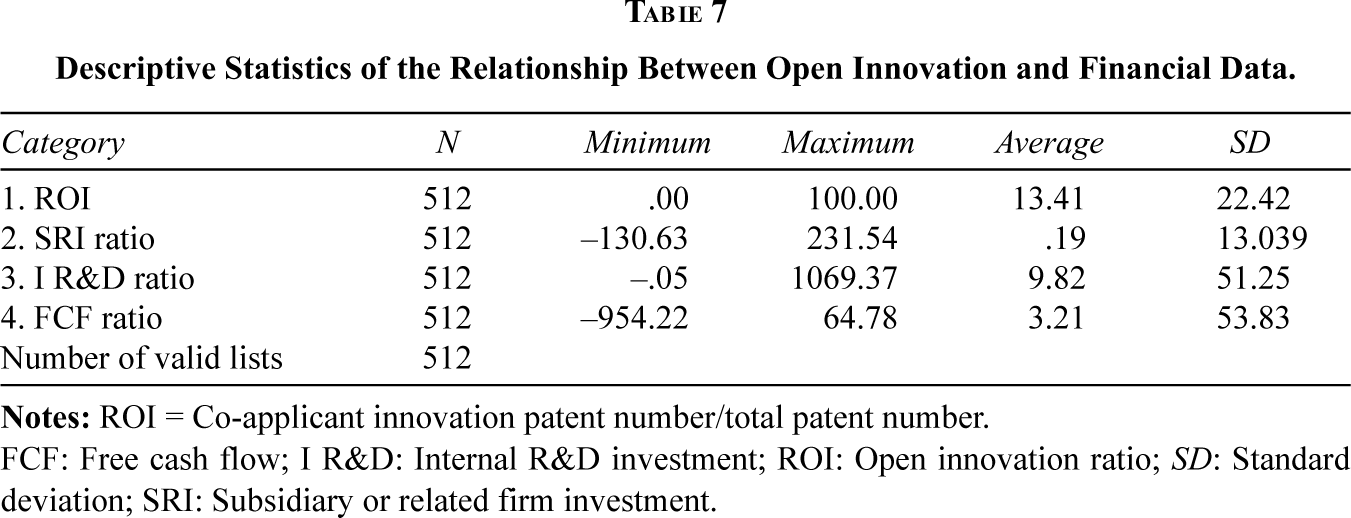
FCF: Free cash flow; I R&D: Internal R&D investment; ROI: Open innovation ratio; SD: Standard deviation; SRI: Subsidiary or related firm investment.
First, we selected 512 cases with data on the ROI, SRI, I R&D and FCF ratios from US finance and patent data, as seen in Table 7. Of our analysed firms, 13.41% have co-applicant patents. Furthermore, they have an average I R&D ratio of 9.82 per year of total sales. These data results show that our analysed firms have high open innovation and R&D investment ratios, which can be understood by examining the top and bottom twenty firms listed in Appendices A and B.
According to the correlation analyses, ROI has a somewhat negative correlation with the SRI ratio, as seen in Table 8. The SRI ratio positively correlates with the I R&D ratio and negatively correlates with the FCF ratio, which means that there is the possibility of a moderating effect of the I R&D ratio and the FCF ratio between ROI and the SRI ratio. Last, the I R&D ratio negatively correlates with the FCF ratio, as seen in Table 8. According to the correlation analysis, ROI does not have a statistically significant relationship with the SRI ratio, as seen in Table 8, which should be additionally analysed in the moderating model.
Correlation Analysis of the Relationship Between Open Innovation and Financial Data.
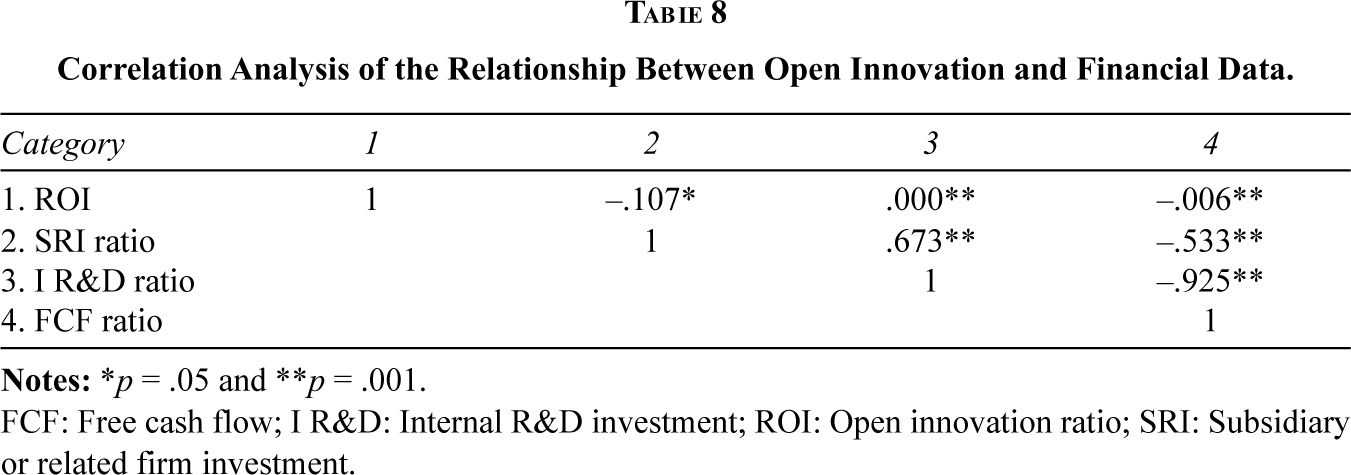
FCF: Free cash flow; I R&D: Internal R&D investment; ROI: Open innovation ratio; SRI: Subsidiary or related firm investment.
According to the regression results in Table 9, ROI negatively affects the SRI ratio with sufficient statistical meaning, with an SD of –0.107 and a p value of .001. Thus, H1 (open innovation will decrease the SRI) is accepted. If any firm’s patent applications increase (i.e., open innovation increases), the SRI, which is a kind of closed innovation area in the boundary of the firm in this case, will decrease (Lakhani et al., 2013). We can infer the change in the open innovation of a firm using the SRI ratio based on the results of H1.
Regression Analysis of the Moderating Effects of I R&D and FCF.
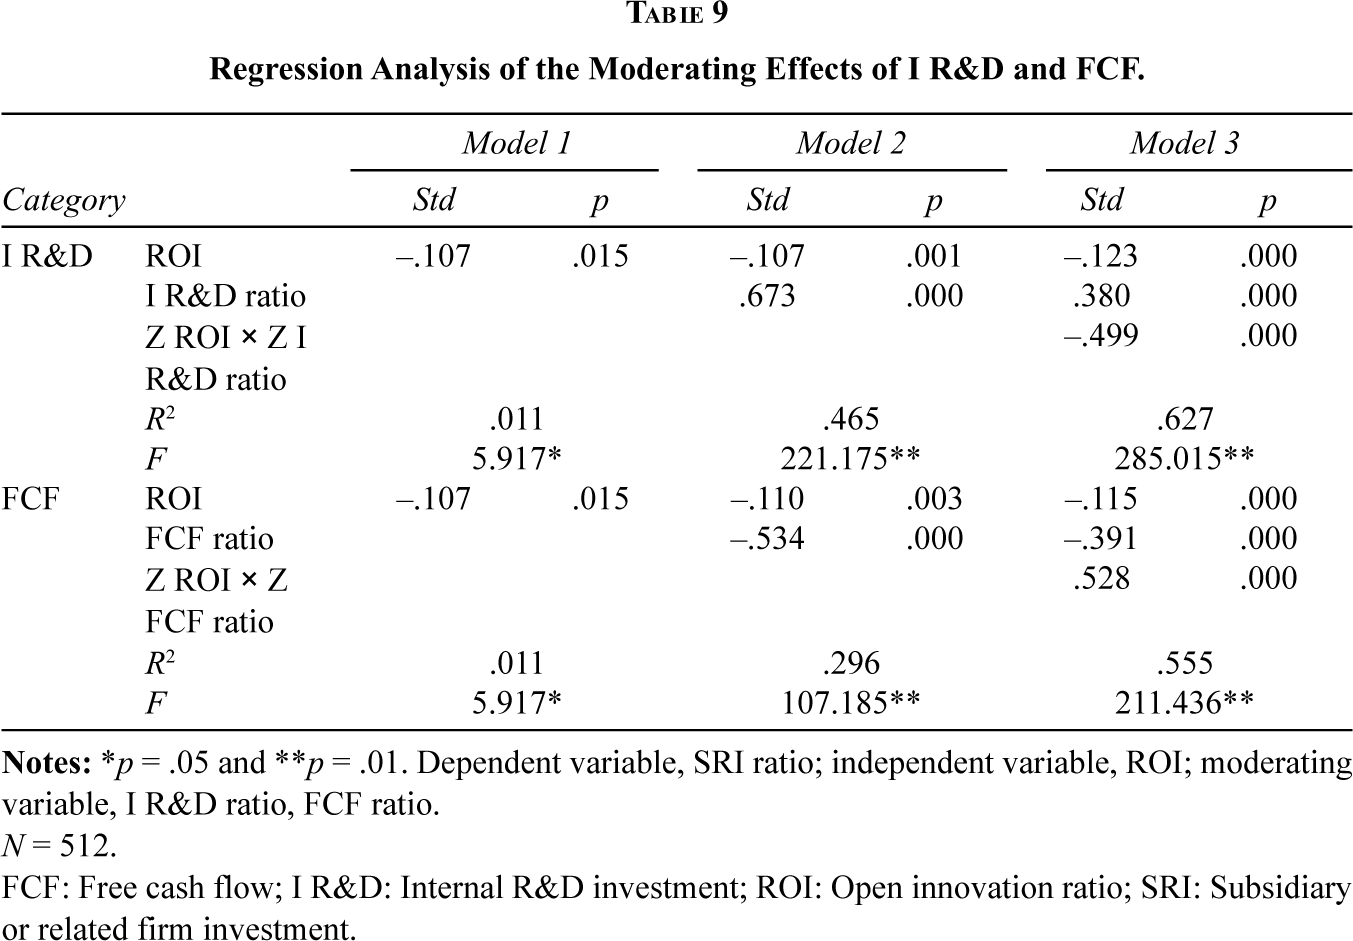
N = 512.
FCF: Free cash flow; I R&D: Internal R&D investment; ROI: Open innovation ratio; SRI: Subsidiary or related firm investment.
I R&D negatively moderates the effects of open innovation on SRI, as seen in Table 9. In other words, H2 (I R&D will negatively moderate between open innovation and SRI) is accepted. If I R&D increases, the firm’s open innovation also increases the SRI. Open innovation, characterised by high I R&D as a form of absorptive capacity, could motivate the growth of a firm’s scope or boundary for open innovation (Vanhaverbeke et al., 2008).
Notably, FCF positively moderates the effects of open innovation on SRI, as seen in Table 9. Thus, H3 (FCF will positively moderate between open innovation and SRI) is accepted. If a firm has a high FCF, such as a large internal reserve, it will motivate the effects of open innovation in addition to decreasing SRI (Martono et al., 2020). A firm’s high FCF is more likely to motivate open innovation (Tou et al., 2019).
The regression results are expressed in Figure 13. First, a moderating effects analysis of I R&D shows a rational increase in the R2 value of 0.011 for model 1, 0.465 for model 2 and 0.627 for model 3. In addition, the F value of the moderating effects analysis of I R&D increased rationally from model 1, at 5.917*, to model 2, at 221.175** and to model 3, at 285.015**. The R2 and p values together show that the moderating effects of I R&Ds have enough statistical value.
The Analysis Results of the Relationship Between Open Innovation and Financial Data.
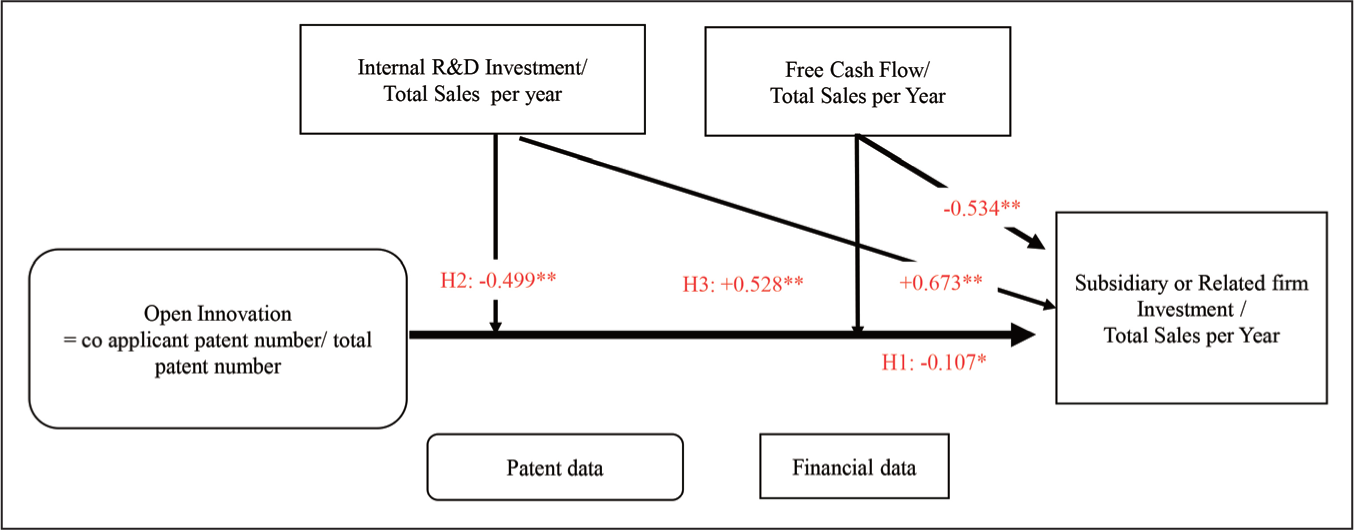
Second, the moderating effects analysis of the FCF shows a rational increase of the R2 value from 0.011 in model 1, to 0.296 in model 2 and to 0.555 in model 3. In addition, the F value of the moderating effects analysis of FCF increased rationally from 5.917* in model 1, to 107.185** in model 2 and to 211.436** in model 3. The R2 and p values show that the moderating effects of FCF have enough statistical value.
Discussion
First, if an open innovation strategy is combined with I R&D, inward open innovation could be motivated, as seen in Figure 14. According to the regression analysis in Figure 13, if any firm chooses an open innovation strategy (in this research, this means co-applying for patents) combined with I R&D, the SRI of the firm increases. Notably, the increased SRI can be a form of inward open innovation from the co-applicant patents or collaboration between firms for the co-applicant patents.
The Joint Effects of an Open Innovation Strategy and Financial Investment.
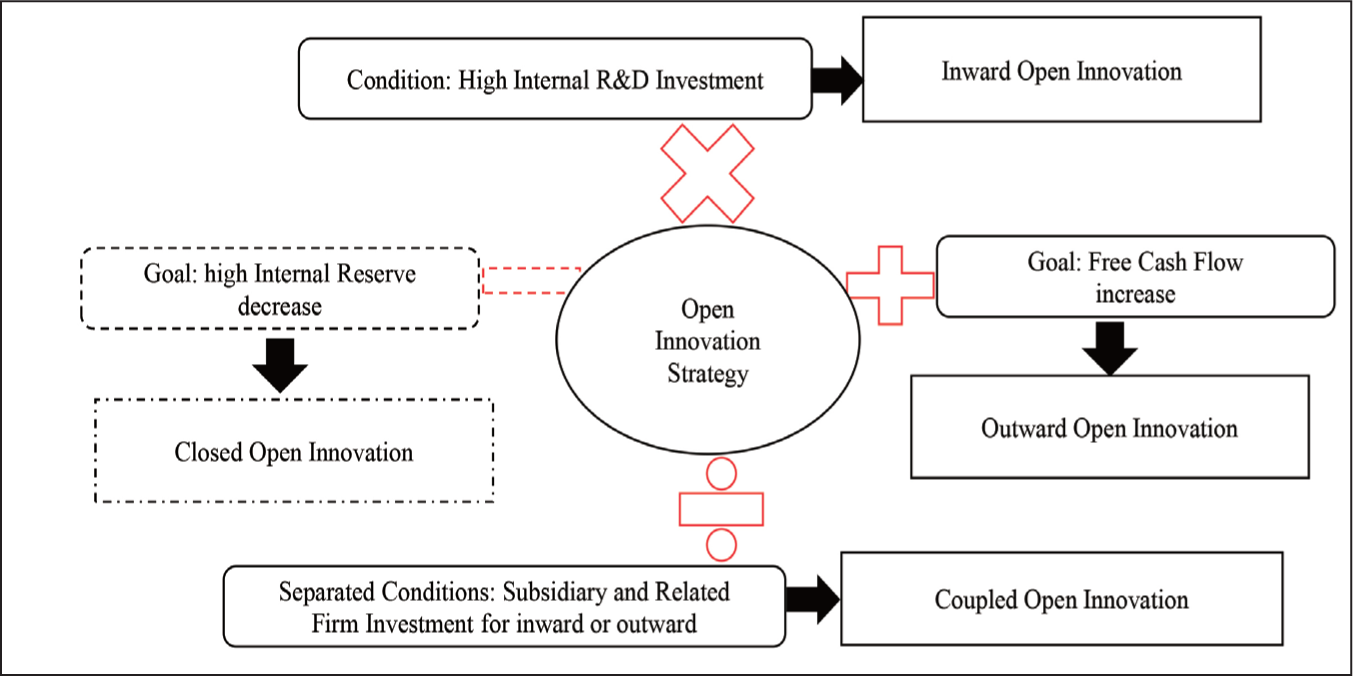
Second, if a firm wants to increase its FCF when pursuing an open innovation strategy, it could easily choose an outward open innovation strategy, as seen in Figure 14. According to the regression results in Figure 13, if any firm pursues an open innovation strategy with the desire to increase FCF, SRI additionally increases. This investment increase could signal outward open innovation, which could have its own new market or participate in other firms’ new markets. When any firm pursues an open innovation strategy, if it wants more FCF, it could easily participate in diverse outward open innovation channels.
Third, if an open innovation strategy meets diverse SRI, it could motivate a coupled open innovation strategy, as seen in Figure 14. This means inward open innovation and outward open innovation occur simultaneously. According to Figures 7 and 8, the SRI ratio has a negative relationship with I R&D in the top twenty firms but a positive relationship with I R&D in the bottom twenty firms. According to Figures 11 and 12, the SRI ratio has a positive relationship with FCF in the top twenty firms but a negative relationship in the bottom twenty firms. This means that SRI could be an inward accumulation from the outside or an outward accumulation from the inside. Combining an open innovation strategy with diverse SRIs motivates coupled open innovation, which includes outside-in and inside-out open innovation (Figure 14).
Fourth, if FCF is accumulated for several years in a large company, it results in a high internal reserve. If this company pursues an open innovation strategy together with the goal of decreasing the high internal reserve, the firm has arrived at closed open innovation, meaning that closed innovation is used with partial open innovation to accumulate innovative capabilities within the firm (Yun, 2015; Yun et al., 2018). This increased closed open innovation will be the new starting point of outward open innovation.
Conclusion
Theoretical Implications
This study determined the theoretical relationship between open innovation and the three financial data variables of I R&D, FCF and SRI.
First, SRI in financial data may have a negative relationship with open innovation because open innovation (i.e., the co-application of patents) could decrease SRI. But there are differences between the top and bottom twenty firms.
Second, I R&D in financial data may have a positive relationship with open innovation because I R&D could trigger inward open innovation. If I R&D combines with an open innovation strategy, it increases the size of SRI as a kind of inward open innovation.
Third, FCF in financial data may have a positive relationship with open innovation because high FCF could support outward open innovation. An open innovation strategy combined with a high FCF will increase not only SRI but also outward open innovation. Conversely, insufficient FCF will trigger investment not in outward open innovation but in subsidiary or related firms.
Practical Implications
Research suggests that financial data can be a signal of open innovation practically as follows. First, SRI includes open or closed innovation activities together, such as engaging in (a) inward open innovation by adding new outside innovation outcomes, (b) outward open innovation by separating out some internal product innovations or (c) closed innovation by expanding or deepening the firm’s product line.
Second, I R&D could trigger inward open innovation by developing the absorptive capacity to engage in outside-in open innovation. In addition, high I R&D could motivate closed innovation with a higher accumulation of absorptive capability.
Third, a high FCF could indicate the possibility of outward open innovation. If a firm wants to have sufficient FCF, it could achieve it through outward open innovation. In fact, outward open innovation increases the FCF by providing outward open innovation channels such as licensing, Merge and Acquistions (M&As) and external partnering.
Limitations and Future Research Targets
This research is based on a statistical analysis of the relationship between co-applicant patents and financial data. This statistical research had several focal points, such as (a) total descriptive analysis, (b) the top twenty firms’ descriptive analysis and (c) the bottom twenty firms’ descriptive analysis, in addition to the regression analysis of the relationship between open innovation and financial data.
In other words, this study did not analyse the real relationship between open innovation and financial data at the firm level. For future research, additional case studies on the relationship between open innovation and financial data will be required to generalise and expand the application of the findings in this study.
Furthermore, additional research should occur on the relationship between open innovation channels, such as inward, outward and coupled open innovation, and financial data, such as I R&D, FCF and SRI. The relationship between open innovation channels and financial data from several countries could provide additional findings not found in this research.
Finally, additional financial data could be researched to determine the relationship between this data and open innovation. This research only focused on three financial data variables, which were selected from literature reviews based on the possibility of their relationship with open innovation.
Footnotes
Declaration of Conflicting Interests
The authors declared no potential conflicts of interest with respect to the research, authorship and/or publication of this article.
Funding
This work was supported by the DGIST R&D Program of the Ministry of Science and ICT (24-IT-03).
Acknowledgements
Thanks to financial data based research team, SNU Prof. Bong Hwan Kim and Dr. Joong Gi Ahn. Even though they have different research background, they provide continuously contributions on the paper until publication.
Appendix
Bottom Twenty Firms’ Descriptive Statistics.
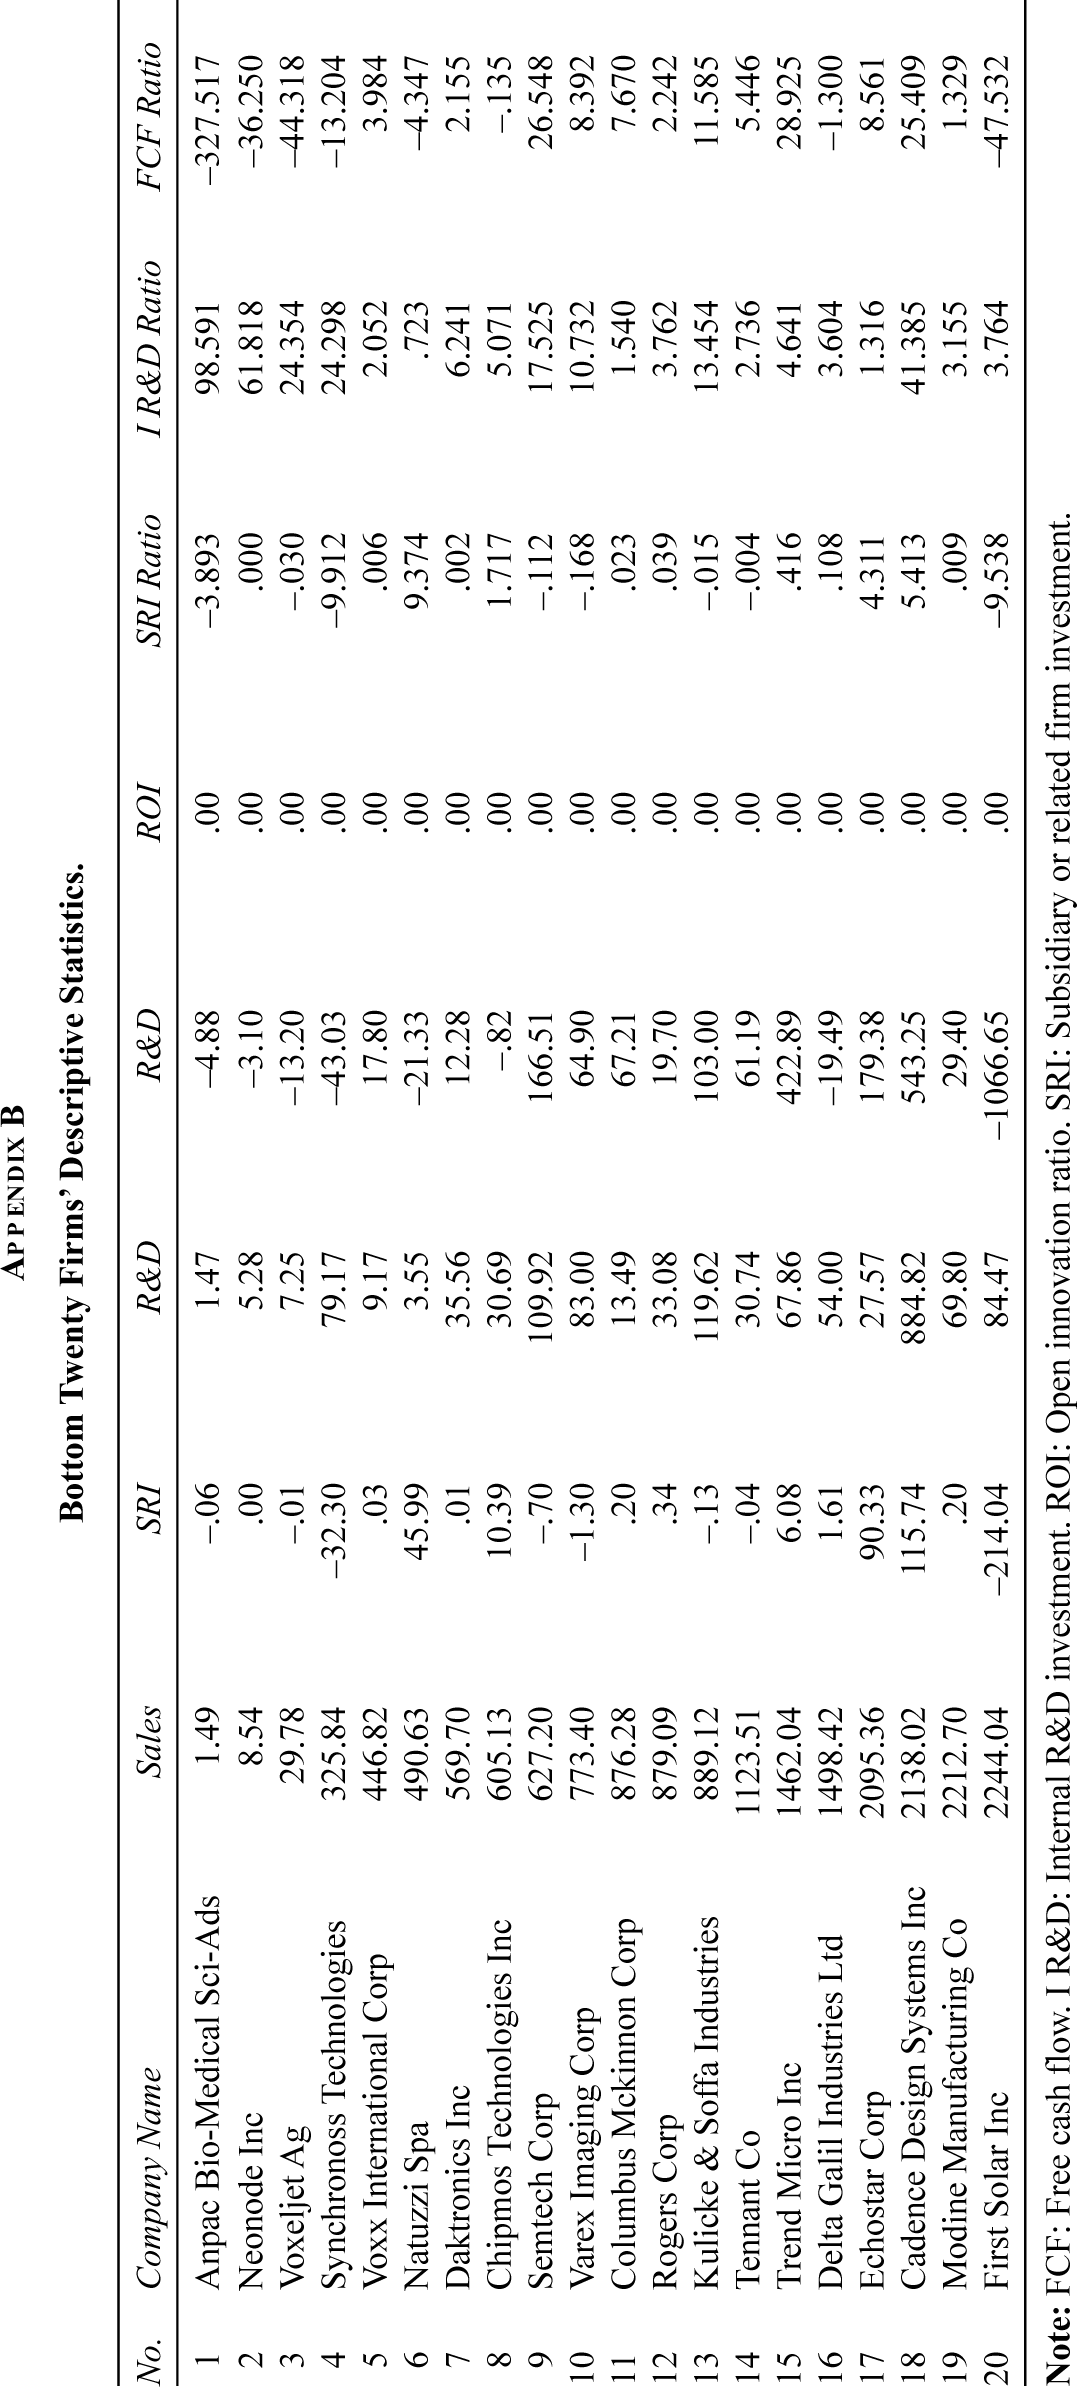
| No. | Company Name | Sales | SRI | R&D | R&D | ROI | SRI Ratio | I R&D Ratio | FCF Ratio |
| 1 | Anpac Bio-Medical Sci-Ads | 1.49 | –.06 | 1.47 | –4.88 | .00 | –3.893 | 98.591 | –327.517 |
| 2 | Neonode Inc | 8.54 | .00 | 5.28 | –3.10 | .00 | .000 | 61.818 | –36.250 |
| 3 | Voxeljet Ag | 29.78 | –.01 | 7.25 | –13.20 | .00 | –.030 | 24.354 | –44.318 |
| 4 | Synchronoss Technologies | 325.84 | –32.30 | 79.17 | –43.03 | .00 | –9.912 | 24.298 | –13.204 |
| 5 | Voxx International Corp | 446.82 | .03 | 9.17 | 17.80 | .00 | .006 | 2.052 | 3.984 |
| 6 | Natuzzi Spa | 490.63 | 45.99 | 3.55 | –21.33 | .00 | 9.374 | .723 | –4.347 |
| 7 | Daktronics Inc | 569.70 | .01 | 35.56 | 12.28 | .00 | .002 | 6.241 | 2.155 |
| 8 | Chipmos Technologies Inc | 605.13 | 10.39 | 30.69 | –.82 | .00 | 1.717 | 5.071 | –.135 |
| 9 | Semtech Corp | 627.20 | –.70 | 109.92 | 166.51 | .00 | –.112 | 17.525 | 26.548 |
| 10 | Varex Imaging Corp | 773.40 | –1.30 | 83.00 | 64.90 | .00 | –.168 | 10.732 | 8.392 |
| 11 | Columbus Mckinnon Corp | 876.28 | .20 | 13.49 | 67.21 | .00 | .023 | 1.540 | 7.670 |
| 12 | Rogers Corp | 879.09 | .34 | 33.08 | 19.70 | .00 | .039 | 3.762 | 2.242 |
| 13 | Kulicke & Soffa Industries | 889.12 | –.13 | 119.62 | 103.00 | .00 | –.015 | 13.454 | 11.585 |
| 14 | Tennant Co | 1123.51 | –.04 | 30.74 | 61.19 | .00 | –.004 | 2.736 | 5.446 |
| 15 | Trend Micro Inc | 1462.04 | 6.08 | 67.86 | 422.89 | .00 | .416 | 4.641 | 28.925 |
| 16 | Delta Galil Industries Ltd | 1498.42 | 1.61 | 54.00 | –19.49 | .00 | .108 | 3.604 | –1.300 |
| 17 | Echostar Corp | 2095.36 | 90.33 | 27.57 | 179.38 | .00 | 4.311 | 1.316 | 8.561 |
| 18 | Cadence Design Systems Inc | 2138.02 | 115.74 | 884.82 | 543.25 | .00 | 5.413 | 41.385 | 25.409 |
| 19 | Modine Manufacturing Co | 2212.70 | .20 | 69.80 | 29.40 | .00 | .009 | 3.155 | 1.329 |
| 20 | First Solar Inc | 2244.04 | –214.04 | 84.47 | –1066.65 | .00 | –9.538 | 3.764 | –47.532 |