
Abstract
This research aimed to investigate the death counts from coronavirus disease (COVID-19) across Asian countries by selecting 42 countries with a nonzero death count. Several studies have assessed personal-level factors that affect mortality rates in patients with COVID-19. However, the influence of country-level factors is still debatable. The results of a generalised estimating equation confirmed that the expected death counts across the countries in the middle quartile group of gross domestic product, upper quartile group of population density and lower quartile group of hospital bed count were higher than those in the countries in other quartile groups. The results further confirmed the positive association of the percentage of the population aged ≥65 years and time (day) with the death count. Visualisations and descriptive statistics showed that the death count increased over time across the Asian countries, with maximum death count occurring in the third quarter of the year 2020. These findings support the recommendation that countries with lower number of hospital beds per 1,000 persons, higher percentage of the population aged 65 years and older and middle and lower economies should take more precautions to reduce the death count from COVID-19.
Introduction
Almost all countries have been affected by the coronavirus disease 2019 (COVID-19) pandemic, which originated in Wuhan, China, in December 2019. Nearly one million people have died because of COVID-19 worldwide, and 17.4% of the total deaths occurred in the Asian region (Worldometer, 2021). The public health emergency due to COVID-19 is unmatched by that of any other virus in the past 100 years, and this will have social and economic consequences. A global concern has been raised to investigate and coordinate efforts to discover the factors that influence mortality from and transmission of this devastating pandemic (Wu et al., 2020).
There is an ongoing debate about the role that transmission and development play in the spread of the disease. For example, some researchers have claimed that higher density of human population and compact development lead to increased likelihood of exposure to the virus and higher mortality rates (Glaeser, 2011; Hamidi et al., 2020b). However, Dye (2008) argued that denser populations and urbanisation lead to better health facilities and education, and consequently there would be a decreased chance of mortality from COVID-19 in urban areas compared with rural areas. In addition, areas with lower economies may not be able to meet the basic requirements of health facilities, consequently leading to higher chances of mortality from the pandemic in those countries (Madhav et al., 2017).
Age is another factor that has played a role in the increased mortality rate due to the pandemic. During the 1918 influenza pandemic, the youngest and oldest populations had lower mortality rates than young adults (aged 24–44 years) (Glezen, 1996). However, in the case of the H1N1 influenza virus, the population of adults aged over 65 had a much higher risk of being infected, as well as a higher chance of mortality (Donaldson et al., 2010). Similar patterns as in H1N1 have also been observed in the case of COVID-19. The mortality rate in older populations due to the disease has been higher than in younger and middle-aged populations (Liu et al., 2020; Mehra et al., 2020).
The ‘killer virus’ severe acute respiratory syndrome coronavirus 2 (SARS-CoV-2) has been spreading worldwide from December 2019 until present, regardless of climate or geographical region. However, death counts due to COVID-19 vary across countries (Roser et al., 2020). For some countries, such as Brunei, Mongolia and Taiwan, the total death count due to COVID-19 was under 10 by 31 December 2020, but in some other countries such as India, Iran and Indonesia, the death count due to COVID-19 is escalating (Worldometer, 2021). All these countries have different population densities, economies, median ages of populations and health systems (Roser et al., 2020). Due to the broad range of countries that this virus has impacted, it is a global challenge to explore and examine the factors that influence mortality and transmission. Thus, the aim of this study is to explore death counts due to COVID-19 and its associated factors over time across Asian countries, since COVID-19 originated in this region.
Literature Review
Pandemics of diseases have affected human life and killed millions of people at different times in the world’s history. For example, the Spanish flu, which lasted from 1918 to 1919 (Trilla et al., 2008), H1N1 in 2009 and Ebola disease from 2013 to 2016 (De Oliveira et al., 2020). Currently, the world is experiencing one of the most difficult situations of the twentieth century: the coronavirus pandemic. The spread of COVID-19 affected over 97 million individuals and killed over two million (N = 2,065,698) people in 214 countries as of 19 January 2021 (Worldometer, 2021). The impact is so immense that in Asia, more than 22 million people have been affected by COVID-19, of whom 354,958 have died because of the acute respiratory syndrome caused by COVID-19, as of 29 August 2020 (Worldometer, 2021).
Risk Factors for Mortality Due to COVID-19
A large proportion of studies on infectious diseases, such as COVID-19, have focused on personal pre-existing health conditions and biological risk factors like age and obesity. Several studies have also focused on existing health conditions and biological risk factors for COVID-19 (Du et al., 2020; Liu et al., 2020; Mehra et al., 2020; Mikami et al., 2020; Promislow, 2020; Zhou et al., 2020), including age (Mehra et al., 2020; Zhou et al., 2020), obesity (Cai et al., 2020) and pre-existing diseases such as cardiovascular disease, diabetes and hypertension (Mehra et al., 2020; Zhou et al., 2020), as the common factors that affect mortality rates in patients with COVID-19. Although personal-level studies are salient, it is also necessary to incorporate overall social and economic factors such as poverty, per capita income and educational level as risk factors for epidemic diseases (Frieden, 2010). Thus, this study is focused on country-level risk factors for COVID-19 mortality.
Several studies and reports have investigated the factors associated with COVID-19 transmission and mortality (Liang et al., 2020; Liu et al., 2020; Mehra et al., 2020; Mikami et al., 2020; Zhou et al., 2020). Most studies have reported that age is one of the salient contributing factors associated with mortality from COVID-19 (Liu et al., 2020; Mehra et al., 2020; Mikami et al., 2020; Promislow, 2020; Zhou et al., 2020). According to Promislow (2020), the risk of dying from COVID-19 is 0.1% in children and more than 10% in older people. A study conducted among hospitalised adults in Wuhan Pulmonary Hospital (Wuhan City, Hubei Province, China) between 25 December 2019 and 7 February 2020 showed that, along with the risk associated with prior medical conditions among COVID-19 patients, patients aged 65 years and older had a higher mortality risk (Du et al., 2020). A meta-analysis by Zheng et al. (2020) also highlighted that COVID-19 patients aged 65 years and older had higher odds of dying than those aged under 65 years. Although there are many factors that play a role in mortality in COVID-19, the risk of dying has been found to increase with age, and the riskiest age group is that of 65 years and older. Although many studies have highlighted that older adults have a higher risk of dying from COVID-19, it is not clear whether countries with larger proportions of adults who are 65 years of age or older are at higher risk of having higher mortality rates due to COVID-19 when compared to other countries. It is therefore salient to conduct a country-level study over time by considering the proportion of the population aged 65 years and older as one of the explanatory variables of mortality from COVID-19.
According to Farmer et al. (2000), social heterogeneity across a country is an influencing factor for the spread of infectious epidemic diseases in general. Inequalities in terms of income, education, development, etc. across countries or different social classes or regions indicate social heterogeneity (Farmer et al., 2000). For example, the mortality due to H1N1 in 2009 was also influenced by existing social heterogeneity between countries and states (Ponnambalam et al., 2012). Furthermore, analysis of the 1918‒1920 flu pandemic mortality rates provided plausible estimates of mortality, which suggested that most of the deaths occurred in the least developed and poorest countries (Murray et al., 2006). Gross domestic product (GDP) is an indicator of the economic size of a country, and variability in GDP may influence mortality due to the pandemic. In the analysis of country-level COVID-19 data, Chaudhry et al. (2020) found that countries with higher GDP recorded more deaths per million populations; however, there is a debate about the influence of GDP on the mortality rate due to disease epidemics or pandemics. For example, Glaeser (2011) highlighted that economic development and urbanisation are correlated; thus economic development leads to the elimination of poverty and increases prosperity. Glaeser (2011) further cautioned about the negative consequences of economic development and urbanisation, as they also increase population density, which in turn can increase the risk of transmission of epidemic infectious disease. On the contrary, a larger economy helps to build better hospitals, schools and universities, which lead to better health and educational systems. Consequently, improved healthcare systems will help to lower the mortality rate of any disease, including those characterised as epidemics or pandemics (Dye, 2008). In contrast to the increased risk of transmission of infectious diseases in areas with higher GDP and higher population densities, there is another perspective on evaluating the relationship between GDP and infectious disease transmission. Rahman (2011) investigated the relationship between health expenditure, education expenditure and GDP and found that GDP is associated with health expenditure as well as education expenditure. People living in countries with lower income levels have limited resources to protect themselves from the transmission of a pandemic. For example, in the case of the Zika virus, more infectious cases were found in areas with low GDP because people living in poor communities could not afford to protect themselves from mosquitoes (Gardner et al., 2018). Because of the poor financial status of Nepal, it had limited test centres in which to perform the polymerase chain reaction test for SARS-CoV-2 at the beginning of the COVID-19 pandemic. When the first case of COVID-19 was suspected in Nepal (13 January 2020), diagnostic laboratories and equipment were not established at that time; thus the sample was sent overseas for testing (Panthee et al., 2020). In the case of COVID-19, countries with poor economic status might have a higher risk of transmission as well as mortality because of limited ability to perform tests, inadequate health protection equipment, health awareness, etc. Thus, further investigation will provide some additional knowledge about the association of per capita GDP with mortality from COVID-19 and with disease transmission.
Studies suggest that population density is associated with the speed of the spread of pandemics (Hamidi et al., 2020b; Lakshmi Priyadarsini & Suresh, 2020; Lin et al., 2020). According to Hamidi et al. (2020b), highly populated areas are associated with more face-to-face interactions, which makes them potential hotspots for exponential spread of a pandemic disease. The findings of their study suggested that densely populated areas had larger proportions of people infected with COVID-19. These more densely populated areas also experienced higher death rates; although after controlling for the metropolitan area, these areas were found to have lower numbers of infections and death rates. Hamidi et al. (2020a) highlighted that the relationship between population density and pandemic spread is complex. Even though high population density increases the concentration of people and increases the likelihood of epidemic transmission, at the same time, in more affluent cities, there is an opportunity to receive better healthcare. Better-funded healthcare systems allow patients to have access to more highly prepared healthcare workers, who are in turn better able to manage the symptoms and spread of the virus and lower death rates (Hamidi et al., 2020b).
Previous studies on infectious diseases have suggested that hospital resources play a significant role in minimising the risk of mortality during epidemic infectious disease outbreaks (Krumkamp et al., 2011; Oshitani et al., 2008; Remuzzi & Remuzzi, 2020; Sprung et al., 2010; Zhang et al., 2006); this suggestion is also relevant to the COVID-19 outbreak and associated mortality. During an epidemic, developing countries may encounter many difficulties and challenges because of inadequate infrastructure. As a result, there would be higher death rates in developing countries than in developed countries (Oshitani et al., 2008). Oshitani et al. (2008) further highlighted that healthcare resources are limited in developing countries. Moreover, some countries have limited resources to treat patients with even when there is no pandemic, thus leading to higher mortality rates during pandemics. During the influenza outbreaks, because of the inadequate number of available beds, low-income countries like Nepal and Bangladesh experienced higher mortality rates than high-income countries like Singapore (Oshitani et al., 2008). In the case of COVID-19, the current study adds some value to the existing knowledge regarding the relationship between the available number of hospital beds within countries and COVID-19 mortality.
Rationale and Purpose of the Study
Several studies have highlighted some of the potential factors that influence mortality from pandemics (Donaldson et al., 2010; Glaeser, 2011; Hamidi et al., 2020b; Madhav et al., 2017). There is consensus among researchers that older populations are at higher risk of mortality than younger populations (Liu et al., 2020; Madhav et al., 2017; Mehra et al., 2020). However, there is no agreement among researchers regarding the relationship between a country’s economy and its population density with respect to infectious disease mortality rates and spread of pandemics. Despite a lack of consensus about the direction of the relationship, researchers have agreed that economic factors and population density are salient factors associated with mortality rates and the spread of pandemics. The number of hospital beds is another important factor that should be considered as an influencing factor for pandemic spread and mortality risk (Farzanegan et al., 2020); however this potential relationship has not been investigated. The Asian region is where COVID-19 originated, and it is one of the most populated areas in the world, accounting for 59.4% of the total world population (World Population Review, n.d.). In addition, this region was the epicentre of several other epidemic infectious diseases. It is therefore important to consider Asian countries when investigating the country-level risk factors of mortality for COVID-19. In addition, prior studies rarely considered the longitudinal nature of the data on COVID-19, causing the findings to be weak. Repeated measurements from single subjects provide more information than a single measurement obtained from different subjects (Hedeker & Gibbons, 2006). Hedeker and Gibbons (2006) highlighted that longitudinal data can provide information about individual changes, whereas cross-sectional data cannot. Using a longitudinal model, statistical estimates of country-level trends of COVID-19 mortality over time were explored in this study, and this increased the strength of the study.
This study will offer a relevant reference for future researchers to understand the pattern of COVID-19 mortality rates in association with potential country-level factors across Asian regions. Expanded research related to COVID-19 will also be a good resource for policymakers, international agencies like WHO and countries in the Asian region.
Based on the limitations of prior researches on pandemic and epidemic infectious diseases and the resulting gap in the existing literature, the purpose of this study was to examine the direction and strength of relationship of country-level risk factors with the death count of COVID-19 across countries in the Asian region by considering the correlations structure of the data over time and to answer the following research questions:
Methods
Source of Data and Sample Information
The subjects for this study were Asian countries. The source of the data was Our World in Data (Roser et al., 2020), which compiled COVID-19 country-level data (new deaths per million, new cases per million, total confirmed cases and total death count) along with other country-level information (median age, population, population density, GDP per capita, hospital bed count per 1,000 and proportion of people aged 65 years and older) in all the countries of the world. Countries within the Asian region that did not have any mortality due to COVID-19 from 1 January 2020 to 31 December 2020 were excluded. With this exclusion criterion, 42 Asian countries qualified for this study.
Based on GDP per capita, Yemen was the poorest country, with an average GDP per capita of US$1,479, and Qatar was the richest country, with an average GDP of US$116,935. Based on population density, Mongolia was the least densely populated country, with a population density of 1.98 persons per square kilometre, and Singapore was the most densely populated country, with a population density of 7,917 persons per square kilometre. Based on the available number of hospital beds per 1,000, the least number of hospital beds (per 1,000) available was in Nepal, whose average hospital bed count per 1,000 was 0.3. The maximum number of hospital beds (per 1,000) available was in Japan, with an average hospital bed count per thousand of 13.09. As of 31 December 2020, the total number of people who died from COVID-19 in India was 148,738, which is the highest total count among all countries in the Asian region. The lowest total death count was observed in Mongolia, where only one person had died from COVID-19 as of 31 December 2020. Laos had the least number of confirmed cases per million (41 cases), and India had the largest number of confirmed cases per million (10,266,674 cases).
Variables
Deaths due to COVID-19 were measured in two ways: as new deaths per 1,000,000 people and as counts of new deaths. New confirmed cases of COVID-19 were also measured in two ways: as new cases per 1,000,000 people and as counts of new cases. The variable “day” was defined as the number of days between 1 January 2020 and 31 December 2020. There were 0–366 days (0 is the baseline time). Population density was defined as the number of people within the country divided by the land area measured in square kilometres. The population aged 65 years and older was measured as the percentage of the population aged 65 years or older. GDP per capita was measured as purchasing power parity. Purchasing power parity is the comparison of the purchasing power of currencies of the countries across the world. The hospital bed count was measured as the number of hospital beds available per 1,000 people within each country. Furthermore, GDP per capita, population density and hospital bed count were divided into three quartile groups. Countries whose GDP was below 6,253 (first quartile) were categorised as the lower quartile group; those whose GDP was above 35,938 (third quartile) were categorised as the upper and the rest were categorised as the middle. Countries with population densities below 76.13 (first quartile) were categorised as the lower quartile group; those with population densities above 347.78 (third quartile) were categorised as the upper and the rest were categorised as the middle. Countries with hospital bed counts below 1.2 per thousand (first quartile) were categorised as the lower quartile group; those with hospital bed counts above 3.6 per thousand (third quartile) were categorised as the upper and the rest were categorised as the middle.
Data Analysis
Prior to answering the research questions, descriptive statistics and graphical representations were derived. Descriptive measures include the means and standard deviations of the following: death counts due to COVID-19 and death counts across quartiles of GDP per capita, population density and hospital bed count per 1,000. Visualisation includes a field heat map of deaths from COVID-19 across the countries in the Asian region for the first quarter (January, February and March), second quarter (April, May and June), third quarter (July, August and September) and fourth quarter (October, November and December) of 2020. A spaghetti plot of new deaths across the countries over time, an interaction plot of new deaths across hospital bed count per 1,000 and GDP per capita were plotted.
Because of the superiority of the general linear mixed model over the analysis of a variance-based model (Hedeker & Gibbons, 2006), a longitudinal count model was selected to model the death count due to COVID-19. In the current data situation, the variance of the death count was excessively greater than the mean; thus a negative binomial count model was used to model the death count. In addition, a generalised estimating equation (GEE) was used to marginalise the parameter estimation. The Wald test was used to test the significance of estimated model parameters. All the tests were two-tailed. Statistical significance level was set at α = 0.05. Field heatmaps were produced with Tableau 20.3, and other descriptive analyses and data preparations were executed in R 4.0.2. For tabulation and some other formats, Microsoft Excel was adopted. GEE was fitted with SAS 9.4.
Longitudinal Overdispersion Count Model for Death Count from COVID-19 with GEE
To model count data, the Poisson distribution is generally applied, but in case of the death count from COVID-19, variance was excessively higher than the mean. To model overdispersion count data, a negative binomial distribution is common practice. The base of the originating negative binomial model is a Poisson–Gamma relationship. The response variable Yit follows a Poisson distribution based on the mean µit (where “i” represents the ith subject and “t” represents the tth time point). µit is an independent gamma random variable with parameters µ and variance Φ µ2. Then, the marginal distribution of Yit is a negative binomial with a mean µ and a variance of µ + Φ µ2 (Diggle et al., 2002). To model the count response, we assume that µit depends on covariate Xit through a parametric function. For this research, the marginal (population average) effect is of more interest than the random effect. The GEE developed by Liang and Zeger (1986) is appropriate for marginalising the effect of covariates for longitudinal data by accounting for the inherent correlation structure. The marginal model is specified in two parts: the mean model and the variance-covariance structure.
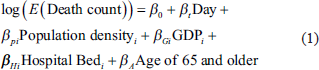
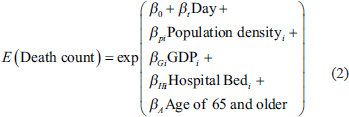
where,
Among them, the best working correlation structure was selected based on the minimum value under the ‘quasi-likelihood under the independence model criterion’, which was proposed by Pan (2001), where,

‘I’ is an independent correlation structure, and ‘R’ is the specified working correlation structure.
A scatter plot of Pearson residual versus time was used for model evaluation. Observations with Pearson residuals higher than five were excluded from the data before final model fitting.
Results
Descriptive Statistics and Visualisation
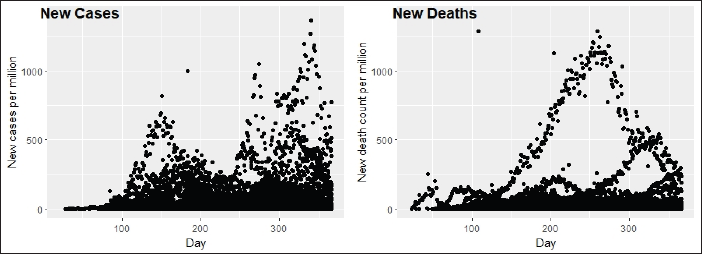
Figure 1 illustrates the spaghetti plot of new deaths and confirmed cases over time across Asian countries. It shows that the death count increased over time until the third quarter of the year, after which it gradually decreased until the end of the year across Asian countries. Furthermore, confirmed cases of COVID-19 across the countries of the Asian region increased over time, making two peaks around the ends of the first and third quarters of the year 2020.
Spaghetti Plot of Confirmed Cases and New Deaths over Time Across Countries.
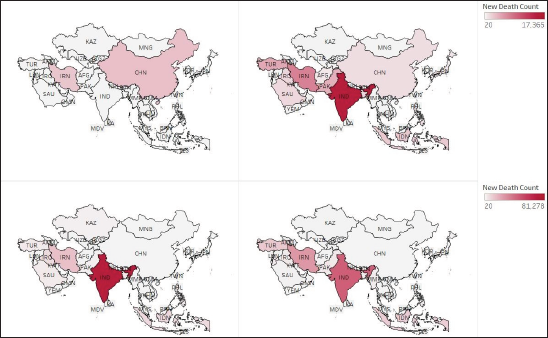
The field heat map presented in Figure 2 illustrates the total death count due to COVID-19 across Asian countries. It shows that China had the highest death count in quarter 1, but the count gradually decreased in quarters 2, 3 and 4. India and Indonesia had the lowest death count in comparison to other countries in the Asian region in quarter 1, which increased exponentially in quarters 2, 3 and 4. Likewise, Iran experienced high death count in the first quarter, after the first quarter of the death count in China, but the death count in Iran continued to increase until the fourth quarter of 2020.
Field Map of Cumulative Death Count Due to COVID-19 in the Asian Region, First and Second Quarter at Top Left and Right; Third and Fourth Quarter at Bottom Left and Right, respectively.
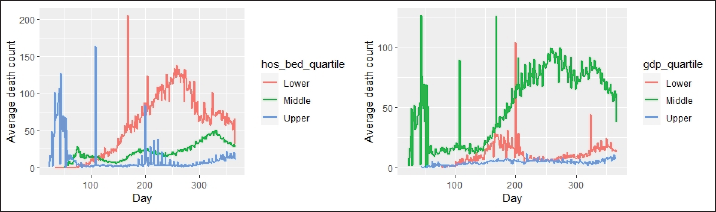
The interaction time plot in Figure 3 illustrates the average death count from COVID-19 across the quartile groups of hospital bed count and of GDP over time. This shows that countries belonging to the upper quartile group of hospital bed count had the highest death count as compared to the lower and middle quartile groups until the end of the first quarter of the year 2020; beyond the first quarter, significantly more deaths occurred in the lower quartile group. In addition, the death count due to COVID-19 across the middle quartile GDP group was higher over time as compared to the other two groups.
Interaction Plot of New Deaths Due to COVID-19 Across Hospital Bed Count Quartile Groups over Time (Left) and Across Gross Domestic Product Quartile Groups over Time (Right).
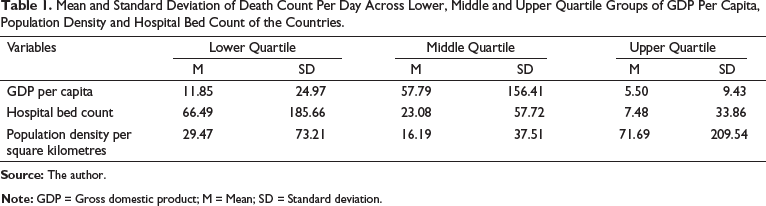
The means and standard deviations of the death count across the quartile groups of GDP per capita, population density and hospital bed count are presented in Table 1. Countries belonging to the lower quartile group of hospital bed count, middle quartile group of GDP and upper quartile group of population density had increased death counts on average. The overall mean death count across countries per day was 31.98, with a standard deviation of 111.9.
Mean and Standard Deviation of Death Count Per Day Across Lower, Middle and Upper Quartile Groups of GDP Per Capita, Population Density and Hospital Bed Count of the Countries.
Inferential Findings
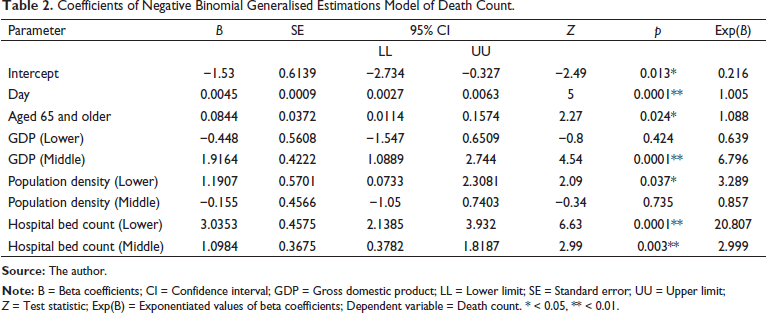
The coefficients of the negative binomial GEE of death count are presented in Table 2. It shows that for every additional day, the expected death counts due to COVID-19 increased by 0.5%. The expected death count across the countries in the middle quartile GDP group was 36.1% less than that of the upper quartile GDP group. The expected death count across countries in the lower quartile population density group was 228.9% less when compared to the upper quartile population density group. The expected death counts across countries in the lower quartile hospital bed count group was 21 times higher than that in the upper quartile hospital bed count group. Likewise, the expected death counts across countries in the middle quartile hospital bed count group was three times higher than that in the upper quartile hospital bed count group. In countries with an additional 1% of the population aged over 65 years, an additional 8.8% expected death counts due to COVID-19 was observed.
Coefficients of Negative Binomial Generalised Estimations Model of Death Count.
The working correlation selected for this model was the Toeplitz structure. Because the QIC and QICu of the current model have a working correlation structure, the Toeplitz structure was less than the model with the working correlation structure of AR(1). Plot of time versus Pearson type residual showed no visible pattern in the residual plots.
Discussion
This study used exploratory and inferential country-level analysis of publicly available data to examine the factors related to mortality from COVID-19. The results of this study show strong evidence of a change in the death count from COVID-19 over time across Asian countries. There was strong evidence that the percentage of people aged 65 years and older and the hospital bed count had a significant effect on the expected death count. Likewise, GDP per capita and population density had a significant effect on the expected death count. In addition, descriptive statistics and visualisations confirmed that countries belonging to the lower quartile group of hospital bed count, upper quartile group of population density and middle quartile group of GDP per capita experienced higher death counts over time. The results of the negative binomial GEE were consistent with visualisations and descriptive expectations for population density.
A larger economy is helpful for building better hospitals, schools and universities; thus, countries with larger economies have better resources which help protect their citizens from infectious diseases (Dye, 2008). In addition, Oshitani et al. (2008) highlighted that developing countries have limited hospital resources, such as hospital beds, physicians and nurses. Countries with lower GDP, such as Nepal and Bangladesh, are not very capable of accommodating patients during an influenza outbreak, let alone COVID-19. Thus, countries with limited hospital resources experienced higher deaths across the Asian region. Findings of the current study show that countries with higher hospital bed counts experienced significantly fewer deaths. For example, India and Indonesia belong to the lower quartile group, and China, Japan and South Korea belong to the upper quartile group of hospital bed counts. There was an exponential growth in the death counts in India and Indonesia after the first quarter of 2020, while China, Japan and South Korea were able to minimise the death counts. Providing hospital beds and other resources is not as costly as other infrastructure improvements, such as constructing highways, airports and railways. Allocating some of the national budget to provide more hospital beds will save thousands of lives from COVID-19 and similar pandemics in the future.
Descriptive statistics show that countries in the middle GDP quartile group experienced a higher death count compared to countries in the lower and upper GDP groups. GEE results were consistent with visualisations. The results also show that countries with higher economies experienced lower death rates, but countries belonging to the middle economy experienced higher death rates as compared to lower economies. Oshitani et al. (2008) highlighted that, developing countries faced more challenges during a pandemic and as a result, they experienced high death rates. People living in poor communities may not be able to afford healthcare bills, and countries with lower GDP do not have enough healthcare resources such as hospitals, intensive care units, cardiac care units, healthcare professionals and so on. However, additional research is needed to understand why higher death counts was observed in the middle economies than in lower economies.
Descriptive statistics showed that death counts across countries with higher population densities were higher than in countries in the lower and middle population density quartile groups. However, the descriptive statistics results were not consistent with the inferential statistics results. Inferential statistics results showed that countries in the lower quartile group of population density had higher death counts than those in the upper quartile group. One possible reason for this could be the high variability in the upper quartile group. Although the mean death count was higher in the upper quartile group because of an excessively high standard deviation, the test results were not consistent with the descriptive data. In previous studies, there were also mixed results on the effect of population density on COVID-19 mortality. A cross-sectional study by Hamidi et al. (2020b) found significantly lower death rates in highly populated countries, while a longitudinal study by Hamidi et al. (2020a) found lower death rates after controlling for metropolitan sizes. Findings from the current study are consistent with those of Hamidi et al. (2020a). Even though highly populated areas have higher chances of transmitting a virus than sparsely populated areas, better healthcare systems in highly populated regions are able to manage COVID-19 better.
Zheng et al. (2020) underlined that COVID-19-infected patients aged 65 years and older had higher odds of dying. The findings of the current study are consistent with those of Zheng et al., but the current study used country-level data, while Zheng et al.’s study used individual-level variables. A structural equation model of Hamidi et al. (2020b) found a positive direct effect of the population aged ≥60 years on death rates. Findings of the current study show that there is a positive association between the percentage of people aged 65 years and older and the death counts from COVID-19. However, the current finding is not consistent with that of Hamidi et al. (2020a), who did not find a significant effect of the percentage of the population aged 60 years and older on mortality rates from COVID-19. Several other studies also found that the mortality rate was significantly higher in older populations (Liu et al., 2020; Mehra et al., 2020). Visualisations show that the death counts increased over time regardless of GDP, population density and hospital bed counts, but only the rate of increase was different among groups. The negative binomial GEE model also confirmed the positive effect of time (day) on the death counts. Higher death counts were observed in the third quarter of 2020, which was displayed in the spaghetti plot as well as the field heat map.
This is the first study in which country-level data on COVID-19 from the Asian region were used to understand country-level risk factors for mortality from COVID-19. This study used a novel approach to marginalise the subgroups of the countries based on hospital bed count, GDP and population density and explored COVID-19 mortality across those subgroups. Thus, this study offers some implications for donor agencies, policymakers and governments in Asian countries. Findings from the current study demonstrate that developing countries whose hospital bed counts per thousand were not adequate, that have a larger percentage of people aged 65 and older and that have middle and lower economies should take more precautions to minimise the deaths associated with COVID-19.
Conclusion
In conclusion, the findings of this country-level analysis of COVID-19 suggest that the average death count significantly increased over time across Asian countries. One of the salient country-level risk factors responsible for death from COVID-19 is the hospital bed count. The small action of providing more hospital beds may save thousands of lives. Another risk factor is the elderly population. Extra precautions such as social distancing, minimising older people’s movements and minimising social gatherings will minimise the spread of COVID-19 and consequently minimise death rates. Likewise, countries with higher economies have lower death counts compared to countries with middle and lower economies. Helping lower- and middle-income countries have more hospital resources will save some lives. Undoubtedly, there are high transmission rates in densely populated areas, but there are also possibilities for better health facilities in those areas, which can lead to fewer deaths. This study offers some insight into understanding the COVID-19 death count across Asian countries. For future researchers, this study will be an important reference for understanding and improving the current model. It will also be a salient reference for health policymakers.
Limitations of Present Research and Future Research Directions
There are some potential extraneous variables (including the overall healthcare resources of a given country and the political leadership style of the country) that could have some influence on the death counts. Because of the lack of data and time in the current study, these extraneous variables could not be controlled. Also, this study used data from 1 January 2020 to 31 December 2020. COVID-19 cases and deaths are still growing. The COVID-19 data is updated daily; thus to achieve a saturated functional model for studying death count and its risk factors, future work will be required.
Footnotes
Acknowledgement
I would like to express my special thanks of gratitude to Professor of Department of Applied Statistics and Research Methods, University of Northern Colorado, Greeley, CO, USA, Dr Susan R. Hutchinson who gave me the golden opportunity to do this wonderful project and support throughout the study. I also would like to thank Editage (
Declaration of Conflicting Interests
The author declared no potential conflicts of interest with respect to the research, authorship and/or publication of this article.
Funding
The author received no financial support for the research, authorship and/or publication of this article.