
Abstract
Discounted cash flow (DCF)-based target price forecasts have the highest target price accuracy (TPA) of 70 per cent, while book value-based forecasts have the lowest TPA of 51.1 per cent for buy recommendations in India. Surprisingly, despite its superior performance, DCF is the least used valuation model as analysts prefer heuristics-driven earnings before interest, taxes, depreciation and amortization (EBITDA) or earnings multiples to produce target price forecasts. A significant and negative relationship with promoter holding explains the underperformance of book value-based target price forecasts—promoters possibly provide analysts with inflated book values which eventually result in inflated target price forecasts and lower target price accuracy.
Introduction
Sell-side equity analysts have received substantial academic interest over the past few decades. Researchers including Schipper (1991), Womack (1996), Asquith, Mikhail and Au (2005), Ryan and Taffler (2006) and Bradshaw, Brown and Huang (2012) have found evidence that equity research analysts produce forecasts which have investment value.
Among these notable studies, Asquith et al. (2005) have performed the first detailed study on information content of research reports. They report that an equity research report has three important elements—earnings forecast, stock recommendation and target price. They further state that investors are more interested in target price forecasts as compared to earnings forecasts.
On these three elements, Kerl (2011) states that academic studies have focused extensively on impact of recommendations and earnings forecasts which analysts disclose in their research reports, and literature has recently shifted to target price accuracy. According to Kerl (2011), the non-availability of databases with target price information until the late 1990s is the major reason for literature not focusing on target prices. Similarly, Bradshaw (2011) recently performed a global search on ABI/INFORM database and he finds 867 articles focusing on analyst and earnings while he finds only 17 articles related to analyst and target prices. Hence, target price is an important and developing area of research.
The next question is—How do analysts derive target prices? The answer to this question lies within the research reports. Macquarie research report 1 on global telecom company Bharti Airtel states that the target price has been derived using discounted cash flow (DCF) methodology. HSBC research report 2 on information technology (IT) service provider Infosys Technologies states that Infosys has been valued at using forward earnings per share (EPS) multiple. Goldman Sachs research report 3 on global steel producer Tata Steel states that target price has been derived using book value. Hence, from an industry point of view, target prices are derived from valuation methodology being employed by analysts. Bonini and Kerl (2012) summarize the role of valuation model succinctly—they state that analysts derive target prices by mixing outputs from different valuation approaches and/or using their perception about the company with respect to the company’s products, market share, competitive position, etc.
From an academic point of view, the impact of valuation model choice on target price accuracy (TPA) is studied by Demirakos, Strong and Walker (2010) who find that analysts make informed choice of valuation models and the choice of valuation model has a measurable impact on target price accuracy. To further elaborate on the impact of valuation model on target price accuracy, Gleason, Johnson and Li (2012) state that analysts can significantly improve their target price forecasts using a rigorous valuation technique.
Hence, from an industry as well as academic perspective, valuation models play an important role in determining target price accuracy. Da, Hong and Lee (2011) feel that the formation process of target prices and the sources of their investment value are yet to be addressed in detail. The need thus arises to develop literature further on the process of formation of target prices and investigation of valuation models can possibly provide useful insights into the target price formation process.
This research will investigate the role of valuation models in determining TPA in an emerging market, India. Or simply, this study will find which type of models produce the best target price forecasts in India. Literature suggests this is possibly the first attempt to do so in an emerging market.
This study can have important implications for investors and analysts. So far, most studies on TPA and valuation models have been performed in developed markets. A study on any emerging market can start the process of collecting information on the relationship between valuation models and TPA in emerging markets. Investors can find which models produce the most reliable target price forecasts and analysts can use this study as a feedback on their choice of valuation model and accuracy of target price forecasts.
The study is divided into six sections. The first section discusses prior research on the subject, second section describes the data collection process, third section discusses measure of target price accuracy, fourth section explains the statistical set-up, fifth section presents the statistical findings and the sixth section concludes the article.
Prior Research and Research Objectives
Literature on valuation model choice and analyst accuracy has been developing over the past decade. To begin with, Liu, Nissim and Thomas (2002) performed a study to evaluate the performance of valuation techniques with respect to predicting stock prices in developed markets. They find that forward earnings forecasts produce the best results, followed by historical earnings forecasts, then there is a tie for the third place between cash flow measures and book value of equity and sales-based forecasts perform the worst.
Another study which links TPA and valuation models has been performed by Asquith et al. (2005) in US markets. They divide valuation models into three broad categories—earnings or cash flow multiples, DCF and asset-based valuation. They find that earnings multiple-based valuation produces the best target price forecasts, DCF model has accuracy almost in line with earnings multiple and asset-based valuation model has the lowest accuracy. One key finding from their research is that an analyst performs consistently when he uses unique models rather than the three text book-based models.
In Europe, Schreiner and Spremann (2007) performed a study on the accuracy of different types of multiples. They find that equity multiples outperform enterprise value multiples, knowledge-related multiples outperform traditional multiples and forward looking multiples outperform trailing multiples.
Another study in Europe has been performed in UK markets by Demirakos et al. (2010). They find that PE multiples model outperforms the DCF model with respect to 12-month target price forecasts. However, controlling for difficulty of task, they find that DCF outperforms PE multiples. Their study has been performed on a sample of 490 research reports published on 94 UK listed firms.
The evidence so far from US and Europe suggests that TPA of valuation models varies across countries. For example, Asquith et al. (2005) find that multiples and DCF have similar TPA in US markets, while Demirakos et al. (2010) report superior performance of PE multiples over DCF in UK. Hence, the success of a particular model in one market may not be applicable in another market.
Moving ahead with more studies on choice of valuation models and target price accuracy, Gleason et al. (2012) find that analysts in US markets have higher TPA with residual income-based rigorous methods rather than heuristic-driven PEG methods. The implications of their research are that an analyst’s target price forecasts should not be derived from what the analyst feels—rather focus should be on creating a solid fundamental base. In contrast to Gleason et al. (2012), Da and Schaumburg (2011) report that relative multiple valuation models provide valuable investment information even though these models are less informative.
Two recent studies have focused on valuation models and TPA in Europe. First, Imam, Chang and Shah (2013) performed a study on UK analysts and found that earnings multiple and DCF are the two most popular valuation methods for analysts. Even though DCF and multiples are extensively used, Imam et al. (2013) report that book value- and return on equity (ROE)-based models produce superior target price forecasts.
Second, Bonini and Kerl (2012) find that target price forecast accuracy is higher with analysts who purposely deviate from multiple-based pseudo target prices. They believe that target prices derived from a model with substantial inputs provide investors with more valuable information and help investors in making investment decisions.
To summarize, the literature on model accuracy, Liu et al. (2002) and Asquith et al. (2005) find that multiples produce accurate target price forecasts, while more recent studies performed by Gleason et al. (2012) and Bonini and Kerl (2012) advocate the use of more sophisticated models to derive target price forecasts. Another perspective is offered by Imam et al. (2013) who contend that book value- and ROE-based models produce the best forecasts. Hence, literature provides inconclusive evidence on which type of models are more accurate.
An important point to note is that most of the studies have been performed in developed markets across Europe and US and not much significant contribution has been made in the area of valuation and TPA in India. Hence, a research gap exists with respect to choice of valuation models and TPA in an emerging market and this research intends to fill that gap. Literature review suggests that this may possibly be the first attempt in an emerging market to measure the impact of valuation models on target price accuracy. To summarize, the primary objective of this study is to find which valuation models produce the best target price forecasts in India.
Along with the primary objective, the study has a secondary objective to find the effects of systematic risk and shareholding pattern on TPA for each valuation model. The question to be addressed is—Do firm-specific factors affect TPA of valuation models?
An important differentiating feature of this study is that it will focus exclusively on valuation models used by analysts to generate buy recommendations. Investors and analysts find buy recommendations the most glamorous because investment process starts with buy recommendations and not hold or sell ratings. This makes buy recommendations the most issued and tracked recommendations among buy, hold and sell recommendations.
Data Collection
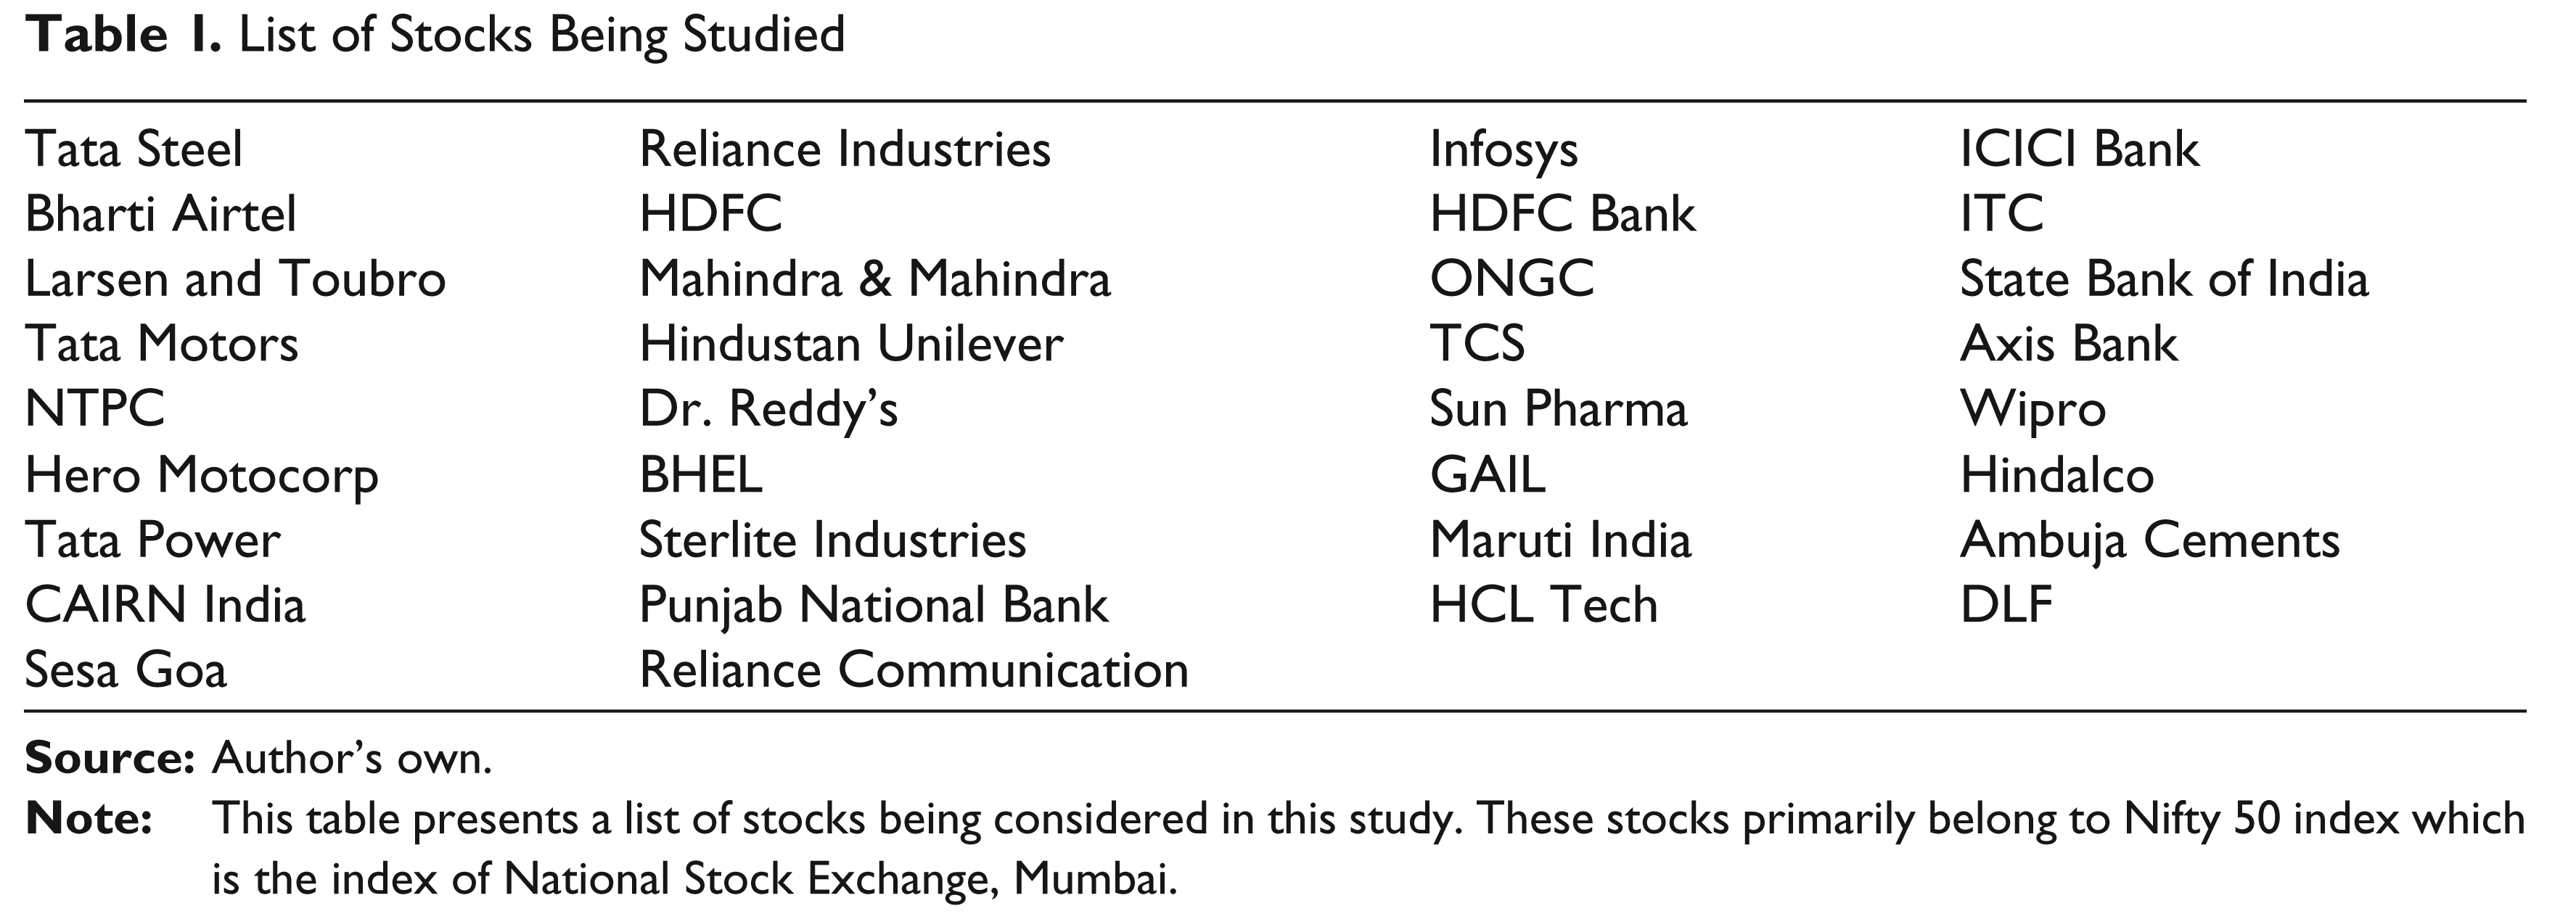
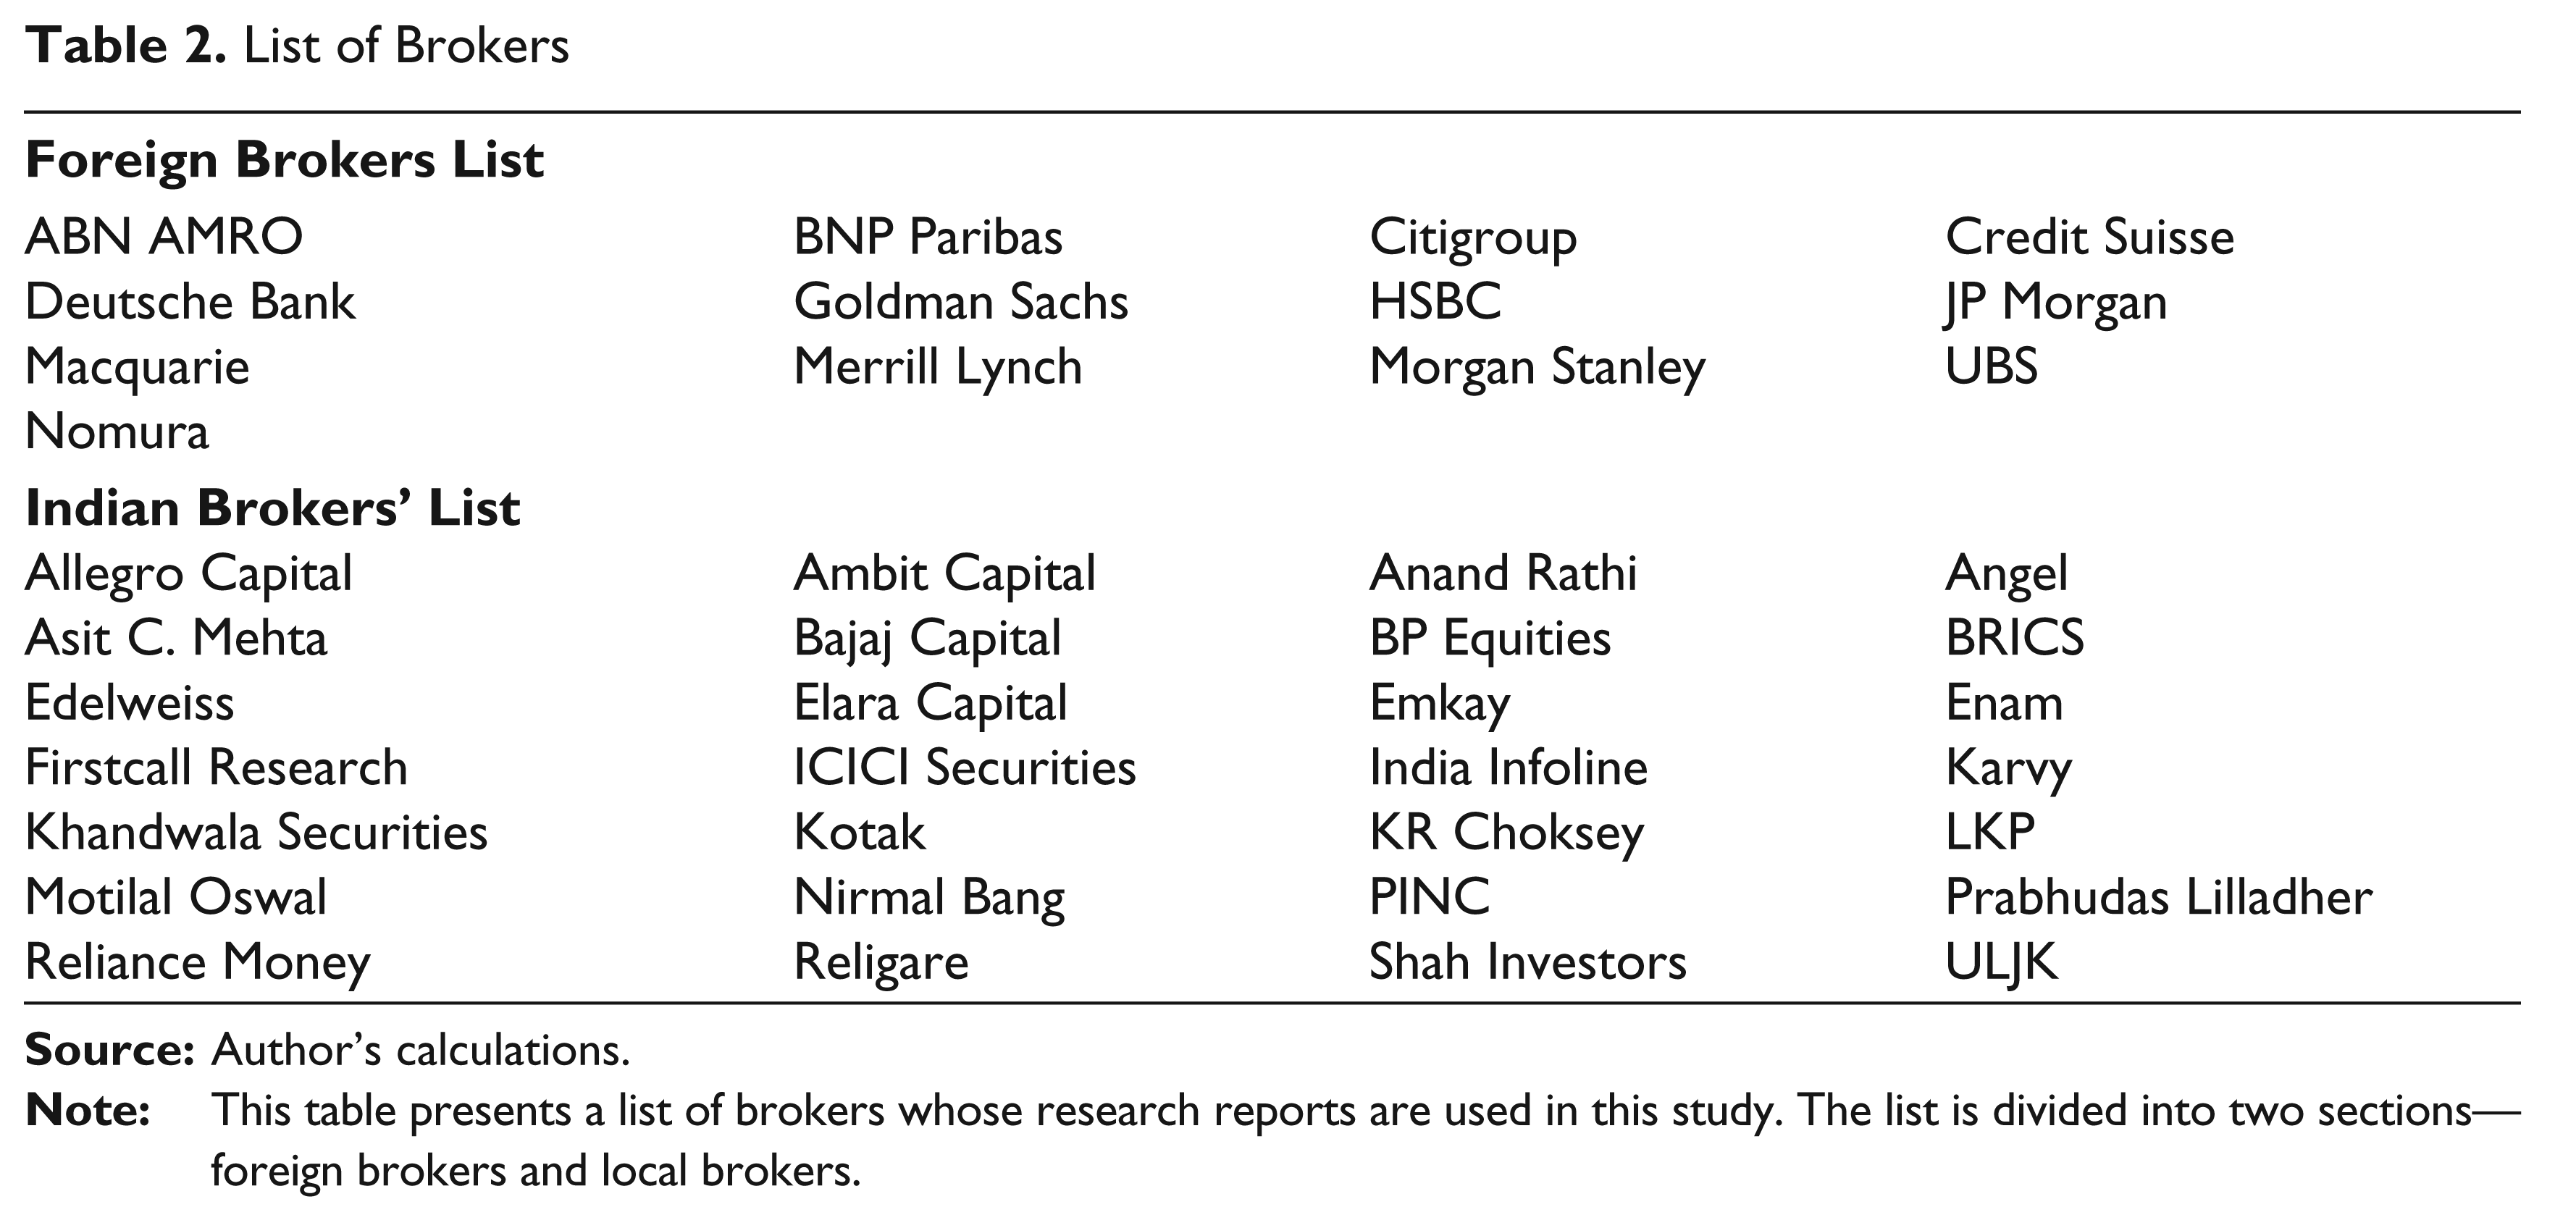
A total of 340 research reports are collected from stocks belonging to Nifty 50 index. National Stock Exchange is the largest exchange in India and Nifty 50 is its index representing stocks having the highest market capitalization. Hold and sell ratings are screened out as this study will focus only on buy ratings. Research reports with buy ratings are collected for a 5-year period between 2007 and 2011 from three databases—ETintelligence, 4 Myiris and Moneycontrol. Table 1 provides a list of stocks being studied and Table 2 provides a list of brokers whose research reports are studied.
List of Stocks Being Studied
List of Brokers
Each research report out of the sample size of 340 research reports is studied in detail to understand the type of valuation being used to determine the target price. Valuation models are divided into three segments as suggested by Asquith et al. (2005)—earnings or cash flow multiples (including price/earnings (P/E), enterprise value (EV)/earnings before interest, taxes, depreciation and amortization (EBITDA) and EV/earnings before interest and taxes (EBIT)), DCF and asset-based valuation. Glaum and Friedrich (2006) and Imam, Barker and Clubb (2008) report that analysts’ use of DCF has increased significantly over the past few years. Hence, an investigation into the type of models used in India can reveal if analysts use DCF models to produce target price forecasts.
Most previous studies on valuation models and TPA have not addressed sum of total parts (SOTP) valuation methods. Damodaran (2010) explains that SOTP is a process where analysts break the company down into individual businesses and then try to value each business, based upon the pricing of comparable firms in that business. It can be interpreted that SOTP models are used for conglomerates having diverse business interests. Interestingly, SOTP is a constant feature of equity research reports issued in India and thus SOTP is the fourth segment in which valuation models will be grouped. Thus, data are arranged in four categories—earnings or EBITDA multiples, DCF, book value (asset)-based valuation and SOTP.
Measures of Target Price Forecast Accuracy
Target price forecast accuracy will be measured using a two-step process. The first step involves calculating TPA—to find if target price has been achieved anytime during the past 12 months. The assumption in this study is that investors buy stocks based on the recommendations of analysts in research reports. TPA will measure if the investment decision made by investor based on analysts target price yields desired results. A study of the research reports shows that analysts primarily issue target price forecasts for a period of 12 months and for an investor to generate profit for broker advice, the target price should be achieved within 12 months following the issue of the research report. To calculate if target price has been achieved in 1 year following the research report date (t), the highest price achieved during the year is calculated and used as a benchmark.
The following conditions are set for calculating TPA:
The TPA is achieved if:
(The highest price achieved in (t + 364) days) = or > (target price recommended by analyst).
The TPA is not achieved if:
(The highest price achieved in (t + 364) days) < (target price recommended by analyst).
The second step involves calculating the forecast error (target price forecast error (TPFE)) for TPA. The TPFE will be calculated at follows:
TPFE = 0 if target price has been achieved.
TPFE = ((TP – max price achieved in 364 days)/TP) if target price has not been achieved.
TPFE provides the percentage by which the target price has been missed. The primary purpose of calculating TPFE is to evaluate which models are closest to achieving their target price. Demirakos et al. (2010) and Bilinski, Lyssimachou and Walker (2012) have used TPFE in their studies to find out by how much analysts tend to miss target price forecasts.
Statistical Set-up
Of the two measures, TPA and TPFE, TPA will be used as a dependent variable for logit regression. It can be observed that the TPA is dichotomous or binary in nature making TPA a dummy variable. According to Gujarati (2011), two limitations restrict the use of ordinary least squares (OLS) for dichotomous dependent variables. He states that, first, the estimated probabilities from linear probability models do not necessarily lie in the bounds of 0 and 1. Second, according to him, linear probability model assumes that the probability of a positive response increases in a linear manner with the level of the explanatory variable, which is counter-intuitive. He expects the rate of increase in probability to taper off after some point. He proposes that binary response regression models can be estimated by the logit or probit models. He further states that the logit and probit models give similar results and a researcher can choose between logit and probit based on the availability of software and ease of application. In this case, the logit regression model will be used for estimating the impact of inputs on TPA. The logit regression will have two variables—beta and promoter holding.
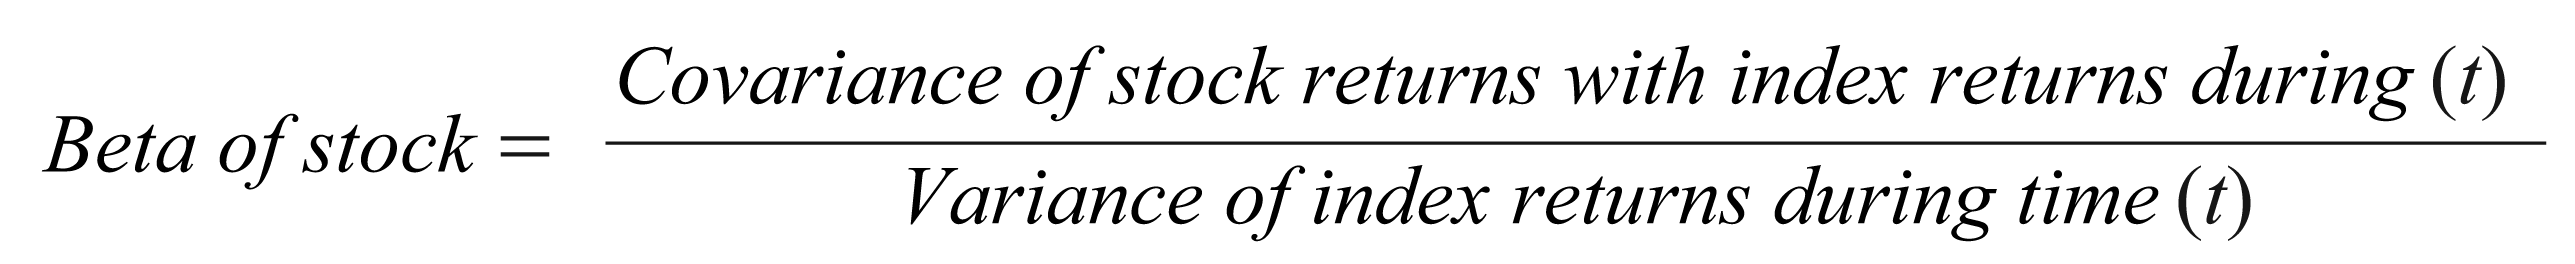
The first variable used in the logit regression is beta or firm-specific risk. Various studies have been conducted on systematic risk and stock returns in India. Narasimhan and Pradhan (2003) find that even though empirical studies have identified several anomalies in the capital asset pricing model (CAPM), it remains the favoured asset pricing model with researchers as well as industry practitioners. Another study supporting the validity of beta has been performed by Manjunatha and Mallikarjunappa (2009) who found that beta, with some of the combinations of independent variables explains the variation in security/portfolio returns. Contrary to these two studies, Basu and Chawla (2010) find that CAPM completely fails in the Indian context and beta and excess returns are negatively related. In a later study, Basu and Chawla (2012) find that arbitrage pricing theory (APT) works in India with inflation and market index playing an important role in determining stock prices. Hence, evidence from India remains inconclusive on the use of beta in forecasting stock returns.
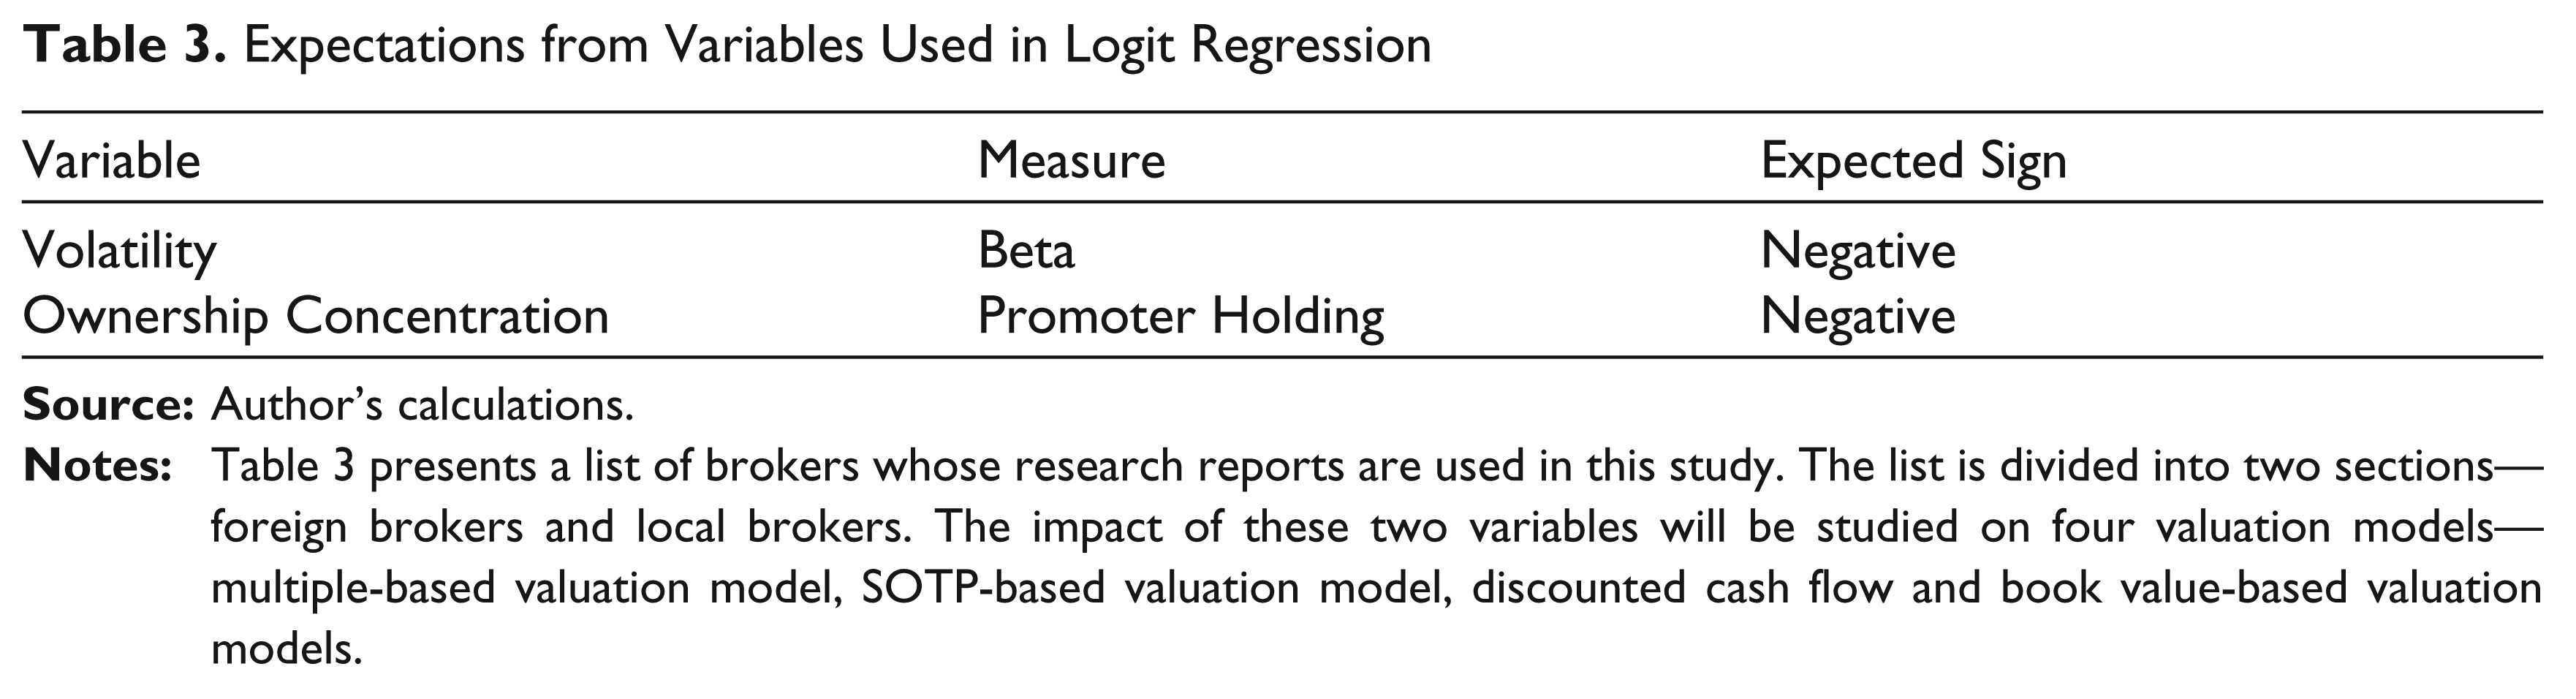
In a study directly linked to TPA, Kerl (2011) finds that volatility is negatively linked with TPA in Germany. And this is expected since analysts should find it tough to predict stocks which are more volatile. Hence, this study will assume that beta will have a negative impact on TPA.
The second variable used in logit regression is promoter holding. Bilinski et al. (2012) state that high promoter holding increases the TPFE for analysts. This effectively means that analysts will be less accurate with their target price forecasts on high promoter holding companies. They feel that ownership concentration may promote private channels of communication between managers and block holders which may reduce the level of transparency thereby negatively impacting analysts’ forecasts.
Further, India’s capital market regulator Securities and Exchange Board of India (SEBI) encourages promoters to reduce their shareholding to create greater liquidity and transparency in stock trading in India. To that extent, SEBI recently passed a circular advising promoters to reduce their shareholding to 75 per cent or less. Hence, this study will assume that high promoter holding may reduce TPA of analysts. However, it needs to be investigated which types of models will be more affected by high promoter holding.
For year (t) during which the rating has been issued, beta is calculated as follows:
A summary of the two variables is provided in Table 3.
Expectations from Variables Used in Logit Regression
The logit formula is stated in terms of the probability that TPA = 1, which is referred to as P (TPA). This effectively means that P (TPA) is the probability that the target price will be achieved. The probability that TPA will not be achieved is stated as (1 − P (TPA)). The regression model will be predicting the logit, that is, the natural log of the odds of the analyst target price forecast being achieved.
The logit equation is framed as follows:
where x1 is beta of stock, and x2 is promoter holding in the company. The coefficients b1 and b2 belong to x1 and x2, respectively. The above logit equation will be used to estimate the impact of these two variables on TPA of four models. Four equations are set up for four models under consideration—multiples, DCF, SOTP and book value.
Statistical Findings
Descriptive Statistics on Valuation Models
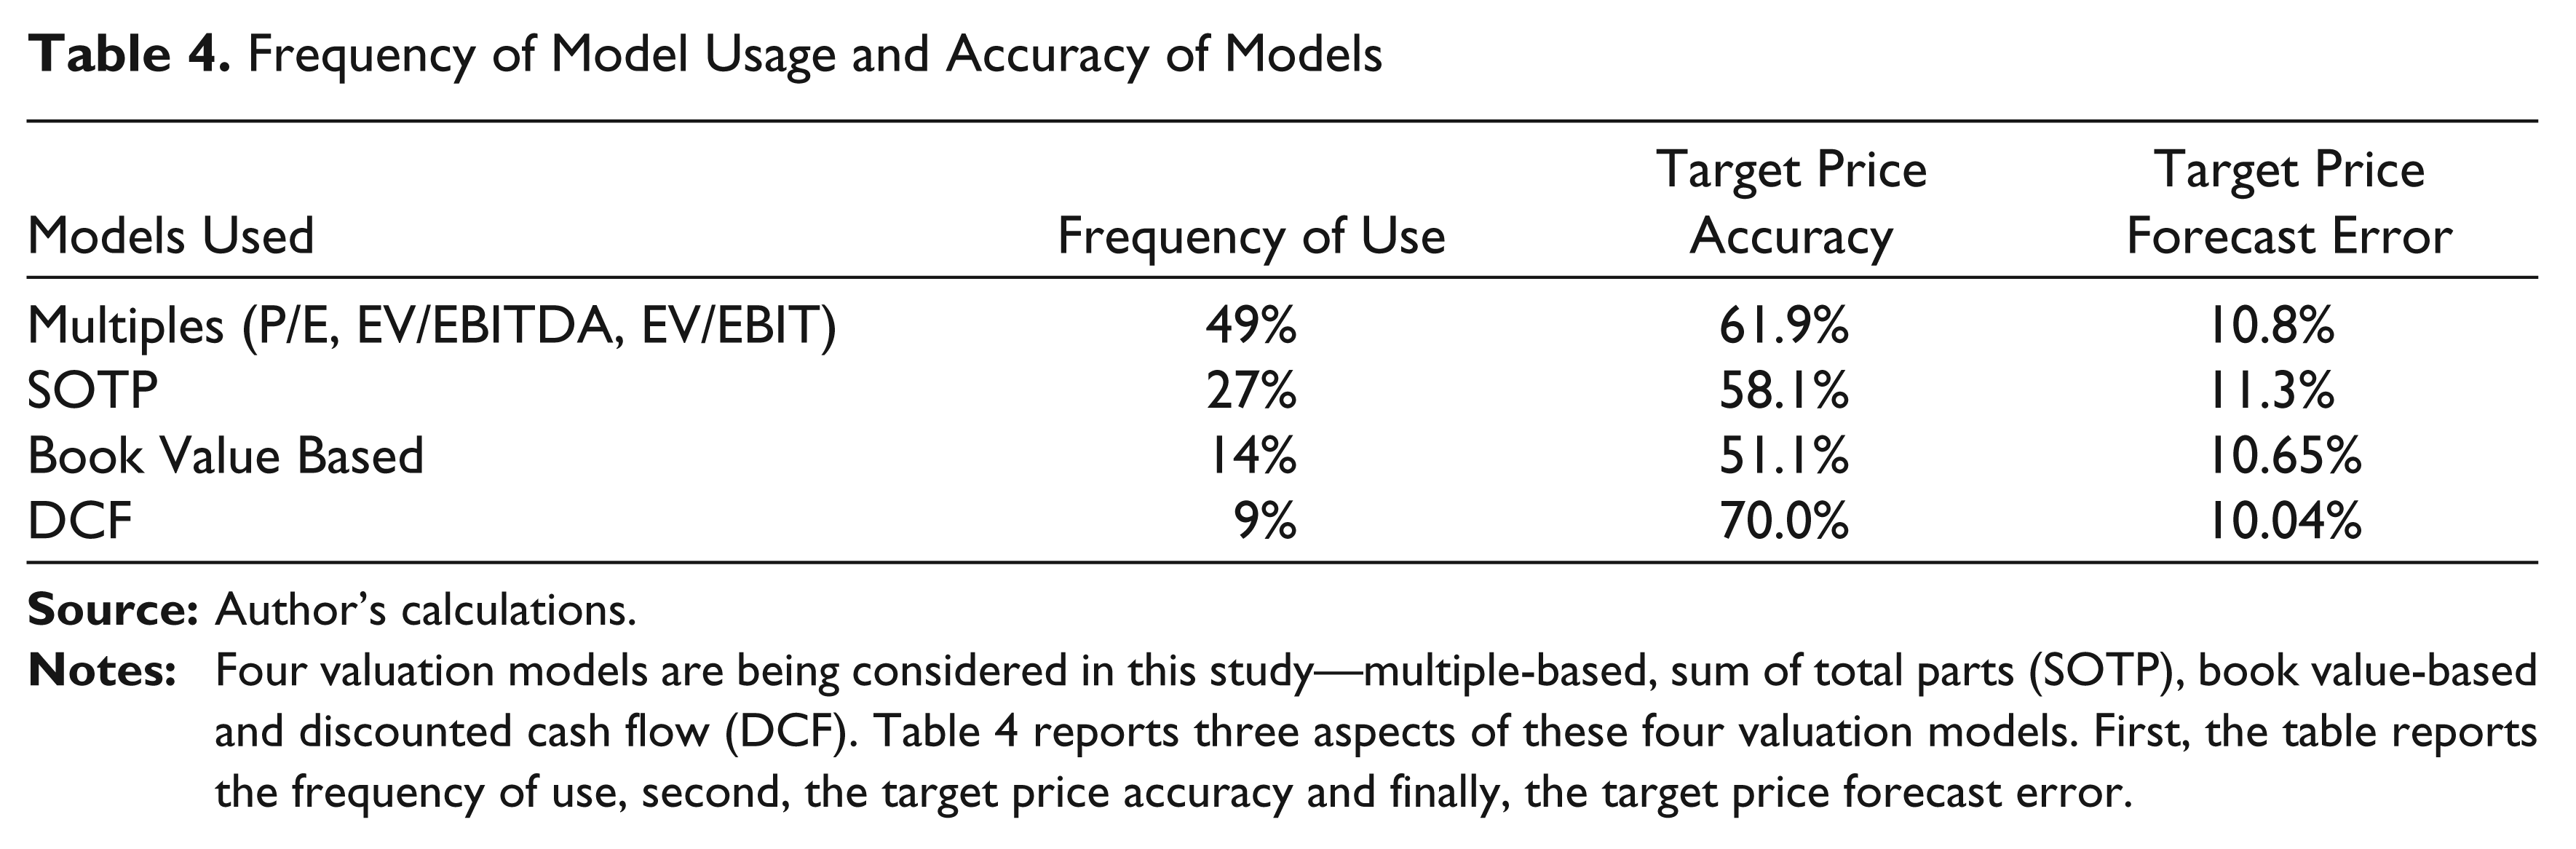
Table 4 presents the findings related to use of models by analysts. The most frequently used model by analysts is heuristic-driven multiple-based valuation models while dividend discount mode (DDM) is the most sparingly used model. Since data on dividend model are very limited, the model has not been addressed in detail in this study. Surprisingly, the least used valuation method DCF provides the best target price forecasts, while asset or book value-based valuation model produces the least accurate forecasts. Overall, analyst TPA for buy ratings in India comes out to be 60.3 per cent for 340 readings.
Frequency of Model Usage and Accuracy of Models
Foreign Brokers Model Usage and Target Price Accuracy
Indian Brokers Model Usage and Target Price Accuracy
TPFE is calculated for each valuation model separately from the readings where target price forecasts have not been achieved. Table 4 illustrates average TPFE for the four models. SOTP-based valuation method has the highest forecast error, while DCF has the lowest forecast error. A lower TPFE for DCF further confirms that DCF provides the best results in Indian equity markets. Overall, TPFE has a range from 1 to 35 per cent and average TPFE is 10.7 per cent.
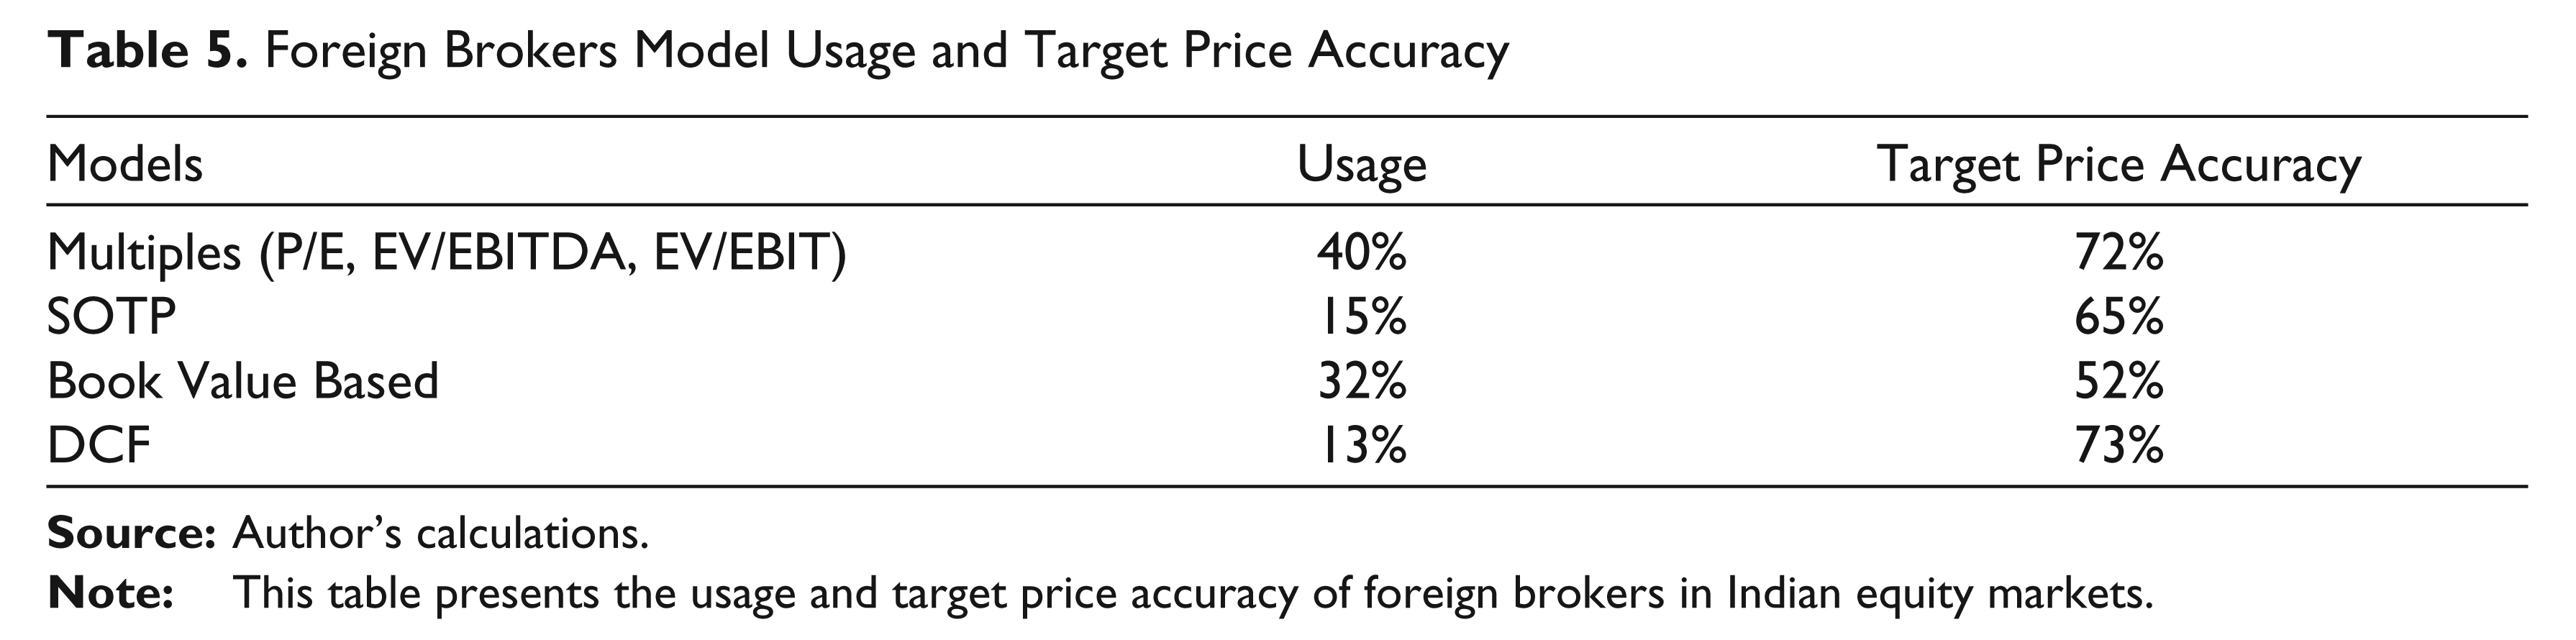
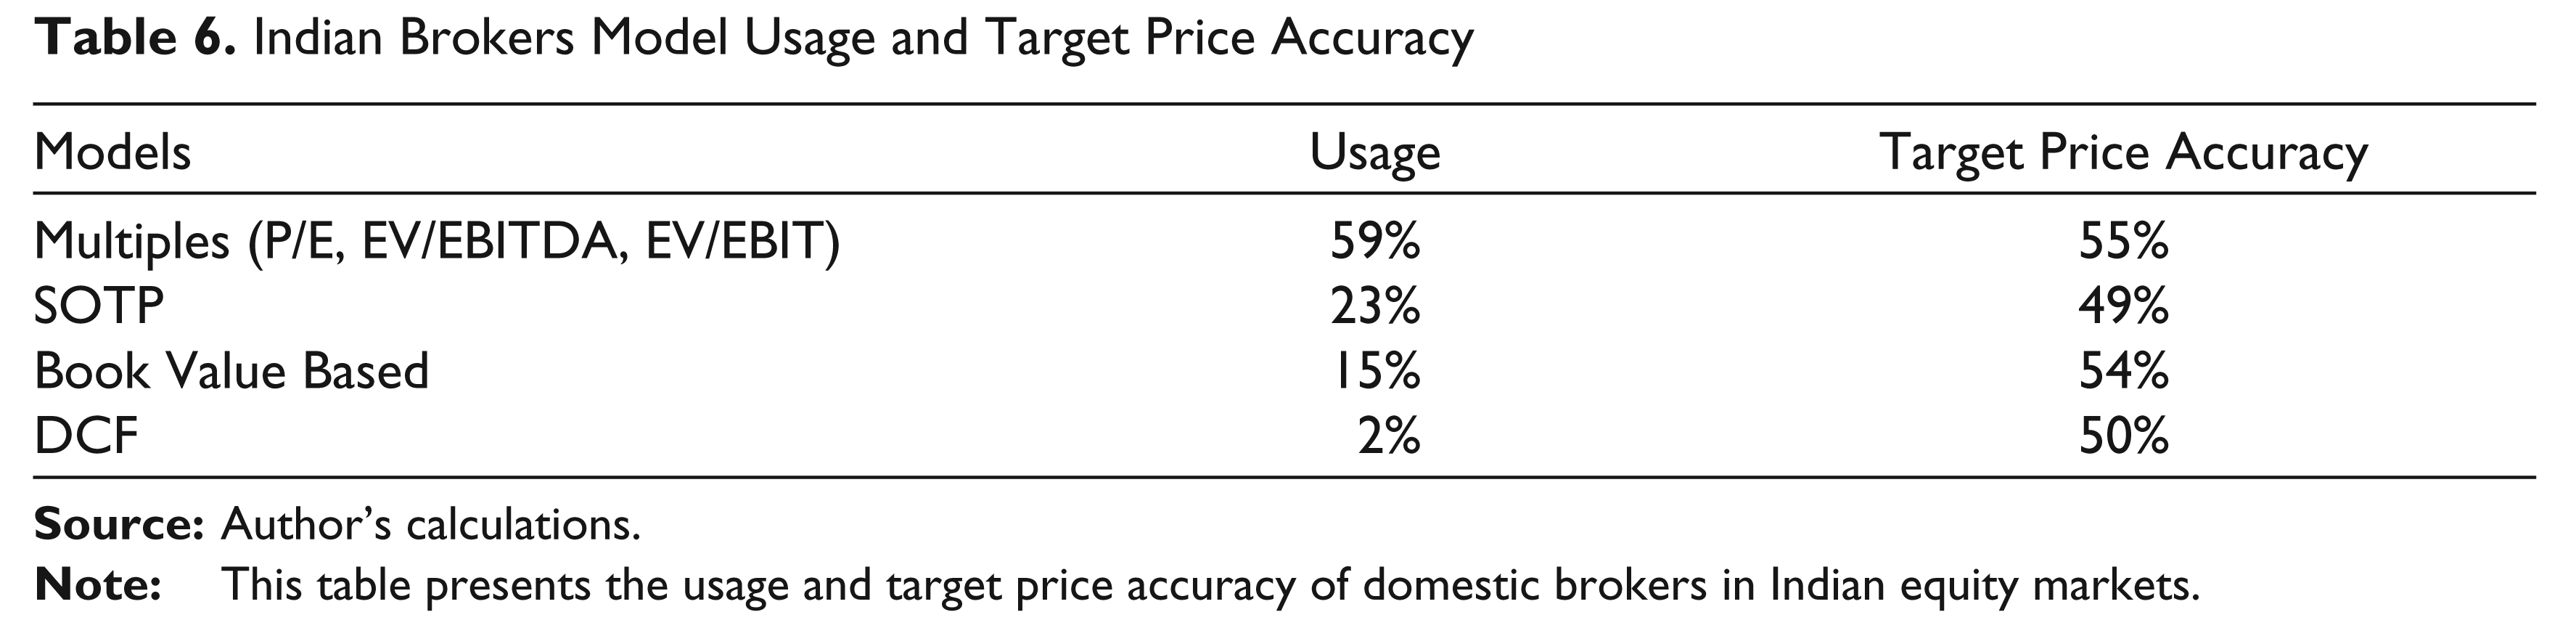
Out of 340 buy recommendations, 170 are issued by foreign broking houses and the remaining 170 are issued by local broking houses. Foreign brokers outperform local brokers with respect to TPA. Foreign brokers have a TPA of 67.3 per cent, while local brokers have a lower TPA of 53.5 per cent. One major reason for foreign broker outperformance is the higher use of the more accurate DCF model. Both local and foreign brokers have the lowest accuracy with book value-based forecasts.
The break-up of usage and accuracy of the four models for foreign and local brokers is provided in Tables 5 and 6, respectively.
Logit Regression Results
Hosmer and Lemeshow (2000) propose that the sample size for logit regression should be a minimum of 10 for every independent variable being studied. Fisher and Wiebe (2006) state that a ratio of number of cases to independent variables should preferably be at least 20. The availability of readings for multiples- and SOTP-based valuation model fulfils the sample size requirement. In case of DCF, 30 readings are available which meets the minimum sample size criterion as two independent variables are used in the logit regression. Further, book-based models have a sample of 40 readings which makes the sample size suitable for logit as the regression has two variables. Hence, all four models have sufficient data to run the logit regression. Table 7 presents the results from the logit regression.
Brooks (2008) states that McFadden R2 is a commonly reported measure of goodness of fit when performing logit regression. In case of multiple-based valuation, DCF-based valuation and SOTP-based valuation, the logit regression has a poor fit with McFadden R2of 1.0, 0.4 and 0.8 per cent, respectively. Further, none of the variables significantly affects any of these three models. Hence, the findings from these three logit regressions can be ignored.
Logit Regression Results for Valuation Models
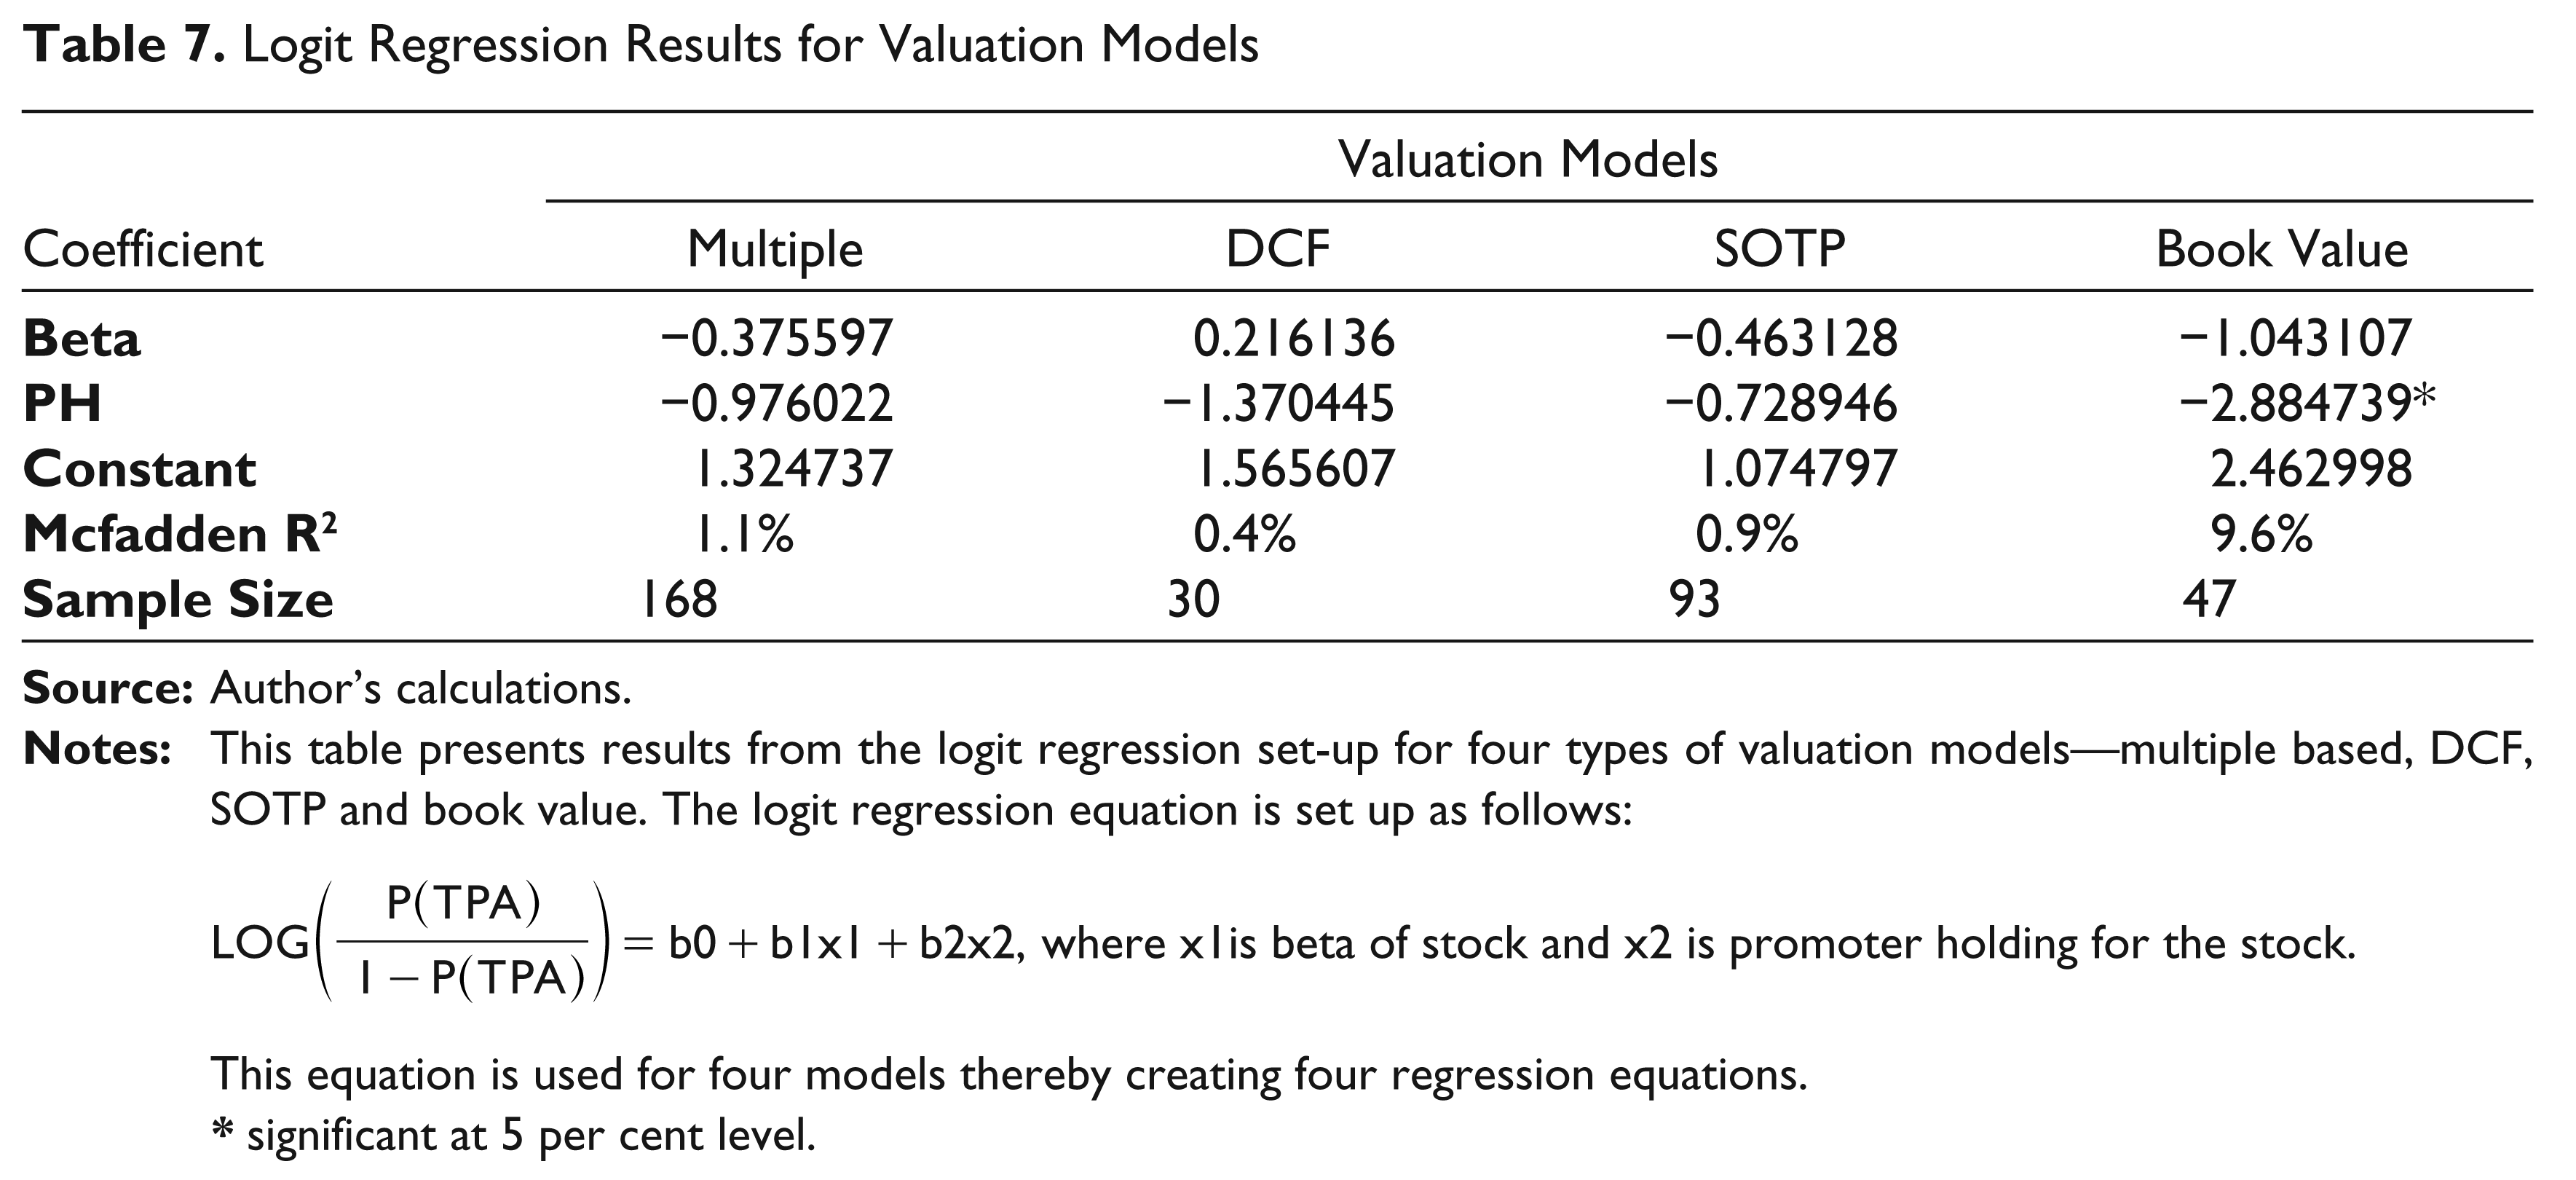
This equation is used for four models thereby creating four regression equations.
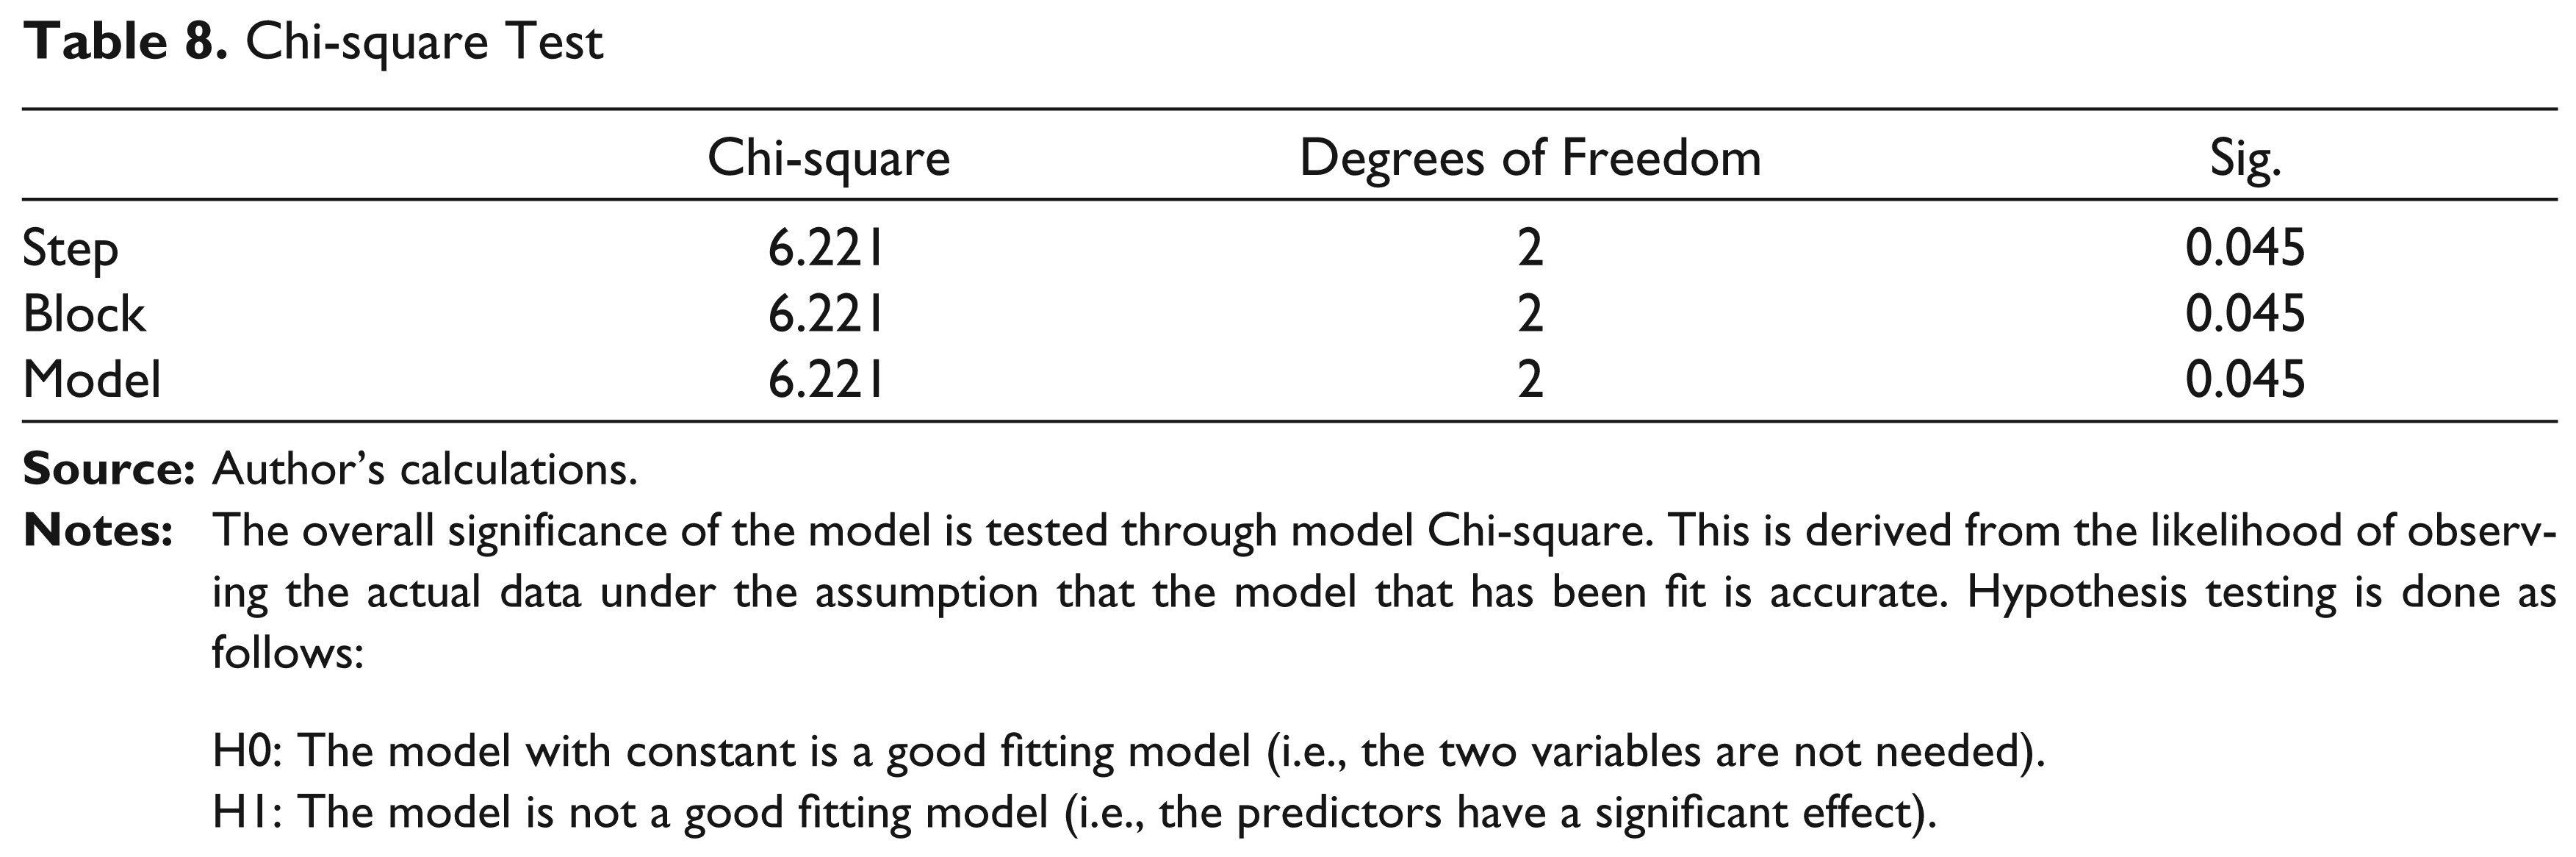
In case of book value-based valuation methods, the McFadden R2is 9.6 per cent and promoter holding is a significant variable. The overall significance of the book value model is tested through model Chi-square. This is derived from the likelihood of observing the actual data under the assumption that the model that has been fit is accurate. Hypothesis testing is done as follows:
H0: The model with constant is a good fitting model (i.e., the two variables are not needed). H1: The model is not a good fitting model (i.e., the predictors have a significant effect).
Chi-square has a value of 6.221 for 2 degrees of freedom as shown in Table 8. The p value is significant (p < 0.05) indicating that the null hypotheses can be rejected. So, the model containing only the constant is rejected and the two predictors do have a significant effect on TPA of book value-based models.
Chi-square Test
H0: The model with constant is a good fitting model (i.e., the two variables are not needed). H1: The model is not a good fitting model (i.e., the predictors have a significant effect).
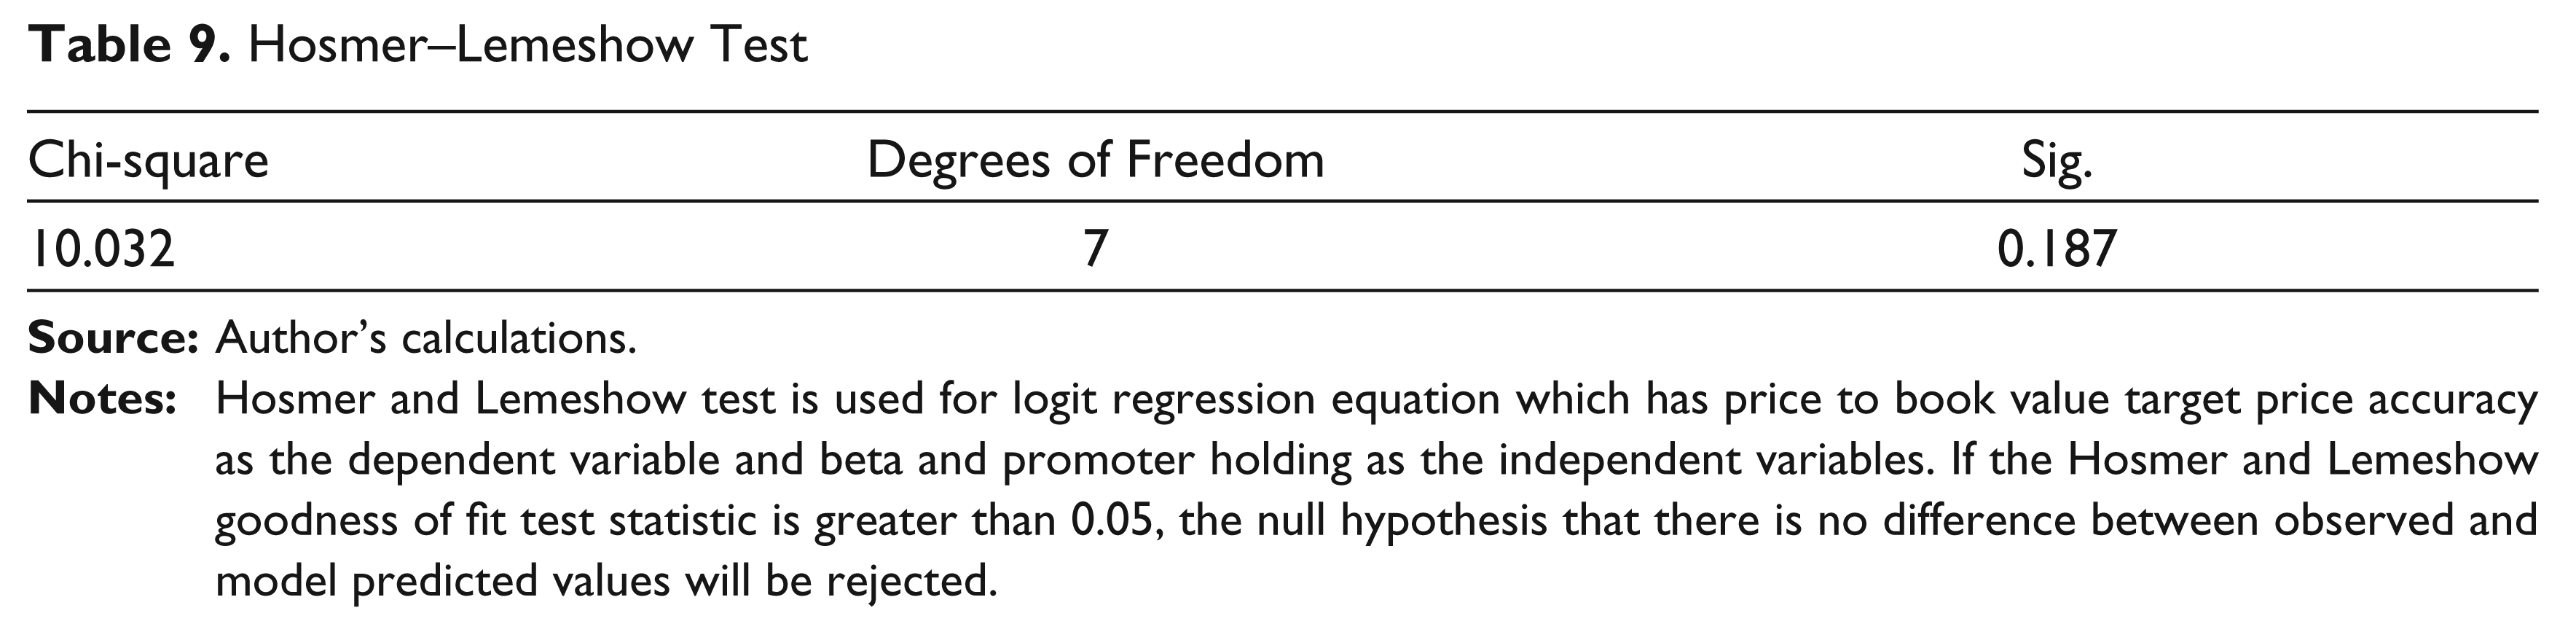
Burns and Burns (2008) state that if the Hosmer and Lemeshow goodness of fit test statistic is greater than 0.05, the null hypothesis that there is no difference between observed and model predicted values will be rejected. They further add that this will imply that the model estimates fit the data at an acceptable level. They state that the desirable outcome of non-significance indicates that the model prediction does not significantly differ from the observed values. In this case, the level of significance form Table 9 fails to reject the null hypothesis and the model predicted values are not different than the observed values.
Hosmer–Lemeshow Test
Thus, promoter holding is inversely and significantly related with TPA of book-based valuation methods. This indicates that analysts will be more accurate with book-based valuation method when they use it on companies with low promoter holding. Even though beta is insignificant, a negative coefficient indicates that book-based valuation may not be suitable for high beta stocks.
The logit regression equation for book-based valuation can now be rewritten as:
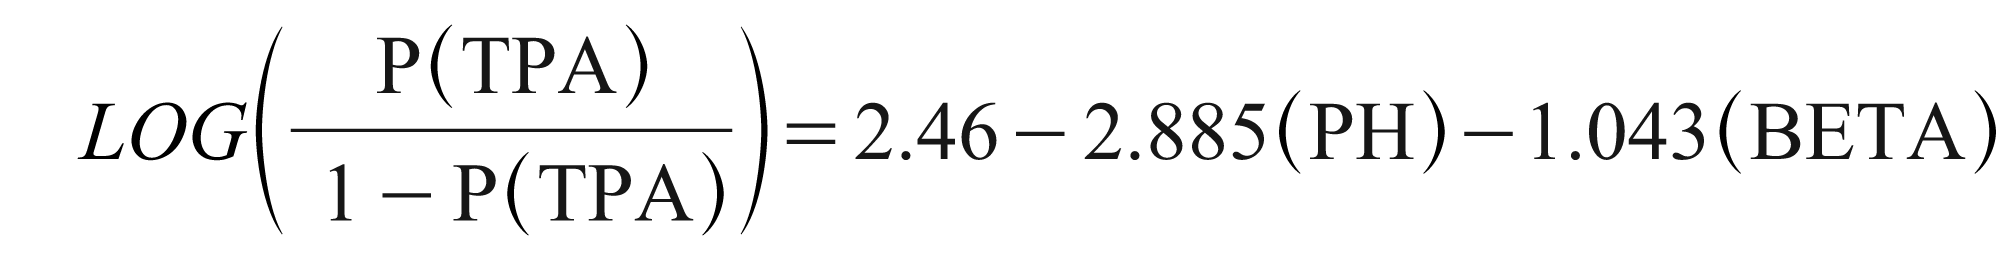
To summarize, first, the logit regression results reported poor fit (low pseudo R2) for multiples, DCF and SOTP-based valuation models indicating that the two variables may not affect TPA of these three models. However, for book-based valuation models, pseudo R2 and Hossmer and Lemeshow test reveal that the two variables under consideration are adding credible value to the predictive ability of book value model. In other words, book-based valuation models are in a better position to forecast TPA after considering the negative effect of these two variables. As expected, both variables negatively affect TPA.
The exponential function of promoter holding indicates that with a 1 per cent increase in promoter, the TPA will fall 0.056 times and conversely with every 1 per cent fall in promoter holding, the probability of getting the target price right will increase by 0.056 times. But why does promoter holding affect TPA for book-based valuation method? The interpretation could be that analyst estimates of book value and promoter estimates of book value do not match. This means that promoters may be inflating their asset values thereby leading analysts to believe their assets have higher book value. Analysts end up preparing their target price forecasts on these inflated book values thereby reducing their TPA.
It can be seen that promoter holding does not affect TPA of earnings or cash flow-based forecasts which means that promoters are less willing to inflate earnings and cash flows as compared to book values. Inflated asset values probably can be associated to the fact that assets act as collateral for loans and companies tend to be in regular need of loan funds for expansion in an emerging market.
Conclusion
Analysts have the highest TPA of 70 per cent with DCF and they have an accuracy of 61.9 per cent for EBITDA or earnings multiple-based forecasts. Analysts produce below average target price forecasts with SOTP valuation methodology and they have the lowest accuracy with asset-based valuation methodology. Thus, analysts are able to forecast cash flow and earnings better than estimate assets of a company. Promoters and analysts are on the same page with respect to earnings and cash flows, but they differ with respect to book values. Promoters probably report inflated assets which lead to inflated target price forecasts and lower TPA. It appears that cash flow- and earnings-based forecasts are the best bet for creating target price forecasts in India.
The underperformance of book value-based valuation method is in contrast to recent findings of Imam et al. (2013) in UK where they find that book value- and ROE-based forecasts produce best results. The nature of economy, institutional infrastructure and reporting standards can thus play an important role in choosing a valuation method for equities. In case of India, the Ministry of Corporate Affairs plans to implement International Financial Reporting Standards (IFRS) starting 1 April 2015 (Bansal, 2013) indicating that accounting standards are still in a development phase. The evolving reporting standards give space to promoters to report the asset base as per their convenience.
In a low promoter holding company, the management is much more professional and transparent because the controls of the company lie with a broader base of shareholders. Bilinski et al. (2012) report in their study that target price forecast accuracy improves after the mandatory IFRS adoption for 14 countries in their sample. Thus, the adoption of IFRS may improve accuracy of book values-based target price forecasts and this may further improve the overall TPA of analysts in India.
SOTP-based valuation methodology produces below average target price forecasts and the highest average TPFE. SOTP model is based on the premise that a business is best valued when analyzed in parts and then put together. The below average performance of analysts with respect to SOTP model brings out the proposition that analysts tend to value companies with individual business lines better than conglomerates having diverse lines of business. One reason for lower TPA could be the fact that the management of a conglomerate may change focus from one business to another in the future which the analyst may not be able to foresee.
DCF has the lowest average TPFE which further confirms the superiority of DCF in Indian markets. Interestingly, DCF is the least frequently used model with only 9 per cent of analysts preferring to use DCF in the given sample size of 340.
EBITDA or earnings-based multiples are the most frequently used models indicating that analysts rely more on heuristics-driven models rather DCF or book value-based valuation methods. The above average TPA of EBITDA or earnings multiples vindicates analysts decision to use these heuristics-driven models in forecasting target prices.
The findings from India are in line with results reported by Asquith et al. (2005) in US markets. They also report that multiples- and DCF-based models produce higher target price forecasts as compared to asset- or book value-based target price forecasts.
Analysts hardly use DDM in India—only 2 out of the 340 sample have mentioned DDM as the model of choice. Thus, analysts primarily focus on growth while developing their target price forecasts. Emerging markets are typically associated with high growth and this study proposes that market participants want returns from capital gains, not dividends in emerging markets.
This study is purely dedicated to Indian equity markets and it remains to be seen if these findings can be validated across emerging markets. This limitation can be an area of further research—Which models produce best target price forecasts across emerging markets? Another limitation of this study is that DDM has not been considered because of lack of availability of DDM-based target price forecasts.
Thus, investors should note that analysts produce the best target price forecasts when target price forecast are based on DCF or EBITDA or earnings-based valuation models in India. Analysts should take this research as a feedback on their choice of valuation models and TPA. Analysts should be careful with their forecasts on book values as they are least accurate with book value-based forecasts. Analysts have an overall TPA of 60.3 per cent which is higher than TPA of 55.9 per cent from 16 countries reported by Bilinski et al. (2012). Thus, analysts in India are producing target price forecasts which are beneficial to investors and they can significantly improve this accuracy by focusing more on earnings or cash flow-based models rather than book value-based models.