






Abstract
The aim of the article is to analyze and evaluate technical efficiency scores of public sector banks (PSBs) in India. The study also determines the nature of return to scale (RTS) of individual banks and thereby identifies the leaders and laggards in the PSBs. To measure the extent of overall technical efficiency, pure technical efficiency and scale efficiency (SE), the non-parametric approach, that is, data envelopment analysis (DEA) is used to determine the causes of inefficiency. The sample of the study includes 26 PSBs operating in India during the time period from 2007–2008 to 2011–2012. The results show that although the PSBs have more or less similar efficiency scores, that is, higher than 0.900, still out of 22 banks falling in the category of efficient banks in 2007–2008, only 7 of them were left by the year 2011–2012. Overall analysis of PSBs during the time period of the study explains that a greater part of inefficiency among PSBs is attributed to scale inefficiency. In addition, the number of banks operating at constant return to scale (CRS) came down to 9 in 2011–2012 from 23 in 2007–2008. Simultaneously, there was a reduction in leaders and increase in laggards. It is suggested that banks must optimize their scale of operations and adopt technological innovations.
Keywords
Introduction
Today, after 22 years of liberalization, India has an exhilarating banking sector. Liberalization and deregulation process have made a sea change in the banking system. From a fully regulated environment, banking has gradually moved into a market-driven competitive system. Increasing competition is fragmenting the share of profitability of banks and forcing them to work efficiently. Public sector banks (PSBs) have always dominated the banking scenario in India with their economic, national as well as social objectives. Since 1991, banks in the public sector accounted for as much as 91 per cent of the total assets as against their counterparts in the private sector with just 3 per cent and foreign sector with 6 per cent only (Choudhary & Tandon, 2010; Nandy, 2010; Purohit, 2012; Reserve Bank of India, 1991). Even today, PSBs rein the market with 73 per cent market share of assets and 83 per cent of branches (D. Subbrao, Former Governor, Reserve Bank of India, 2013).
But in such a stiff competition, with strong rival players, economies of scale and scope have to be exploited to face the competition. As a result, efficiency becomes the most critical objective. Hence, in the present article, an attempt has been made to analyze the efficiency performance of PSBs. The article is divided into in various sections. The first section, given above, is the introduction and the second section reviews the related studies available in the literature. The third section discusses objectives of the article. The fourth section outlines the econometric framework, input–output selection for DEA and methodology used in the article. The fifth section reports the empirical results. Finally, the sixth section concludes the study.
Relevant Literature Review
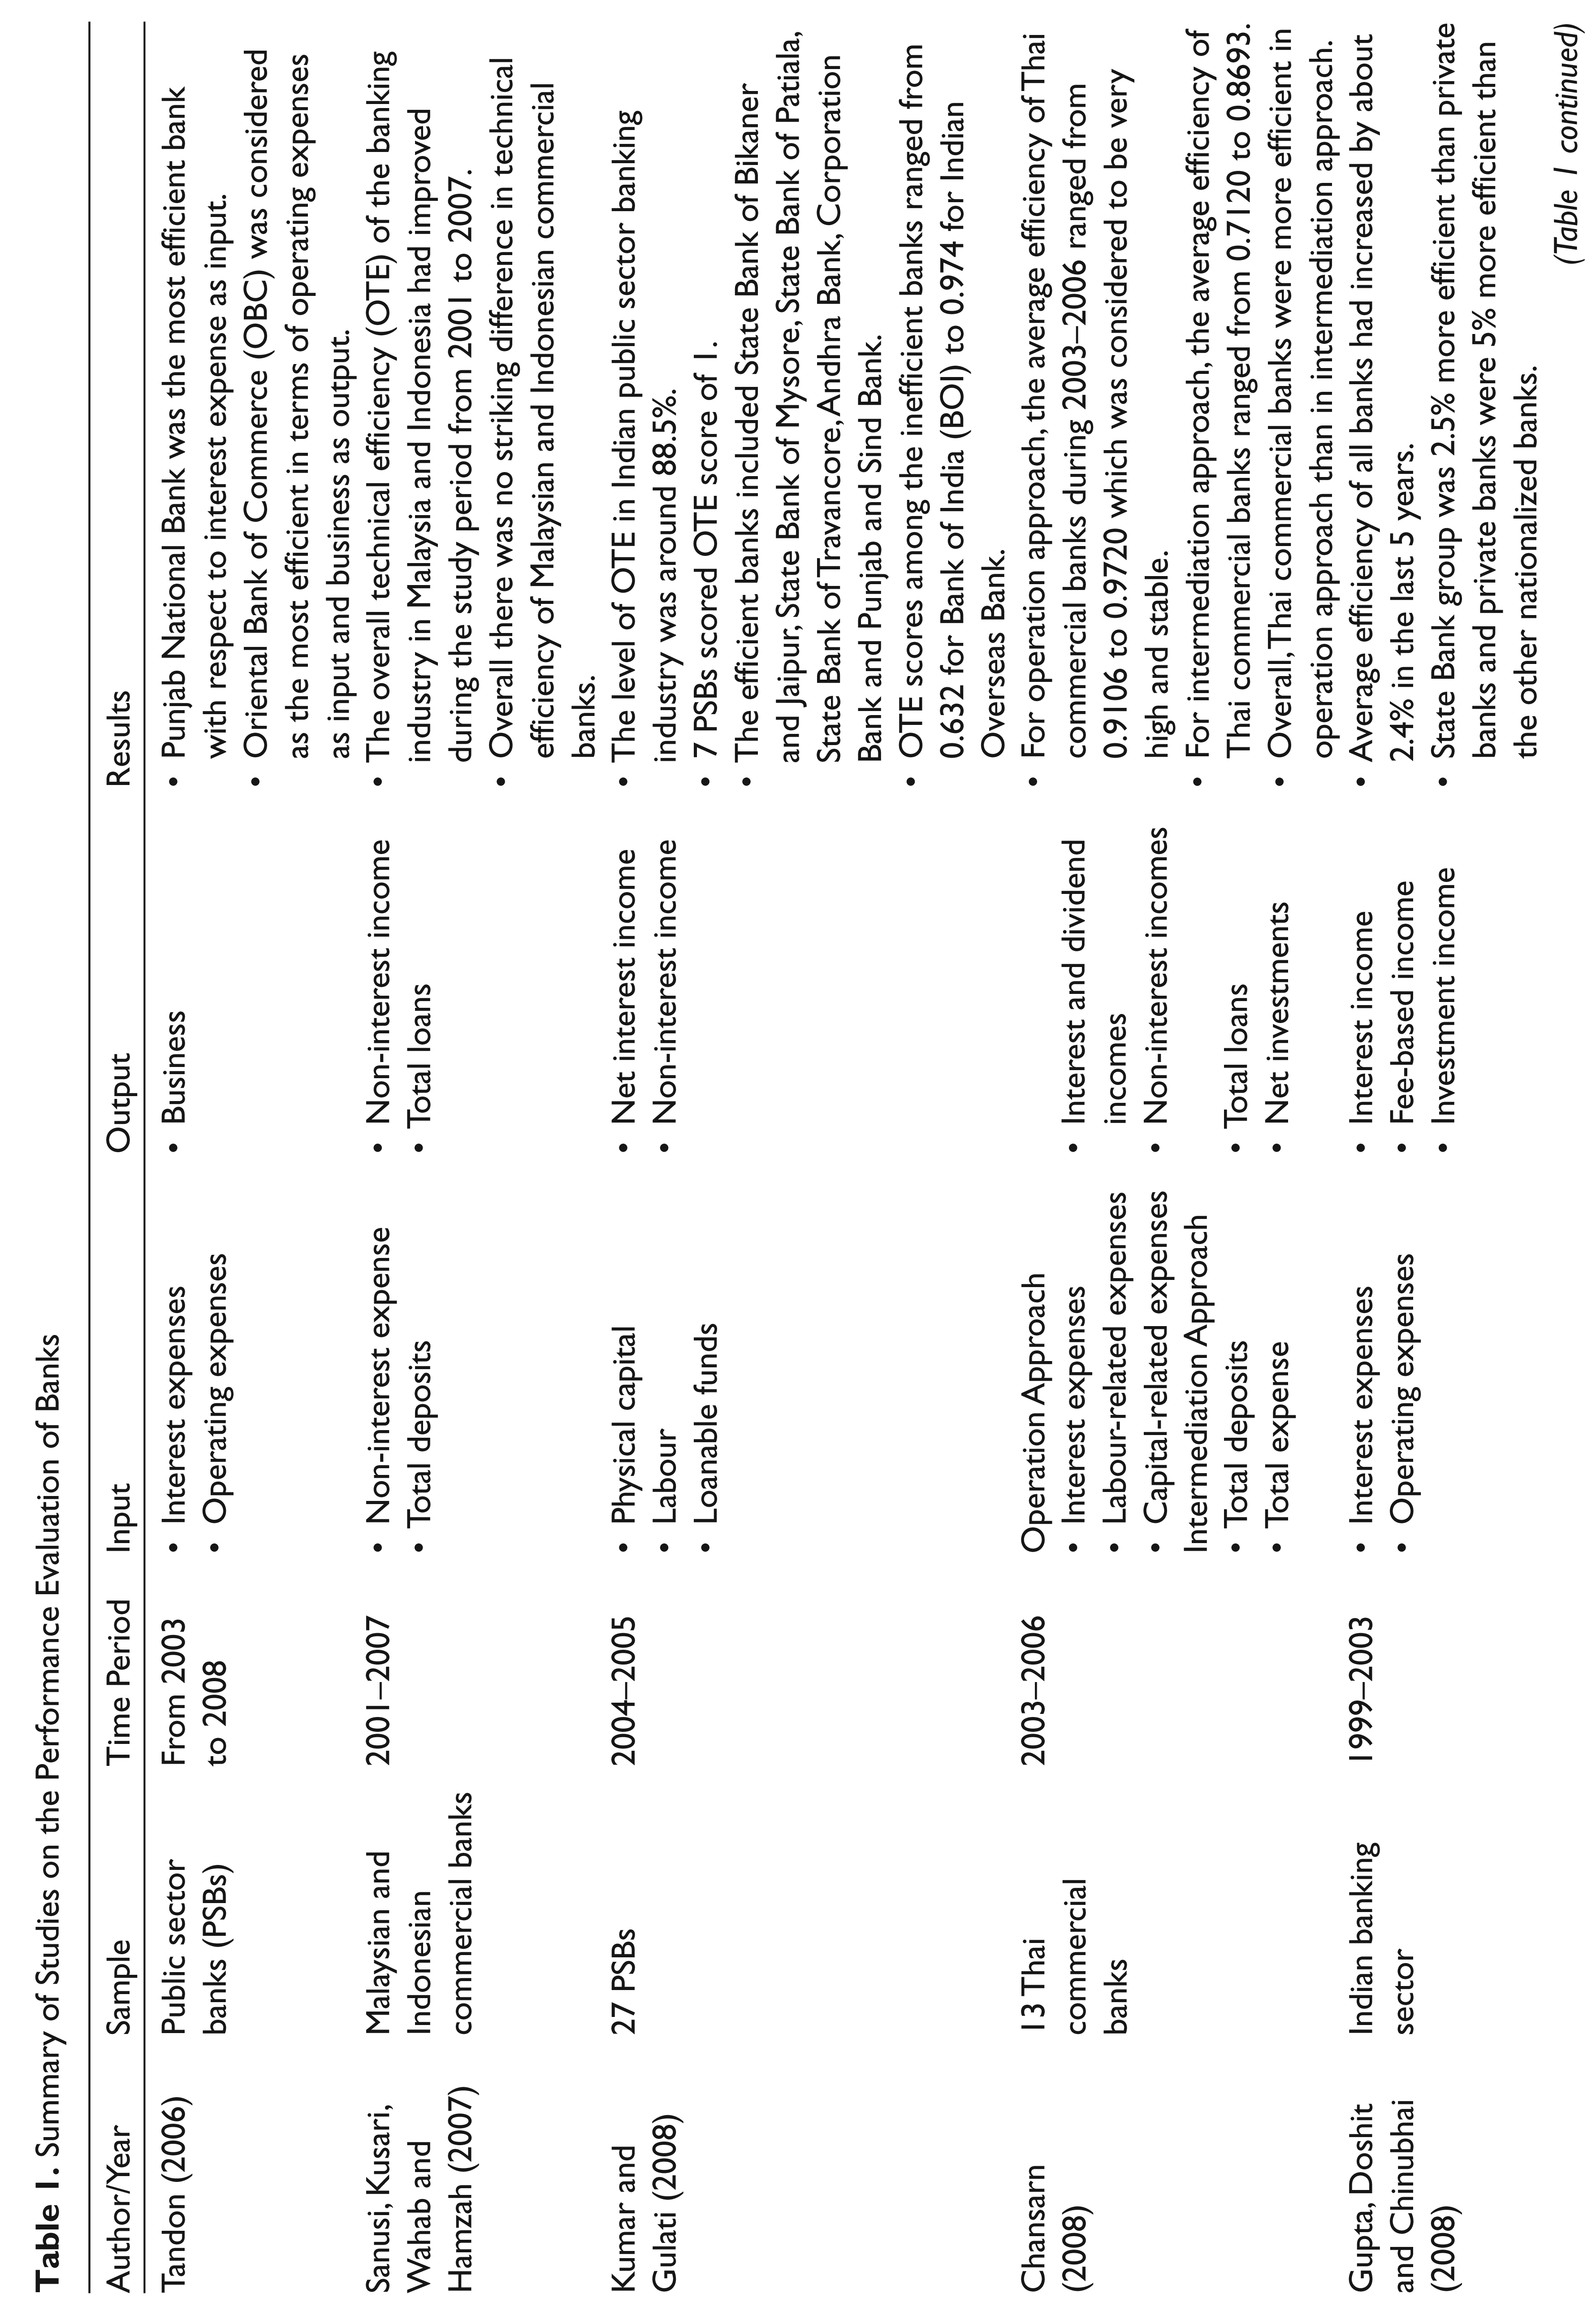
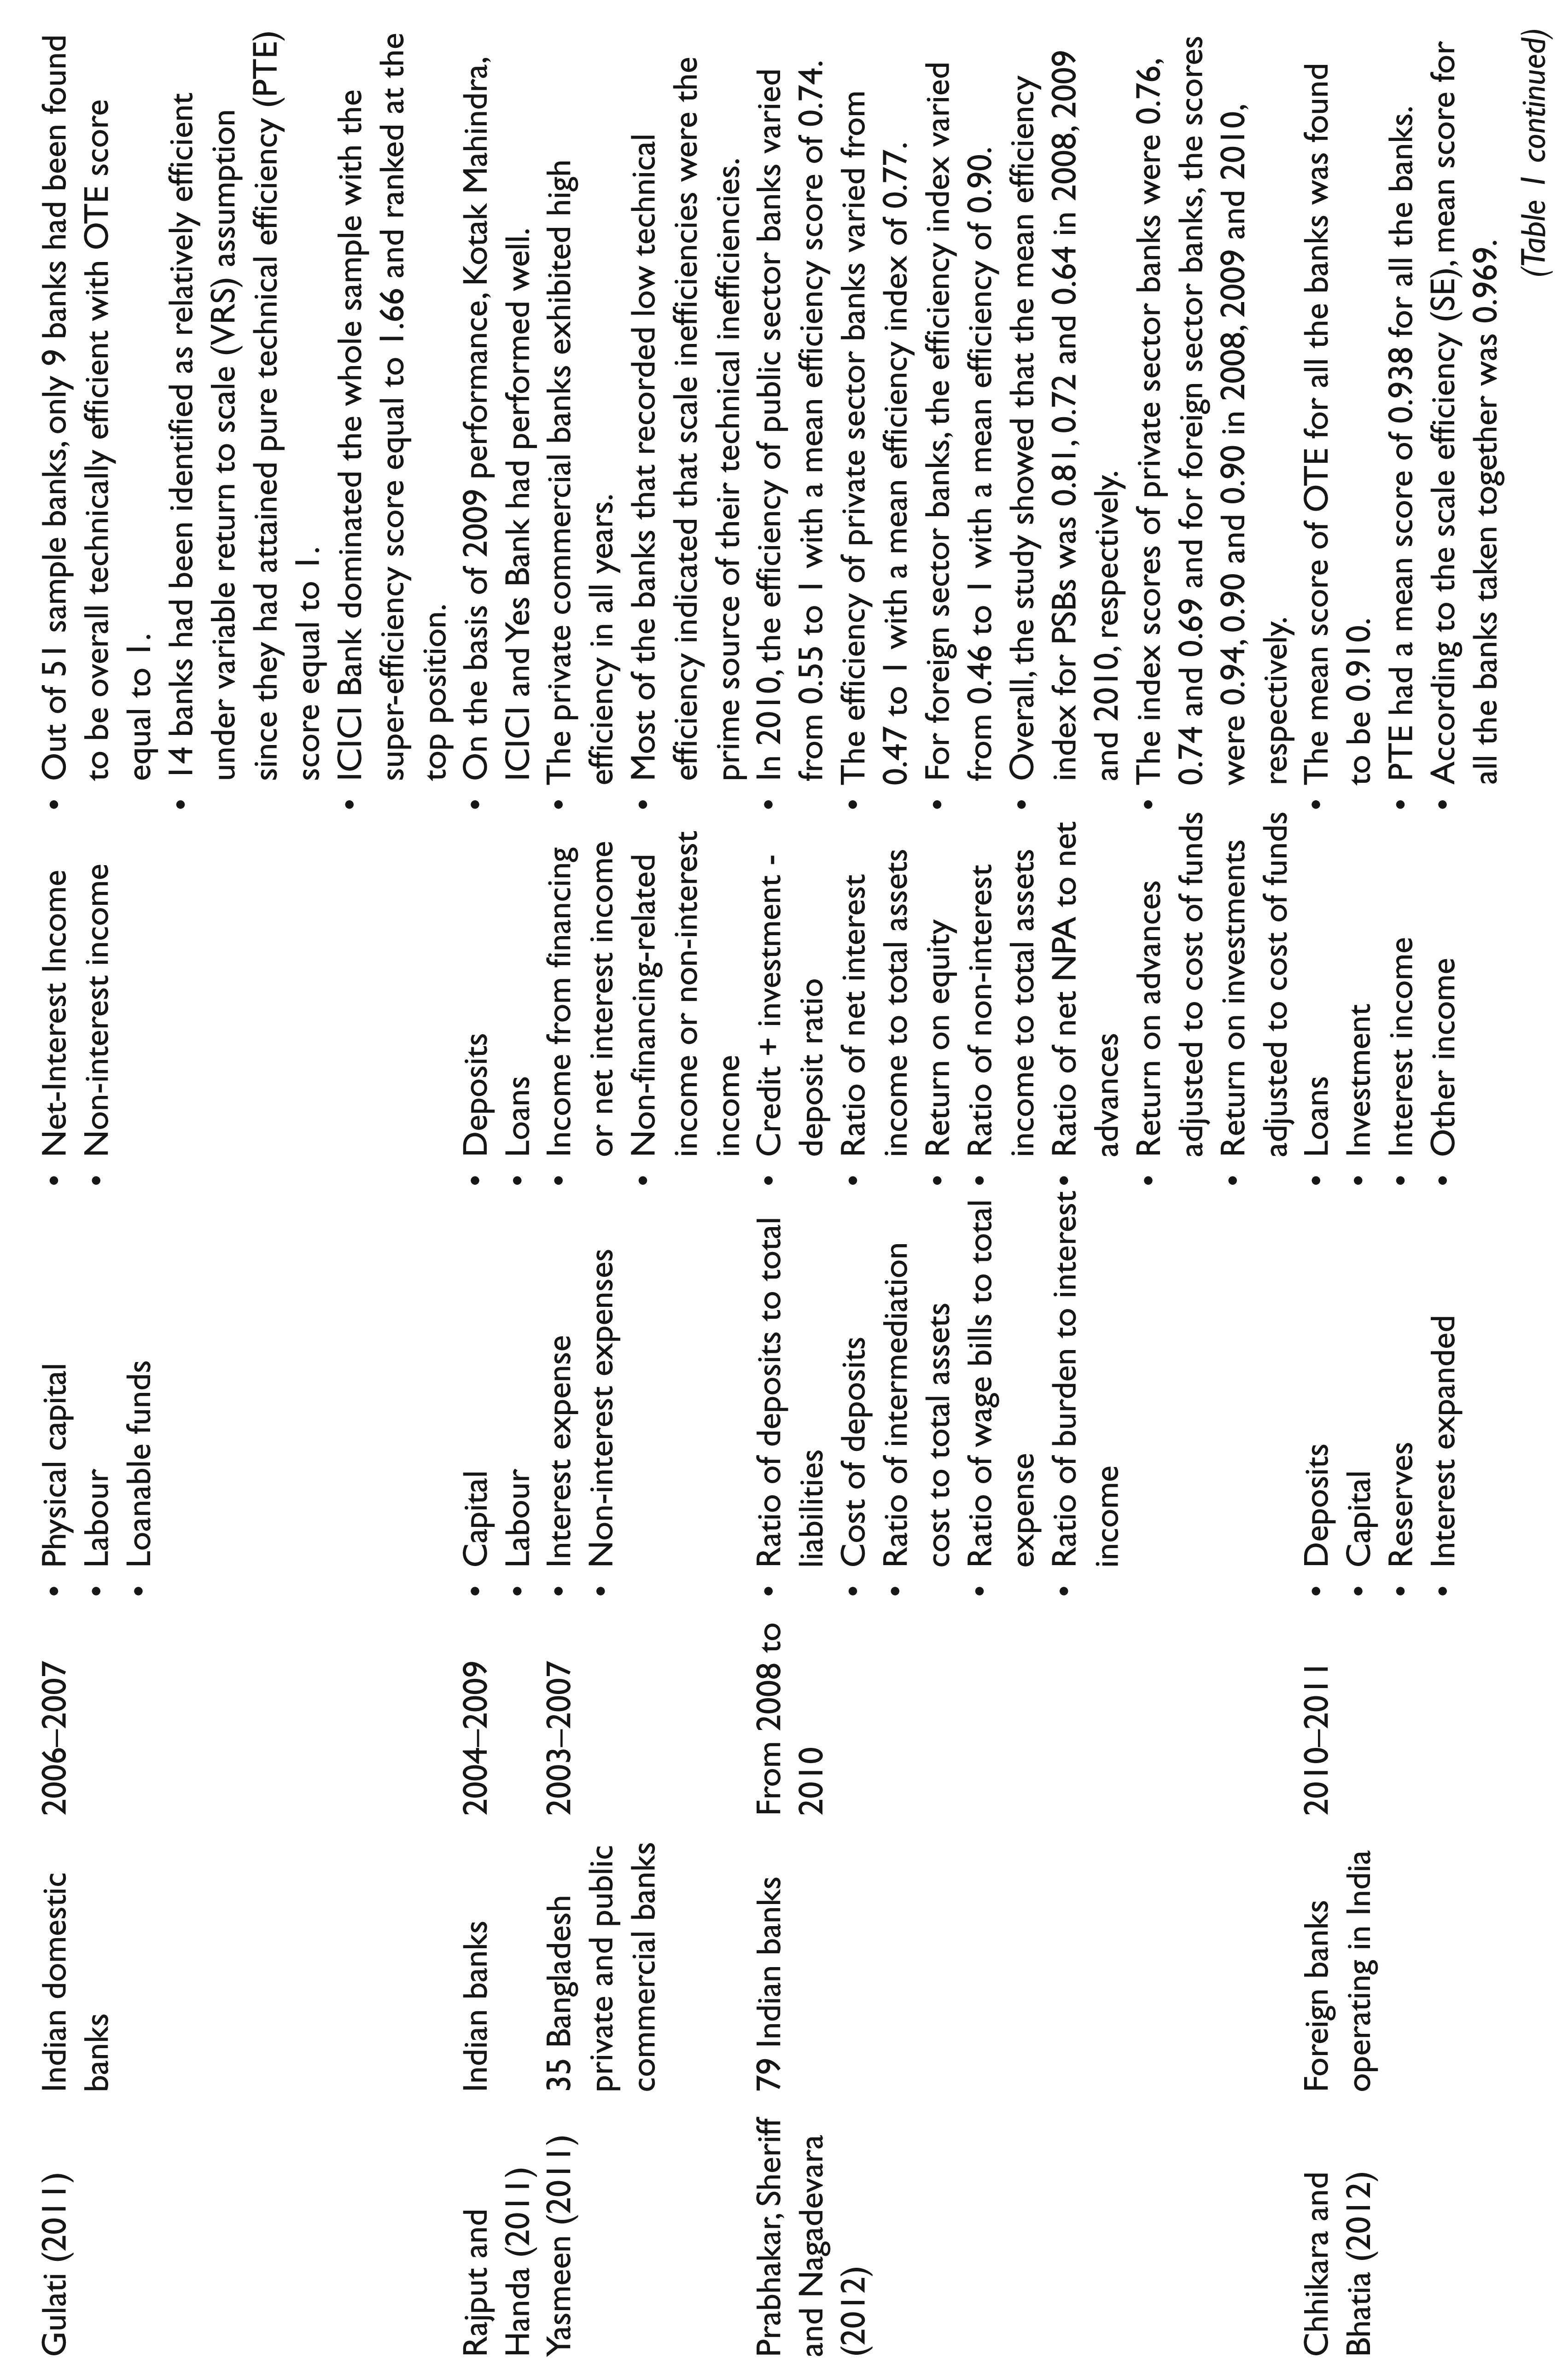
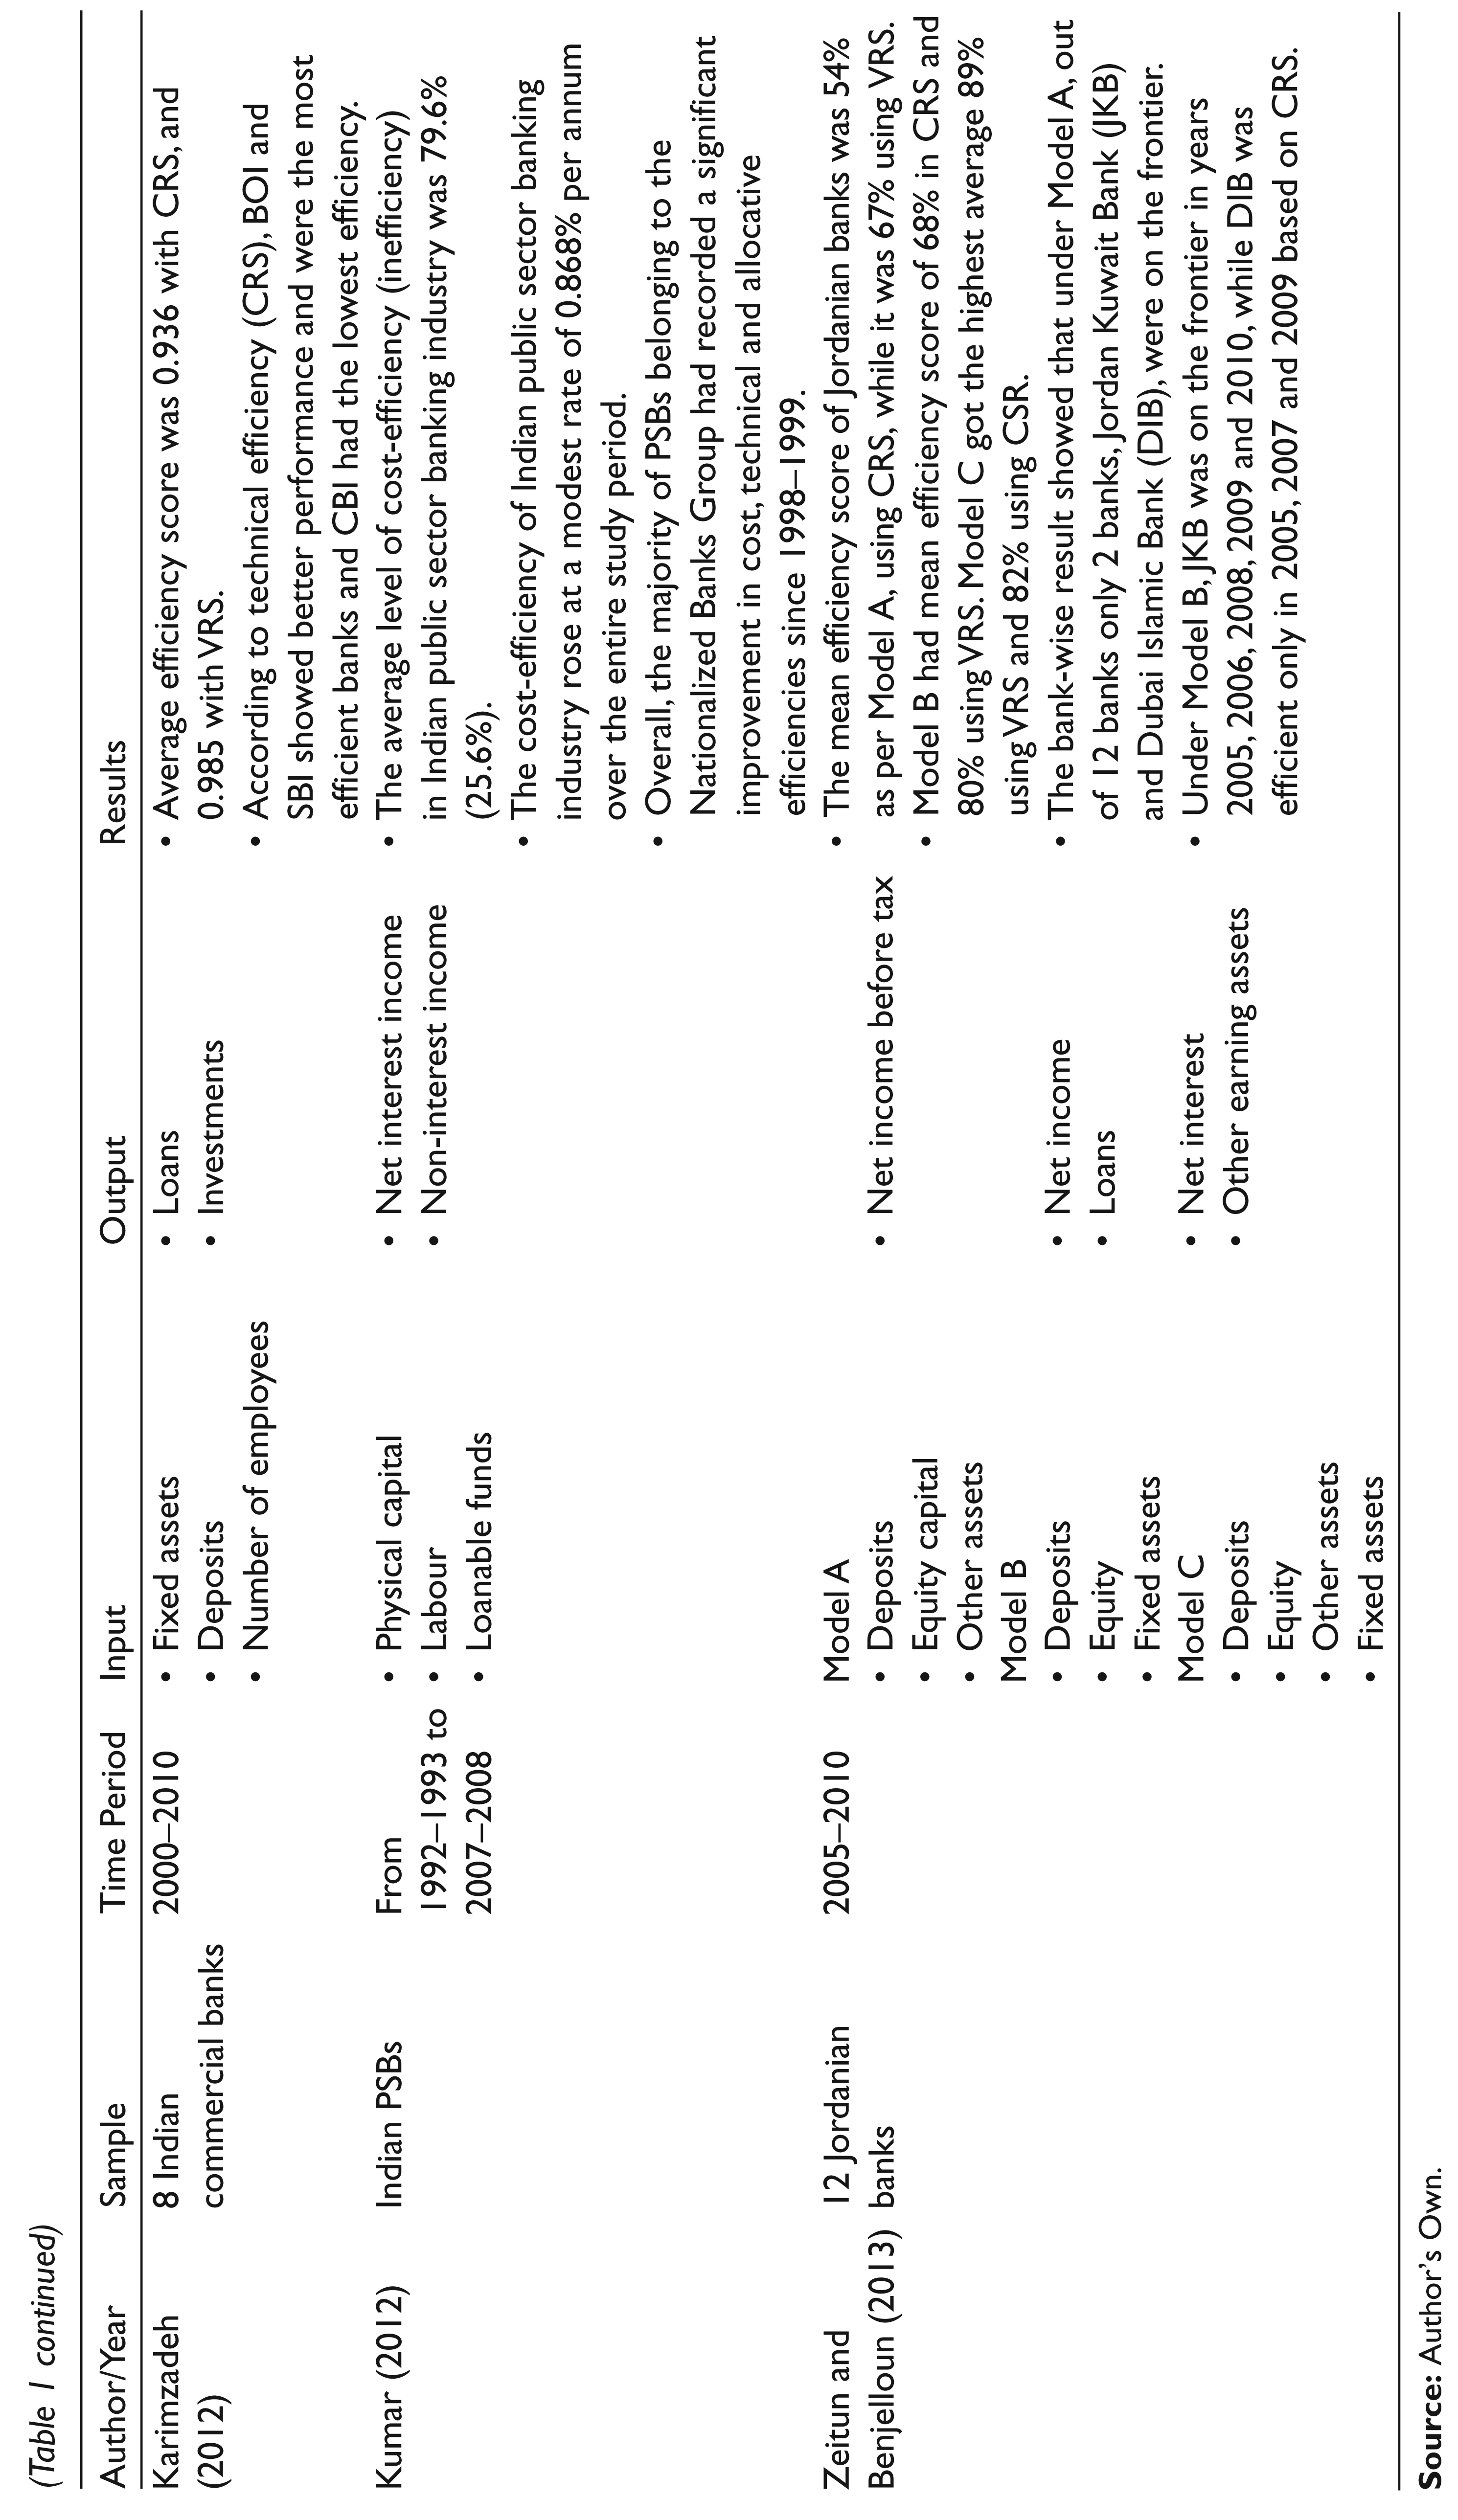
An adequate amount of studies which have evaluated efficiency of banks have been discussed. Table 1 shows the summary of these studies.
The review of literature highlights how a number of studies have analyzed the technical efficiency of the banks. However, only a small number of studies specifically concentrate on measuring the efficiency of PSBs (Bala & Kumar, 2011; Kumar & Gulati, 2008; Kumar, 2012; Noulas & Ketkar, 1996; Saha & Ravishankar, 2000; Tandon, 2006; Tandon, Ahuja & Tandon, 2009). Also, majority of these studies belong to an old period of time representing the pre-reform era (Bhattacharyya et al., 1997; Noulas & Ketkar, 1996; Saha & Ravishankar, 2000). Some recent studies by Kumar and Gulati (2008), Kumar (2008) and Bala and Kumar (2011) have endeavoured to measure the technical efficiency of PSBs, but the time period is limited to 1 year only. Thus, the present article specifically focuses on measuring the technical efficiency of PSBs in the most recent time period, that is, from 2007–2008 to 2011–2012. This time period not only represents the post-reformatory era but also covers the years of global financial crisis. It is believed that this study would fill the gaps of available literature.
Objective of the Study
The primary objective of the article is to analyze and evaluate technical efficiency scores of PSBs in India. The article also determines the nature of return to scale (RTS) in individual banks and identifies the leaders and laggards among banks in the public sector.
Econometric Framework
Non-parametric Approach: Data Envelopment Analysis
The estimates of efficiency are sensitive to the choice of technique (Jacobs, Smith & Street, 2006; Jaforullah & Premachandra, 2003). Both parametric and non-parametric approaches have been used to study the efficiency of banks. Parametric approach uses pre-specified functional forms, such as ‘the translog production function’ or ‘Cobb–Douglas production function’, that endeavour to bear a resemblance to the actual production process as closely as possible (Coelli, Rao & Battese, 1998). The parametric approach includes production, cost, profit and the revenue function as alternative approaches of estimating efficiency (Ajibefun, 2008). Parametric approach requires the definition of a specific functional form for the technology and for the inefficiency error term, while the non-parametric approach requires no specific functional form and chances of measurement errors here are less. The nonparametric approach has the natural advantage of eliminating the effects of all productive and scale inefficiencies prior to calculating scale economies. The non-parametric approach is less restrictive in nature as it does not require unwarranted functional form on the structure of the production technology (Avkiran, 1999; Rebelo & Mendes, 2000). The most frequently used non-parametric approach is the data envelopment analysis (DEA) as it allows diagnostics of the causes of inefficiencies.
Summary of Studies on the Performance Evaluation of Banks

Farrell (1957) used the economic concept of production frontier and production possibility set to define technical and allocative efficiency. Later on, Charnes, Cooper and Rhodes (1978) (CCR model) extended Farrell’s (1957) idea into non-parametric methodology; popularly known as DEA. It is a linear programming-based technique employed for assessing the relative performance of a set of firms that uses a variety of inputs to produce a variety of outputs. The DEA has the capacity to consider multiple inputs and outputs to measure efficiency against the best-observed performance known as ‘the Efficiency Frontier’. The DEA identifies efficiencies of all firms relative to the best practice firm in the sample. A firm in DEA is known as decision-making unit (DMU). The main aim of DEA is to recognize which firms are operating on the production frontier having an efficiency score of one and which firms perform below the frontier that have a score between zero and one. The firm having a score of one is the most efficient firm, while the firm having a score between zero and one is less efficient.
The overall technical efficiency is decomposed into two components: pure technical efficiency and scale efficiency (SE). The overall technical efficiency assumes the constant return to scale (CRS), whereas pure technical efficiency assumes the variable return to scale (VRS). A CRS implies that a change in the amounts of the inputs leads to a similar change in the amounts of the outputs. The VRS determines how the scale of operation slows down a firm’s performance. The VRS includes both increasing returns to scale (IRS) and decreasing returns to scale (DRS). The IRS exists when the proportional increase in all inputs results in a more than proportional increase in outputs. The DRS exists when an increase in inputs results in a lower increase in outputs.
Input–Output Selection for DEA
The selection of input and output variables is essential for the successful application of DEA. Different authors have suggested different approaches for selecting input and output of banks. The two main approaches include the production approach and the intermediate approach. The production approach views banks as using the purchased inputs in terms of the operating cost and interest expenses to produce deposits, loans and advances. The intermediate approach views the banks as using deposits together with purchased inputs and operating costs to produce loans and advances. To calculate the efficiency of banks, researchers have followed both production approach (Bhattacharyya et al., 1997; Chansarn, 2008; Ketkar & Ketkar, 2008; Rammohan & Ray, 2004; Saha & Ravishankar, 2000; Jemric & Vujcic, 2002) and intermediate approach (Ataullah & Hang, 2006; Chansarn, 2008; Das, Nag & Ray, 2005; Karimzadeh, 2012; Ketkar & Ketkar, 2008; Sahoo, Sengupta & Mandal, 2007; Sanusi et al., 2007; Varadi et al., 2006; Jemric & Vujcic, (2002); Yue, 1992). However, Favero and Papi (1995) and Berger and Humphrey (1997) have pointed out that intermediation approach is the most appropriate for banks because most activities of banks involve converting huge deposits and funds into loans and financial investments. Thus, this article employs intermediation approach and takes deposits, borrowings, interest expenses and operating expenses as inputs and investments, advances, interest income and non-interest income as outputs.
Data Base and Research Methodology
The article analyzes the efficiency of currently operating PSBs in India, that is, 26 banks. State Bank of Saurashtra and State Bank of Indore are excluded from the sample for the reason that these banks were merged with the State Bank of India. The sample size is considered to be satisfactory as it represents more than twice the sum of inputs and outputs, which is a precondition for the application of DEA. The technical efficiency performance of PSBs has been analyzed over 5 years from 2007–2008 to 2011–2012. It is the most recent period for which data are available. In addition, these years represent the most critical time period for banks as it covers the years of global financial crisis as well. The study is based on secondary data. The data have been collected from the banks’ annual reports, websites of Reserve Bank of India (RBI) and Reports on Trend and Progress in Banking from 2007–2008 to 2011–2012. The study uses Data Envelopment Analysis Program (DEAP 2.1) developed by Coelli (1996) to calculate the efficiency of PSBs in India.
Empirical Results and Findings
Individual Bank Efficiency
In this section, overall technical efficiency (CRS), pure technical efficiency (VRS) and SE are obtained by employing DEA. The estimated efficiencies are reported in Table 2.
Efficiency Scores of Public Sector Banks in India
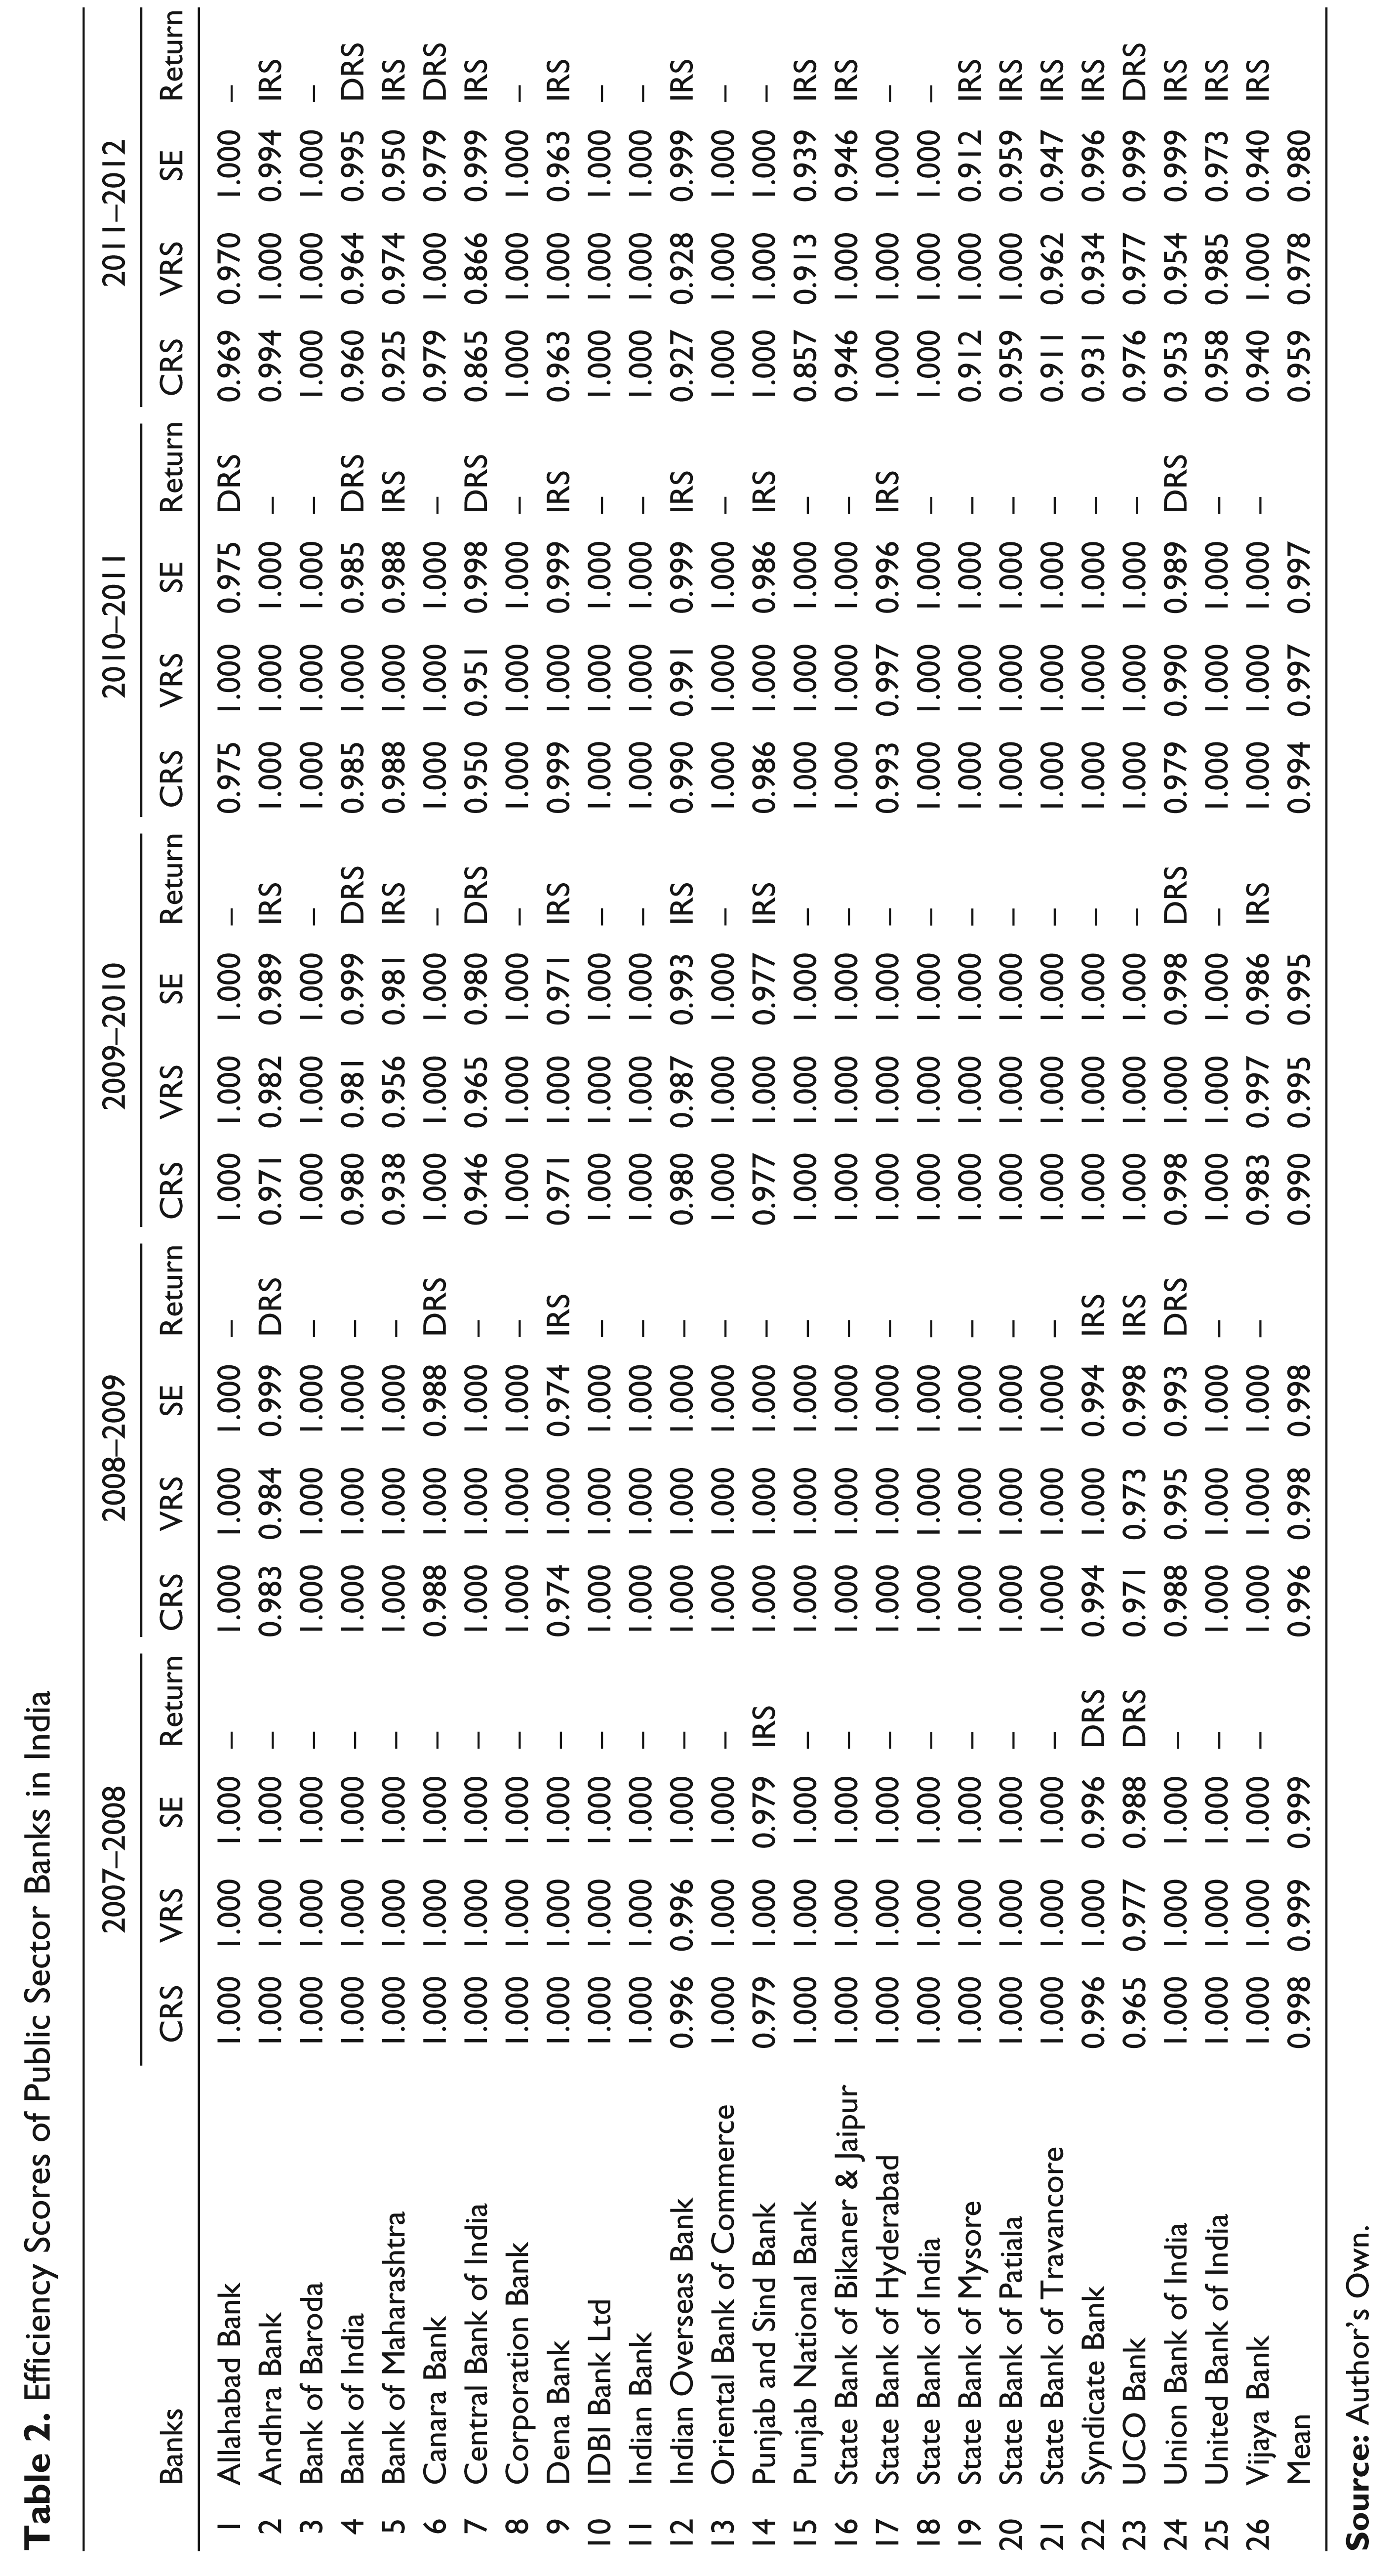
Table 2 indicates that there has been a change in the efficiency patterns of banks over 5 years from 2007–2008 to 2011–2012. In 2007–2008, the most efficient banks comprized 22 banks. These banks operated with full pure technical and scale efficiencies as they have an efficiency score of 1. Only four banks, that is, Indian Overseas Bank, Punjab and Sind Bank, Syndicate Bank and UCO bank have an efficiency score of less than 1 which makes them less efficient. In 2008–2009, four banks, namely, Andhra Bank, Canara Bank, Dena Bank and Union Bank of India, were dropped out of the record of efficient banks, whereas Indian Overseas Bank and Punjab and Sind Bank entered into the catalogue of efficient banks. Overall, 20 banks remained fully efficient in 2008–2009. Further, the list of fully efficient banks went down to 17 banks in 2009–2010. Bank of India, Bank of Maharashtra, Central Bank of India, Indian Overseas Bank, Punjab and Sind Bank and Vijaya Bank became inefficient in the year 2009–2010. Canara Bank, Syndicate Bank and UCO Bank turned out to be efficient. On the whole, in 2010–2011, the number of efficient banks remained the same as in 2009–2010 as Andhra bank and Vijaya Bank changed into efficient banks, while Allahabad Bank and State Bank of Hyderabad turned out to be inefficient banks. In 2011–2012, only 7 banks remained fully efficient while the remaining 19 banks had an efficiency score varying from a low of 0.857 to a high of 0.999.
On the whole, Bank of Baroda, Corporation Bank, IDBI Bank, Indian Bank, Oriental Bank of Commerce and State Bank of India exhibit a high efficiency score of 1 during all years. These banks are considered as fully efficient as the input–output combination of these banks lies on the Efficient Frontier for all these years. Many of these banks have expanded their scope and operational efficiency by introducing electronic banking, Internet banking, mobile banking, credit cards, automatic teller machines (ATMs), electronic fund transfer (EFTs), real-time gross settlement (RTGS) and national electronic funds transfers (NEFTs).
The mean CRS efficiency score of PSBs shows an evident decline from 0.998 in 2007–2008 to 0.959 in 2011–2012. The mean VRS efficiency score of PSBs also depicts a decline from 0.999 in 2007–2008 to 0.978 in 2011–2012. Even the fully efficient number of banks declined from 22 to an alarming low of 7. This decline in the number of fully efficient banks is perhaps due to deceleration in the balance sheet of PSBs in 2011–2012, in terms of asset quality. This reduced the deposit mobilization by banks and increased the cost of deposits, as well as the cost of borrowings, resulting in lower spread and inefficiency. Moreover, the trimmed down performance of Indian banks, to some extent, has been attributed to the high inflation and muted growth performance of Indian economy as a whole and the fragile recovery of the Indian financial market from the ripples of global recession in 2011–2012 (Reports on Trend and Progress of Banking in India 2011–2012, Reserve Bank of India, 2012).
However, the individual scores of banks suggest an optimistic view as all the PSBs have more or less similar efficiency scores, that is, the efficiency score for majority of banks is higher than 0.900. These efficiency scores also suggest that a greater part of inefficiency among PSBs is attributed to scale inefficiency. Scale inefficiency cautions that banks are not operating on the optimum scale. They need to expand their business not only by opening new branches but also by increasing their customer base by improving the quality of services and by effective customer relation management to achieve economies of scale. The rest of the inefficiency among PSBs is attributed to pure technical inefficiency. Pure technical inefficiency depicts that management of these banks needs to gear up its operational abilities. Perhaps, it needs to motivate its personnel, improve its processes and upgrade its technologies to achieve operational synergy.
Analyzing Return to Scale
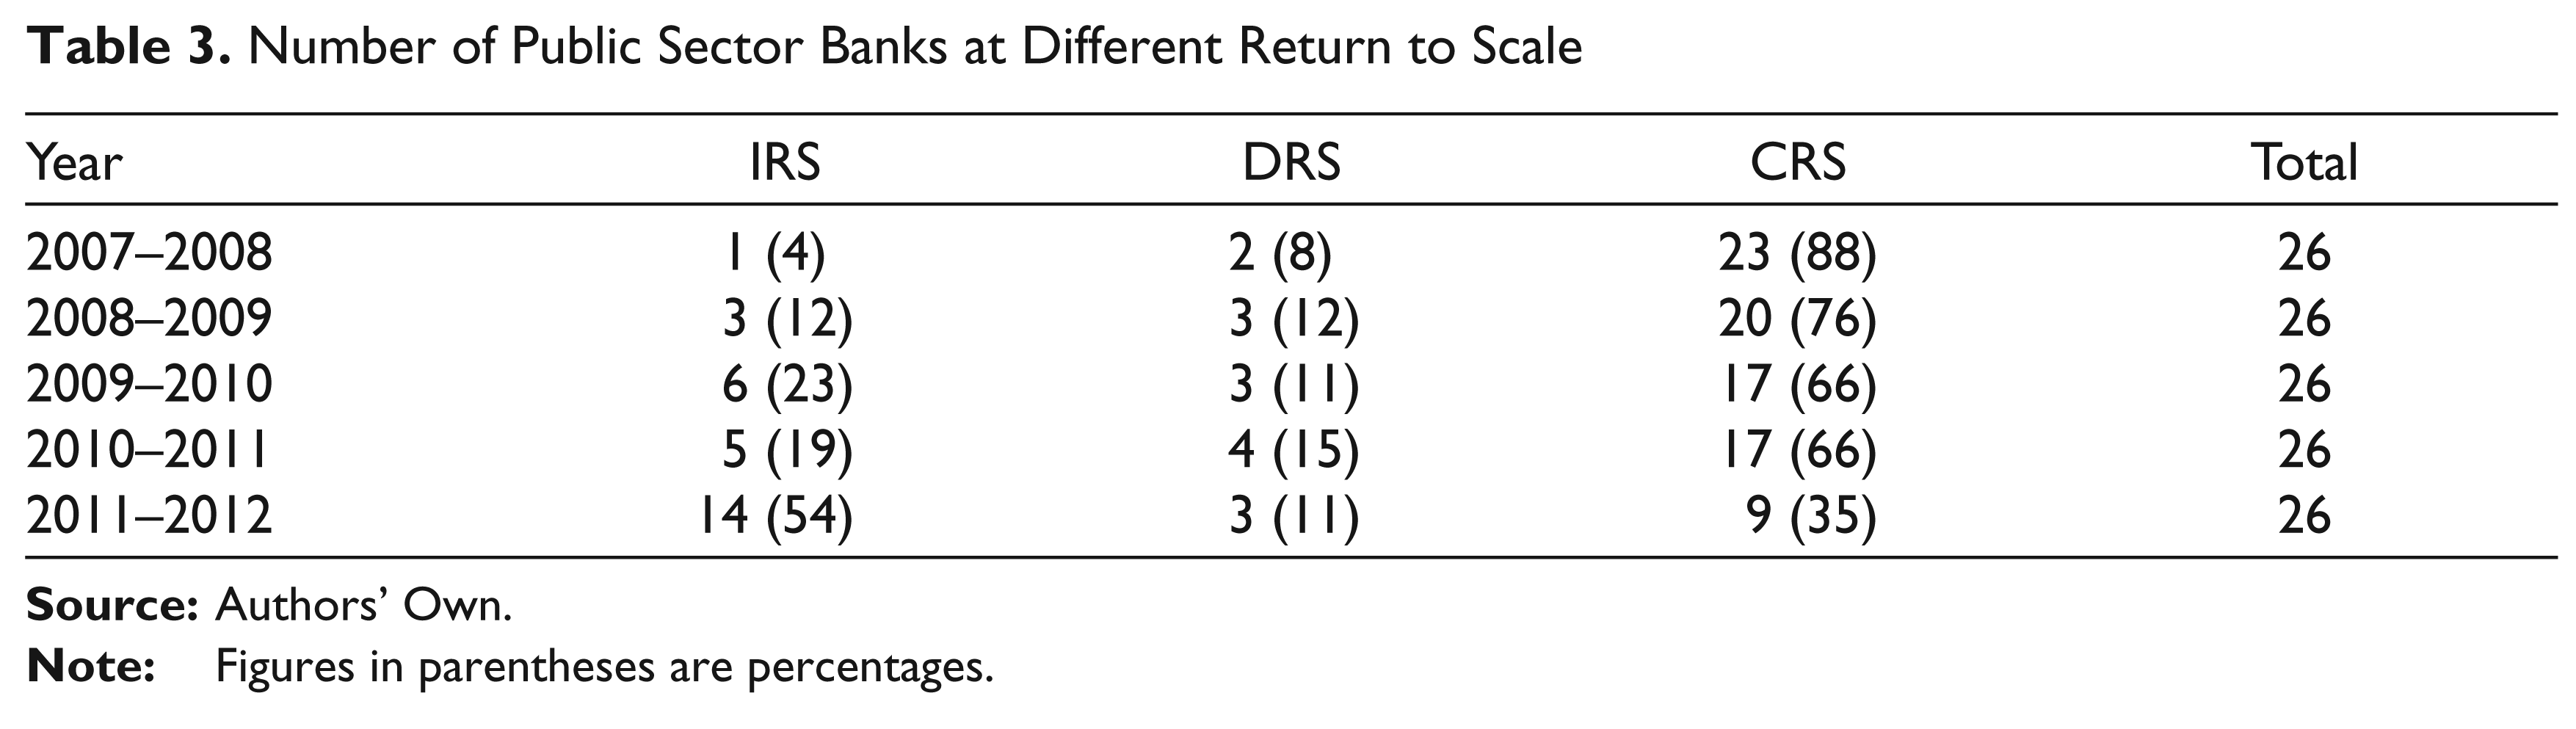
As per the results generated by DEA (Table 2), the nature of RTS may vary from CRS to IRS or DRS. The DEA also helps to determine whether a DMU is operating at a wrong scale, that is, either operating at DRS or IRS. The DRS indicates that DMU is operating at a scale that is too large which portrays that a percentage increase in inputs of that DMU produces a less than proportional increase in outputs. DMUs operating on DRS can improve their performance by compressing their scale of operations. On the other hand, IRS depicts that DMU is operating at a scale that is too small, which means that the percentage increase in inputs of DMU produces a more than proportional increase in outputs. The DMU with IRS lies below the optimum scale and would improve their operations by mounting their scale of operations. Table 3 provides a synoptic view of the number of PSBs operating at different RTSs.
Number of Public Sector Banks at Different Return to Scale
Number of Public Sector Banks Identified as Leaders and Laggards
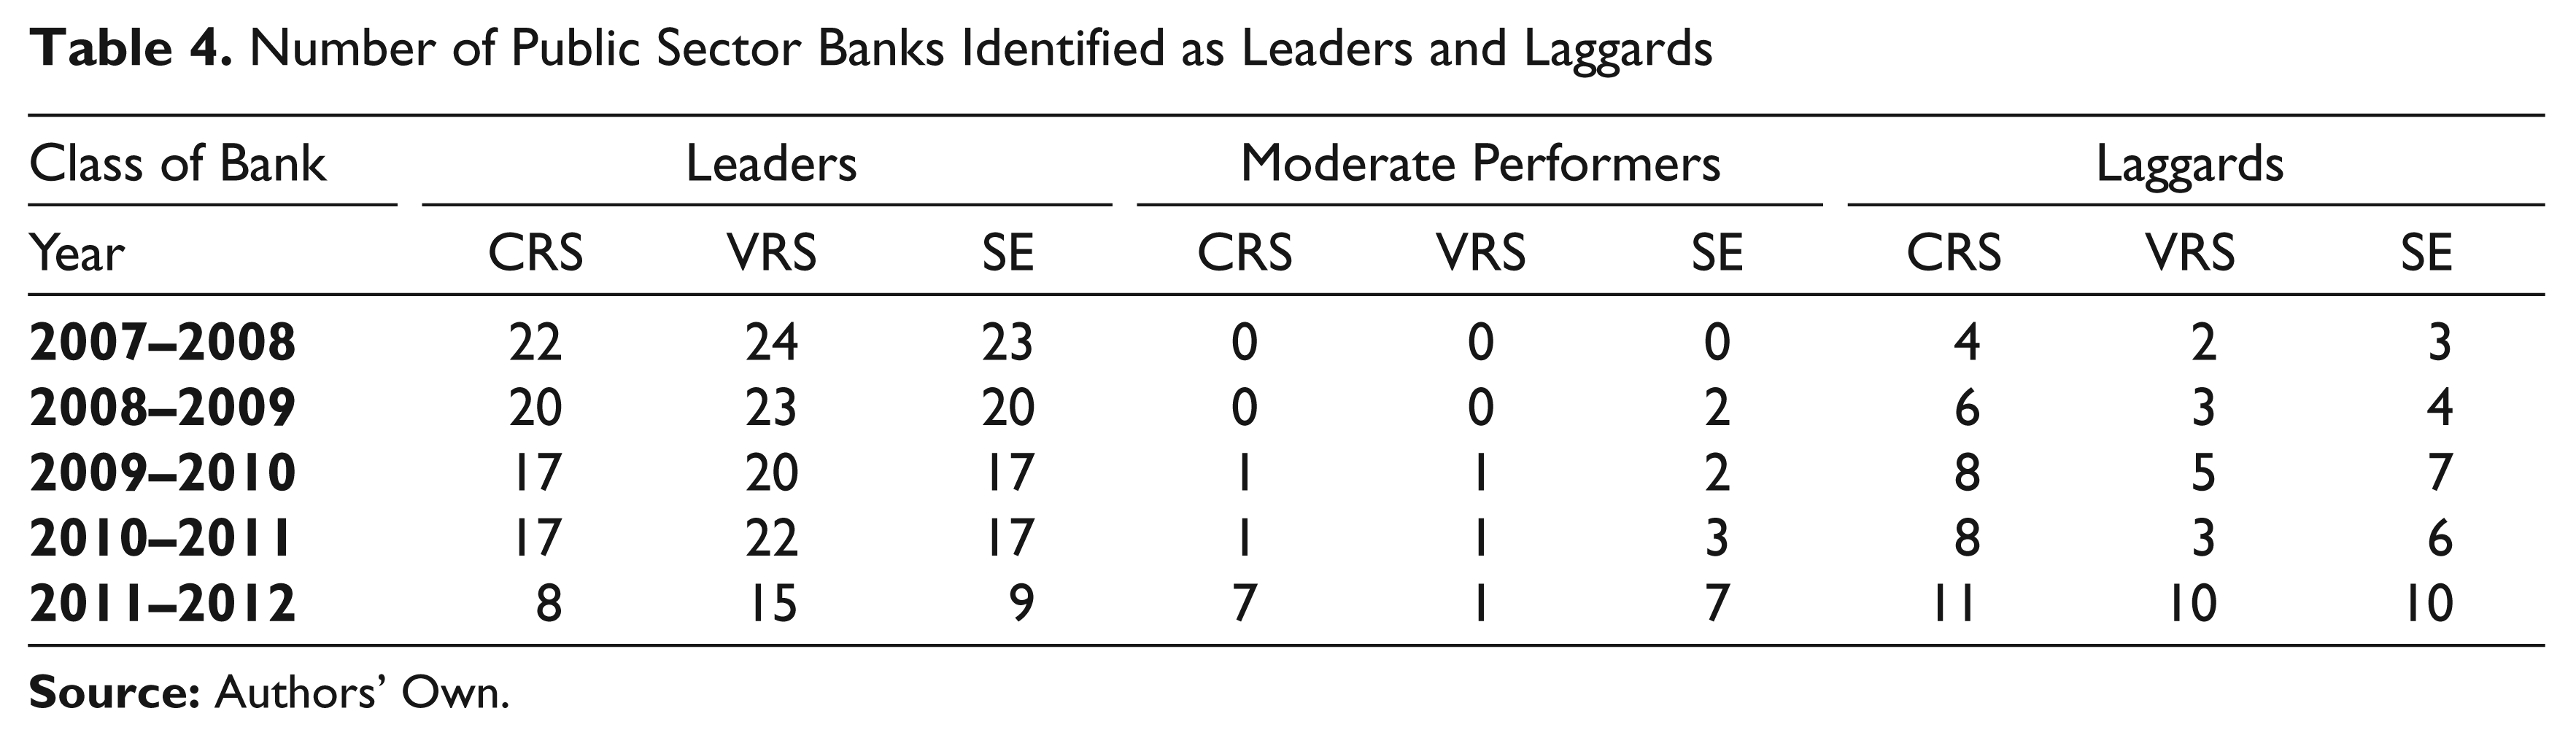
Table 3 shows that the number of PSBs operating at IRS increased tremendously from 1 (4 per cent) to 14 (54 per cent) from 2007–2008 to 2011–2012. The number of banks operating at DRS remained almost the same with a minor variation. As a result, the number of banks operating at CRS fell drastically from 23 (88 per cent) in 2007–2008 to 9 (35 per cent) in 2011–2012. This implies that majority of banks need to enlarge their scale of operations. Scale inefficiency seems to be a very gross cause of poor performance of PSBs in India.
Identification of Leaders and Laggards
On the basis of the mean efficiency scores generated by DEA, PSBs have been divided into three categories: (i) banks with an efficiency score of 1 are considered as leaders, (ii) banks which have an efficiency score less than 1 but greater than mean efficiency score are rated as moderate performers and (iii) banks with a mean efficiency score of less than average are considered as laggards. Table 4 presents a bird’s eye view of the number of banks falling in each category.
It is observed that there is a reduction in leaders from 22 to 8 (CRS), 24 to 15 (VRS) and 23 to 9 (SE) during the time period under study, while laggards have increased from 4 to 11 (CRS), 2 to 10 (VRS) and 3 to 10 (SE) from 2007–2008 to 2011–2012. This decline in leaders and increase in laggards seems to be due to scale inefficiencies. These banks are slow in technological upgradations and hence are unable to capture the economies of operating on a large scale. Also, PSBs are mandatorily required to open branches in rural and semi-urban areas. Further, they are compulsorily bound to advance 40 per cent towards Priority Sector Lending (PSL). This limits their opportunity to generate earning assets and results in lesser output with the same input. This gradually affects their efficiency scores and makes them lag behind their counterparts.
Conclusion
The snapshot of results is as follows:
The efficiency scores of majority of banks, that is, approximately 73 per cent have declined during the time period from 2007–2008 to 2011–2012. As a result, only 7 banks out of the 26 banks operate at full efficiency. From the 23 banks operating at CRS in 2007–2008, the number fell to just 9 banks in 2011–2012, suggesting that PSBs were not able to maintain their input–output synchronization. The proportion of laggards among PSBs increased almost three to five times, while that of leaders was reduced with the same percentage over a total span of 5 years.
There is an evident effect of slowdown in Indian economy on the efficiency of PSBs. In spite of RBI’s traditional banking policies, the effect of macro-events could not be controlled fully. In a globalized environment, where financial system is integrated and interdependent, the ripples of turmoil in one country definitely travel to another country. US recession affected the sentiments and faith of people in banking globally. Money is the inventory of banking business and it has a huge opportunity cost. No doubt, macro-events are not fully controllable, still at the micro-level PSBs should make an endeavour to optimize their scale of operations by adopting technological upgradations and bringing managerial synergies.
Footnotes
Acknowledgements
The authors are grateful to the anonymous referees of the journal for their extremely useful suggestions to improve the quality of this article. Usual disclaimers apply.