
Abstract
Business and academic interests in open innovation have increased; however, the evolution of this topic in the emerging countries is unknown. This article aims to provide a bibliometric analysis of open innovation in developed and emerging countries. The research has covered 1,925 articles between the years 2000 and 2014 in Web of Science (WoS) database. The terms ‘open innovation’, ‘user innovation’, ‘cumulative innovation, ‘trading know-how’, ‘mass innovation’, ‘distributed innovation’, ‘innovative cooperation’ and ‘collaborative innovation’ have been selected as research keywords, considering their presence in the title, abstract or based on the keywords of the articles. The countries were divided into two groups (developed countries, i.e., G7, and emerging countries, i.e., Brazil, Russia, India, China and South Africa [BRICS]) depending on the degree of research maturity described in their studies on open innovation. Data analyses have revealed a significant increase in the research on open innovation in the past years. However, it was found that a huge discrepancy exists between the two groups on the number of publications and citations. This study confirms, through a bibliometric analysis, some differences which could be found between the two groups and their influence on the reversal of this scenario, which indirectly affects the development of the emerging countries. It was also found that the groups G7 or BRICS are not statistically important factors for the further development of open innovation research. Analyzing individually, G7 countries have greater relevance in the conduction of studies on open innovation, whereas the BRICS countries are still at an embryonic stage of research on this topic.
Introduction
Despite the recent global recession, most multinational companies have increased their investments in research and development (R&D). In addition, many companies have become more aware that external knowledge and technology are crucial to remain competitive in the global market. Chesbrough (2003a) defines this change as ‘open innovation’, a model of innovation management which maximizes profits through the active use of both external and internal ideas and knowledge.
Corporate technological innovations have traditionally been conducted in-house by the R&D departments, which develop innovations for use by the company. But this model is becoming obsolete in an age of mobile scientific workers, innovative high-tech start-ups and a growing trend of collaborations between corporations and universities (Chesbrough, 2003a).
The strategic importance of exploring potential technology partners has been highlighted with the advent of the open innovation paradigm. However, due to a gap between nations or industries, the conventional approaches to the search for external partners have faced an increasing number of difficulties. According to Abulrub & Lee (2012), the interest in open innovation has increased, both in business and academic environment. Research on open innovation has been continuously spread with a wide variety of scopes, indicating a positive response to this issue (Gassmann, Enkel & Chesbrough, 2010).
In a recent study, Su and Lee (2012) developed a mapping of the research structure on open innovation by quantitatively analyzing the publications on this topic from the Web of Science (WoS) database. According to these authors, the quantitative ways of exploring open innovation research are performed to unveil important or emerging components of this issue as well as to demonstrate visually the structure of global open innovation research. The quantitative method used in their research suggested a possible way to address and evaluate the structure of the research community and to estimate potential applications of the research management in open innovation. However, literature does not explore analyses or considerations about the evolution of this topic considering the emerging countries’ perspective.
This study has used bibliometrics to perform a comparative analysis of the scientific literature on open innovation practiced in developed and emerging countries. Additionally, the relevance of the publications from each group of countries was assessed based on the concentration of citations and productivity in generating scientific articles on this topic. It is structured into the following sections. The first section provides the introduction on the topic. A review of the open innovation literature is presented in the second section. In the third and fourth sections, the research objectives and the methodology used in collecting and analyzing data are presented, respectively. Analyses and discussion steps are given in the fifth section and the final conclusions are presented in the sixth section.
Review of Literature
Open Innovation
Nowadays, consumers and markets are more dynamic, agile and competitive, with many companies trying to innovate their products, services and business models in order to acquire competitive advantages. Globalization is a reality implying competition between companies and exploitation of the economic system. Thus, the search for competitive advantage through innovation enables differentiation of the competitors and creates opportunity for new markets (Porter & Van Der Linde, 1995).
According to Schumpeter (1989), innovation means ‘new combinations’—a fundamental phenomenon to promote economic development. The combination of available resources can lead to either something different or changes in the way of developing the product or service. According to Kemp et al. (2000), innovation has a great complexity of relationships between business and environment, and the latter can be understood as an ecosystem surrounding many issues which may affect business, such as consumers, suppliers, employees, other stakeholders and even cultural and organizational aspects. Other issues, such as organizational learning and knowledge management, influence directly innovation process and they are additional challenges to innovative organizations (Dasgupta & Gupta, 2009).
Open innovation is usually contrasted with closed innovation in which companies generate their own innovative ideas and then develop, build, market, distribute and support them on their own (Chesbrough, 2003b). According to Mortara et al. (2009), the open innovation approach differs from the closed innovation adopted by numerous companies in that efforts are based only on internal resources to generate, develop, produce, market, distribute and support innovation. The basic premise for open innovation is that the company’s whole innovation process is aimed to provide new ideas and innovations as well as to assimilate technologies, including allowing external opportunities to business.
Open innovation can be understood as a model of innovation management which is based on the use of internal and external efforts to develop new technologies, services, processes or methods. One usual definition of open innovation refers to the purposeful use of input and output streams of knowledge to accelerate internal innovation and expand markets with the use of external innovations, respectively (Chesbrough, Vanhaverbeke & West, 2006).
Thus, it can be said that open innovation is a broad concept encompassing different dimensions, more specifically with internal and external focus. Most studies distinguish between intentional knowledge outputs and inputs to accelerate innovation processes and to improve the benefit of innovative efforts (Chesbrough & Crowther, 2006; Chesbrough et al., 2006). Intentional knowledge inputs, also known as technology exploitation or inside-out process, provide innovative activities and technologies outside the company. On the other hand, intentional knowledge outputs, also known as technology exploration or outside-in process, refer to innovation activities to capture and receive knowledge from external sources to improve the current technological developments. In an open environment, companies combine both exploitation and exploration of inputs and outputs through technology in order to create maximum value of their technological abilities or other skills (Chesbrough & Crowther, 2006; Lichtenthäler, 2008).
Objectives
This article aims to confirm the assumption that developed countries, represented here by the G7, have greater influence on opportunity to conduct open innovation research than Brazil, Russia, India, China and South Africa (BRICS) due to their social and economic conditions. The results found can be used as input for future decisions to foster this research, especially in emerging countries where this topic is understudied.
Methodology
Citation analysis is derived from the methodology also known as bibliometrics, giving rise to the field of information sciences. It has been widely applied to scientific research and aims at paradigm changes by measuring publication productivity regarding a specific topic (Moed, 2006). Schneider and Borlund (2004) add that analysis of the research generated by bibliometric method enables both understanding and evaluation of what has been done and of what is needed for more research on a topic.
According to Narin et al. (1994), bibliometric analysis uses the basic principle of accounting for scientific publications and technical performance parameters for production measurement. The present study has selected scientific articles from the WoS database through the terms ‘Science Citation Index Expanded’, ‘Social Sciences Citation Index’, ‘Conference Proceedings Citation Index-Science’, ‘Conference Proceedings Citation Index-Social Science & Humanities’, ‘KCI-Korean Journal Database’ and ‘SciELO Citation Index’.
The search for articles was based on four main criteria: first, the ‘topic’ field should have at least one of the following terms: ‘open innovation’, ‘user innovation’, ‘cumulative innovation’, ‘know-how trading’, ‘mass innovation’, ‘distributed innovation’, ‘innovative cooperation’ and ‘collaborative innovation’. The use of terms in this study follows the recommendations by Rahman and Ramos (2010), who reported a direct relationship of the term ‘open innovation’ with the others mentioned above. The second and third inclusion criteria were, respectively, year of publication ranging between 2000 and 2014 and type of publications defined as ‘journals’, ‘books’ and ‘series’.
In addition to the criteria mentioned above, a fourth and additional criterion was used for selecting the authors’ countries. Also, these countries were divided into two groups: developed countries formed by the G7 nations, namely, the United States, Germany, Canada, France, Japan, Italy and the United Kingdom, as defined by the International Monetary Fund (International Monetary Fund [IMF], 2014), and emerging countries formed by the BRICS nations, namely, Brazil, Russia, India, China and South Africa. An additional group called ‘Others’ was also used for further analyses, representing part of the total of publications on open innovation elsewhere. Although such a group has different economic characteristics due to their different economic and social situations, other countries might be subject of another study to better evaluate their characteristics. It is relevant to compare the behaviour of these countries in scientific and technological production, as they make important blocks of the world economy development, and the evaluation of some social and economic indicators may result in more or less scientific and technological development.
In the results, analyses with variables gross domestic product (GDP), GDP per capita, Human Development Index (HDI), Academic Publications, Citations and Patent Cooperation Treaty (PCT) applications were used. Furthermore, a statistic multilevel model is suitable as an analysis method for this study because the type of the performance data of the countries in different groups historically is hierarchical because such data are organized in different levels when years and countries are analyzed. So, this research also aims to identify the effect of the group to which the country belongs, besides the country effect on production performance of countries. The highest level is the classification of countries by group. Thus, estimating the effects of the group and the country implies a model of three levels with annual observations at level 1, countries at level 2 and group at level 3. The model was operated using the data series between the years 2000 and 2014. The analyses were performed using the package lme4 and R statistical software.
The dependent variables used were Citations, Citations_Idx, PCT, PCT_Idx, Publications and Publications_Idx and the independent variables used were the country and group. The Idx variables were calculated as the percentage variation from one year to another in each of the original variables. Dependent variable Performance, measured alternatively as Citations, Citations_Idx, PCT, PCT_Idx, Publications and Publications_Idx result in a three-layer statistical model, with group represented by the ‘k’ at level 3, country ‘j’ at level 2 and year ‘i’ at level 1, as shown below:
Level 1:
where
Level 2:
where
Level 3:
where
In a short, we have:

Performance residue represents variations from the average and it is used to identify countries with superior performance. Next section is analyzes and discusses the data collected based on the literature review and methodology presented previously.
Results and Discussion
Analysis of the Published Articles
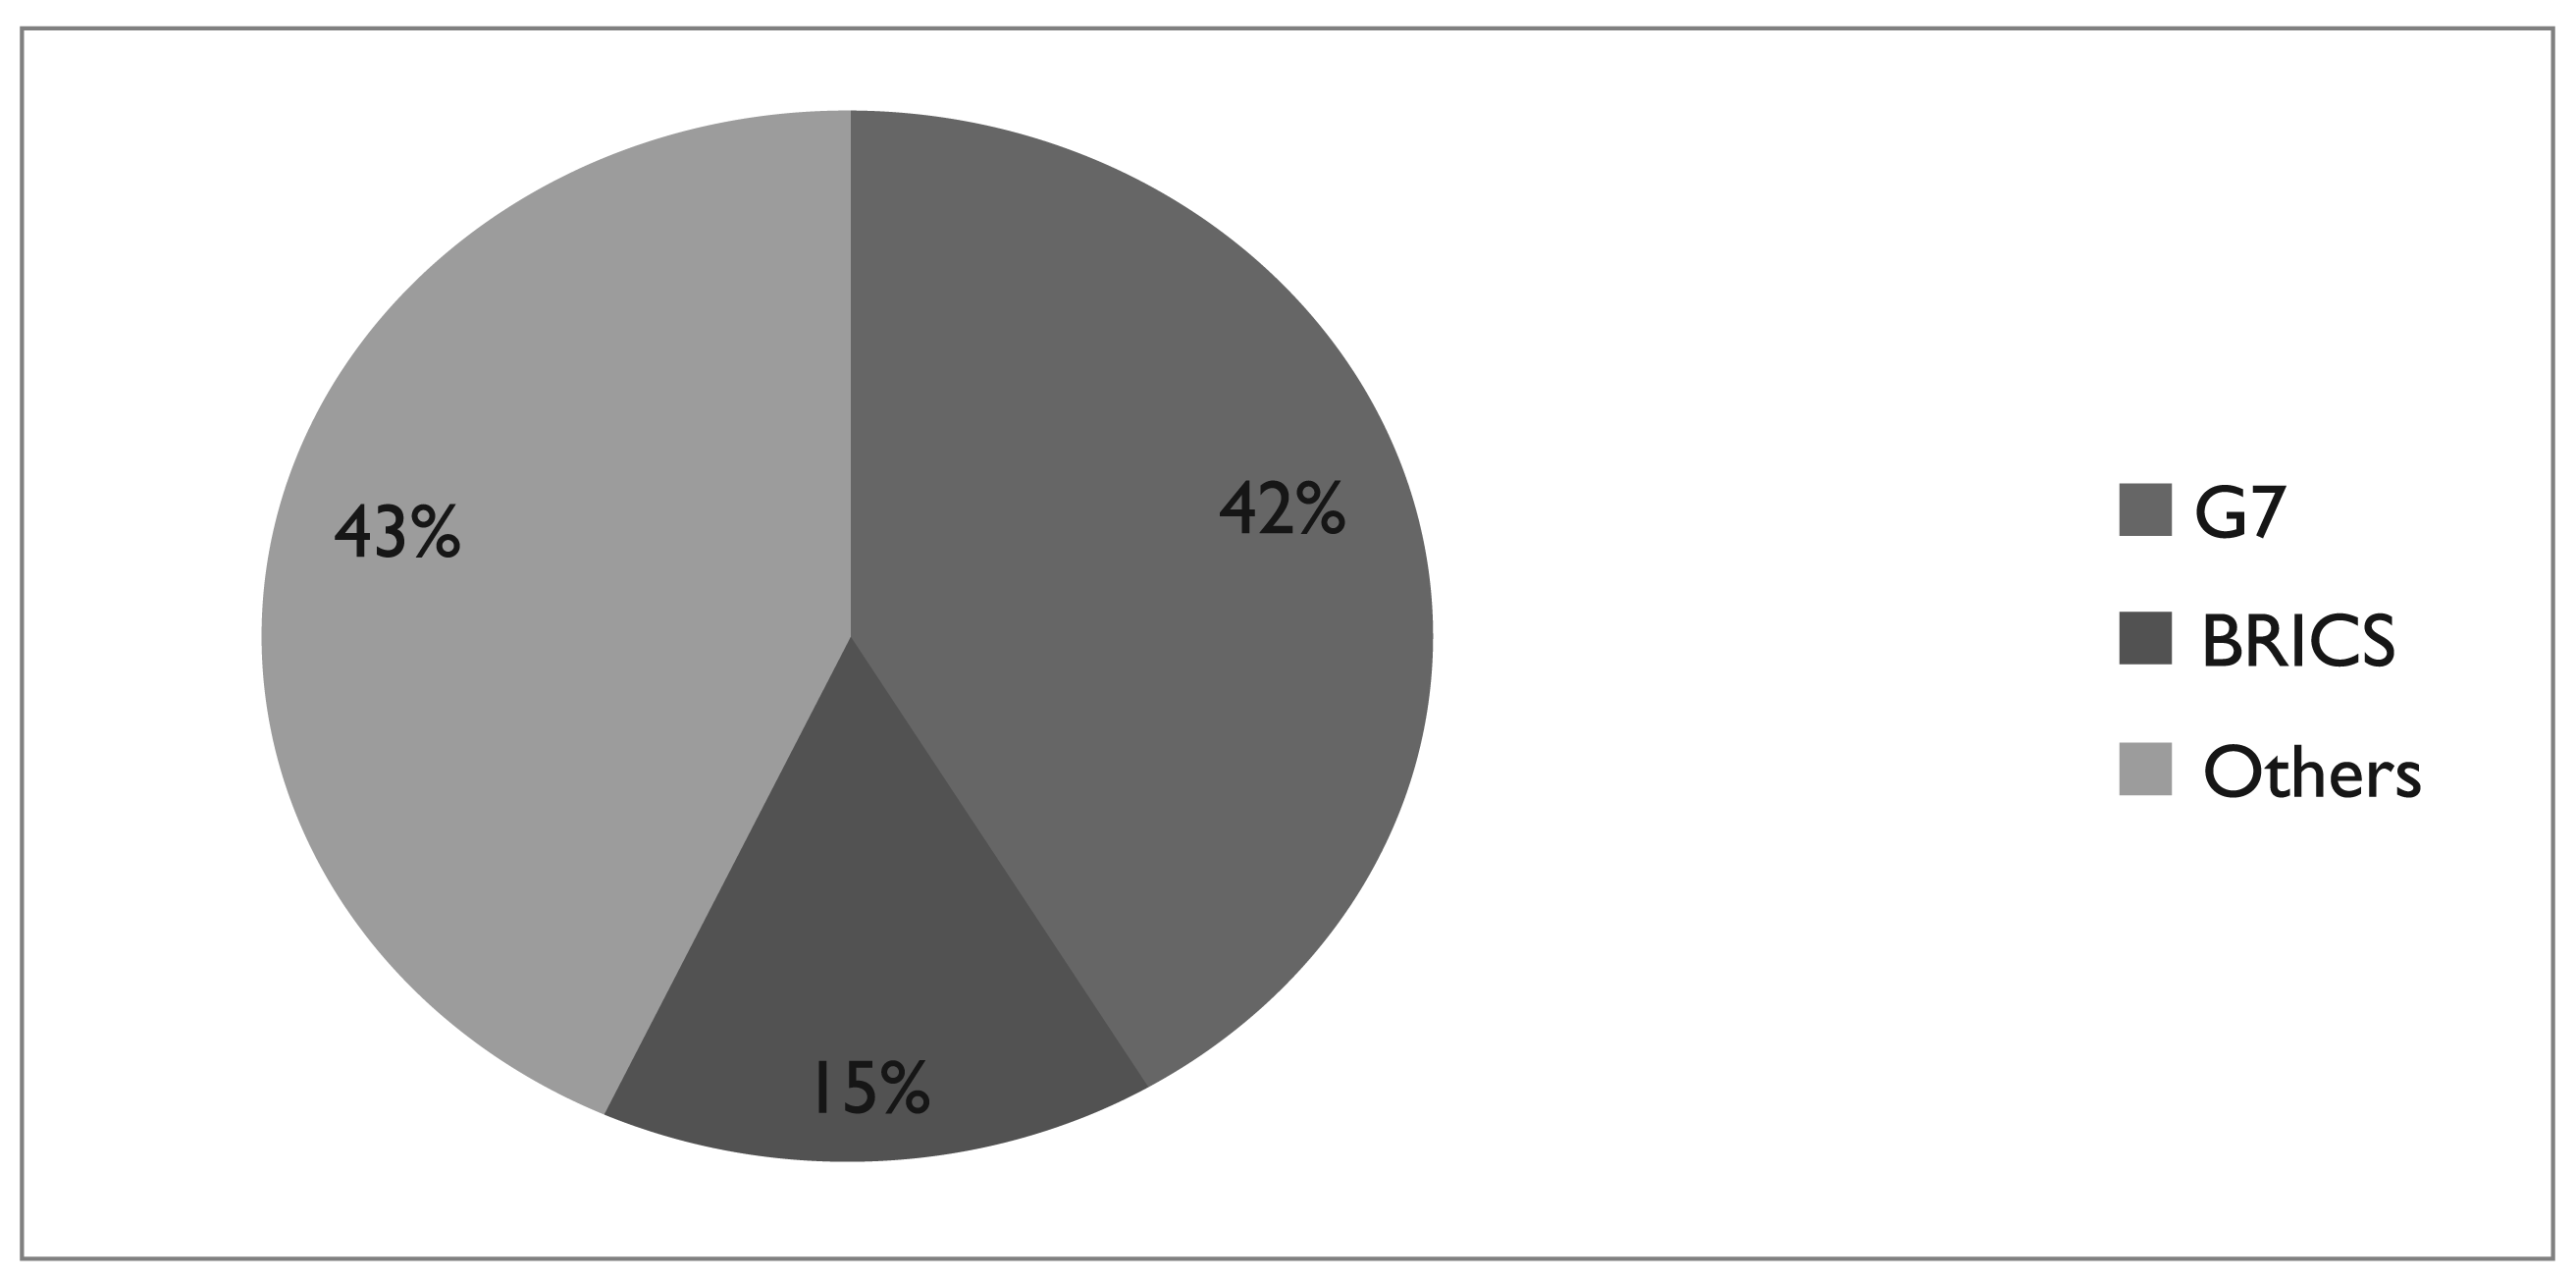
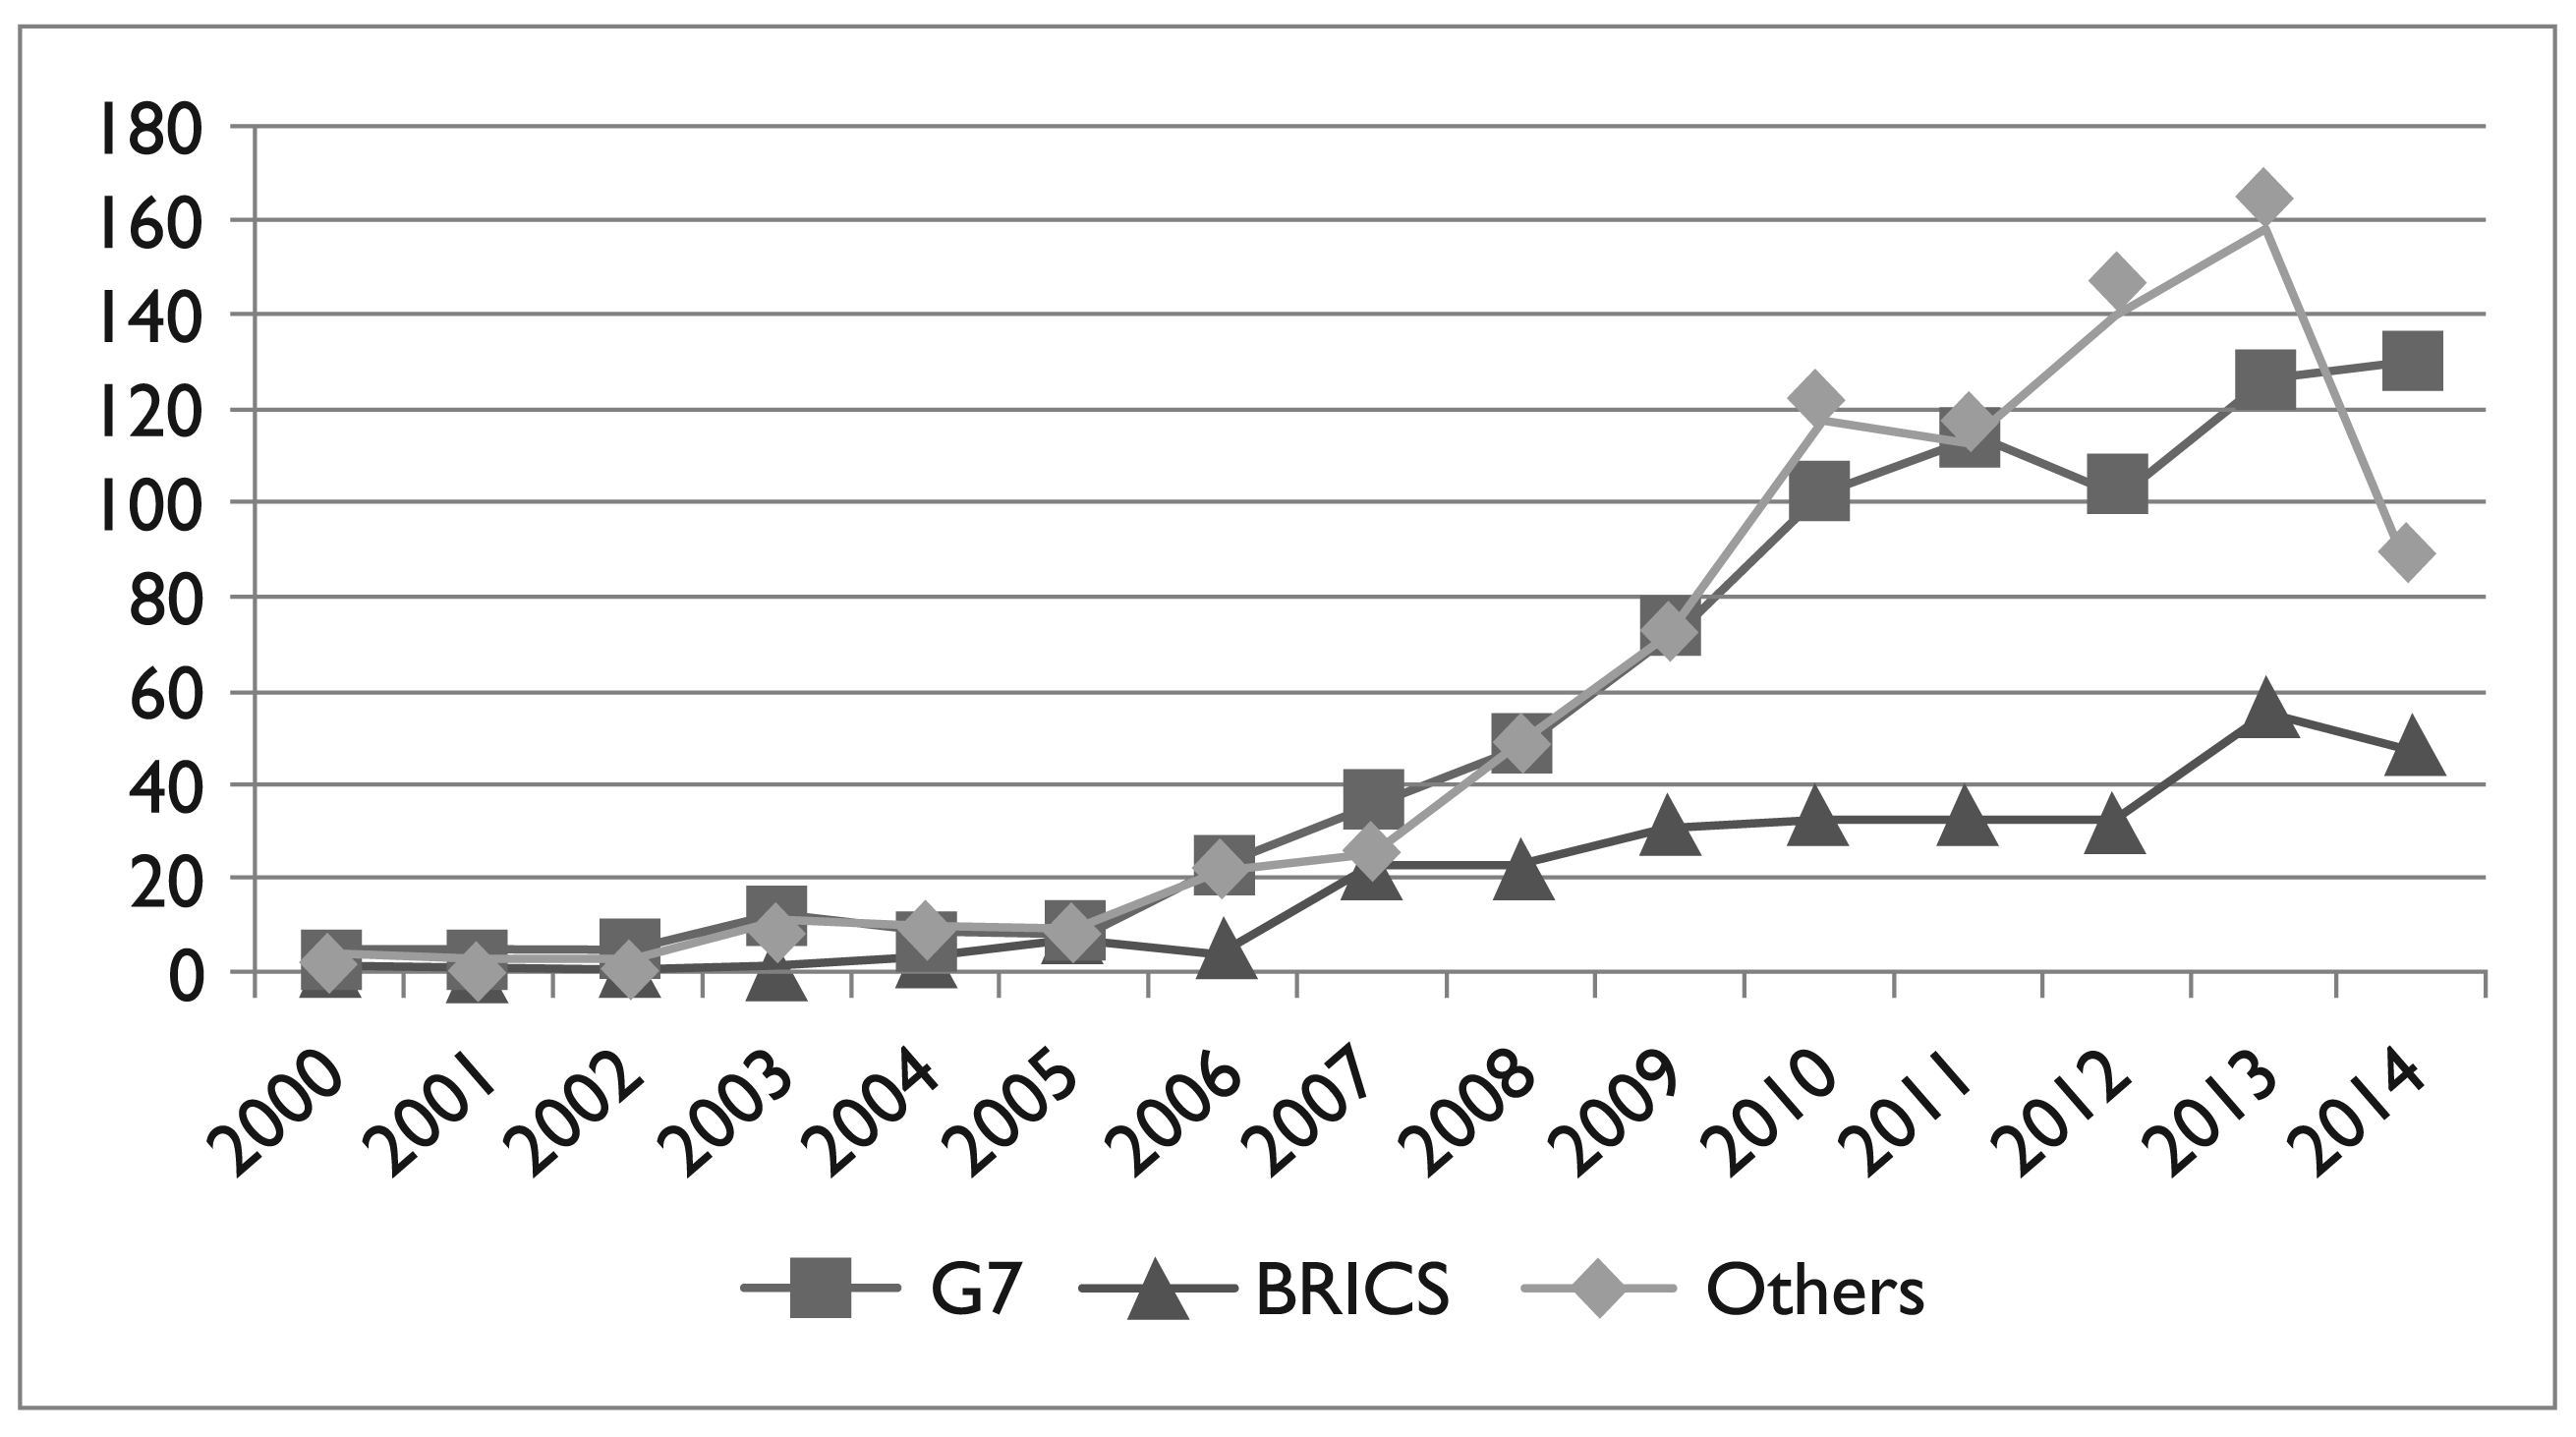
Based on the search criteria cited previously, it was possible to find a total of 1,925 articles published regardless of country or territory of the authors’ publication since the 15 years covered in the study, that is, from 2000 to 2014. During this period, the G7 countries published 797 articles and the BRICS ones had 296, representing, respectively, 42 and 16 per cent of all publications on open innovation. The group ‘Others’ had 832 articles published, that is, 43 per cent of all publications. This distribution can be seen in Figure 1(a).
Figure 1(b) shows the distribution of publications per year. As can be seen, until the year of 2005, all the three groups had a constant line of publications, especially the G7 and BRICS countries. From 2005 onwards, there was a growth in the number of articles published by the G7 countries, even surpassing the other groups. Between 2005 and 2009, the BRICS also increased their publications on open innovation.
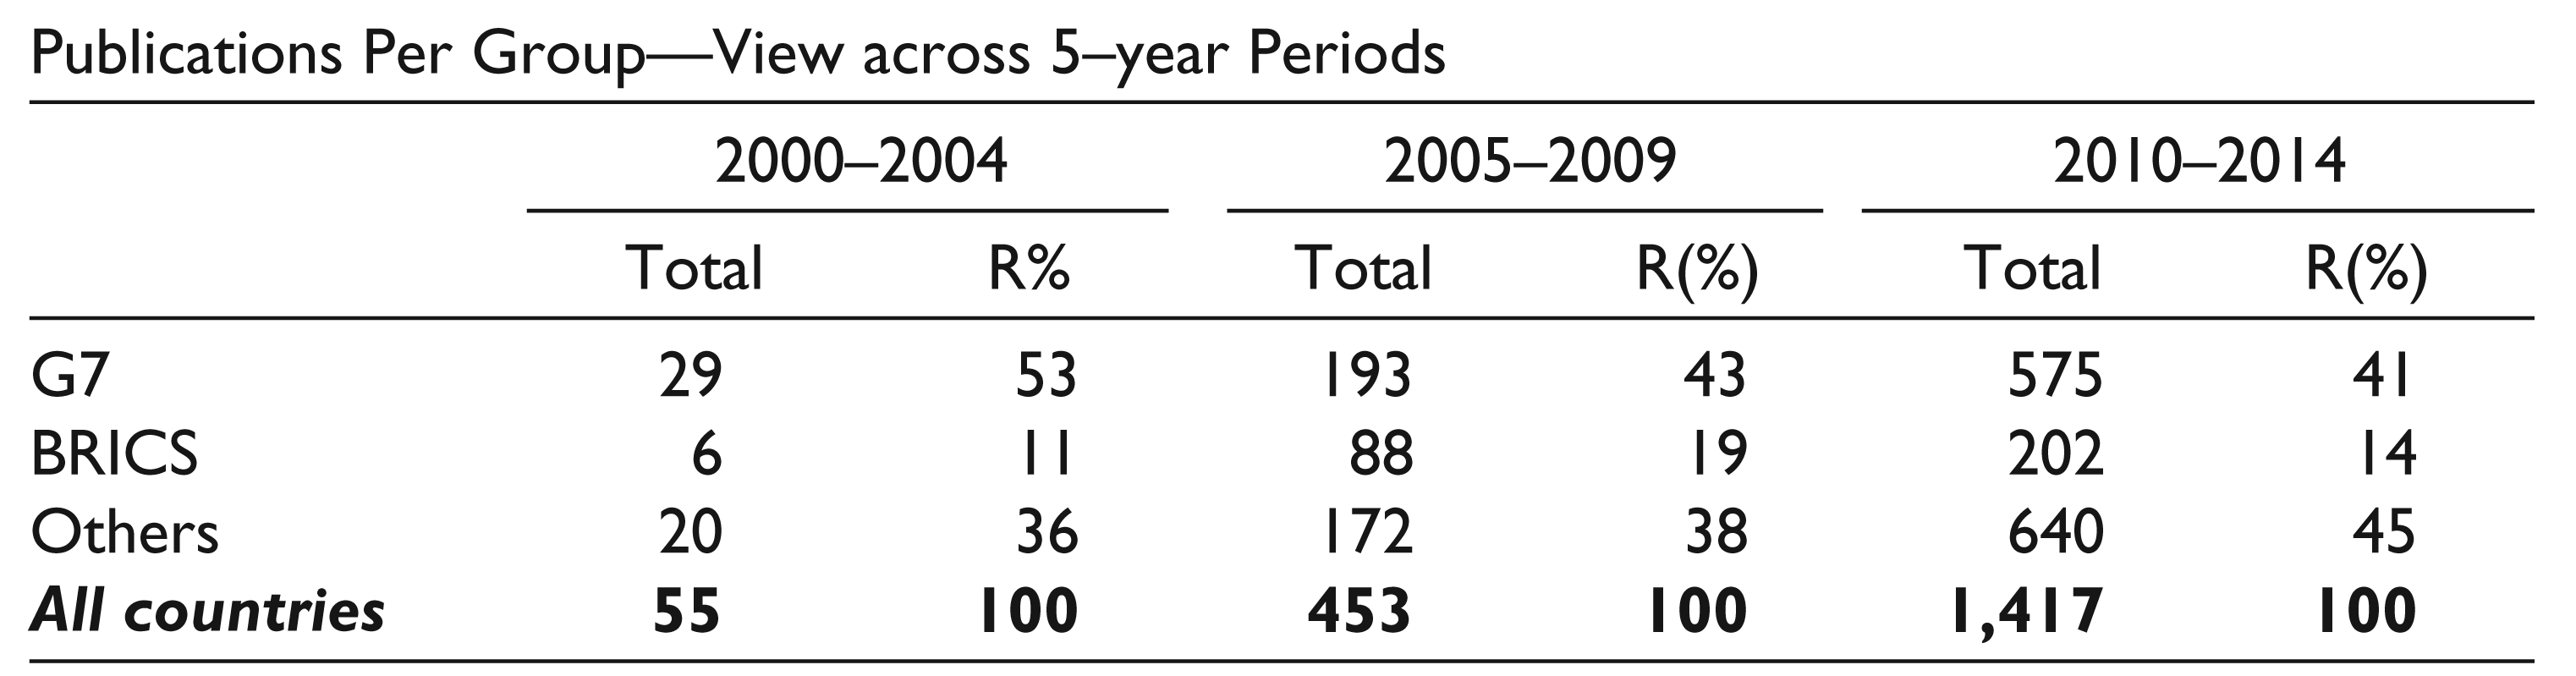
Table 1 shows the representation of each group in periods of 5 years. It is observed that the representation of each group has no significant variation. Only between 2005 and 2009, the BRICS group reached 19 per cent of total publications, but returned to the same level of the 2000–2004 period soon after.
Representation of Publications during the 5-year Periods
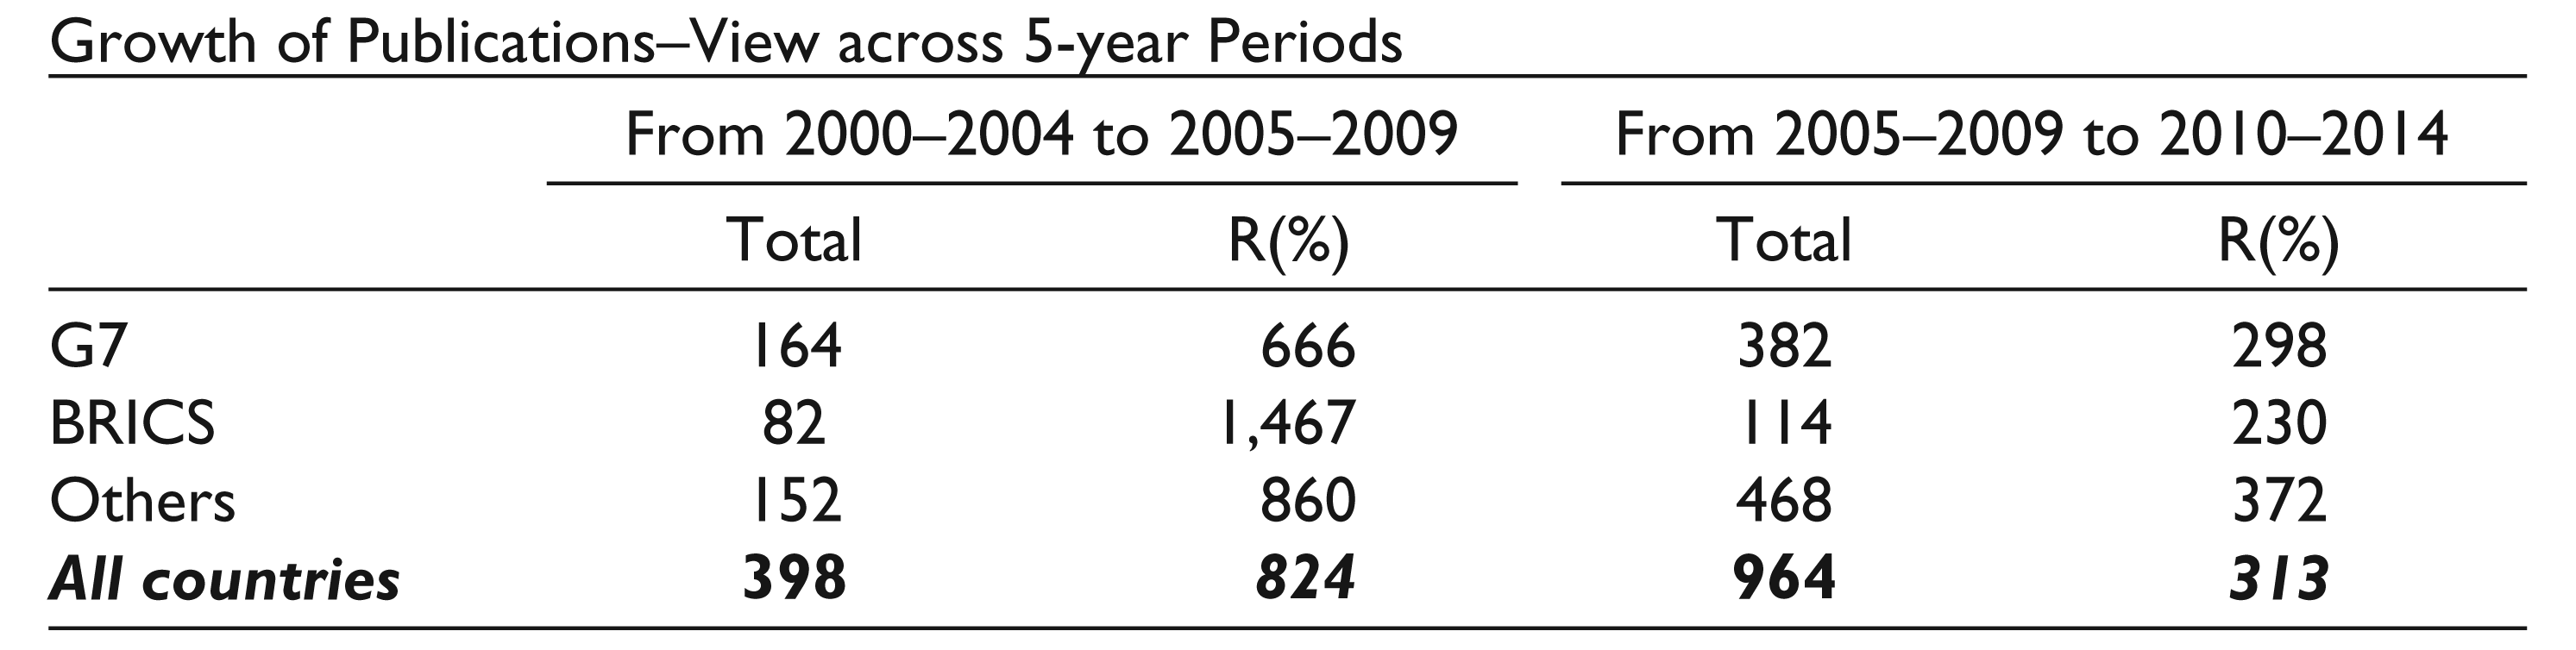
These growths by periods are best viewed in Table 2. Between the 2000–2004 and 2005–2009 periods, the publications by G7 countries increased 6.66 times. This growth is in line with the group of remaining countries (‘Others’), although the BRICS countries increased their publications by 14.67 times compared to the same periods. However, in absolute terms, the BRICS and G7 countries increased their publications, respectively, by 82 only and 146 articles over the same periods.
Growth of Publications during the 5-year Periods
Analysis of Citations
Unlike the analysis of the amount of publications, which does not necessarily indicate that a published article is usable, the analysis of citations plays an important role in the qualitative interpretation. This happens because the more a publication is referenced and cited, the greater the spread and the faster this concept may be used. The representativeness of citations can still mean that countries, journals or articles have greater maturity in the scientific research on this theme.
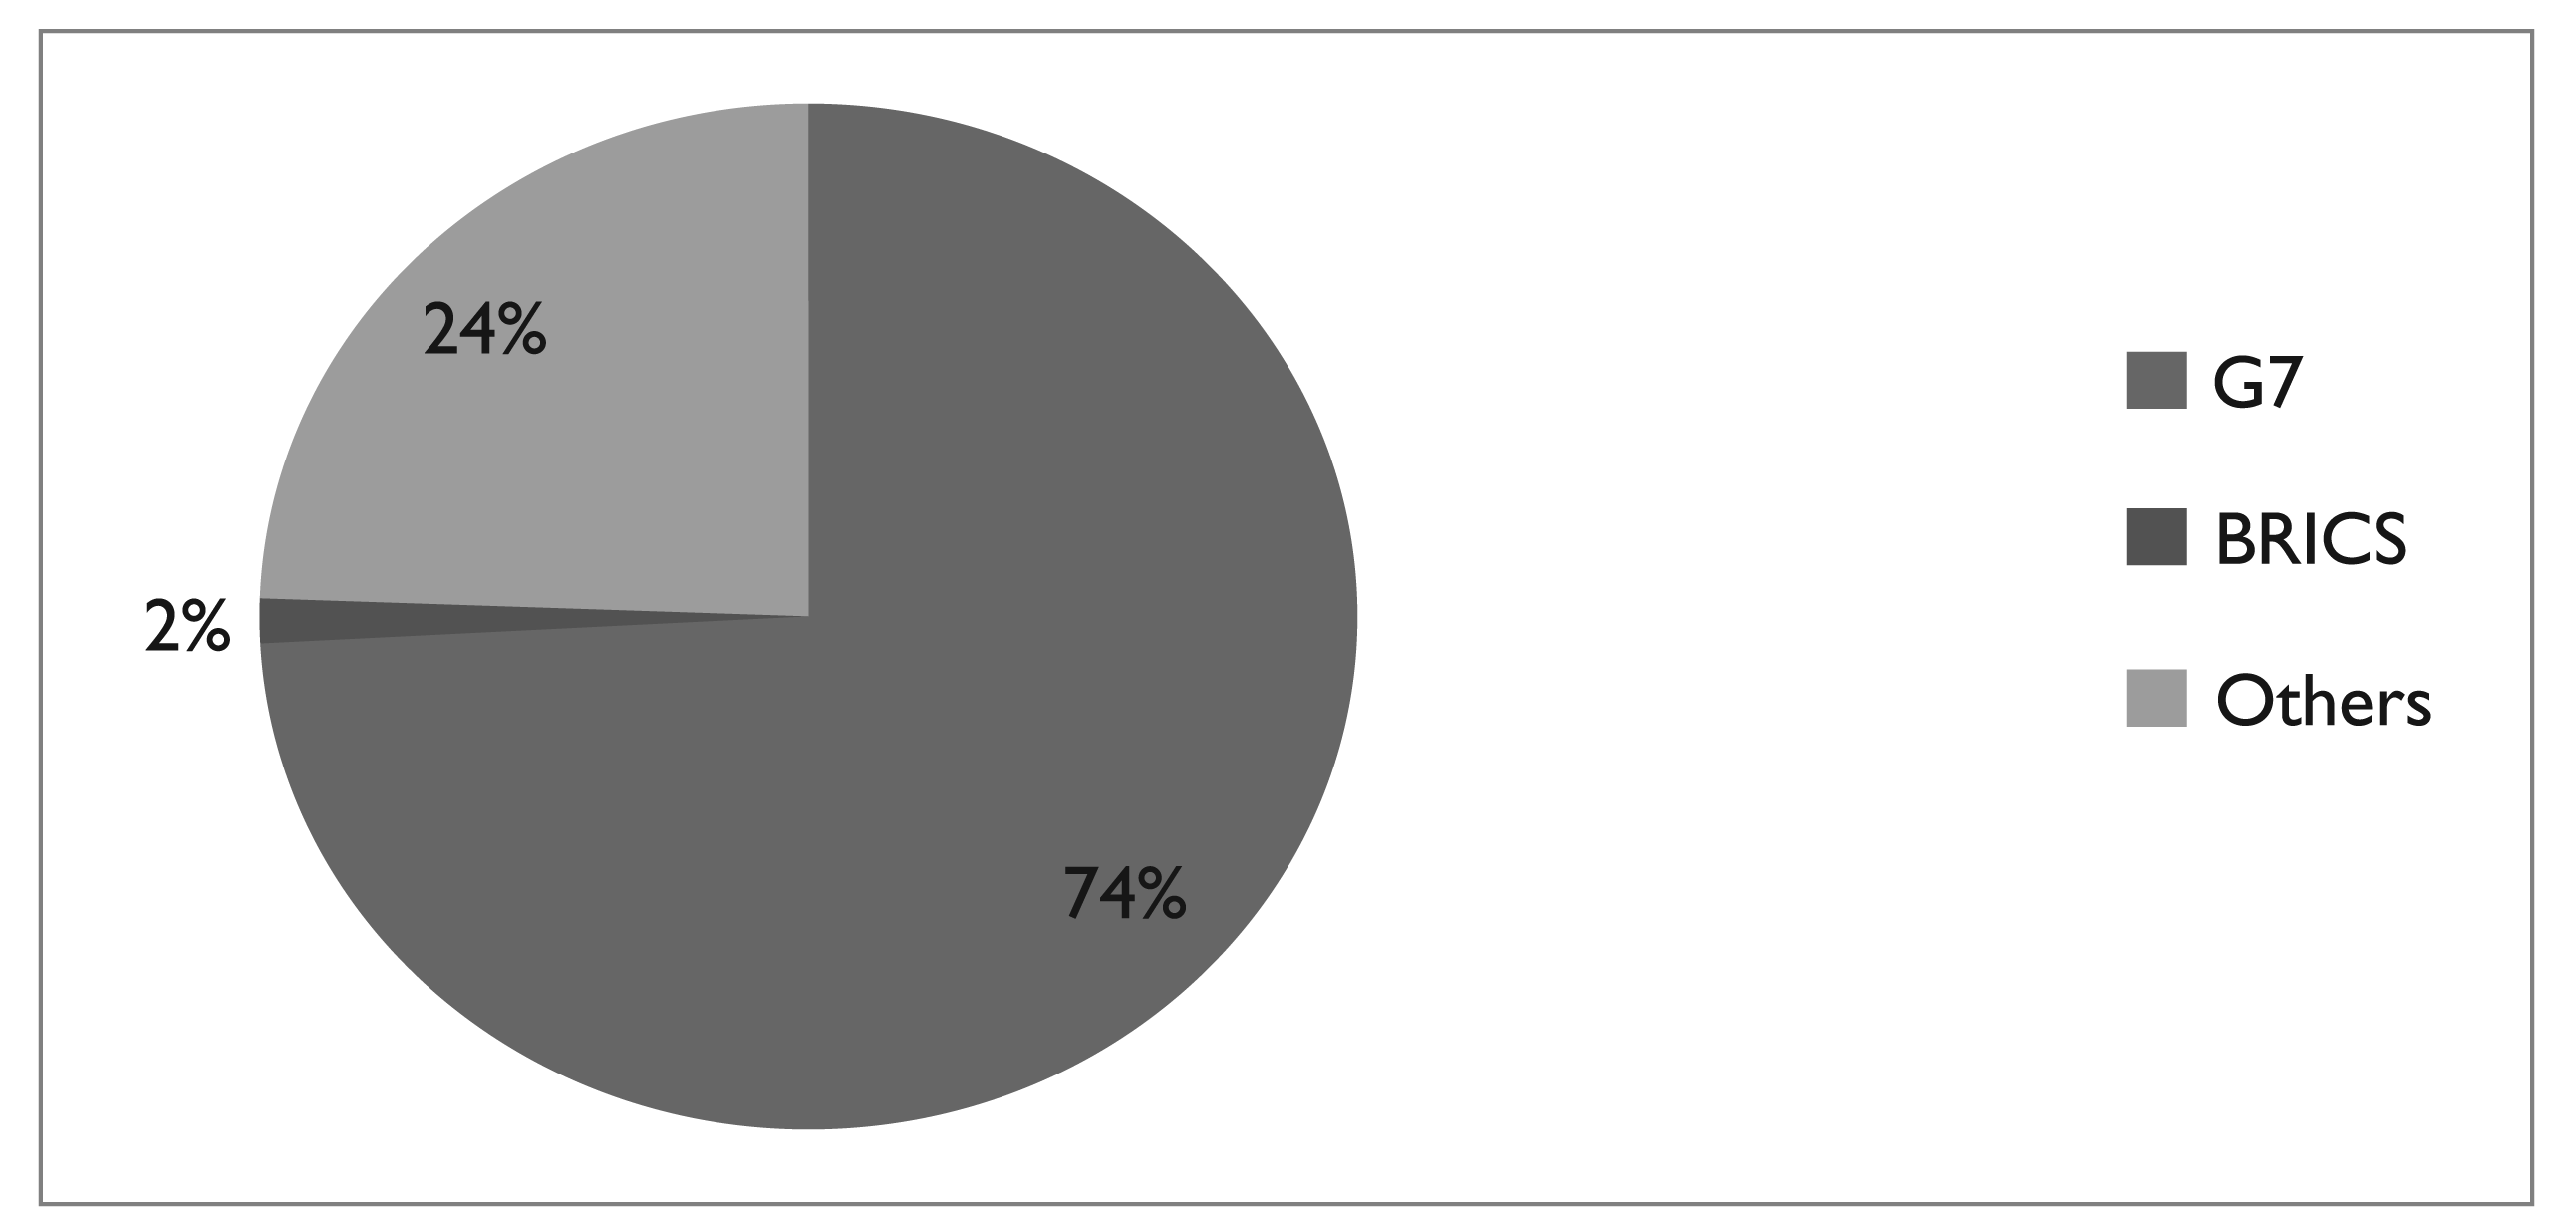
Figure 2(a) shows that the G7 countries hold 74 per cent of the citations, whereas the BRICS countries account for 2 per cent only. This shows an initial polarization of scientific development on open innovation as although the BRICS group has 15 per cent of all publications on the subject, only 2 per cent of these are cited in other publications. The G7 group has 42 per cent of the publications and accounts for almost three-fourths of the citations about open innovation.
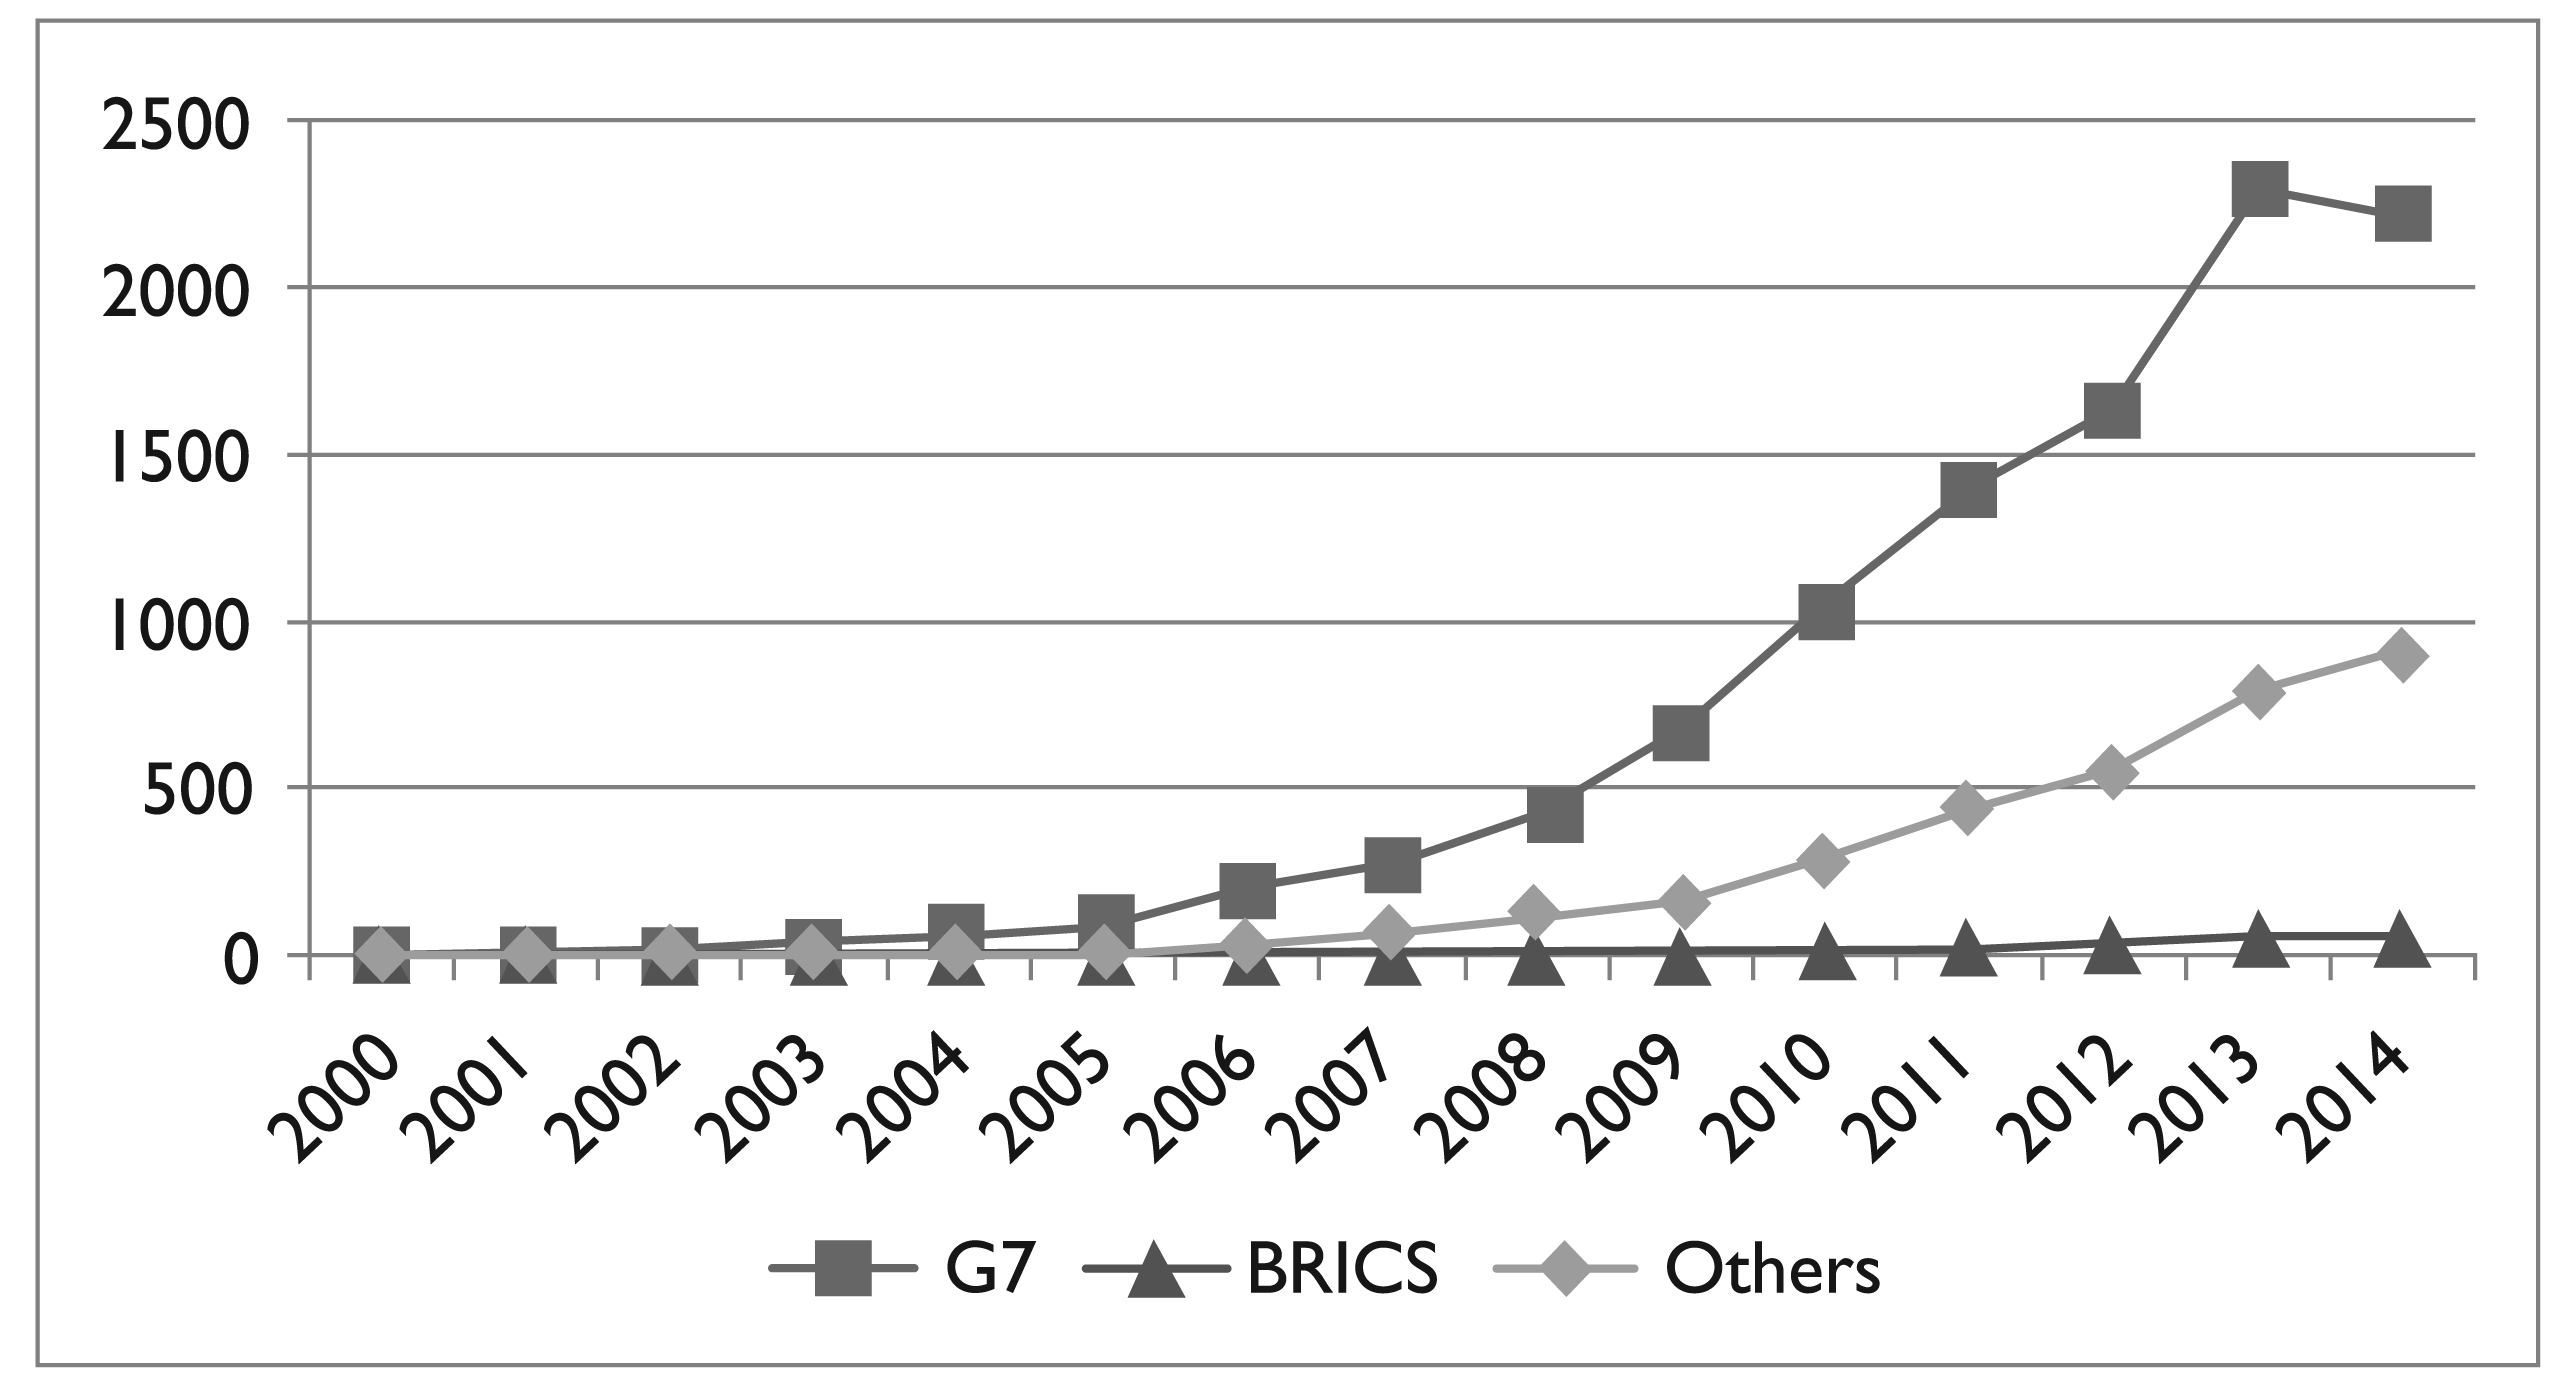
Figure 2(b) shows citation evolution year by year and one can see that there is an exponential growth in citations from 2005 in the G7 and ‘Other’ countries, following the growth of publications in these two groups as shown in Figure 1(b). However, the citations of articles from the BRICS countries virtually remained constant across the periods studied. This shows that G7 countries are currently influencing the scientific research on the topic of open innovation.
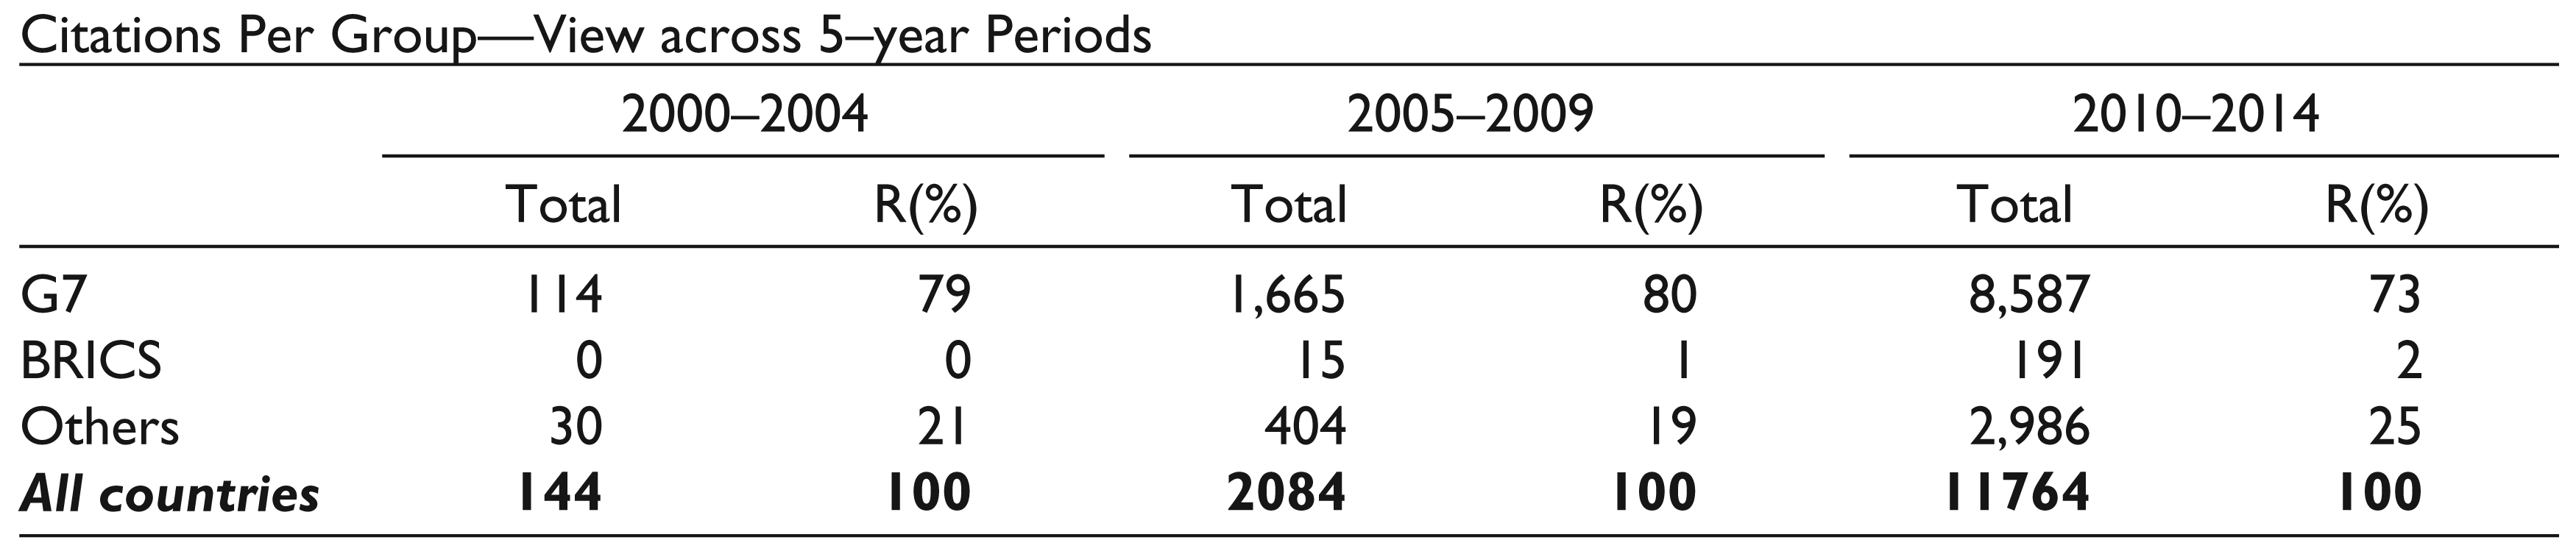
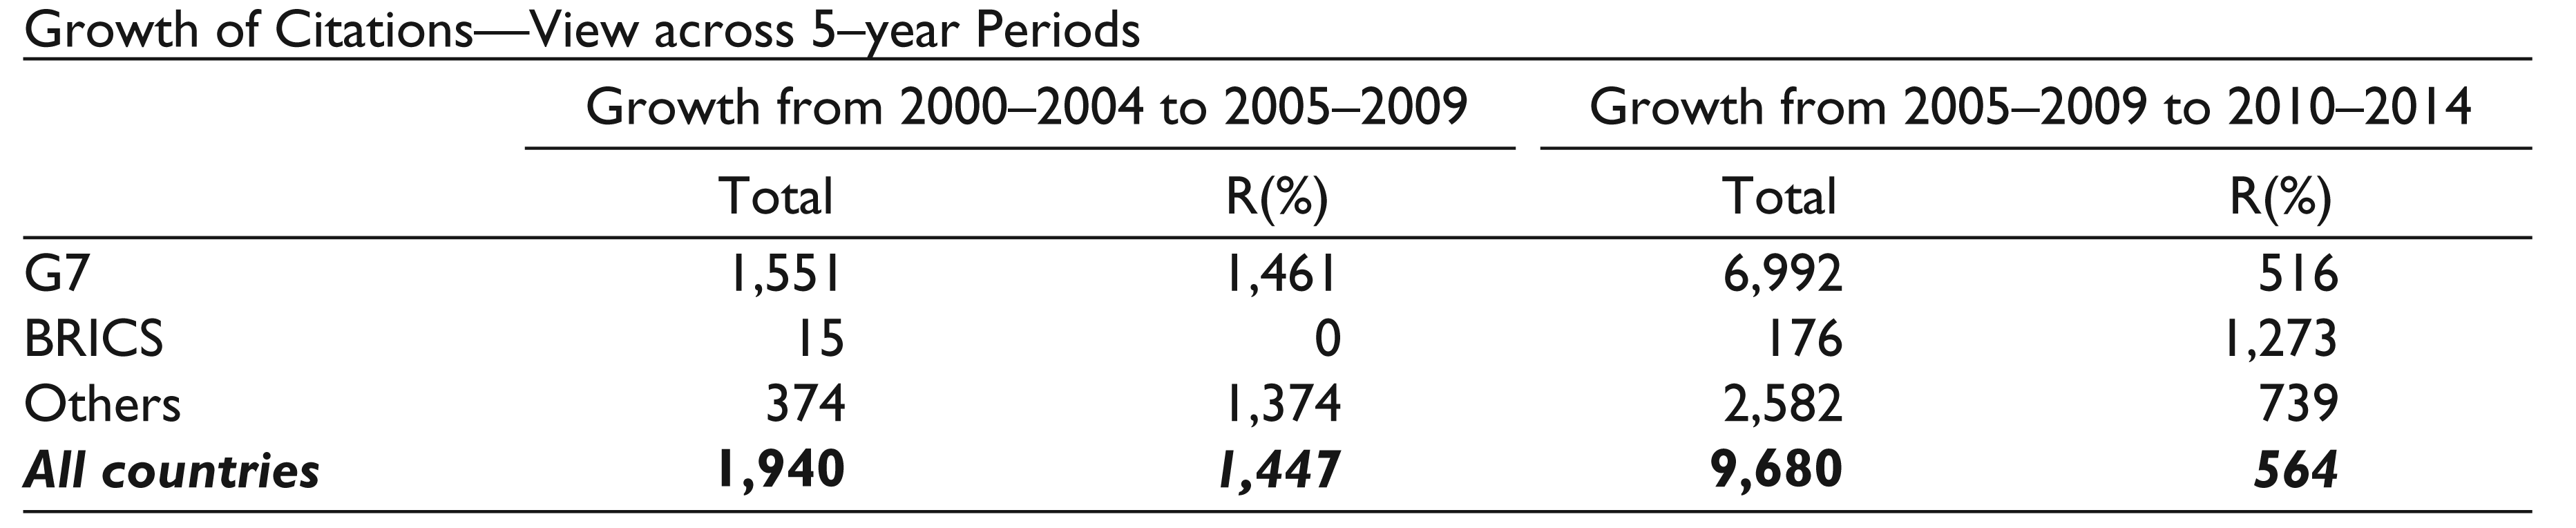
In order to reinforce this understanding, Table 3 shows the representation of citations in 5-year periods. Between 2000 and 2009, 80 per cent of the citations were in the G7 countries. But in the next period of years, citations of G7 publications accounted for 73 per cent of the total of articles analyzed. Table 4 lists percentage and absolute growth of citations in the G7 countries. Citations from the BRICS countries, although they improved across the periods studied, are almost inexpressive compared to citations from the other groups (G7 and Others).
Representation of Citations during Periods of 5 Years
Growth of Citations during Periods of 5 Years
Type of Publications
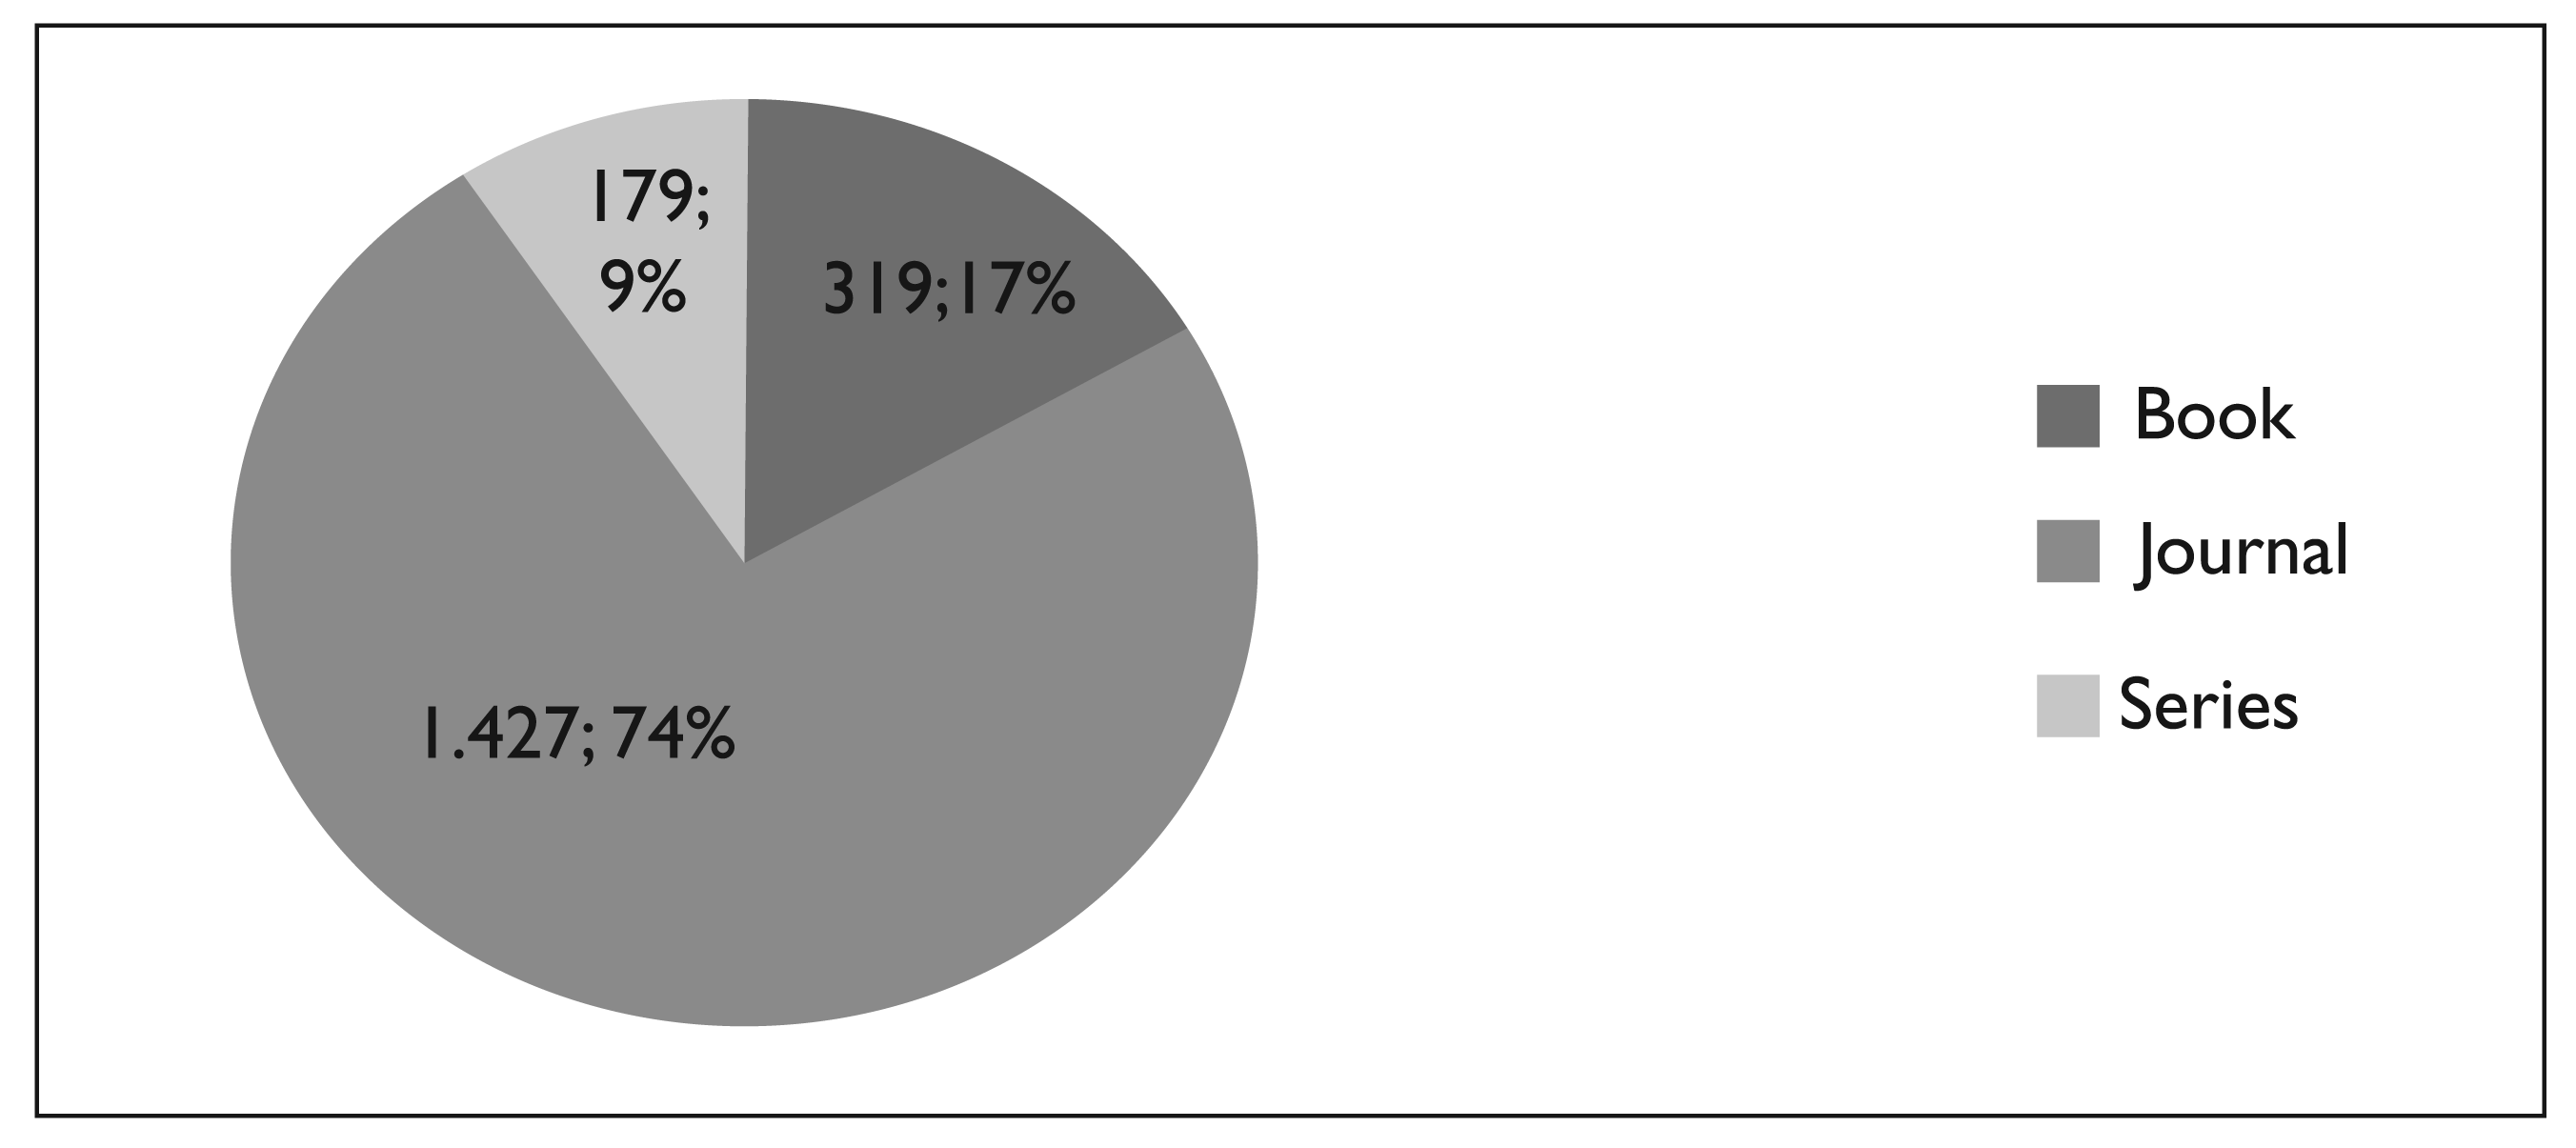
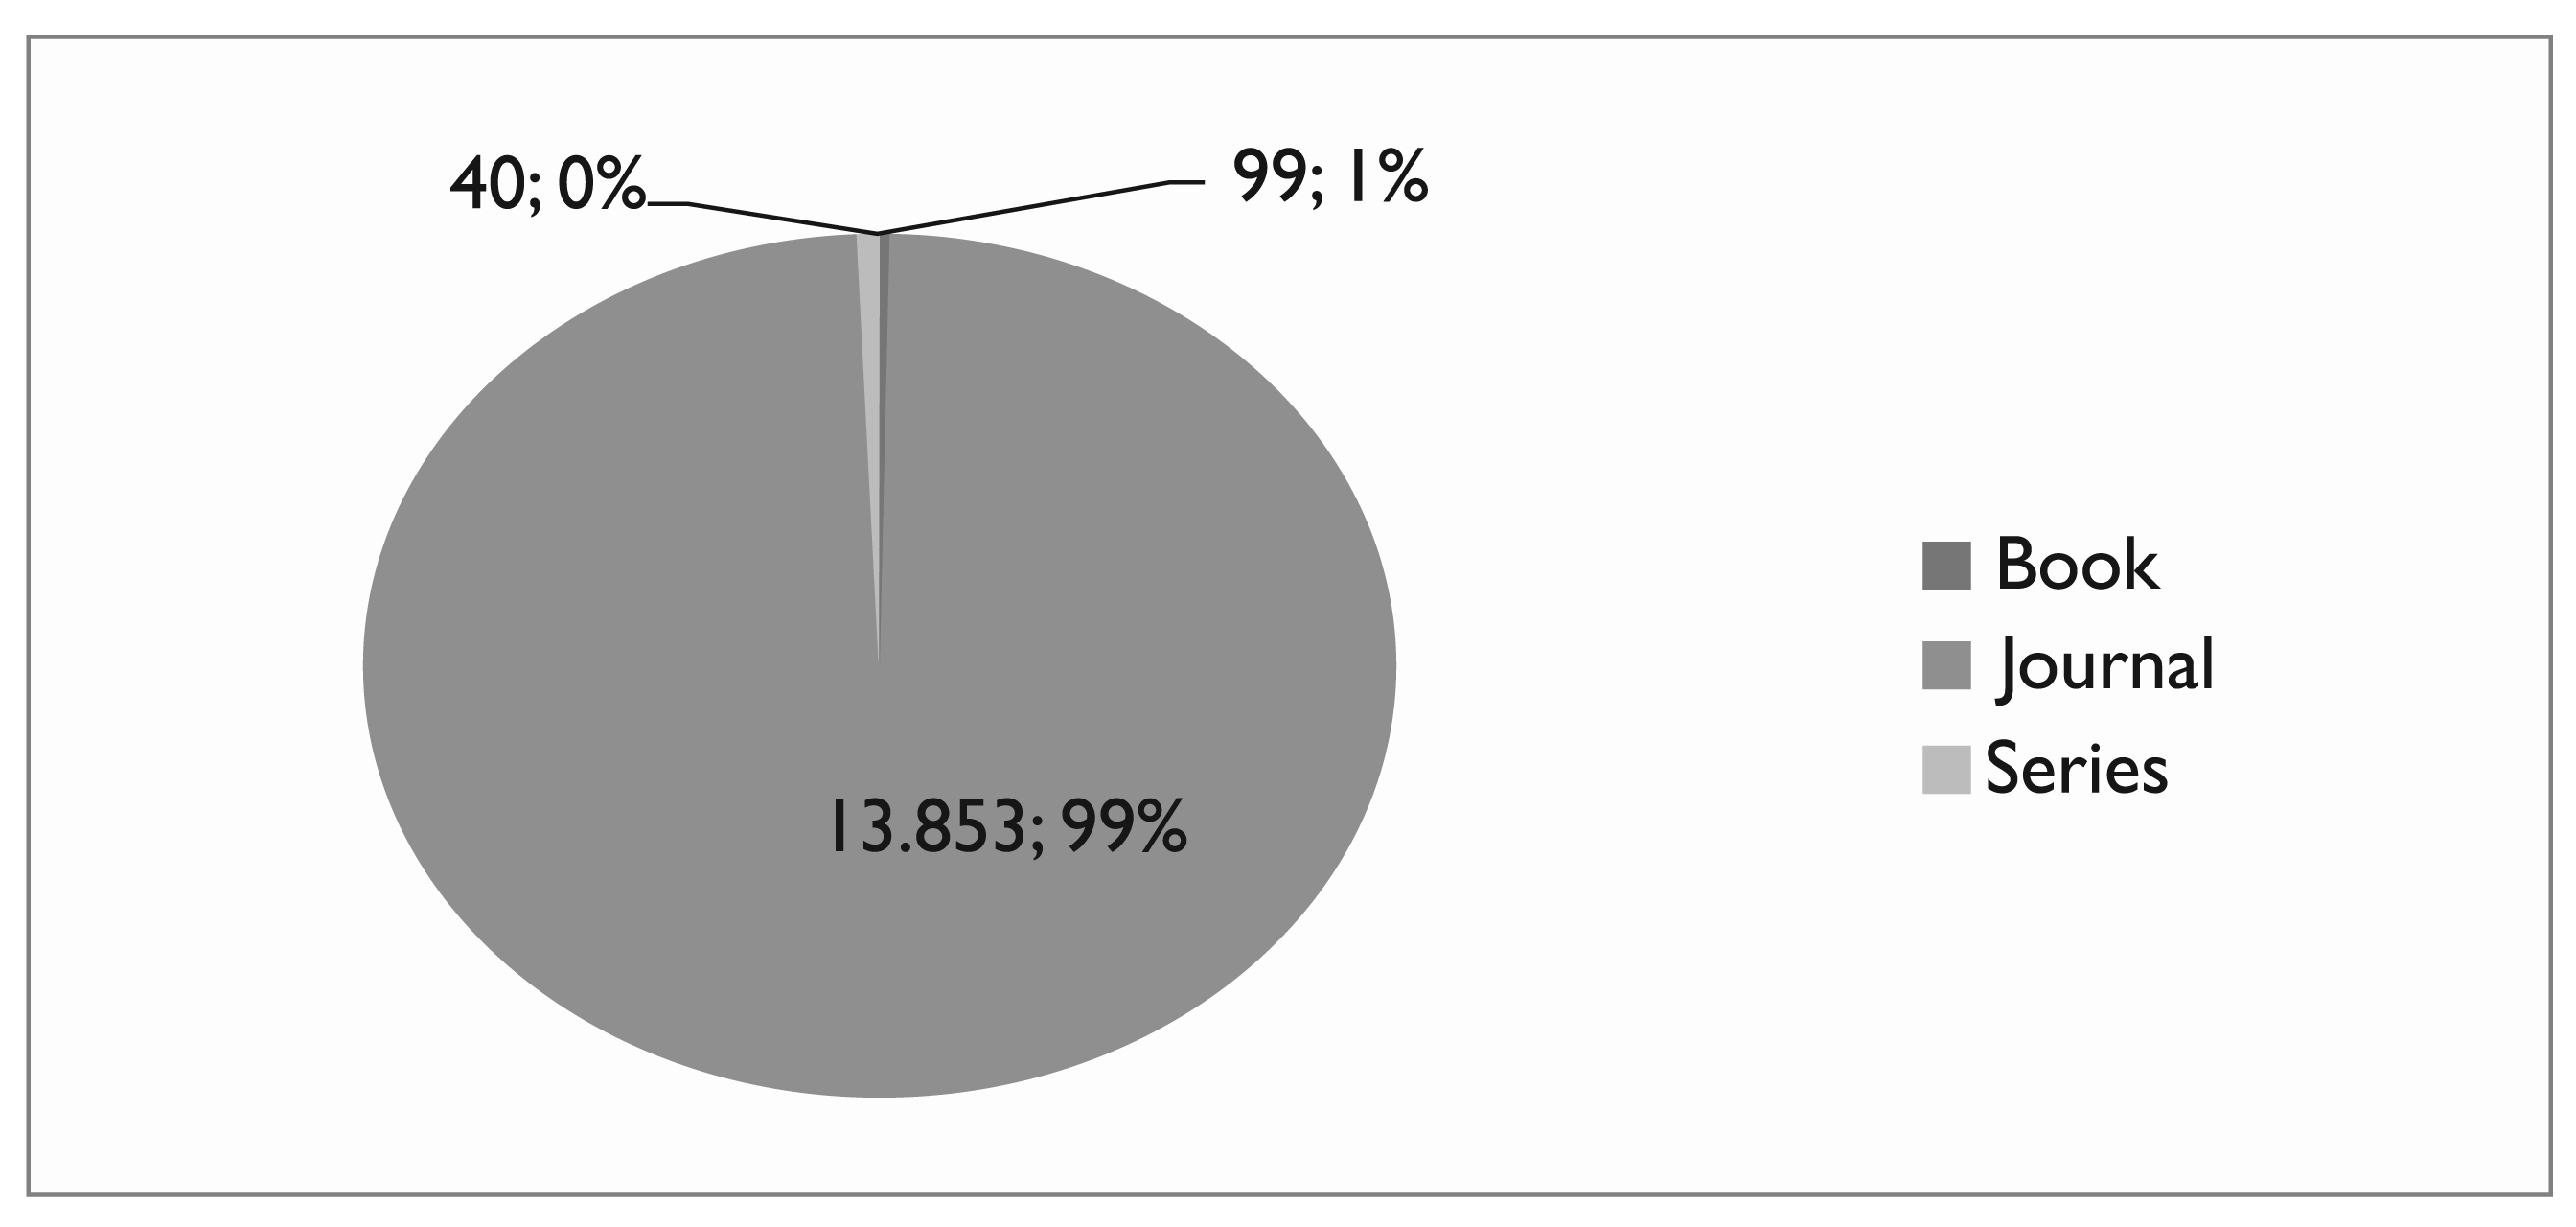
By observing the types of the most frequently used publications, articles in journals accounted for 74 per cent of all publications analyzed from 2000 to 2014, as shown in Figure 3(a). With regard to citations, periodicals account for 99 per cent of all citations—Figure 3(b).
In general, articles sent to journals are submitted to a more rigorous evaluation than other types of publication, thus making contents of the articles more accurate and profound when they are submitted to this type of publication.
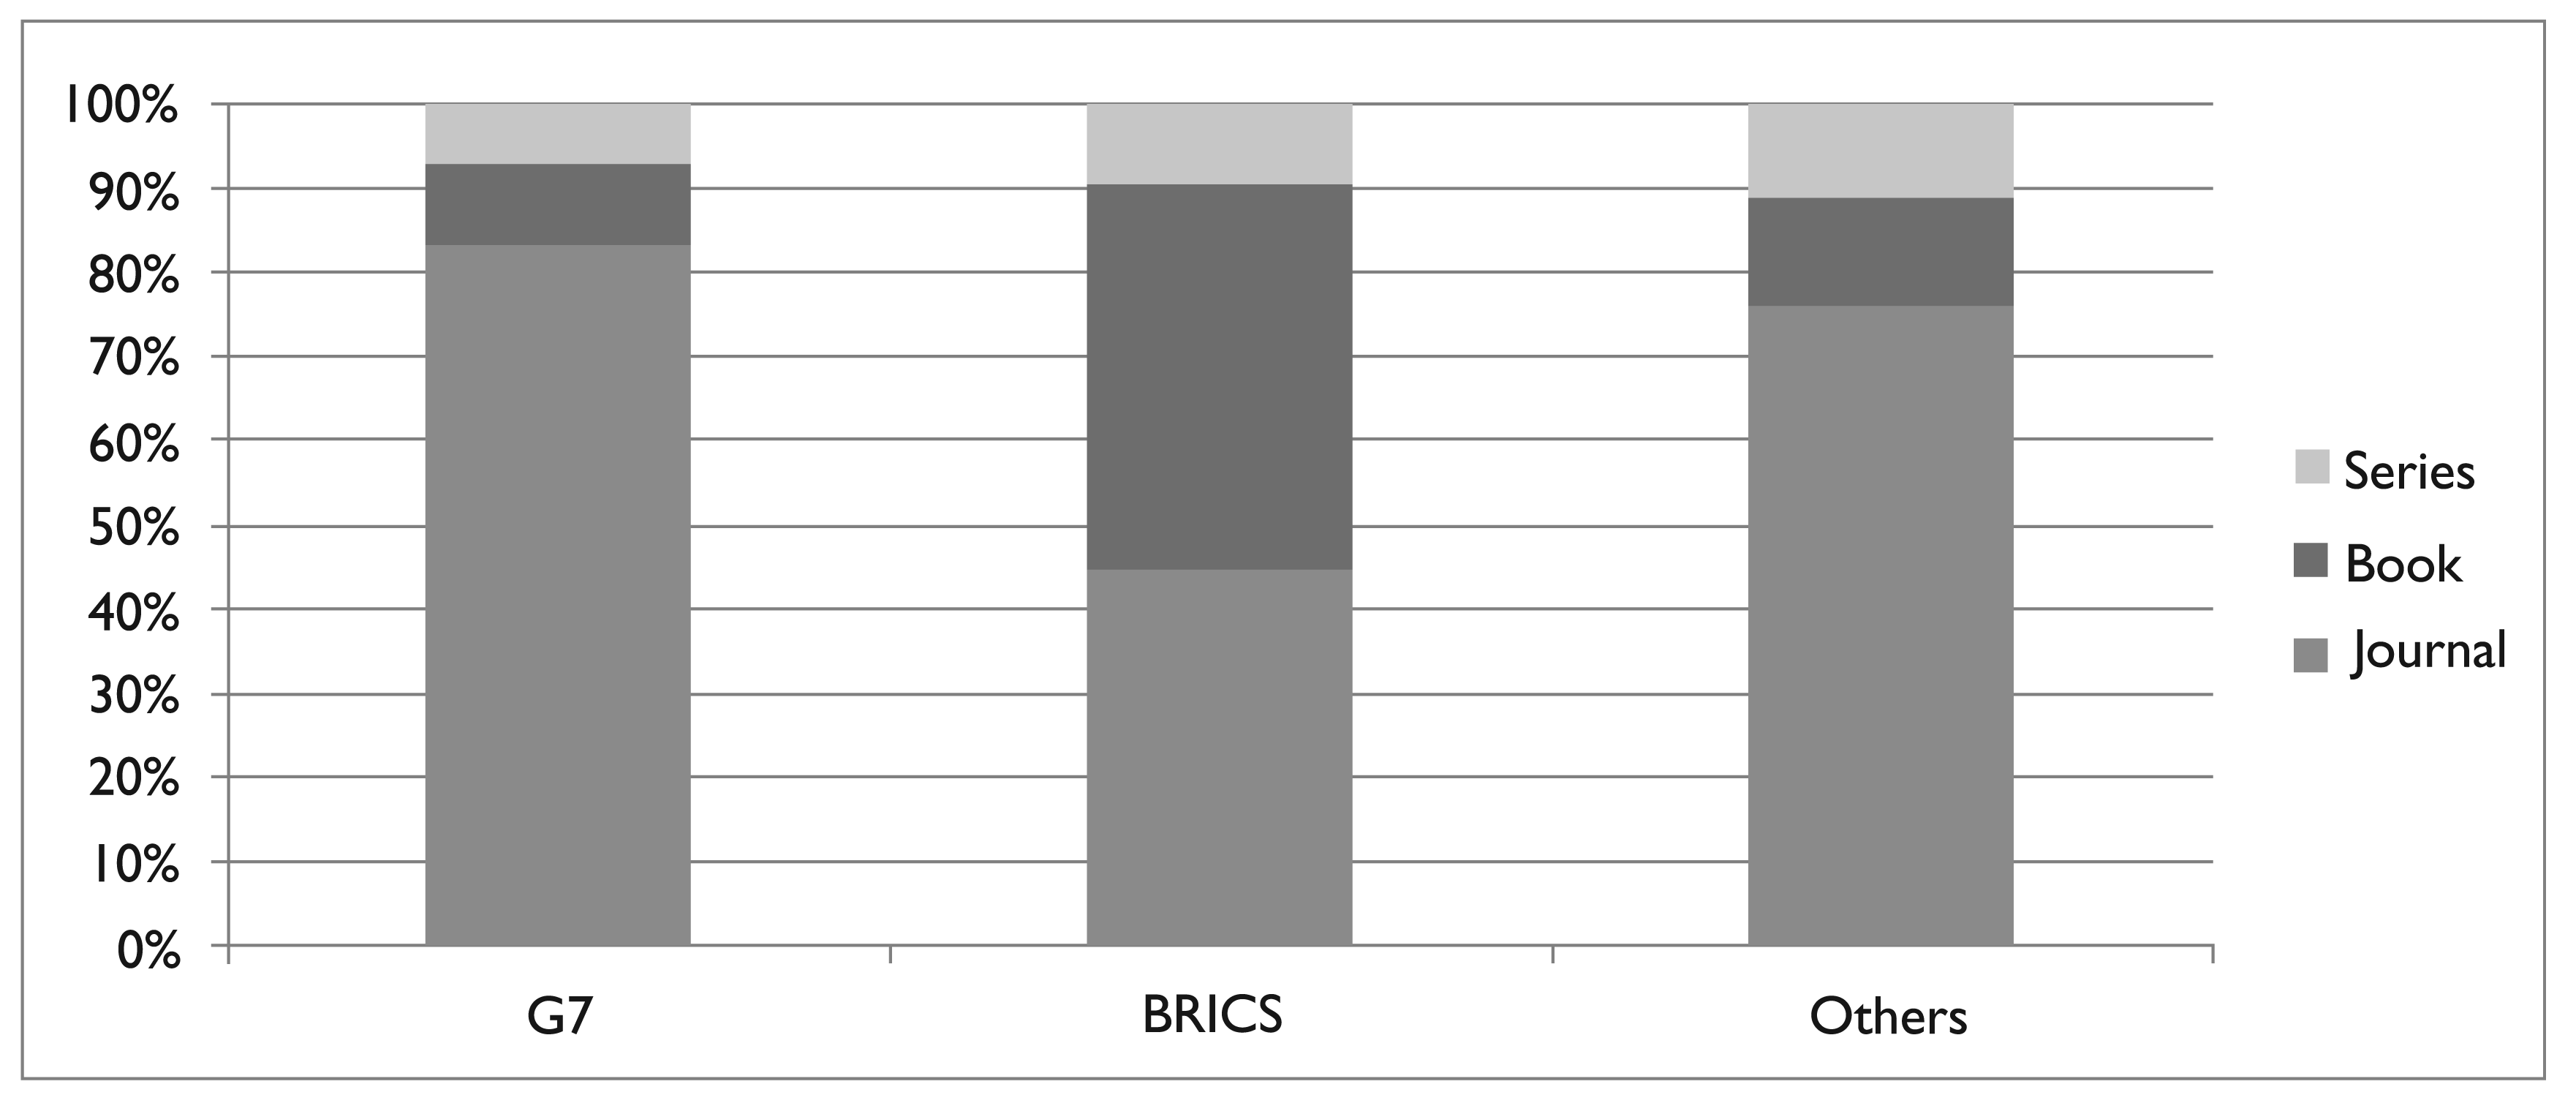
With regard to the groups of countries, we can see that both G7 and ‘Other’ countries have more publications in journals than in books and series. On the other hand, the BRICS countries have more than a half of their publications in books, as shown in Figure 4. This explains the low citation rate of articles from the BRICS group, as seen in section Analysis of Citations.
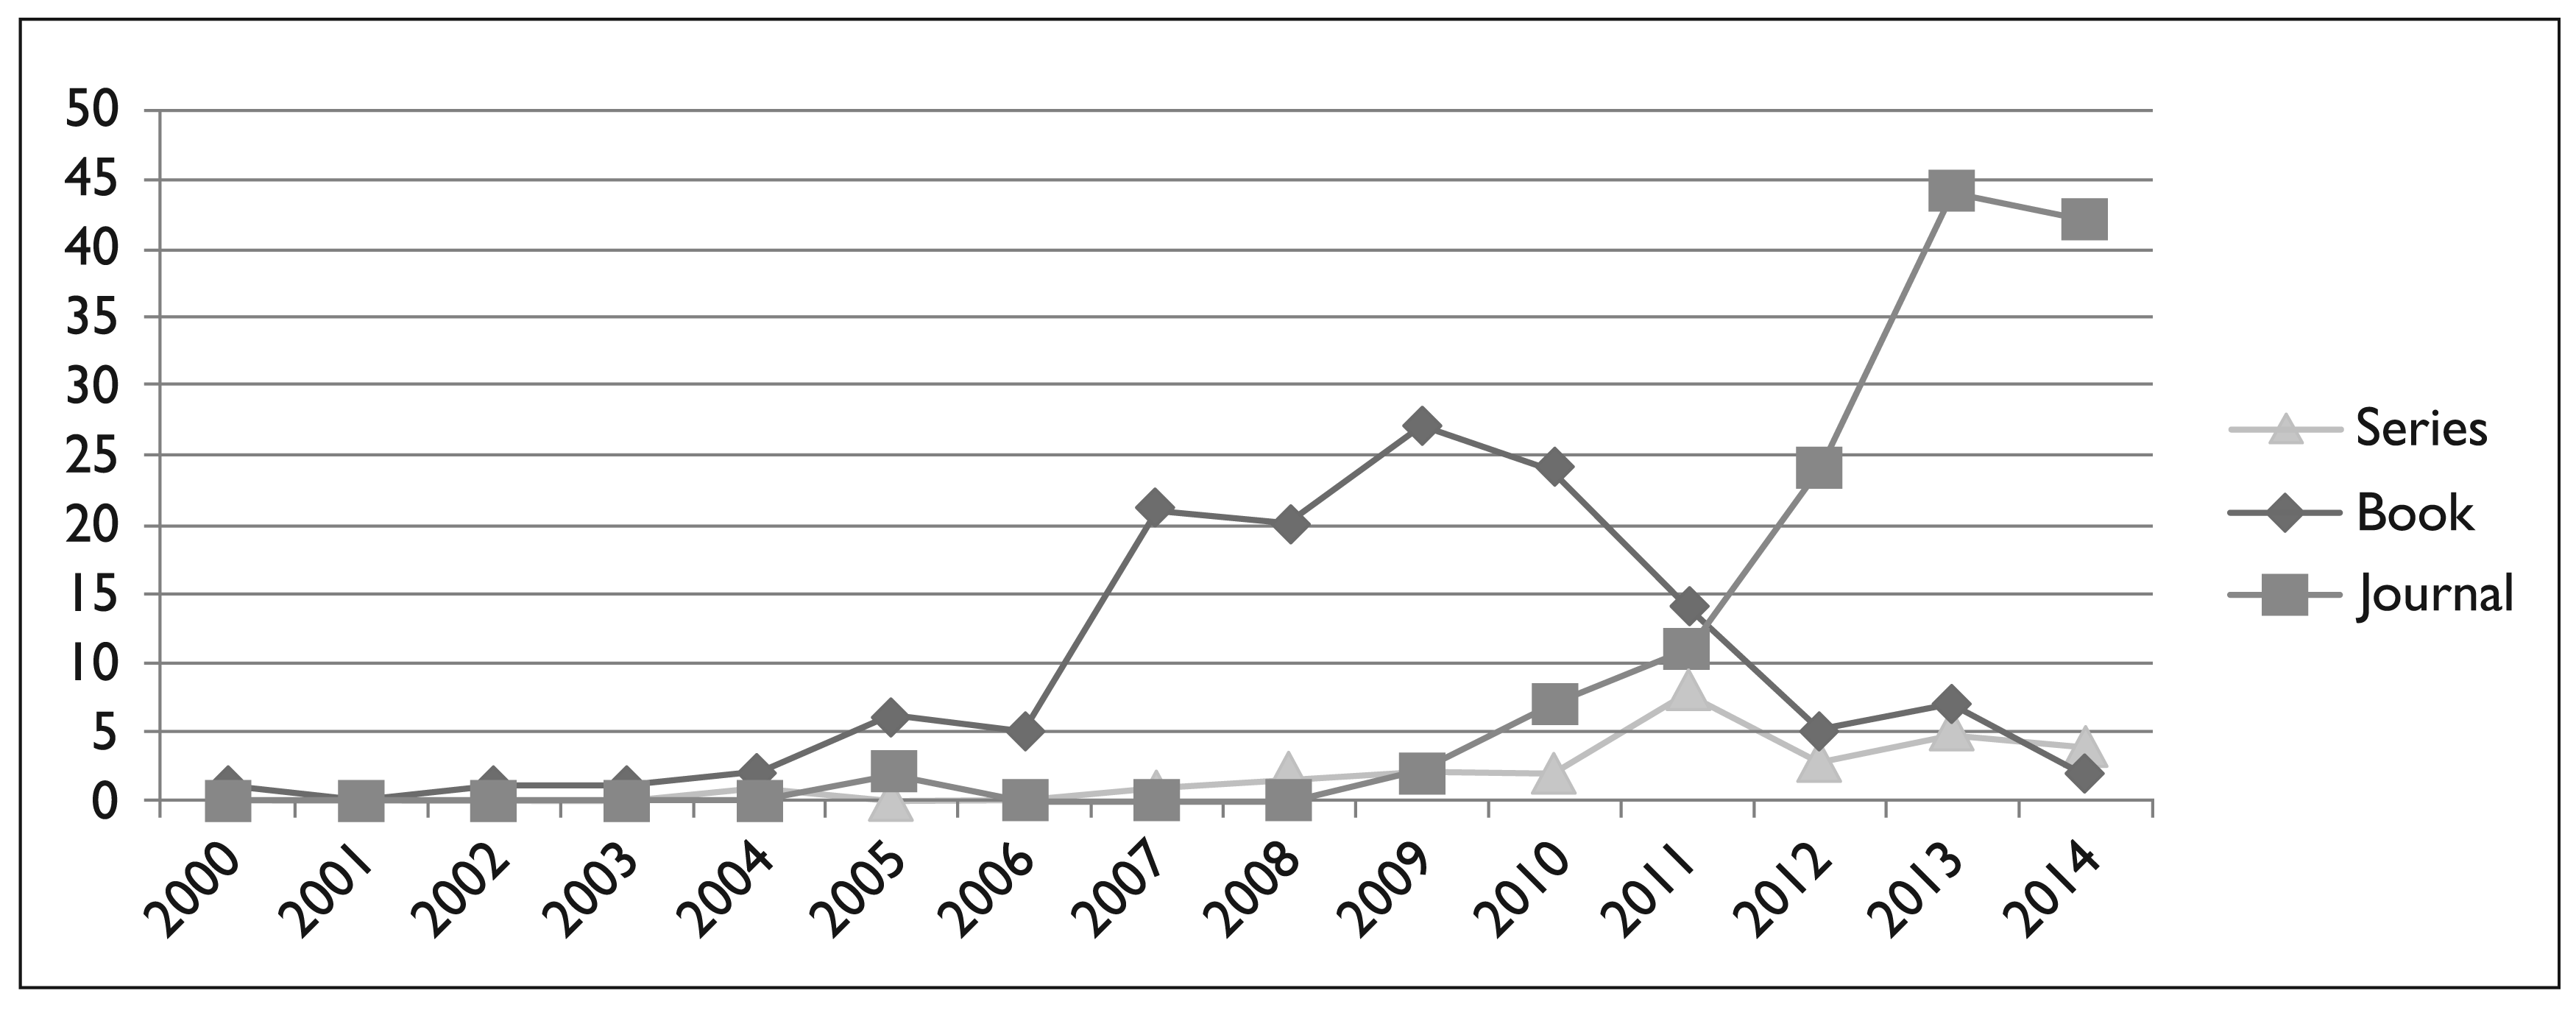
An interesting fact is that when analyzing the curve of BRICS publications (Figure 5), we can observe a drastic drop in publications in books and an increase in publications in journals. This is already a first step towards the capture of references and acceptance of works produced in the BRICS countries.
Analysis of Data Sources
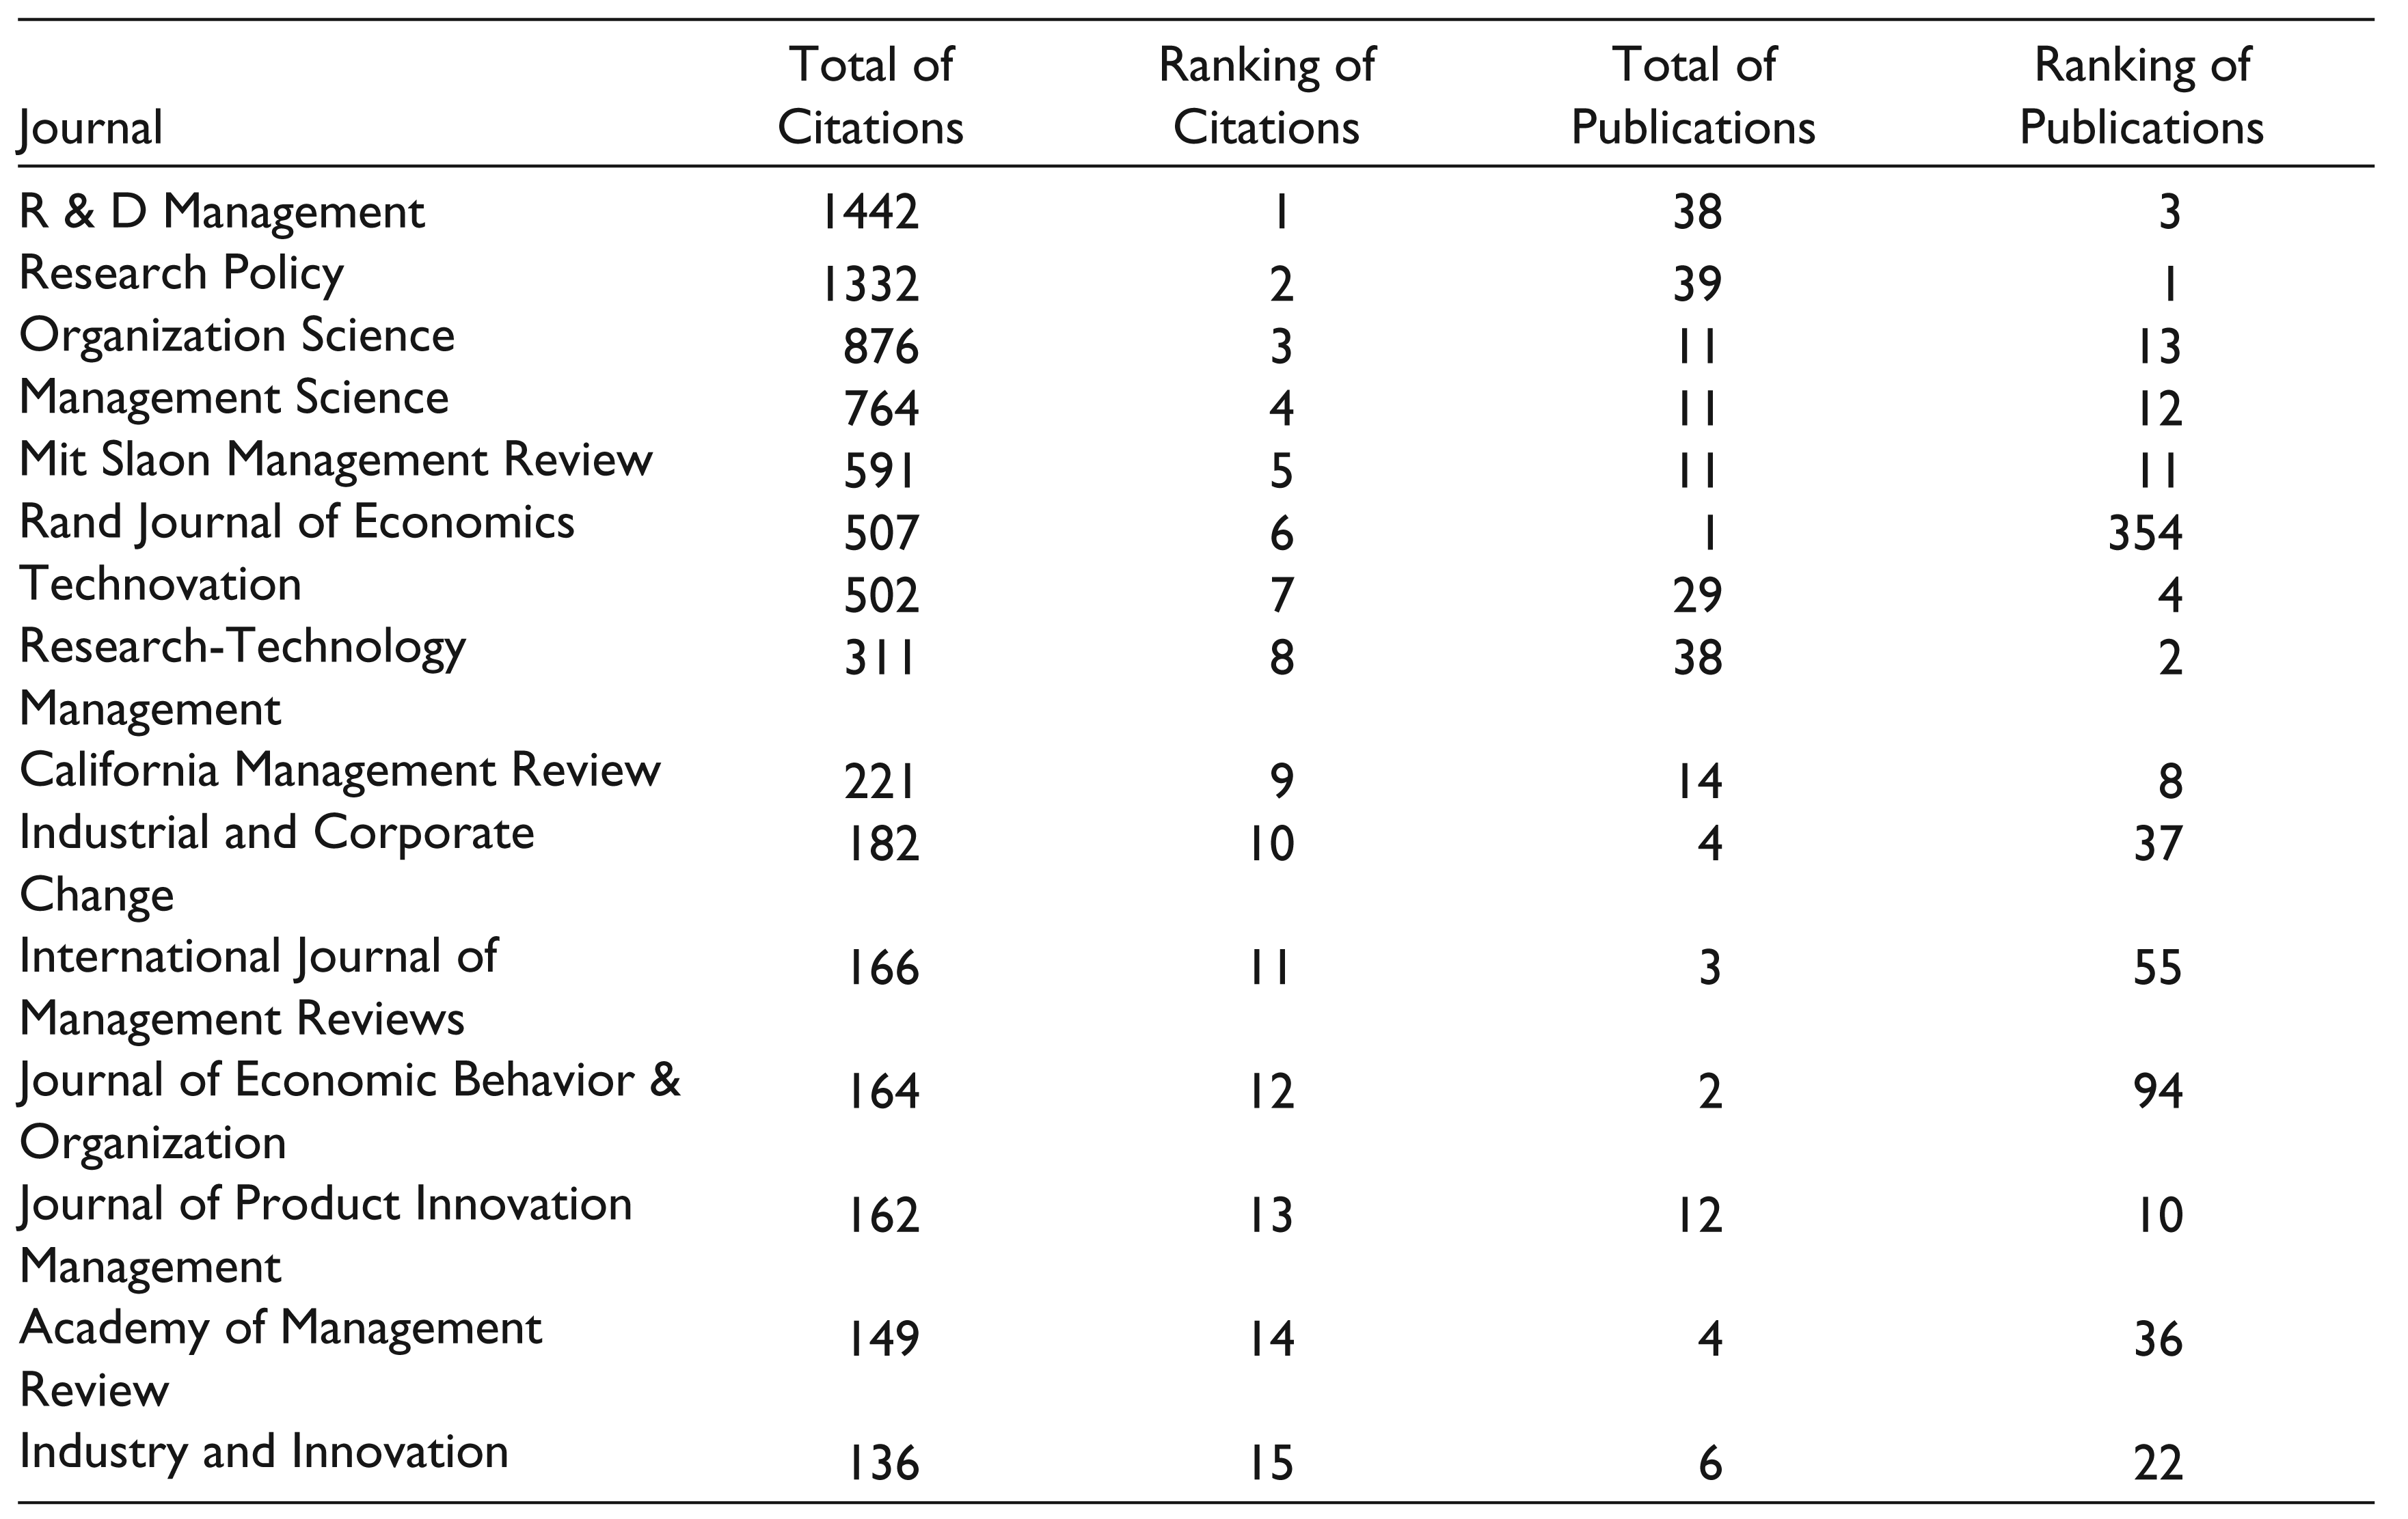
The database used for this study provided a total of 839 data sources of publication from all countries for terms related to open innovation. The top 15 data sources of citation and publication for the G7 group are listed in Table 5.
It is observed that these top 15 data sources account for 28 per cent of all articles published by researchers from G7 countries and for 72.4 per cent of citations obtained for this group. The four journals most used by this group are related to technological innovation and management innovation, namely, R&D Management, Research Policy, Organization Science, Management Science and MIT Sloan Management Review. The markings in Table 5 show that for the dark-grey cells, data source is better ranked for citations and publications; grey markings mean that the data source is in intermediate position; and a light-grey marking means worse positions than the other publication data sources. An interesting fact is that journals with more articles do not necessarily mean that they are the most cited. This is the case of the Technovation journal, which is the fourth largest source of publication for the G7 countries (indicated by dark-grey colour), but only seventh in the ranking of citations (in grey).
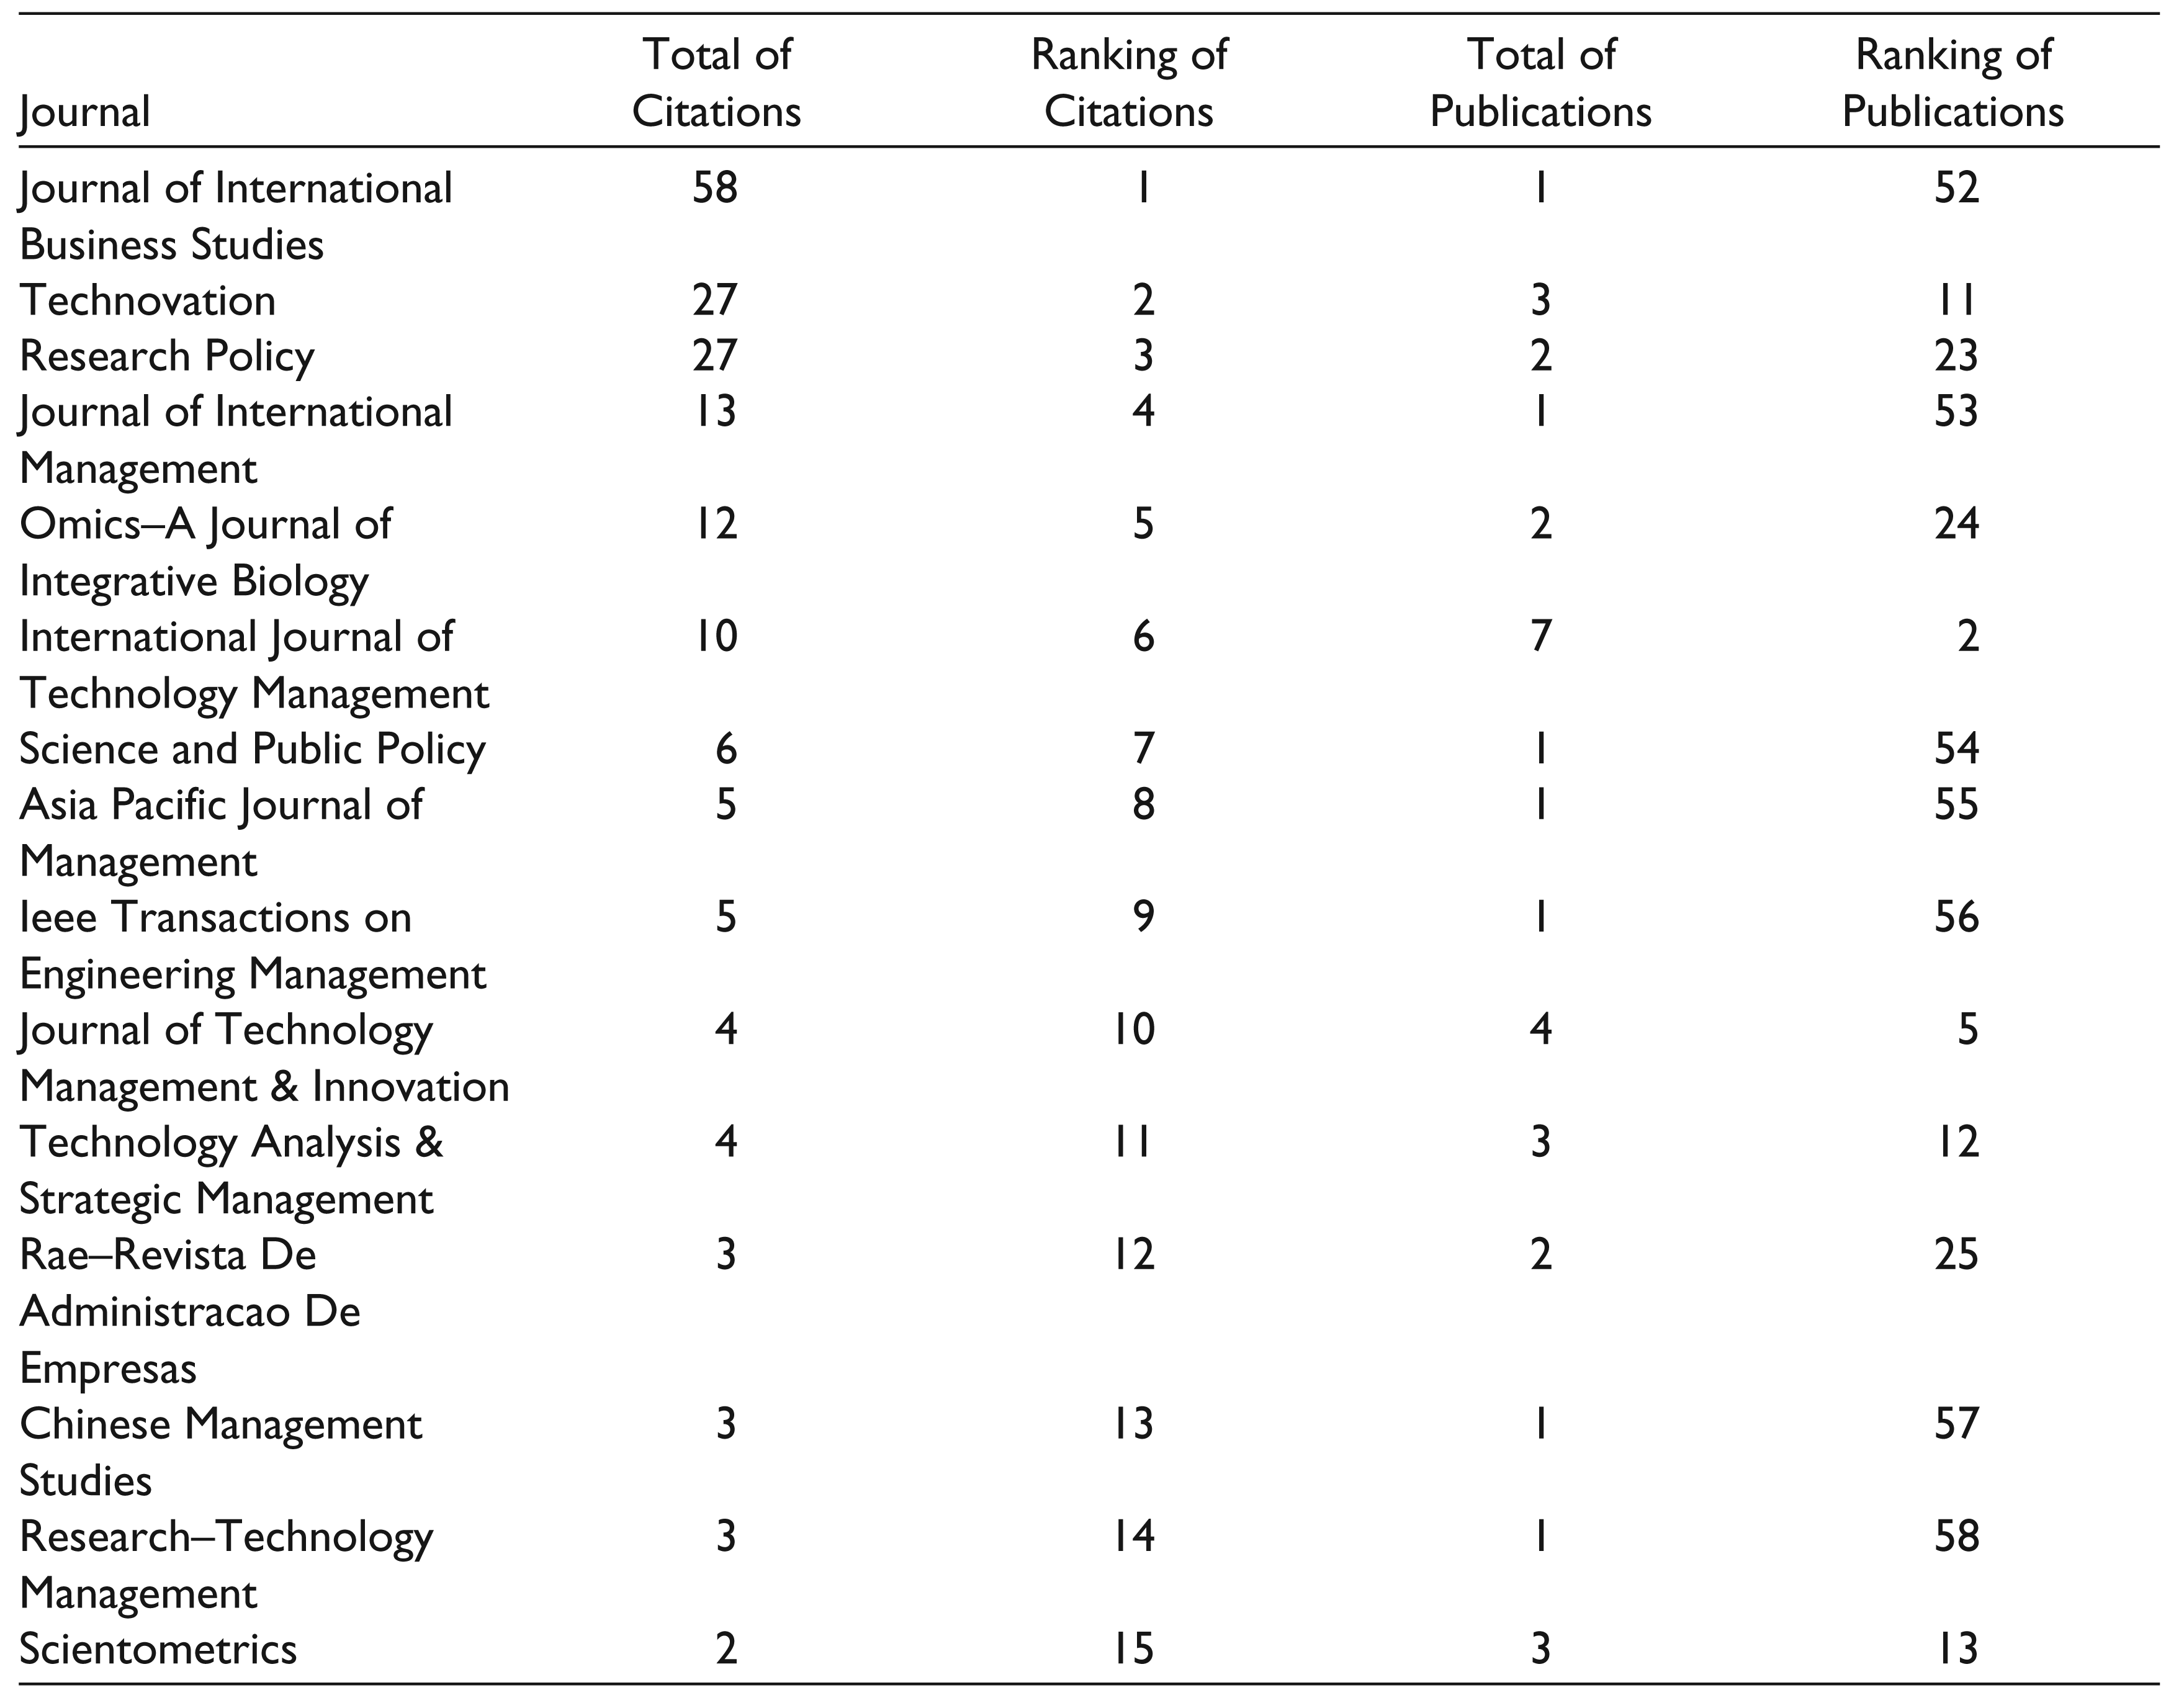
However, when analyzing the sources of publication for the BRICS group (Table 6), it can be observed that the rankings of publications and citations are even more discrepant. The Journal of International Business Studies is the most cited source of articles from the BRICS countries, but it is 52nd in the ranking of publications.
The Top 15 Sources of Citation and Publication for the G7 Group
The Top 15 Sources of Citation and Publication for the BRICS Group
Macro-analysis between Groups
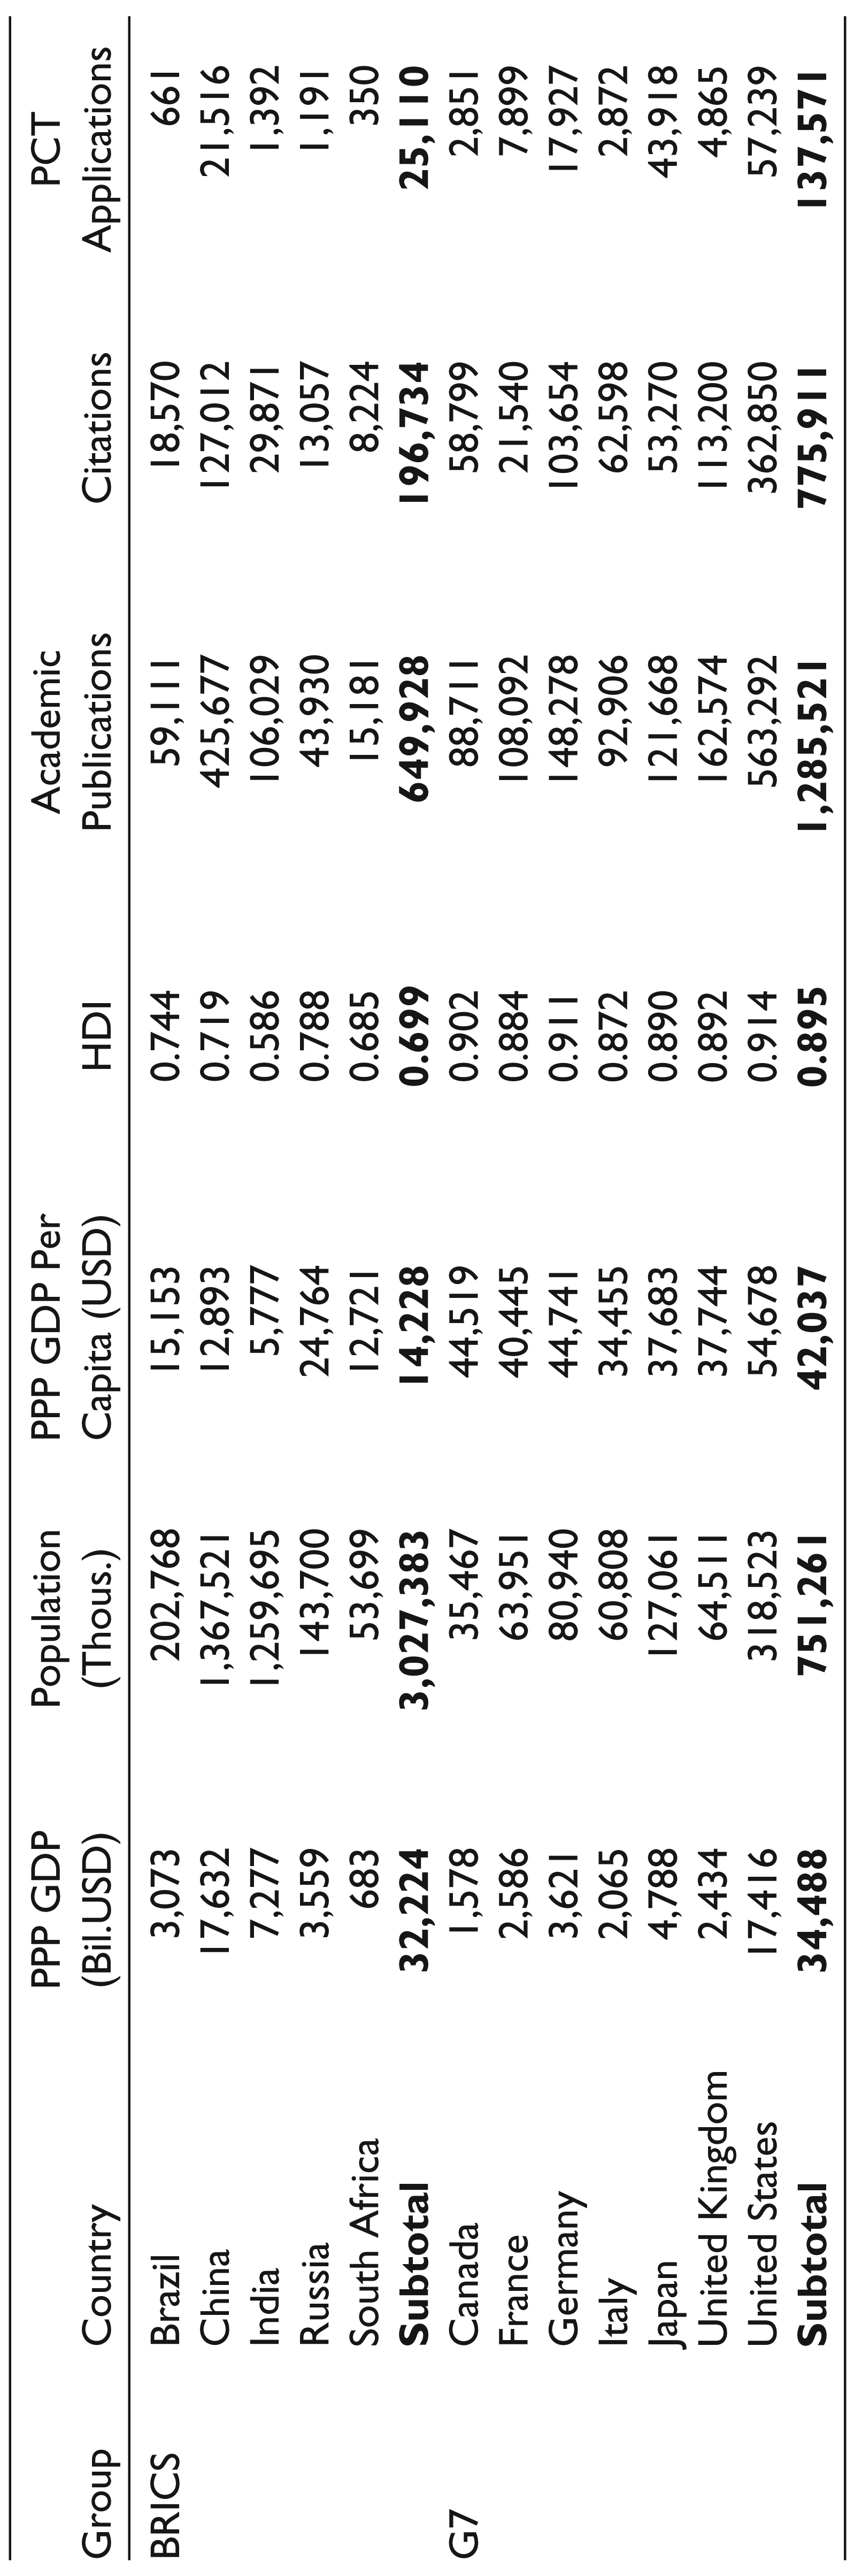
The differences between the countries of each group, G7 and BRICS, are easy to understand when comparing some indicators, such as GDP, GDP per capita and HDI, as shown in Table 7. Although the BRICS countries produced almost the same GDP in 2014 as the G7 countries, totalling U$32.22 trillion and U$34.48 trillion, respectively, the distribution of GDP per capita is quite different between the groups: While the average of GDP per capita is U$42.037 per year in the G7 countries, this value is U$14.228 per year in the BRICS countries, that is, three times lower. Another important difference is the HDI: While all countries of G7 are rated as having very high HDI (greater than 0.87), the BRICS countries, such as Brazil, Russia and China, have a high HDI and India and South Africa have moderate HDI. Furthermore, when we compare the number of publications and citations, the G7 surpasses the BRICS twice and four times, respectively. Finally, when looking at the indicator about PCT application, the G7 has 5.4 times more patents submitted to the PCT system than the BRICS. Based on all these indicators of economic, social, scientific and technological performances, we can see the degree of evolution and maturity of the G7 countries compared to the BRICS ones. Somehow, the social and economic supremacy of the G7 countries also appears to be correlated with the results of innovation regarding superiority in both scientific research and technological development.
Comparison of Social, Economic, Scientific and Technological Indicators between G7 and BRICS
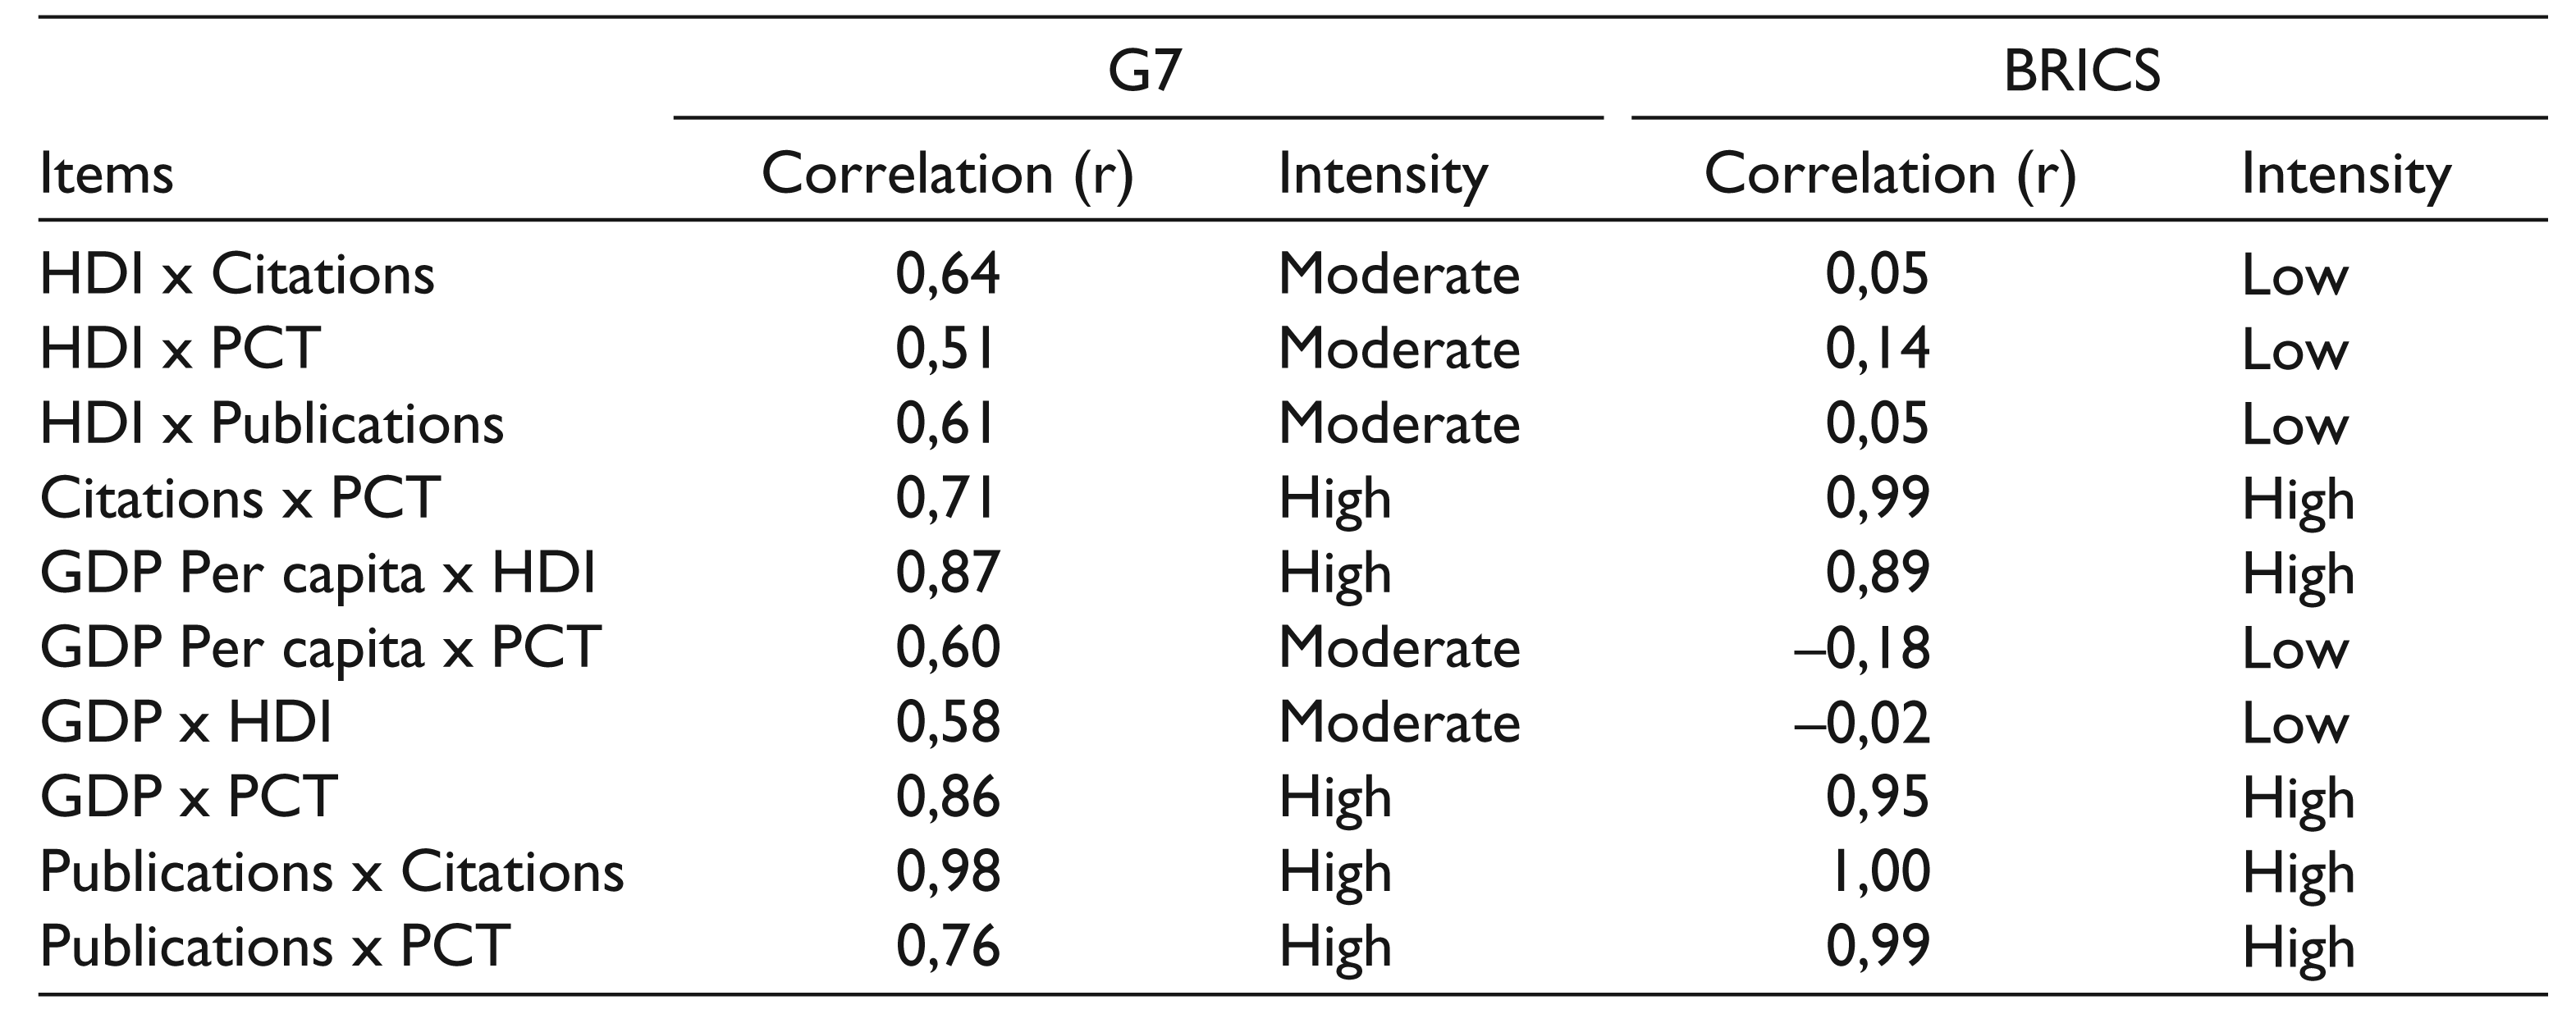
In Table 8, we can observe the intensity of the correlations between the different variables shown in Table 7. There is a greater stability in the correlations between economic, social, scientific indicators and technological production for the G7, whose variables show intensity ranging from moderate to high. For the BRICS, however, the correlations show a greater variation that leaves doubts about the dependency relationship between the variables.
Therefore, it can be said that authors from countries with high HDI and GDP per capita produce more scientific publications and achieve better acceptance among the authors from different countries. Nevertheless, it is known that one of the levers of economic development of a nation relies on how well efforts and investments are made in research and technological innovation. Thus, countries such as the United States, Germany and Japan are historically at the forefront of the scientific and technological development and thus economically as well.
Regression Multilevel Statistic Analysis
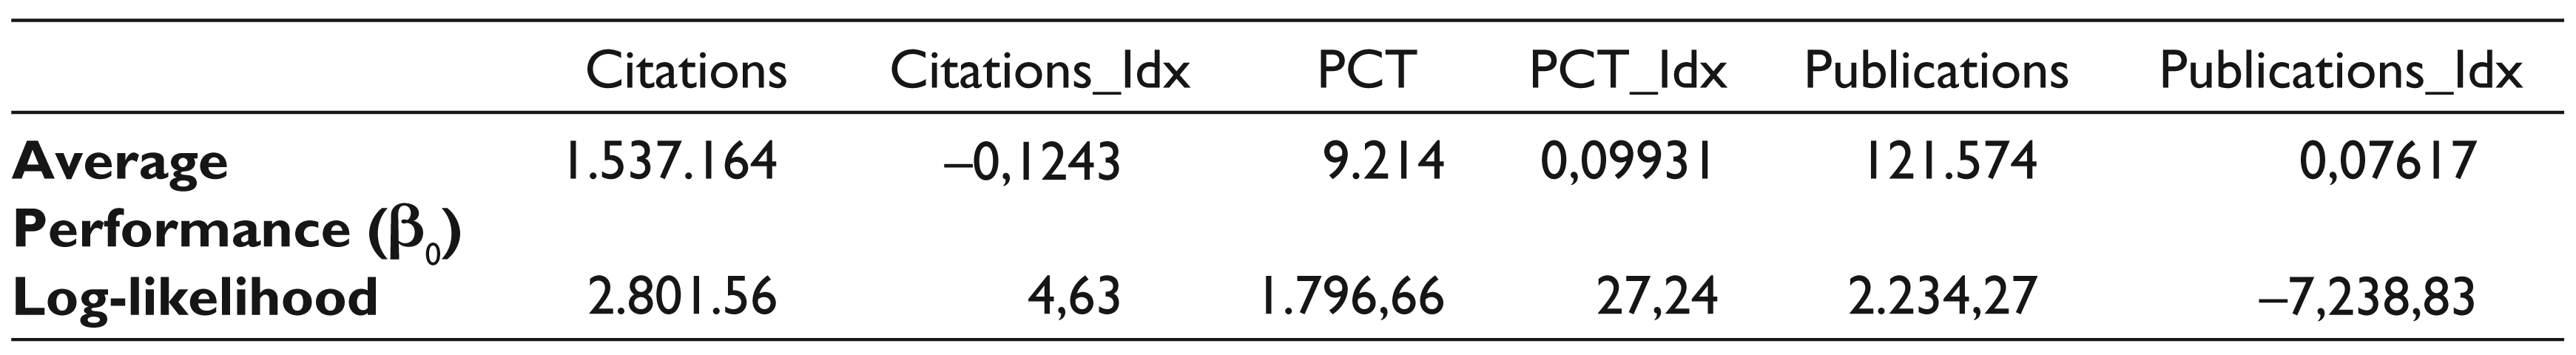
Using the model proposed in the methodology section, the effect of the group on the dependent variables selected to measure performance of countries was evaluated. In this model, the levels of the hierarchical analysis were ordered by observations per year (first level), country (second level) and group (third level). This model was estimated for the six performance indicators. Table 9 shows the average of coefficients for each dependent variable and the model fit by ‘log-likelihood’.
Correlations between Indicators of G7 and BRICS
Coefficient Values for Each Regression and to Fit the Model
The results obtained in the model are shown in Table 10 and they express the composition of performance variance, indicating the relative importance of each effect on the country performance. The group (G7 and BRICS) has no significant statistical effect on the countries’ performance, except when evaluating variable Publications_Idx, but although statistically significant, the effect is very small (1.31 per cent; p < 0.05).
Variance Composition of Country Performance Obtained by Hierarchical Model with Third-level Group
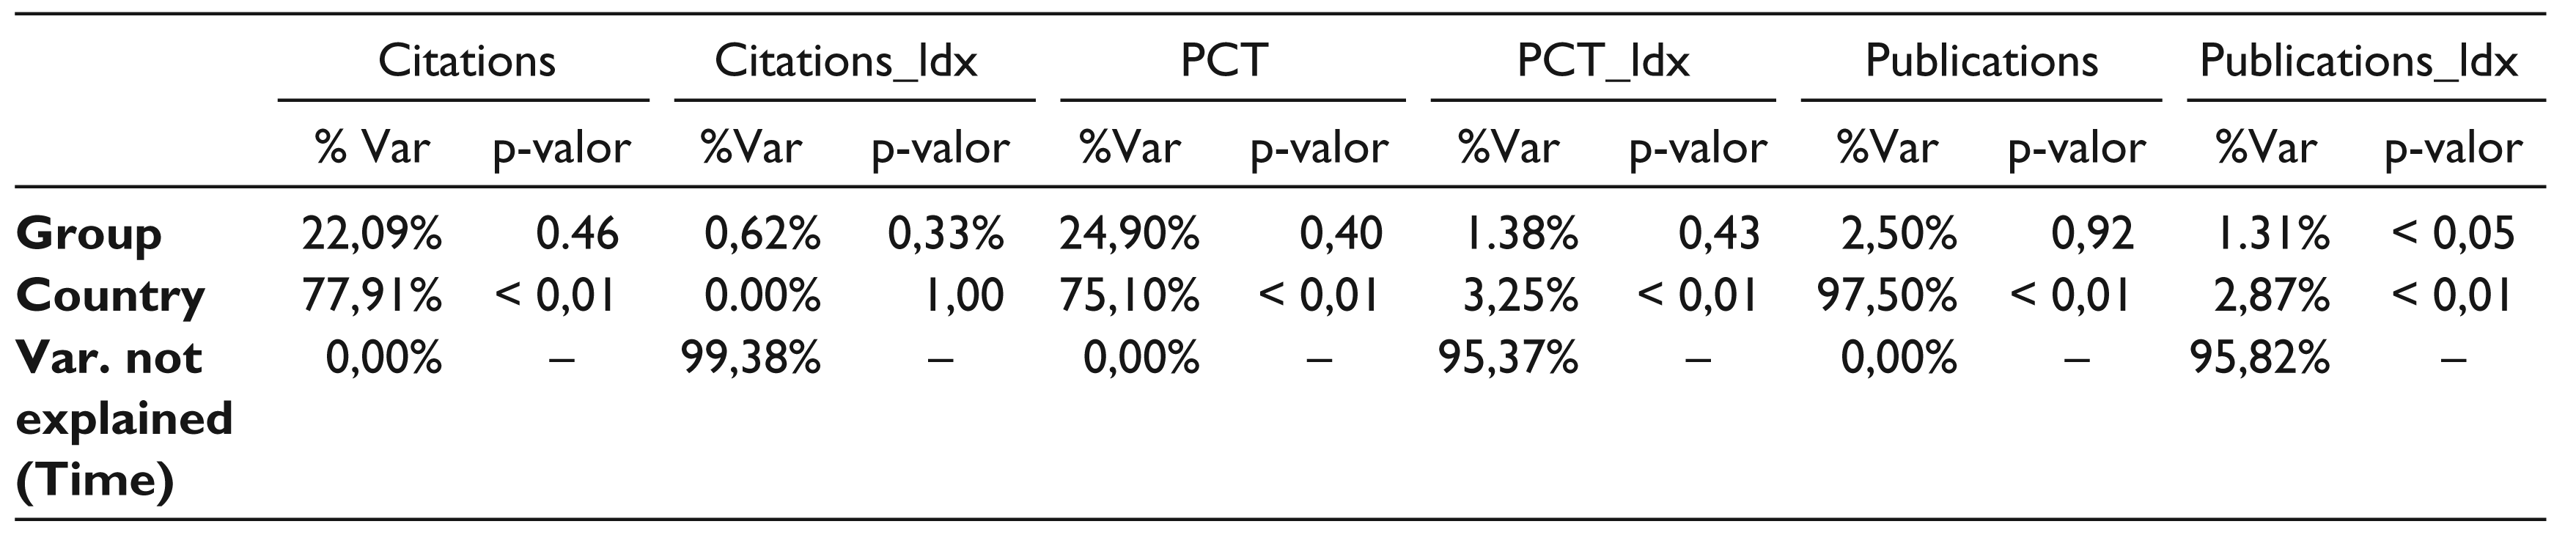
When variable country was analyzed, it has a high effect to explain the different indicators, that is, variance of Citations (77.91 per cent; p < 0.01), PCT (75.10 per cent; p < 0.01) and Publications (97.5 per cent, p < 0.01) reaching 69.2 per cent (p < 0.01). Also, a low effect was detected but it was statistically significant for variables PCT_idx (3.25 per cent; p < 0.01) and Publications_Idx (2.87 per cent; p < 0.01) and there was no statistically significant influence on Citations_Idx variable.
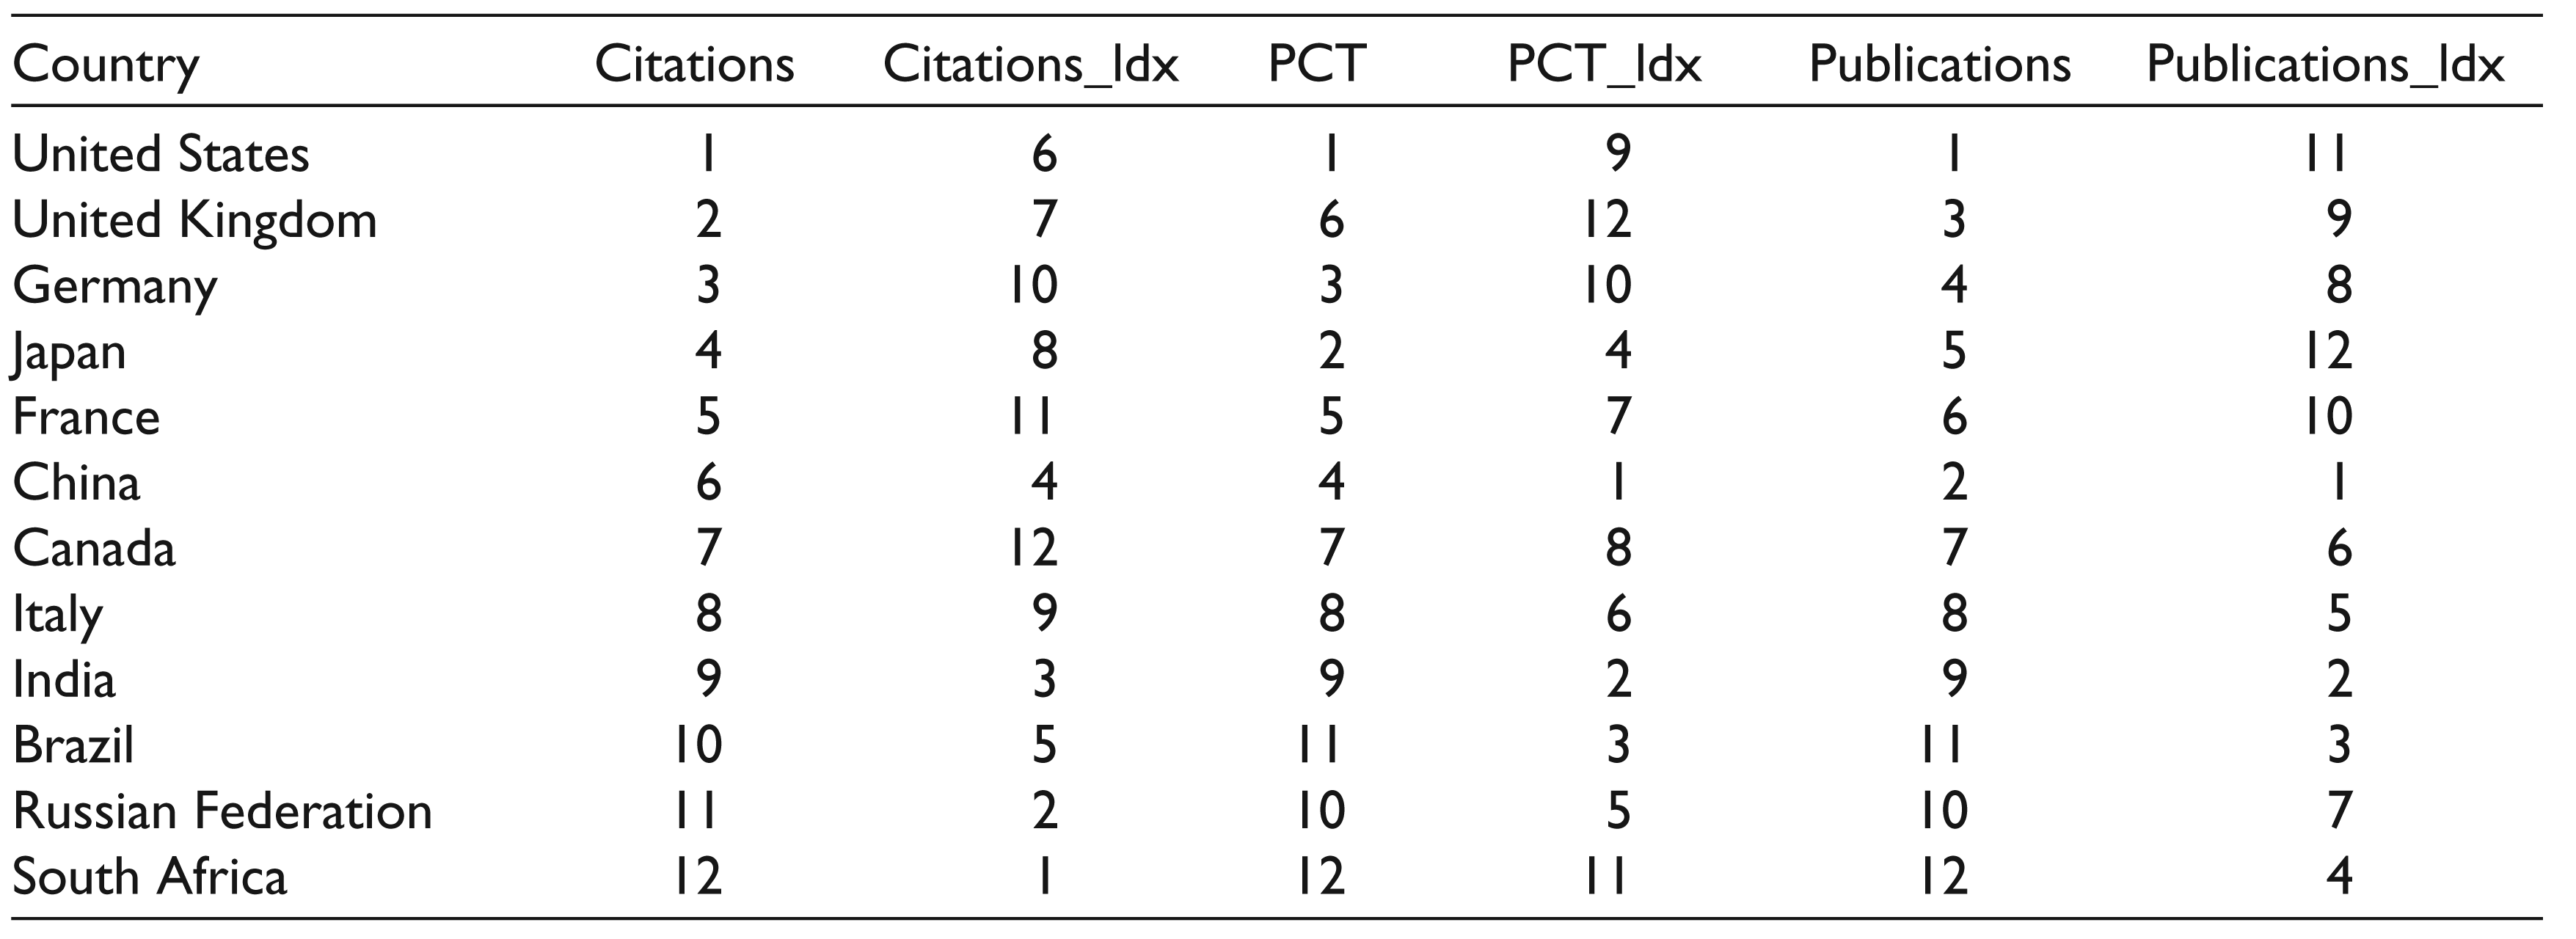
From the analysis of residues, the countries were ranked in each of the performance indicators as shown in Table 11. When observing the absolute indicators, G7 countries always appear in the top positions, except China. However, when analyzing the growth rate of the indicators along the time, it was observed that BRICS countries appear on better positions, showing that the performance of these countries has improved over time but is still far away from the leading countries.
Countries Ranking
Conclusions
The results of this study, which were based on a bibliometric analysis of open innovation articles published and indexed in the WoS database, bring some useful information on the topic when considering social and economic conditions of the country where the research was developed. The results showed that research on open innovation has grown exponentially over the past 15 years, possibly following the evolution of each country, and show that companies need to find different ways of managing innovation.
The results obtained in this article also provided valuable information on the amount of publications and citations from developed countries, referred as G7 group, and emerging countries, referred as BRICS group. Based on the data collected, we can see an evolution in the quantity of BRICS publications, but which was comparatively smaller than that of the G7 group. This divergence is even greater regarding the citations. The BRICS countries still have little visibility in the number of citations and most of their articles were published in books, which can decrease the researchers’ interest in using this type of reference in their studies. It was also observed that this scenario of greater publication in books by the authors from BRICS countries has been changing in the recent years as more articles are published in journals. This can be an important step so that the publications from these countries are more cited in the future.
It is worth mentioning that the limitations of the present work should be addressed in further studies, since only data obtained from WoS were used and this electronic search results in selection bias indirectly. Other relevant information from publications, such as keywords and more common terms, should also be explored. Further studies may still seek to understand issues involving co-citation analysis, knowledge and collaborative networks between countries and institutions. In addition, one can also evaluate new countries separated by other criteria, such as grouping by continent.
Through multilevel regression analysis, it can be concluded that the fact of belonging in G7 and BRICS group does not bring greater academic publications or technological development performance, but the performance is quite important when it observed each country individually. Analyzing absolute indicators, the G7 countries and China are the most important in innovation research, but the performance of the BRICS countries has grown at a higher rate than G7 countries during the analyzed period.
In summary, despite the economic growth and social progress made by the BRICS group in recent years, these improvements have not been increasing at the same rate as the researches on open innovation in these countries. Therefore, it was found that the G7 countries have greater resources and opportunity to conduct studies on open innovation, with the BRICS countries still at an embryonic stage of research on this topic.
Footnotes
Acknowledgements
The authors are grateful to the anonymous referees of the journal for their extremely useful suggestions to improve the quality of the article. Usual disclaimers apply.