
Abstract
This article explores the relationship between financial sector development and economic growth, using a sample of ASEAN-5 countries (Malaysia, Indonesia, Singapore, Thailand and Philippines) from 1980 to 2011. More specifically, this study investigates whether higher levels of financial development (FD) are significantly and robustly correlated with faster current and future rates of economic growth, physical capital accumulation and economic efficiency improvements. Findings of this study revealed that FD has a significant positive effect on economic growth. However, the estimated models show that the influence of FD, as a determinant for economic growth of ASEAN-5 countries, is less than that of domestic investment and export.
Introduction
Interest in economic growth has always been at the centre of literature in development economics, and it is one of the most fascinating topics in developing countries. Development studies have noted that economic growth fundamentally depends on the accumulation of input factors that is factors in the production process and technical process. Financial development (FD) is primarily linked to ‘factors of production process’, as the positive role of capital and accumulation for a sustainable economic growth. Therefore, FD plays a crucial role by enabling entrepreneurial activities through mobilization of savings and efficient allocation of resources, mitigation of the problem of asymmetric information and management of risk and reduction of transaction costs (Lee, 2005). FD is ultimately linked to the achievement of economics of scale, enhancing economic efficiency and growth (Khatun, 2016; Kyophilavong, Uddin, & Shahbaz, 2016).
An immense number of studies have examined the effects of FD on economic growth. Most of these studies emphasize on well-functioning financial markets in the developed countries. Cross-country comparison in FD and economic growth has noted that the mixture of financial markets, instruments and intermediaries has a crucial role in economic growth (Luintel, Khan, Arestis, & Theodoridis, 2008). Financial structure and development is not the same across the world. Inefficient financial markets in developing countries commonly have inefficient banking sectors where a large proportion of savings are held as unproductive liquid assets and incur a relatively higher cost information and transaction that leads to inefficient resource allocation. Moreover, Rioja and Valev (2004) showed that in developed countries the financial system contributes to the economic growth primarily through productivity improvement while in developing countries this occurs mainly through facilitating capital accumulation. As noted in the earlier theoretical literature and empirical studies, it is highly likely that FD can enhance productivity growth by improving capital allocation and stimulating technological progress (Jeanneney, Hua, & Liang, 2005). However, despite the difference in financial structure and development, studies in both developed and developing countries have shown the positive effect of FD on economic growth.
ASEAN is a vibrant region of over 600 million people living across Brunei, Cambodia, Indonesia, Laos, Malaysia, Myanmar, Philippines, Singapore, Thailand and Vietnam. ASEAN is located in the heart of an economically vibrant region, which provides an opportunity for the member countries to improve the socio-economic conditions of their people through infrastructure and communications networks, as well as the movement of people, goods and services within the region. This study selected the top five nations from ASEAN based on the gross domestic products of the respective countries that is Malaysia, Indonesia, Singapore, Thailand and Philippines. Among the studies in Asian developing countries, Jeanneney et al. (2005) applied the generalized method of moment (GMM) system estimators for panel data analysis to examine the relationship between FD and productivity growth in 29 Chinese provinces for the period between 1993 and 2001. Total factor productivity was divided into two components such as technical efficiency and technical progress. Findings of this study show that FD significantly contributes to China’s productive growth. Using the ratios of credit, savings, investment, quasi-money and total stock market capitalization as indicators of FD, Shan and Jianhong (2006) noted that FD comes as the second force in leading to a strong real GDP growth and investment growth in China. Another study in China conducted by Lu, Fausten, and Smyth (2006) measured FD by using annual data from 1952 to 1999 and noted that FD positively contributes to economic growth, mostly through facilitating capital accumulation, while the linkage between FD and productivity improvement is weak. In Pakistan, Khan and Qayyum (2006) applied a bound testing approach to investigate the joint impact of trade liberalization and FD on growth over the period from 1961 to 2005. Findings of their study revealed that there is a relationship among real GDP, trade liberalization, FD and the real interest rate in the long run. Jalil and Ma (2008) conducted their study in China and Pakistan. They found a significant impact on economic growth when using both deposit liability ratio and credit to the private sector as FD indicators in Pakistan. In China, however, only deposit liability ratio had a significant impact.
A study conducted by Adeniyi, Omisakin, Egwaikhide, and Oyinlola (2012) examined the causal linkage between foreign direct investment and economic growth—in Côte d’Ivoire, Gambia, Ghana, Nigeria and Sierra Leone—over the period from 1970 to 2005. Three alternative measures of financial sector development that is total liquid liabilities, total banking sector credit and credit to the private sector were employed to capture different implications of financial intermediation. Findings of their study revealed the extent of financial sophistication, matters for the benefits of foreign direct investment to register economic growth in Ghana, Gambia and Sierra Leone. Nigeria, on the other hand, displays no evidence of any causal flow from foreign direct investment to growth with financial depth accompaniment. Lee and Wong (2005) investigated the existence of inflation threshold effects in the relationship between FD and economic growth in Taiwan and Japan. Findings indicated that the threshold level of inflation below which FD significantly promotes growth is estimated at 7.25 per cent for Taiwan and 9.66 per cent for Japan. Jude (2010) examined the relative influence of a series of variables on the linkage between FD and economic growth for 71 countries, both developed and developing, over the period from 1960 to 2004. Findings of this study revealed that inflation rate, ratio of government consumption, degree of openness to trade and FD affect the non-linearity between FD and growth and have the greatest influence on the relationship of the two variables.
As noted in literature, among the factors that determine the growth of an economy, FD is dominant. Policymakers, especially in developing countries, would like to know whether the financial sectors of the economy should be more liberalized. Economic theories and much practical experience recommend that financial liberalization/development motivates economic development. The financial liberalization concept is developed to decrease the government’s direct intervention in the economic field. Truly developing countries attempt to reduce financial repression, which leads to achieving FD. In developing economies, before the 1980s, governments’ intervention in financial markets was a normal policy. These government interventions appeared in forcing desired interest rates, allocating credits by administrative decisions rather than market criteria and controlling foreign capital. Nevertheless, in the last three decades, many developing economies that have followed the theoretical advice made in support of FD and learning from the experiences of rapidly growing countries have started to liberalize their financial markets by stopping these types of controls. This study was designed to investigate the influence of the effort of FD on the economic performance of five Asian countries.
Study Context
Past evidences practised by countries and the associated literatures have shown both the positive and negative growth influences of FD and liberalization. On the positive side, the literature considers four major arguments: allocation of capital, better risk management through diversification, availability of capital from abroad and lower cost of capital. On the other side, economists discuss that financial liberalization generates more variations in the exchange rate, which could cause more financial instability. In addition, the developing economies, which encourage liberalizing their financial market, are afraid of instability. The outcomes of financial liberalization are not the same for all countries/regions. It appears to have been much more successful in Asia than some other regions. Financial liberalization was practised much earlier in many Asian countries compared to countries in Africa; for instance, Malaysia started liberalization of interest rates in 1978. However, the earliest African liberalizers (Gambia and Ghana) only started to introduce financial reform about 20 years later. Moreover, about 1980, the financial reform in Latin American economies (Argentina, Chile and Uruguay) stopped due to severe disappointments: extensive bankruptcies, increasing unemployment rate, increasing inflation rate and the return to the past system of financial repression. The supporting economists believe that this happened because the reformers did not pay enough attention to the correct order of financial liberalization. Some economists believe that prior to proceeding to the main elements of financial liberalization such as liberalizing interest rate or foreign exchange, it is required to improve the macroeconomic background. For instance, the country should decrease or remove the government’s budget deficit and diminish inflationary expectations. Moreover, financial reform is only one part of a comprehensive procedure of economic development, of which it is both a basis and a consequence (Chaisrisawatsuk & Chaisrisawatsuk, 2007).
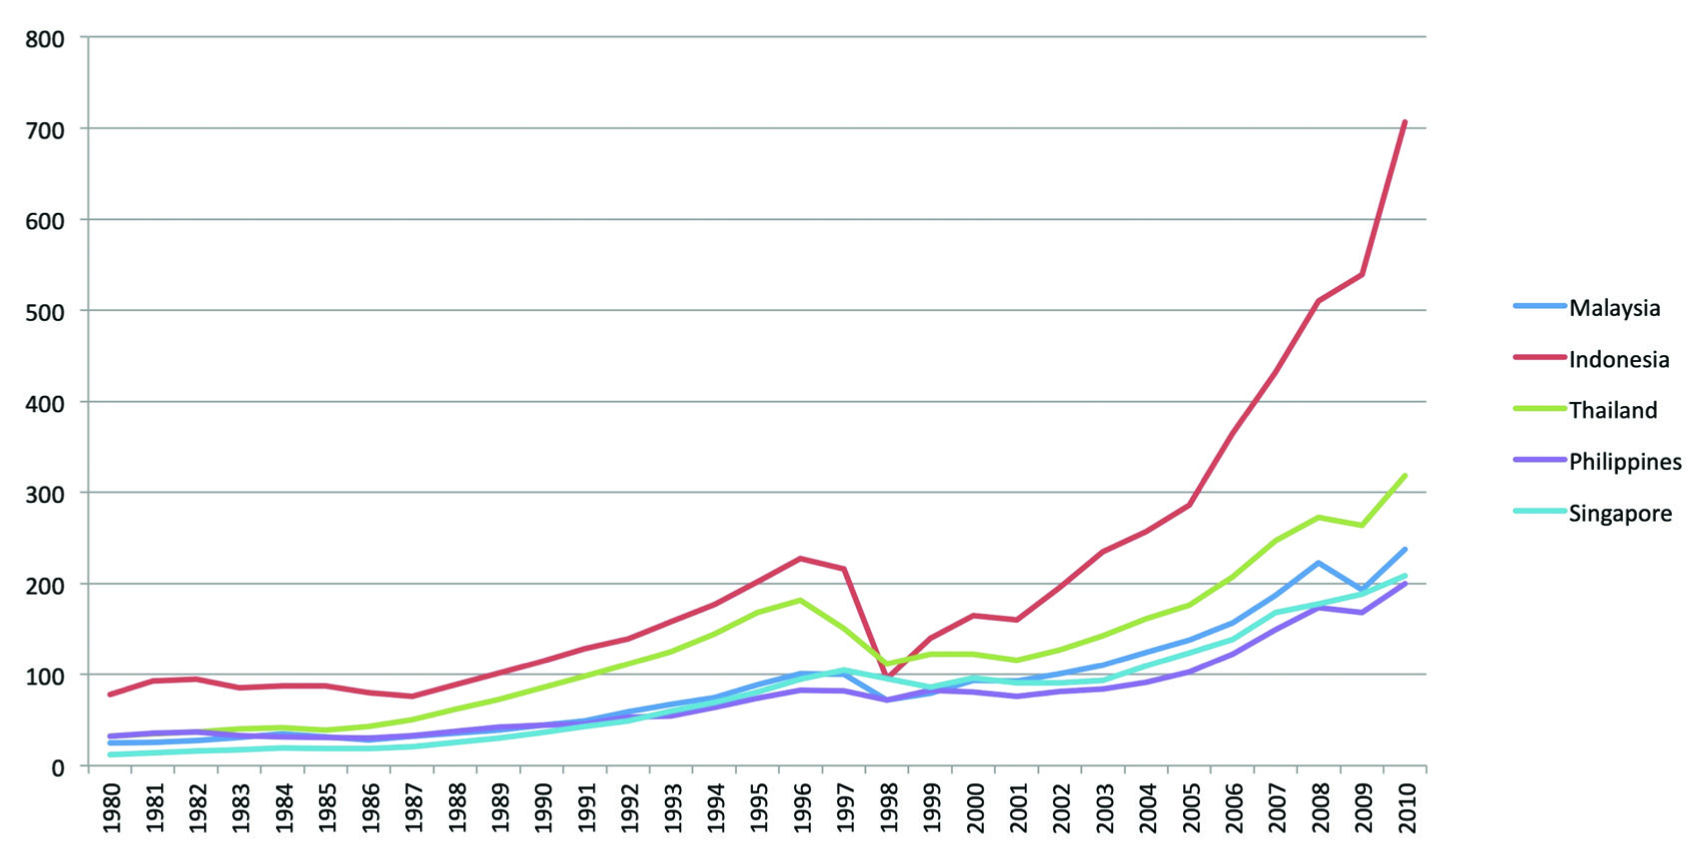
Among the countries, which practised financial reform, the ASEAN-5 economies are the most famous. Some scholars suggest that the 1997–1998 crisis of the Asian economy was an unlucky consequence of weak performance of domestic financial systems. Financial crisis had led economies of Asia into economic collapse, and until 2004, they had not recovered because growth rates were still below the rates prior to the financial crisis. The negative impacts of the crisis on ASEAN-5 economies from 1980 to 2006 are apparent in Figure 1.
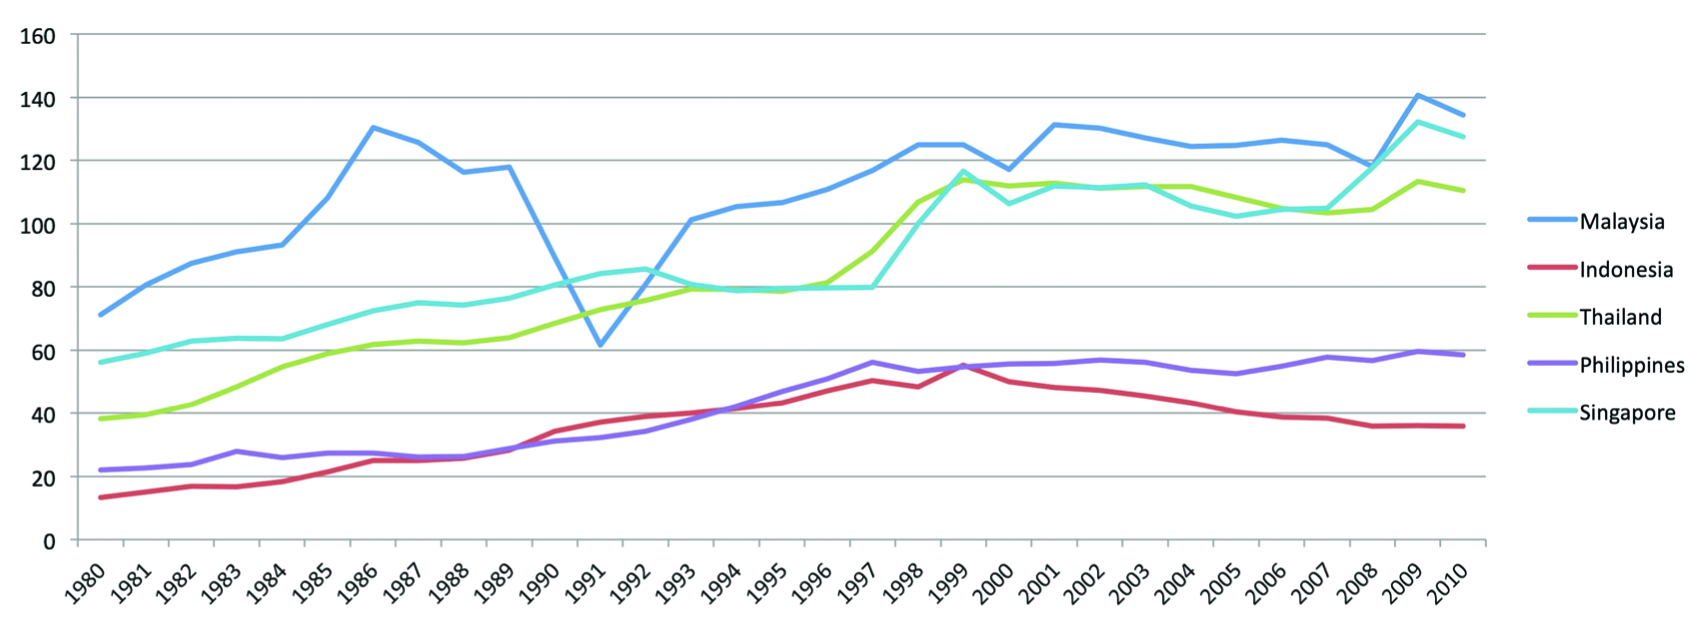
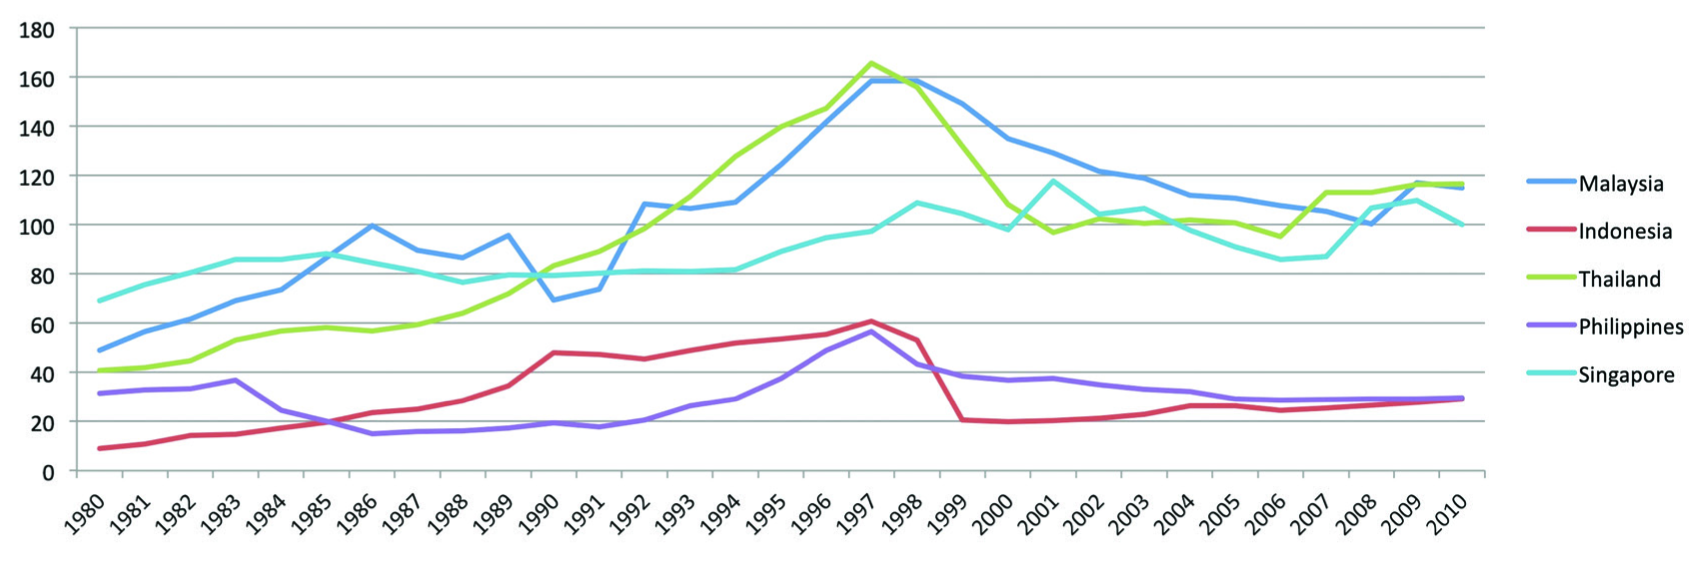
It was the ratio measurement of M2 to GDP that helped to measure the success of FD/liberalization ratio measurement of broad money (M2) to GDP (M2/GDP). Another measurement, which is used greatly, is the domestic credit measurement to the private sector (as a percentage of GDP). Figures 1–3 show the trend of these variables for ASEAN-5 countries. The trends of the variables of the crisis affected both the economic growth and financial system in the region. Accordingly, this study’s aim is investigating whether FD influences economic growth in countries of ASEAN-5.
Research Design
This study used a panel data set for ASEAN-5 countries to examine the association between FD and economic growth. The models are specified to investigate whether FD affects the process of economic development.
Model Specification
A large number of development studies employed the model developed by Solow (1956), as the theoretical base to specify their model. This theory offers a framework, which is useful to incorporate numerous variables as determinants for economic growth. Based on that some economists, for instance King and Levine (1993), incorporate the factor of FD in their model. Accordingly, the theoretical background of this study is based on the Solow model as follows:

where Y represents economic growth, L is labour and K denotes physical capital. The A is economic environment, which contains numerous aspects that influence the productivity of labour and capital (Borensztein, De Gregorio, & Lee, 1998). The i shows the cross-section of the country and t shows the time. After changing Equation (1) to a logarithm form, it is specified in a linear formation as follows:

where αs stand for coefficients. However, it was expected that there are some factors that enrich productivity and could accordingly affect the economic development. Therefore, Equation (3) is developed as follows:

where FD it is FD and X is export. By substituting Equation (3) in Equation (2), the following equation is specified:

Given the emphasis of FD in this study, Equation (4) was adapted as follows:

where C is a vector of another variable that is independent which is integrated in Equation (4), not involving the primary explanatory variable, FD. A few measurement approaches can be used to calculate the incorporated explanatory variable of FD. This study uses three types of measurements according to King and Levine (1993), which are PRIVATE, LLY and PRIVY.
It is proposed that the measurement of financial depth can be shown using the liquid liabilities ratio of the financial system to the GDP, which is called LLY. Liquid liabilities include currencies that are held outside the banking system in addition to interest-bearing liabilities and demand of banks and non-banking financial institutions. The second and third types of measurements utilized in this study are developed to calculate the distribution of the domestic asset. A financial system that only directs credit to state-owned enterprises or the government may not be examining managers, pooling risk, selecting investment projects and offering financial services like the financial systems that provide credit to the private sectors. Accordingly, the third type of measurement is the percentage of credit allocation by the financial system to the private sector. This is called the PRIVATE indicator and utilizes the ratio of claims of the non-banking private sector to the total domestic credit (which does not include credit to money banks). The fourth type of measurement is the ratio of claims of the non-banking private sector to the GDP, and this variable is known as PRIVY. The PRIVY could be equivalent to the domestic credit indicator to the private sector (percentage of GDP).
This study uses three measurements including LLY and PRIVY and PRIVATE. Accordingly, Equation (5) is written as follows:


Based on the related theories, it is expected that all of the measurements for FD including LLY, PRIVY and PRIVATE are positive and significant.
Analysis
To evaluate the association between economic growth and the related factors, this study used a panel data set of ASEAN-5 countries including Indonesia, Malaysia, Philippines, Singapore and Thailand. Following King and Levine (1993), three measurements were used to measure the variable of FD. Accordingly, the three estimations are reported in this chapter. The first section reports the estimated result of Equation (6), which used LLY as the measurement for FD. The second section reports the estimated result of Equation (7), which used PRIVY as the measurement for FD. Finally, the third section reports the estimated result of Equation (8), which used PRIVATE as the measurement for FD.
Section One: LLY as Measurement for Financial Development
The first section reports the estimated result of Equation (6), which used LLY as the measurement for FD. According to King and Levine (1993), the measurement for ‘financial depth’ can be calculated using the financial system ratio’s liquid liabilities to GDP, which is termed as LLY. The currency held outside the banking system is represented by the liquid liabilities in addition to the interest-bearing liabilities and demands of banks and non-banking financial mediators. This measure could be equal to the economic indicator of ‘M2’. For this, the following model is regressed:

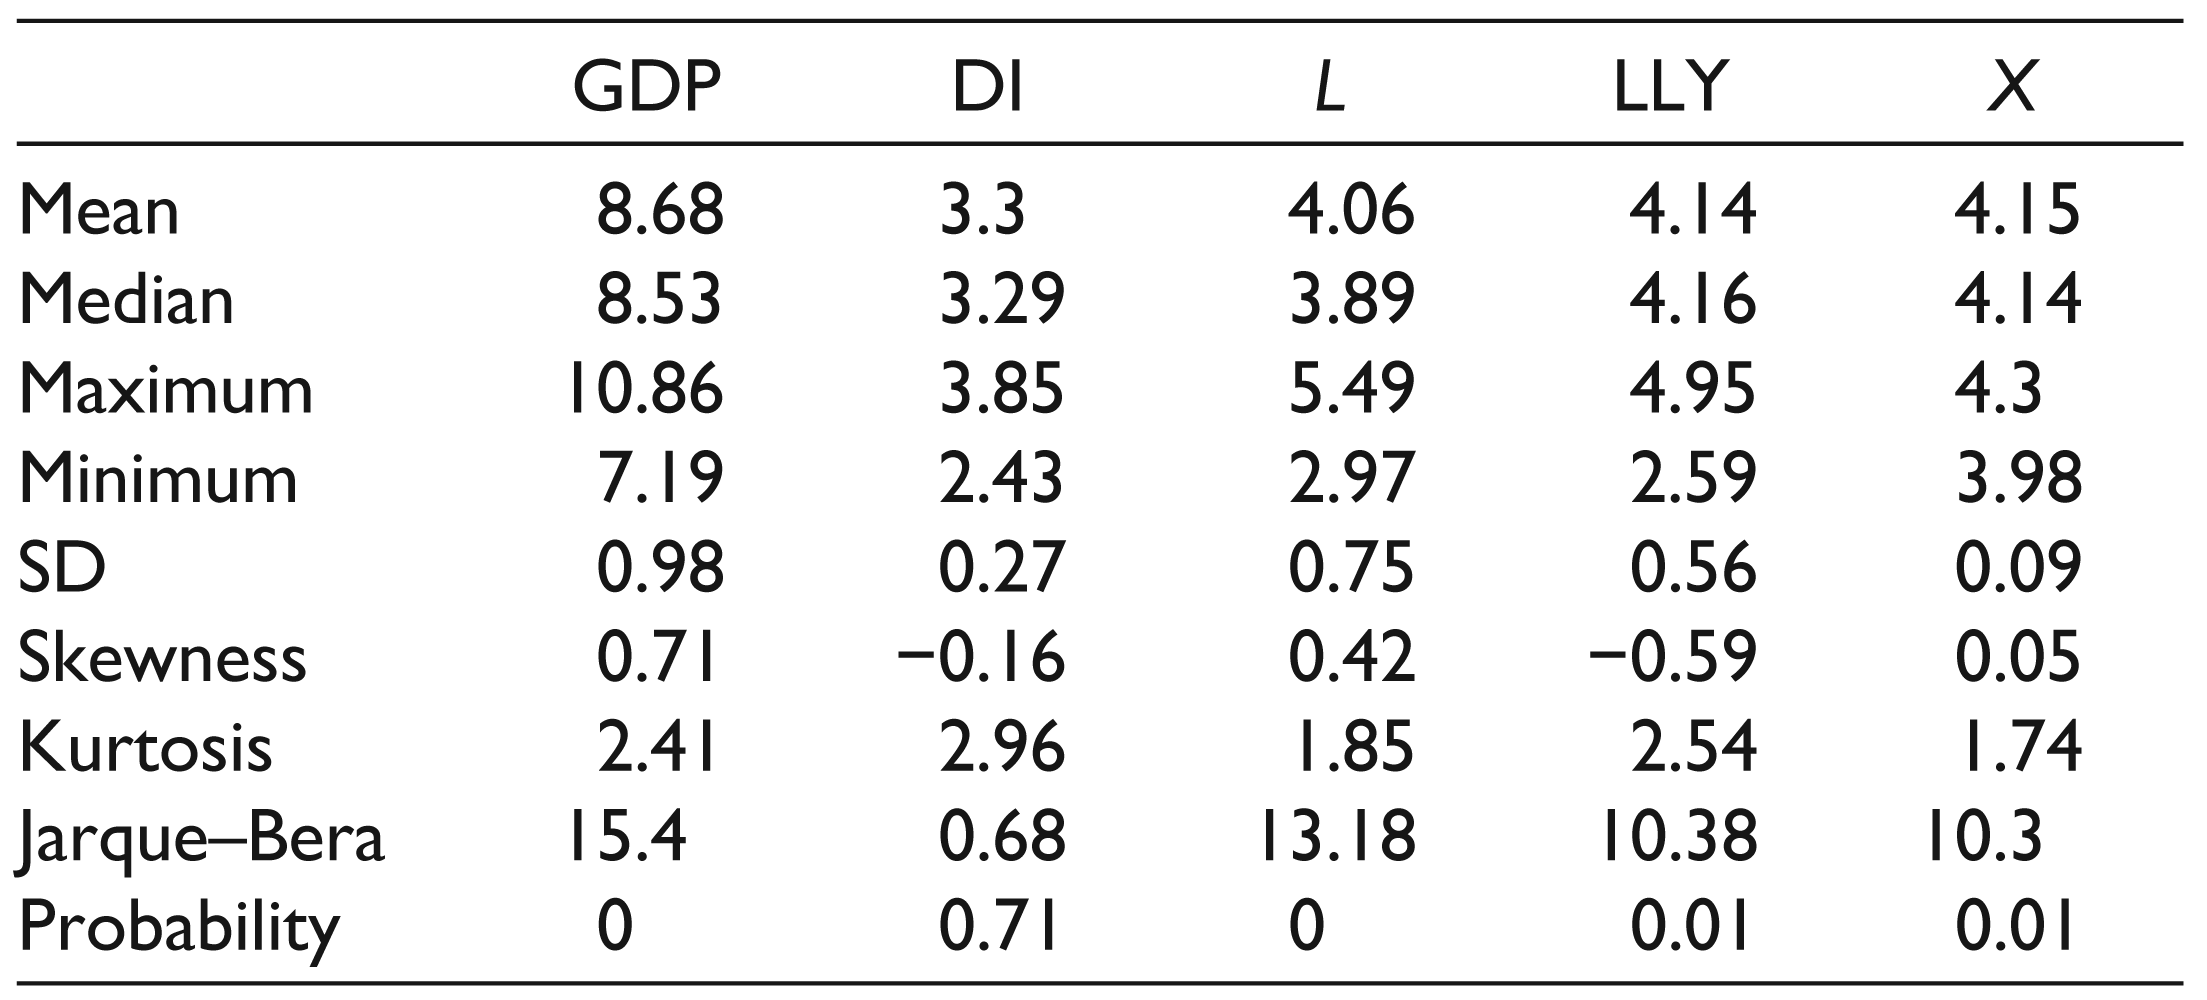
This model evaluates the influence of FD, X, domestic investment (DI) and labour on economic growth for ASEAN-5 region during the period from 1980 to 2010. Descriptive statistics, correlations, the results of LM and Hausman tests and the result of the related estimation are reported separately below.
Table 1 reveals the descriptive statistics’ results, which include median, mean, minimum, maximum, standard deviation, kurtosis, skewness, Jarque–Bera and probability.
Descriptive Statistics
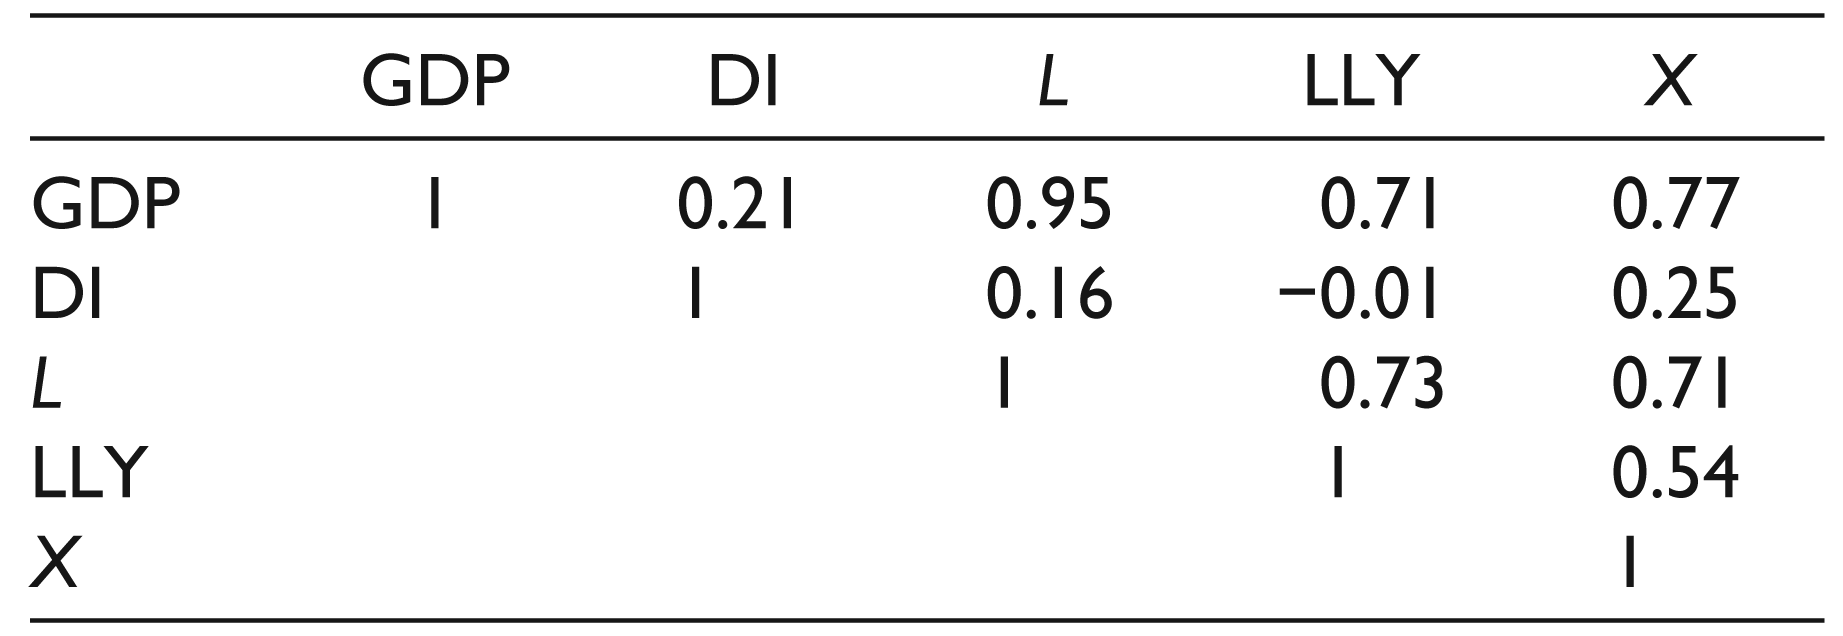
In addition, Table 2 presents the correlations among the variables. As shown, all variables are positively correlated with GDP/economic growth. The FD, which is measured by LLY, is positively correlated with GDP.
Correlation Analysis
The LM test supports in selecting a better method between pooled OLS and random effect (RE). Using the pooled OLS residuals in the following formula, this test could be computed easily. The number of LM is given as follows:

The formula is used in the following LM to obtain the first data set: LM = 94.97
The obtained value does not exceed the presented chi-squared value, resulting in the conclusion that RE is not more appropriate than the pooled OLS. In other words, there is no country-specific effect for this estimation meaning that the intercept could be assumed homogenous for this estimation.
Hausman test was developed in 1978 as a formal test to select one of the models, namely, the RE model and the fixed effect (FE) model.
The Hausman test hypothesized that the models of RE and FE estimators are not very different. The test result reveals an asymptotic distribution, which is X2. The RE approach is not appropriate if the null hypothesis is rejected, and it would be better for the FE approach to be utilized. Table 3 reveals that the test’s p-value is less than 5 per cent, which highlights that the FE approach is more appropriate. This means that the error term correlates with the explanatory variables. As such, using OLS is not suitable and FE model is preferable. Hausman and LM test results show that the FE method is more suitable than the other two approaches. This indicates that there are no country effects in the residuals; in fact, the residual is related to the explanatory variables.
Section One: Hausman Test

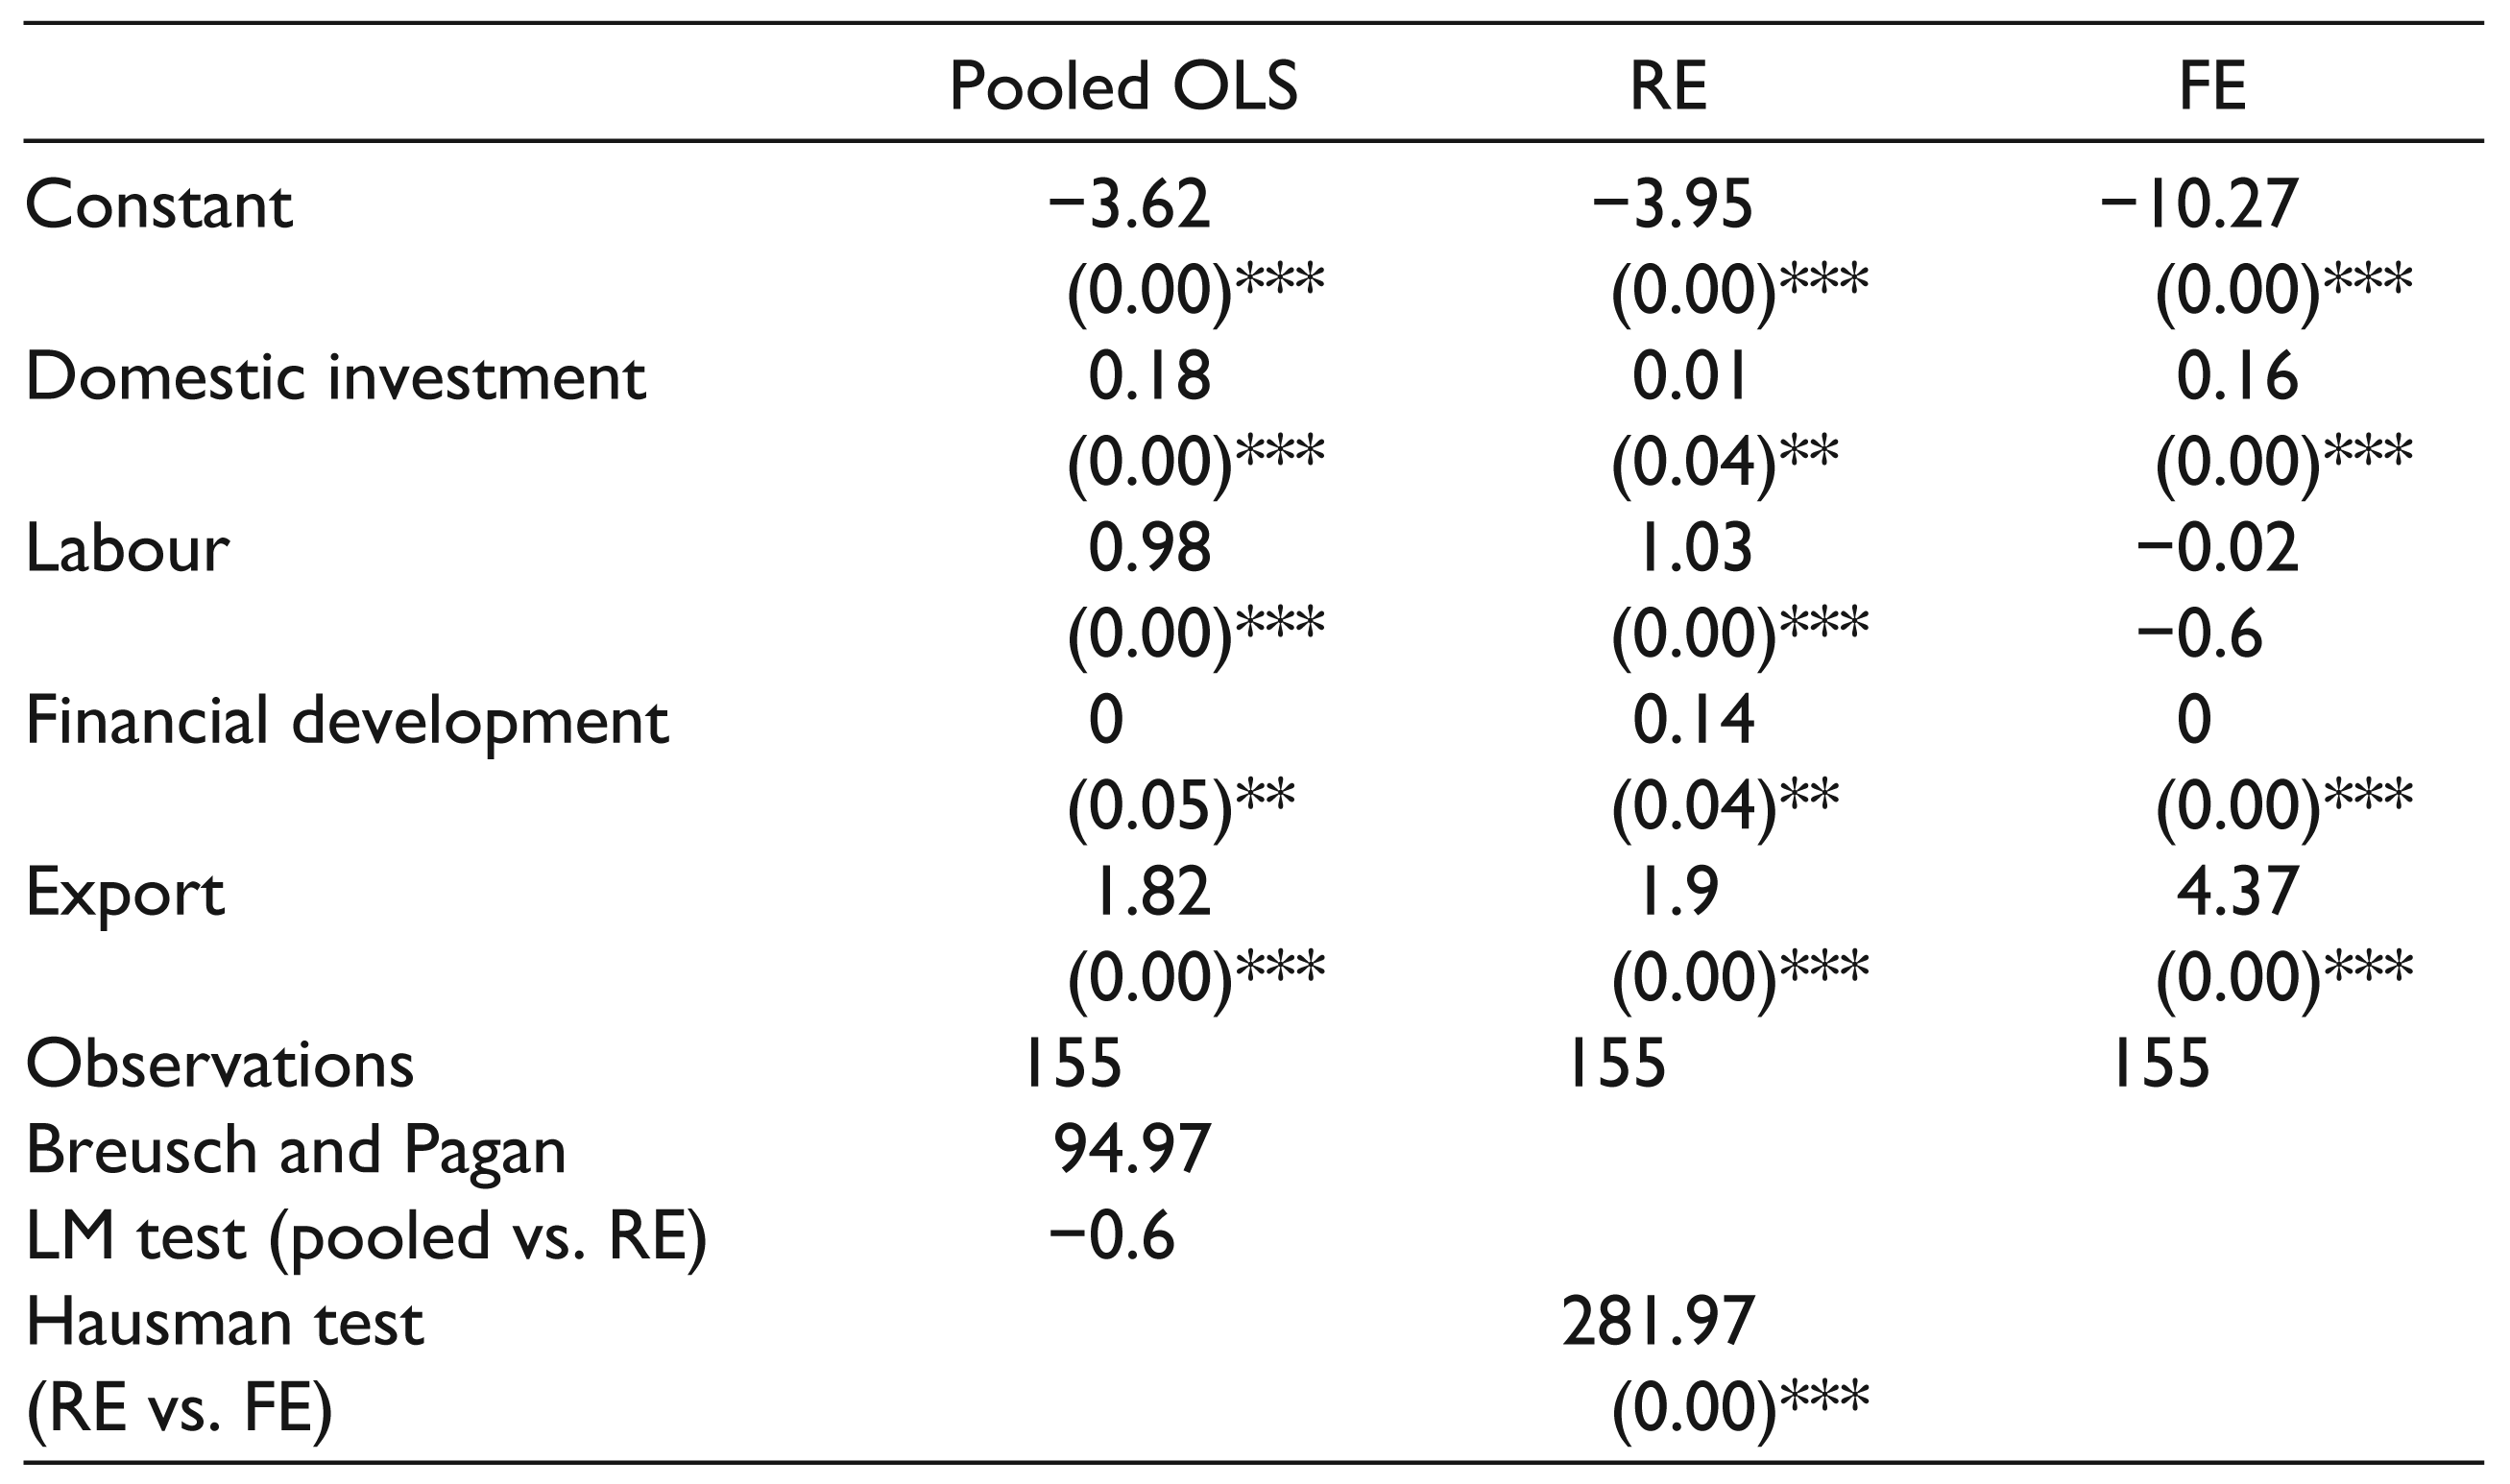
Results from the panel data methods: Table 4 shows a comparison of outcomes of the three methods, which include FE, pooled OLS and RE. The result shown in the Table 4 utilizes LLY as a form of measurement for FD.
Based on Table 4, it is indicated that the factors of X and DI have a positive and highly significantly effect, which proves that these two variables are essential factors in the growth of ASEAN-5 countries’ economy. The FD measured using LLY is significant and positive, but it is not significant in the growth of ASEAN-5 countries’ economy.
Result for Estimated Model
Section Two: PRIVY as Measurement for Financial Development
As explained before, the second section reports the estimated result of Equation (7), which used PRIVY as the measurement for FD. This form of measurement utilizes the ratio of claims of the non-financial private sector to the GDP and could be equivalent to the domestic credit of the private sector (% of GDP). The following model is utilized for this purpose:

This model examines the effect of some variables on economic growth for ASEAN-5 countries during the period from 1980 to 2010.
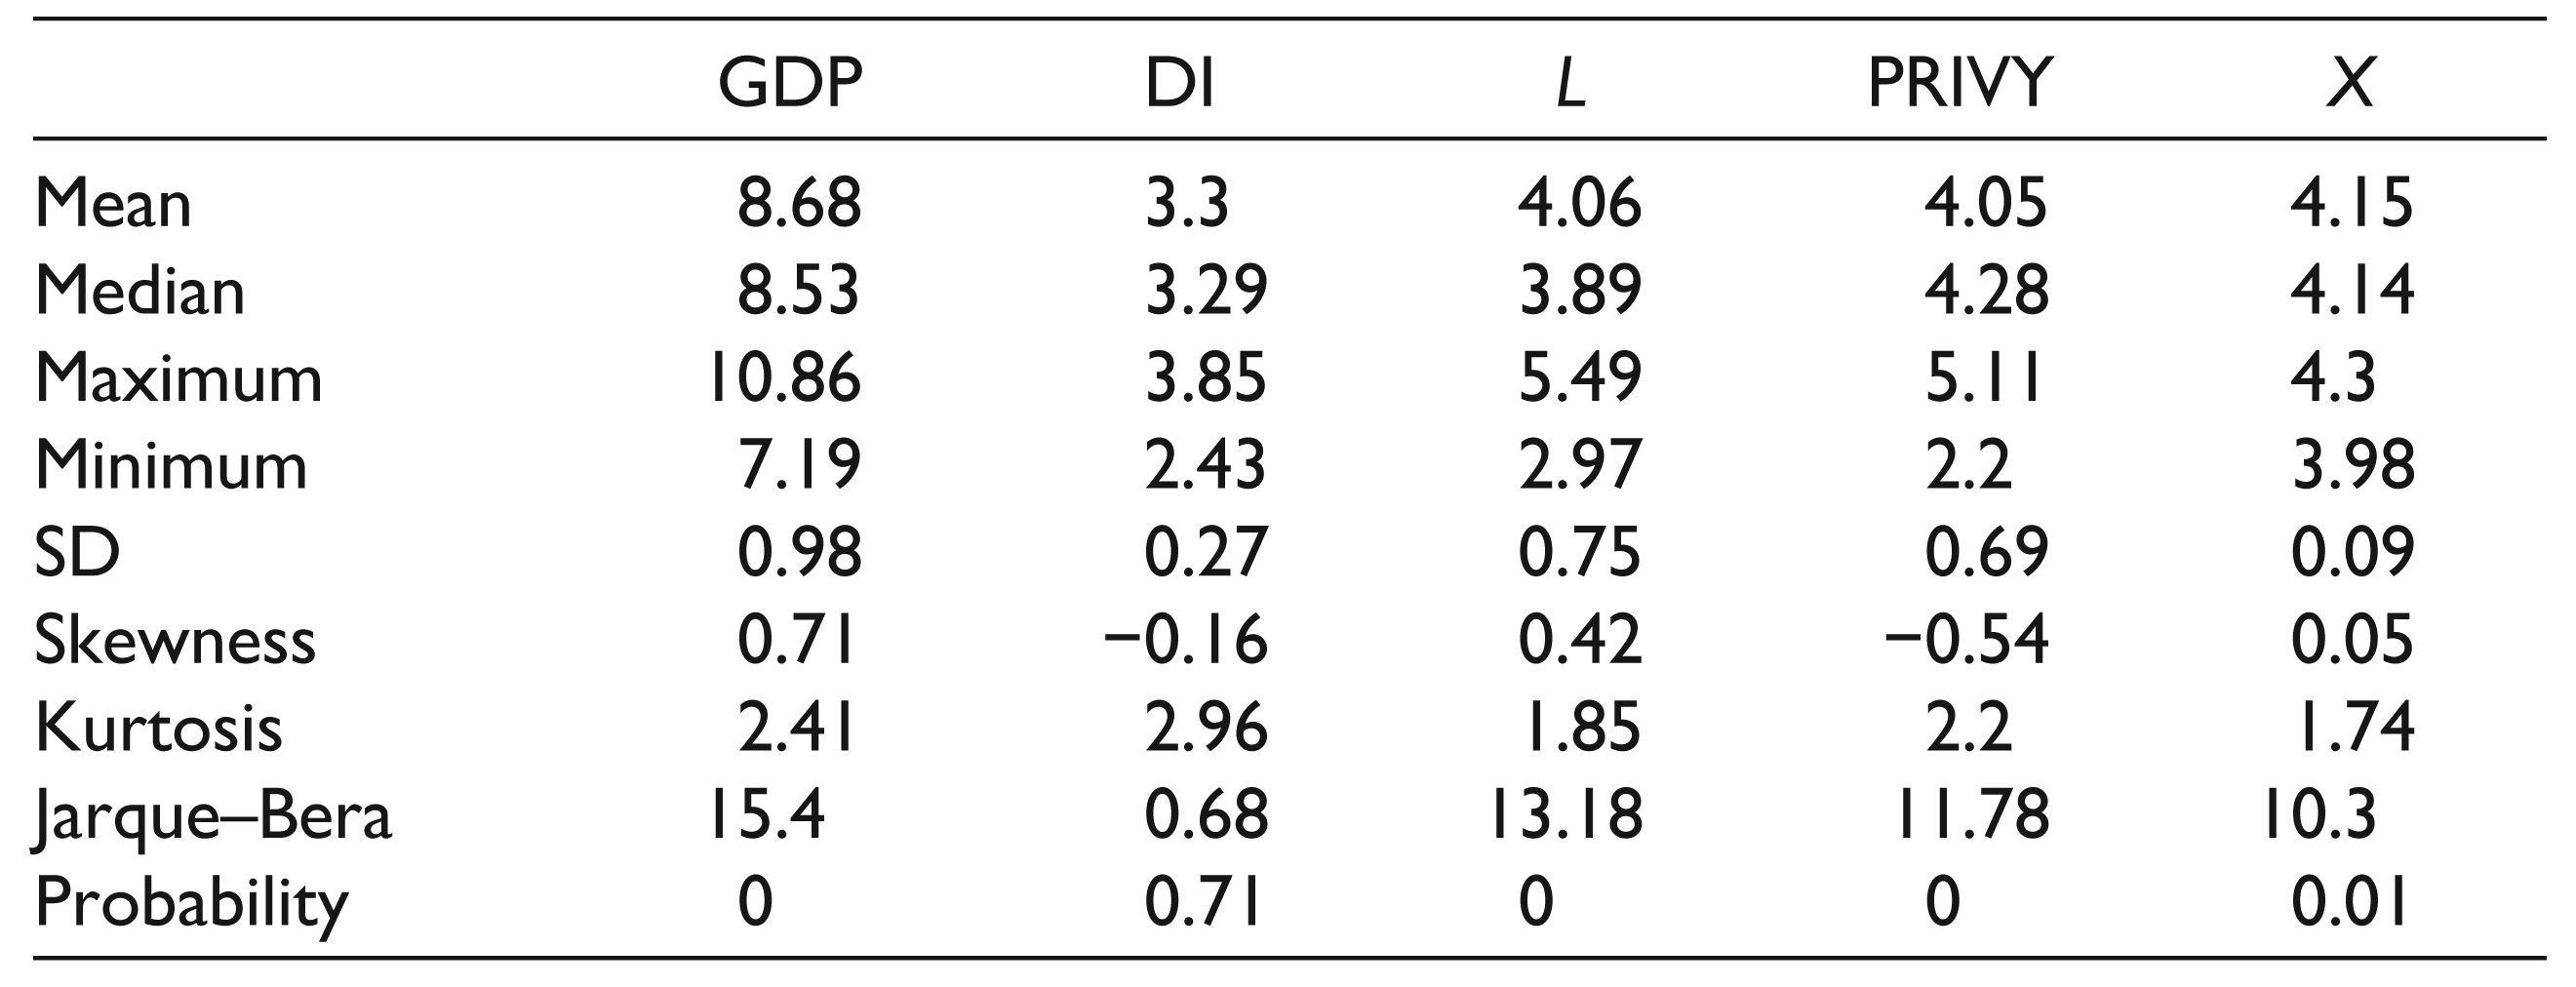
Table 5 highlights the descriptive statistics’ results, which include median, mean, minimum, maximum, standard deviation, kurtosis, skewness, Jarque–Bera and probability.
Descriptive Statistics
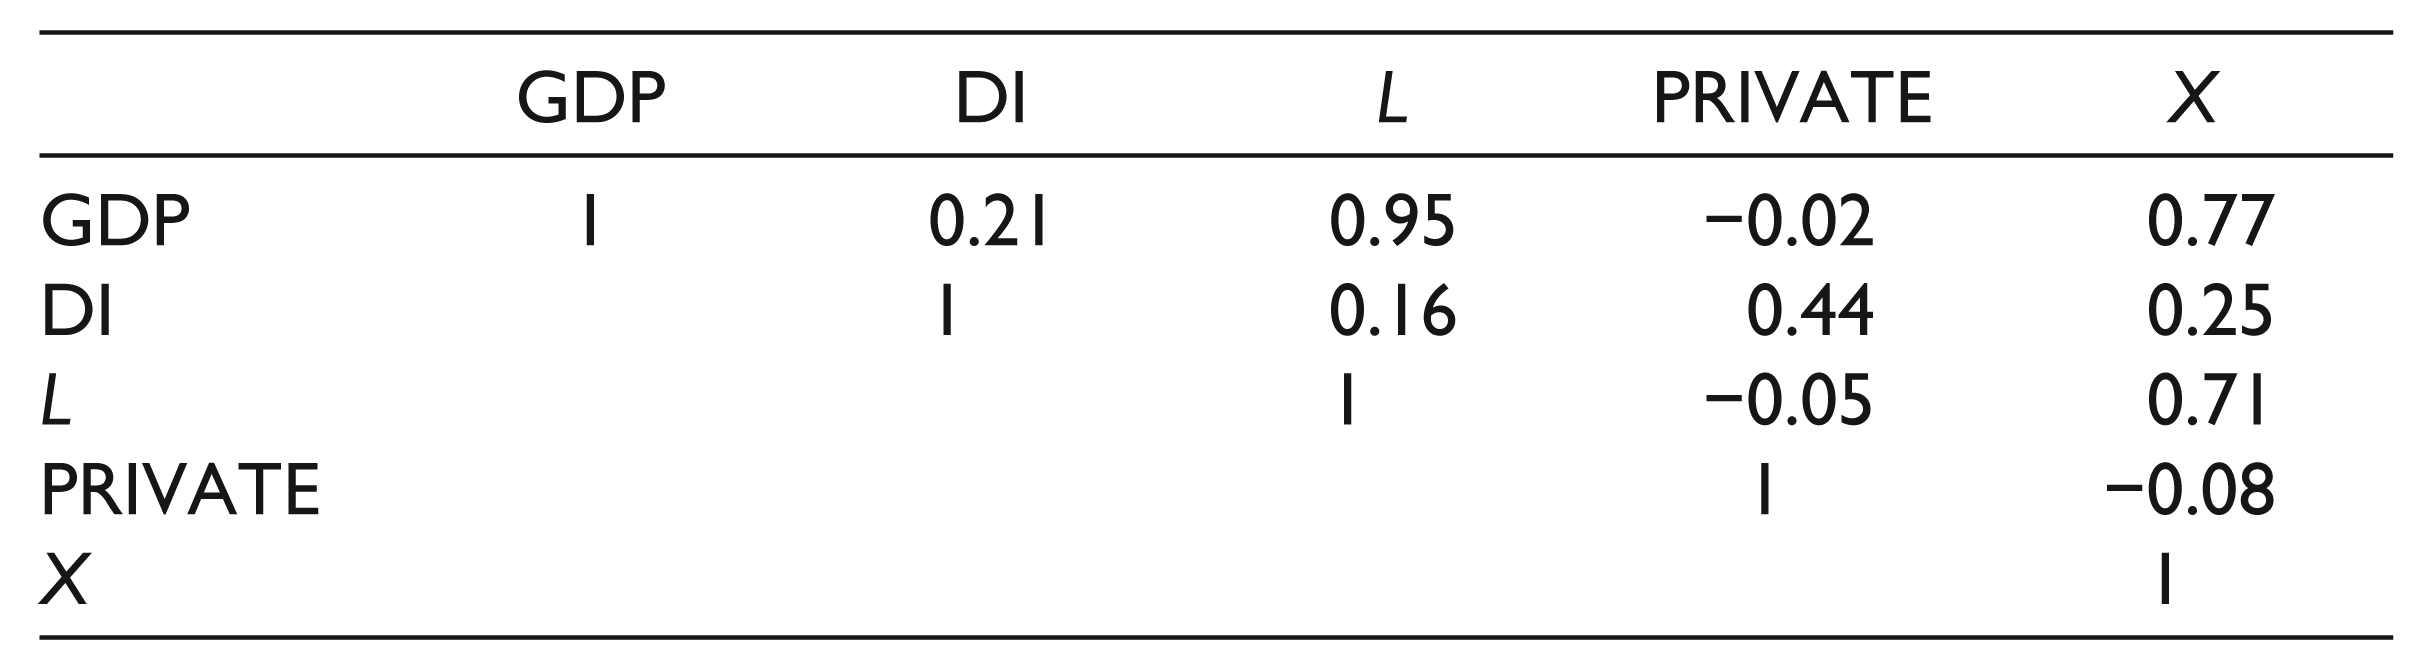
Moreover, Table 6 shows the connections that exist among the variables. As shown, all variables are positively correlated with GDP/economic growth. Based on previous studies, these correlations are expected, and many studies report these results.
Correlation Analysis
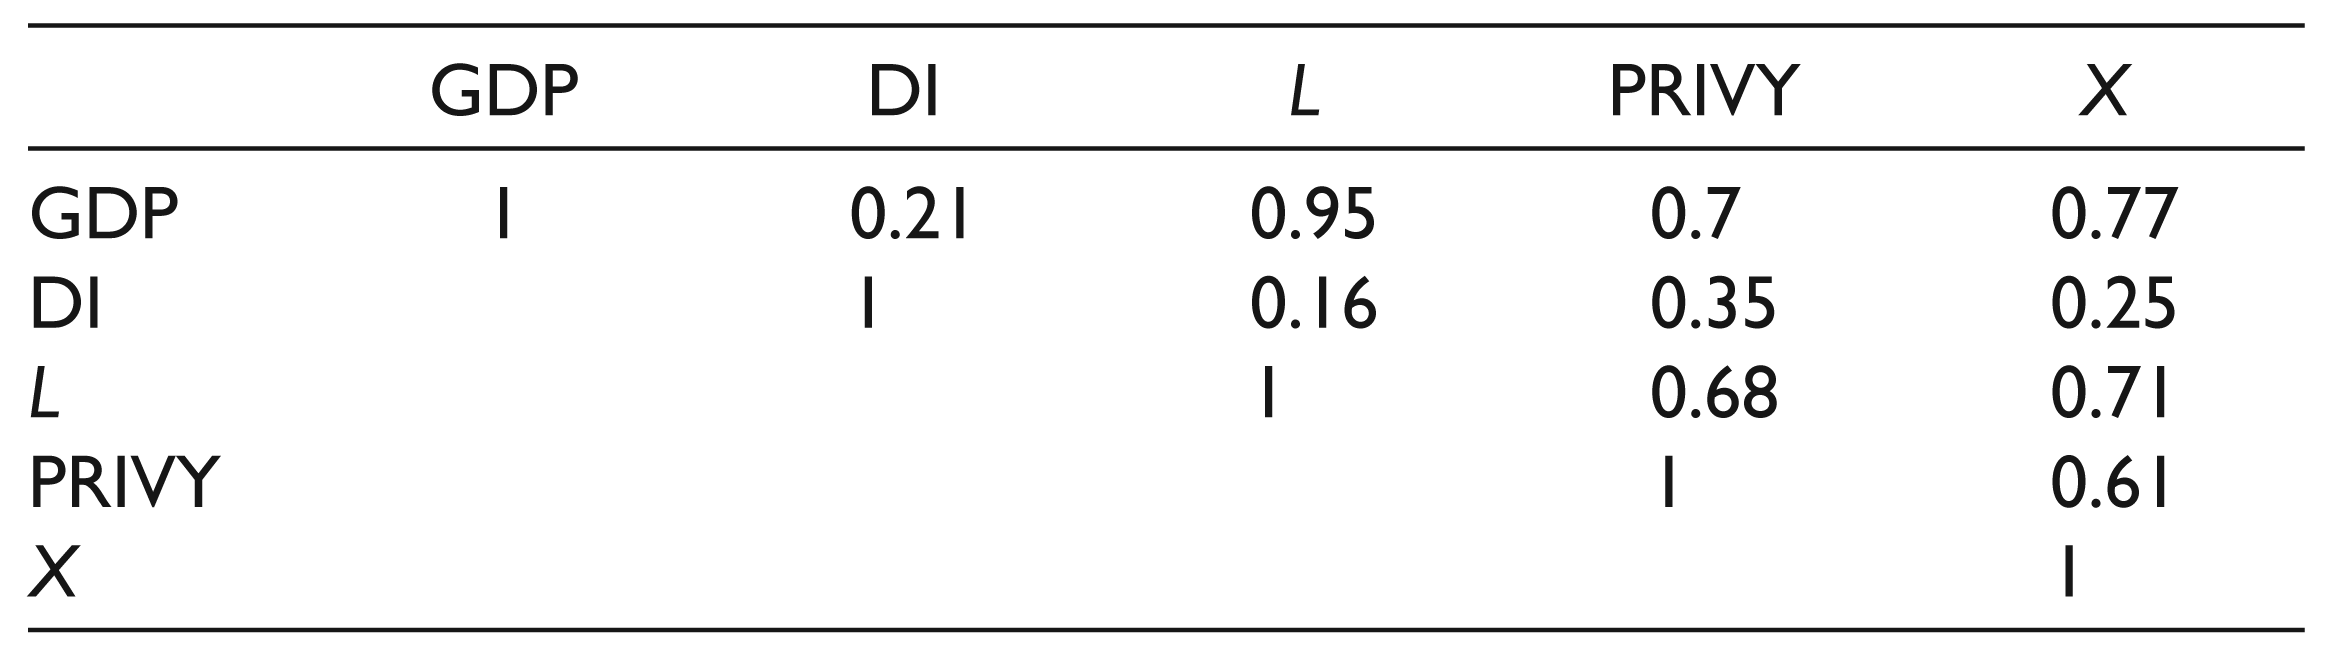
Similar to the first section, based on the result, PRIVY is positively correlated with GDP. According to King and Levine (1993), this is reaffirmed by many scientific studies that have examined the correlation between GDP and FD.
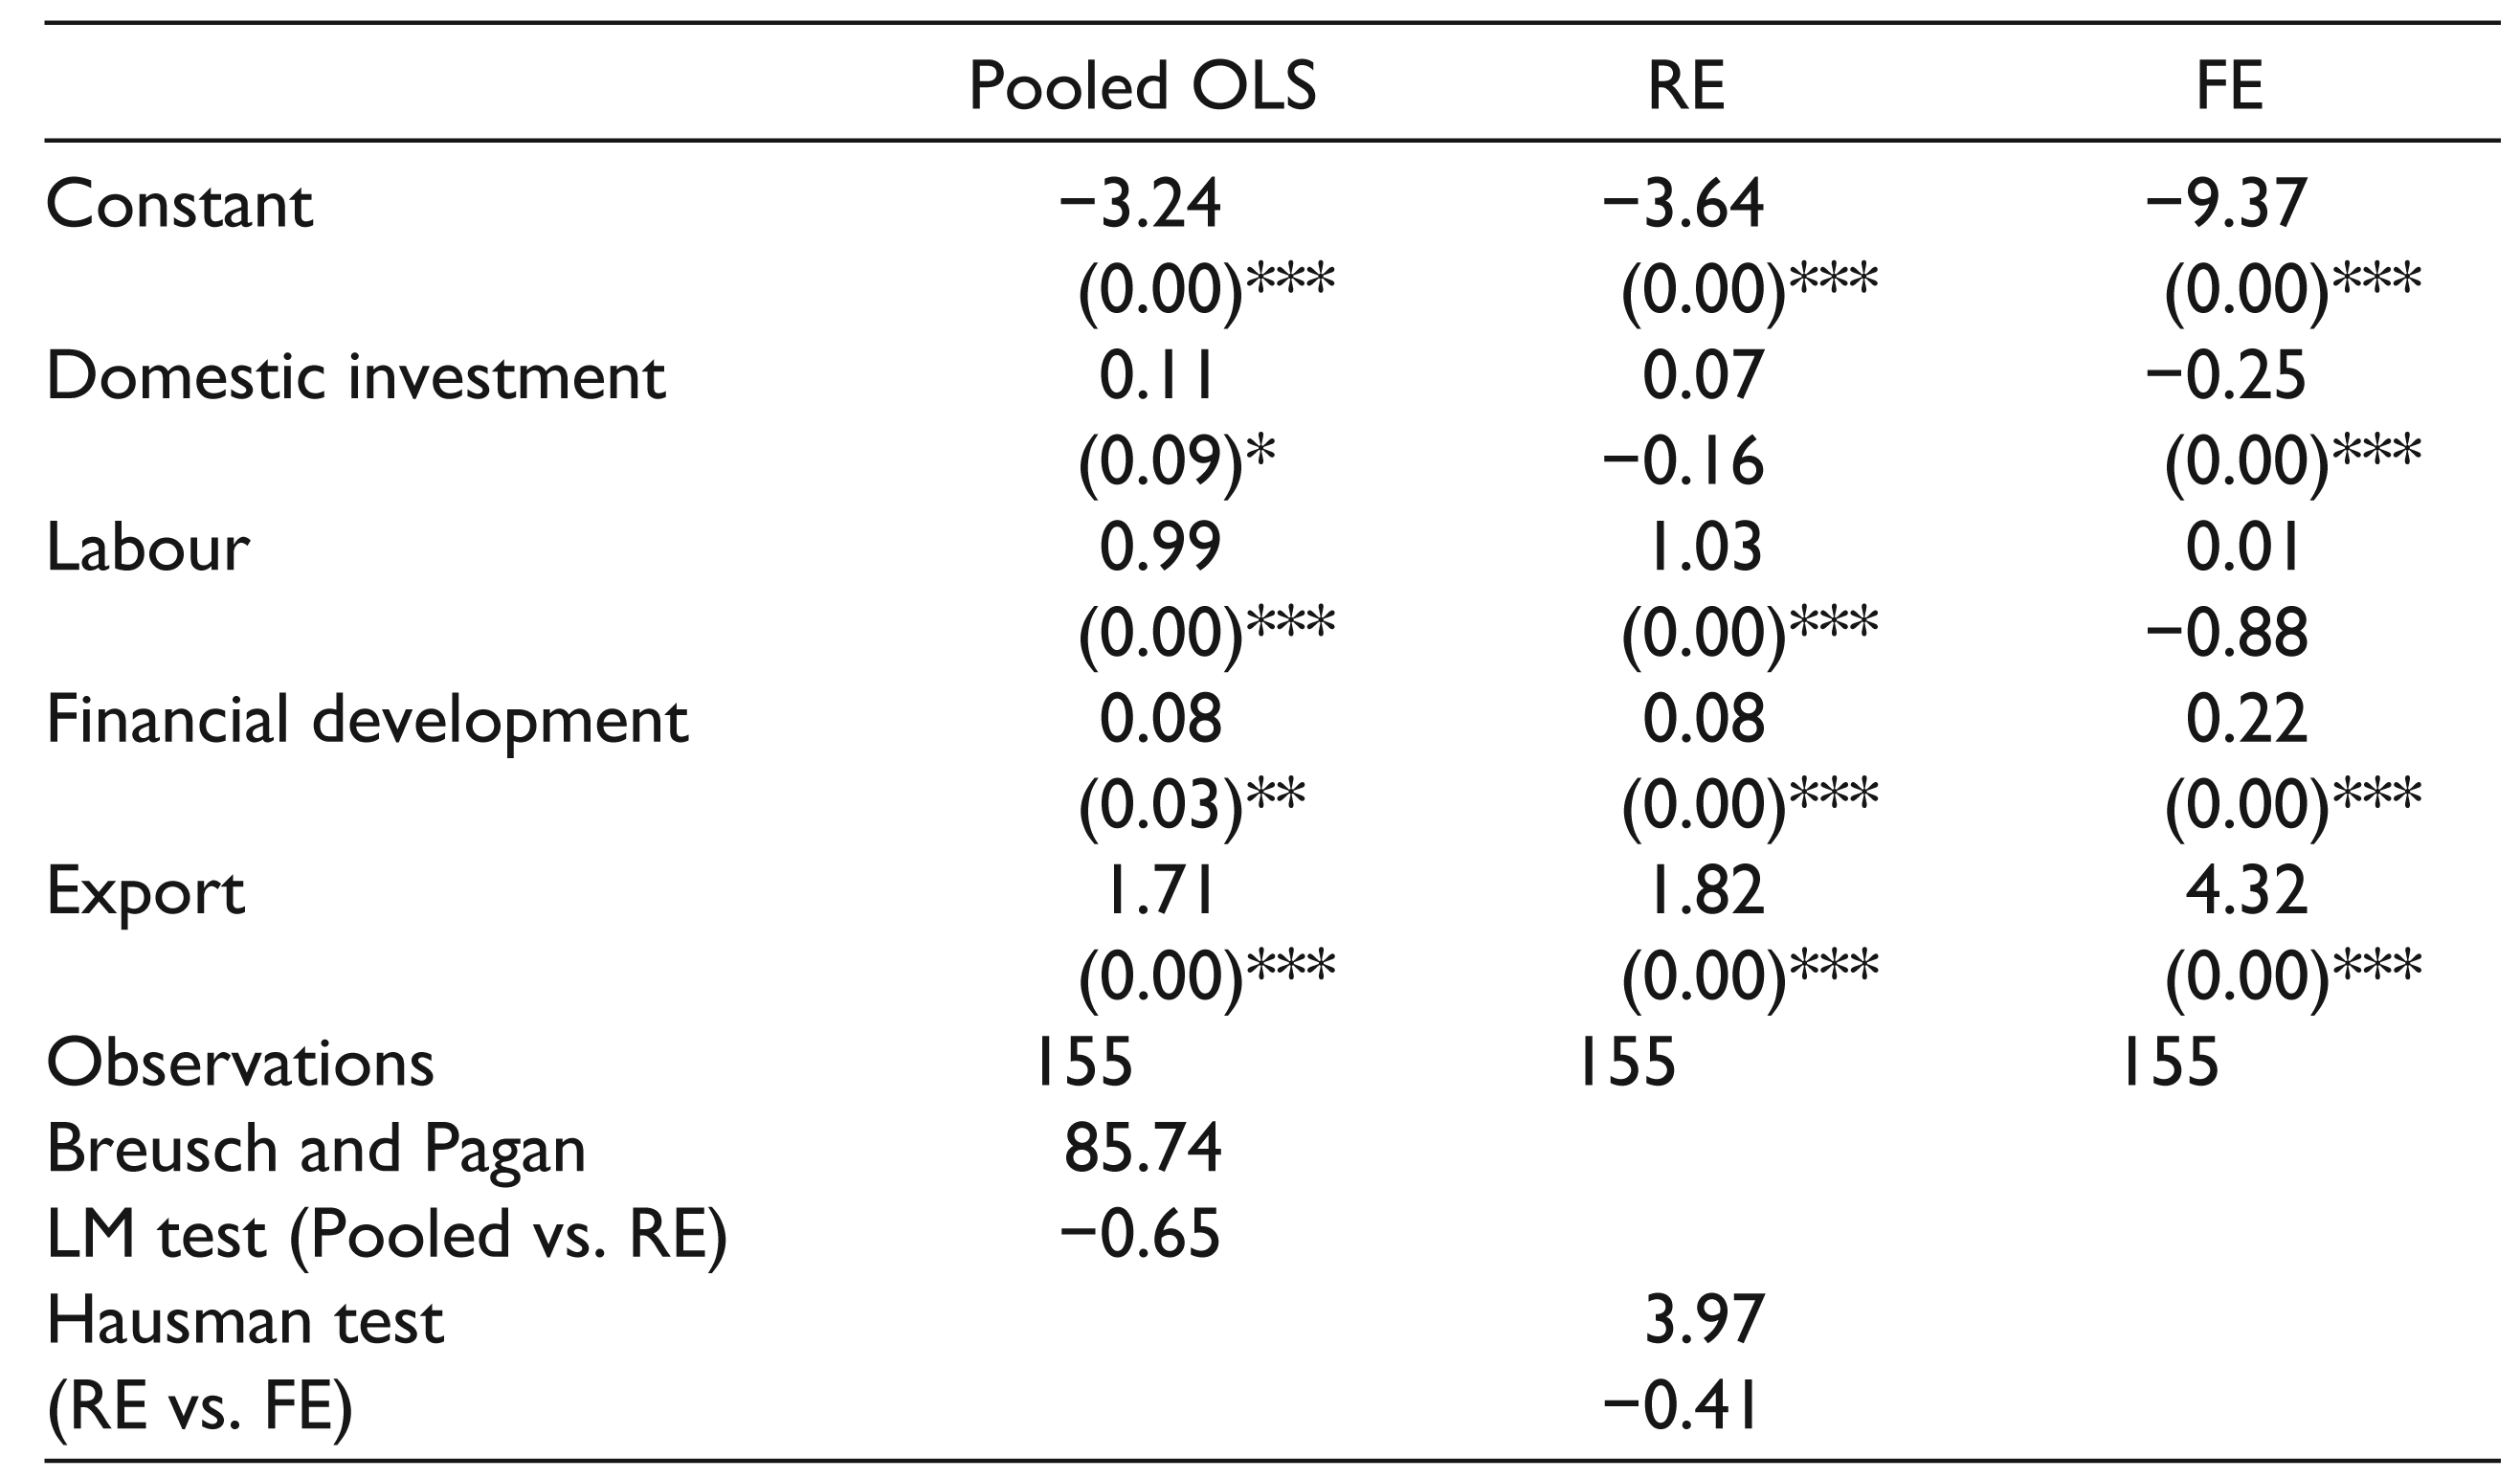
The following LM result is retrieved out of the first data set utilizing the formula as presented in the following: LM = 85.74. The value that is measured is lower than the tabulated chi-squared value, which indicates that the model of RE is less appropriate compared to the model of pooled OLS. This means that there is no country-specific effect in the prediction, and the intercept could be assumed to be homogenous in this calculation.
As described earlier, the Hausman test assists in selecting either the RE model or the FE model. Table 7 reveals that the test’s p-value is more than the chosen 5 per cent level of significance, indicating that the model of FE is not appropriate, and the model of RE is better. Table 7 highlights the Hausman test outcomes.
Hausman Test

Accordingly, the results of the above tests specify that, for section two, the method of OLS could be used. In other words, there exist no country effects in the residuals. In addition, the residual is not correlated with the explanatory variables.
Table 8 provides a comparison of the outcome of the three methods, namely, pooled RE, FE and OLS. The result highlighted in Table 4 utilizes LLY as a measurement scale for FD. As shown in Table 8, all factors, including DI, labour, FD and X, affect positively and highly significantly, suggesting that these variables are important determinants of the economic growth in ASEAN-5 countries. The FD, which is measured by PRIVY, is positive and significant; however, just like the previous section, it does not have an important function as a determining factor for the growth of the economy in ASEAN-5 countries.
Result for Estimated Model
Section Three: PRIVATE as Measurement for Financial Development
This section reports the estimated result of Equation (8), which used PRIVATE as the measurement for FD. The third measurement is the percentage of credit allocated to the private sector by the financial system. King and Levine (1993) called this indicator PRIVATE and used the ratio of claims on the non-financial private sector to total domestic credit (excluding credit to money banks). For this purpose, the following model is utilized:

This model examines the effect of the above variables on economic growth for ASEAN-5 countries during the period from 1980 to 2010. The descriptive statistics, including mean, median, minimum, maximum, standard deviation, skewness, kurtosis, Jarque–Bera and probability, is presented in Table 9.
Descriptive Statistics
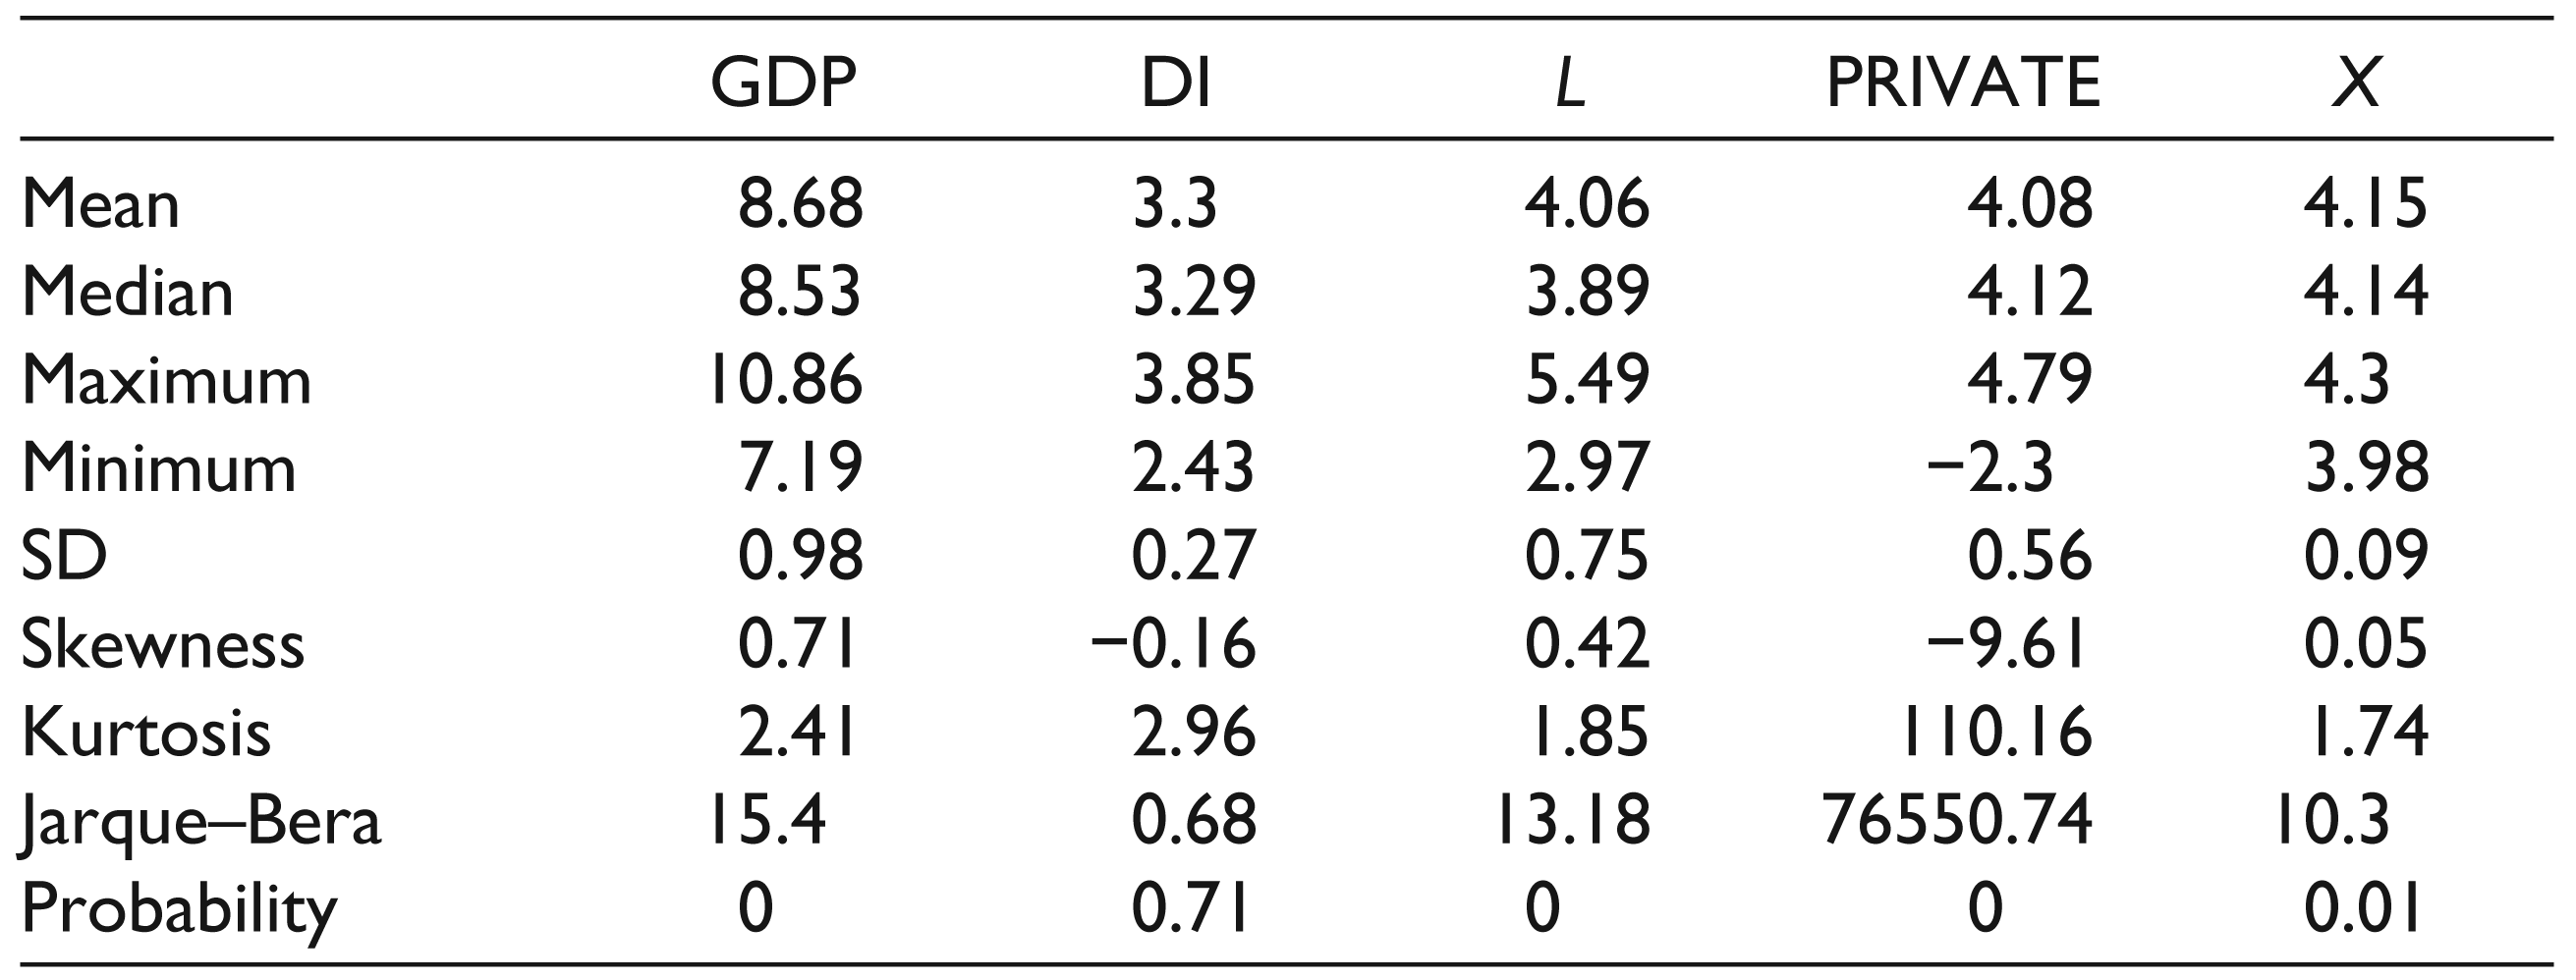
Table 10 shows the relations among the variables. All the variables have a positive relation with economic growth/GDP. According to past researches, these relations have been predicted, and the results are similar to this one.
Correlation Among the Variables
In this section, FD correlates negatively with economic growth. According to King and Levine (1993), this outcome is very dissimilar from many other researches that have examined FD and economic growth relations.
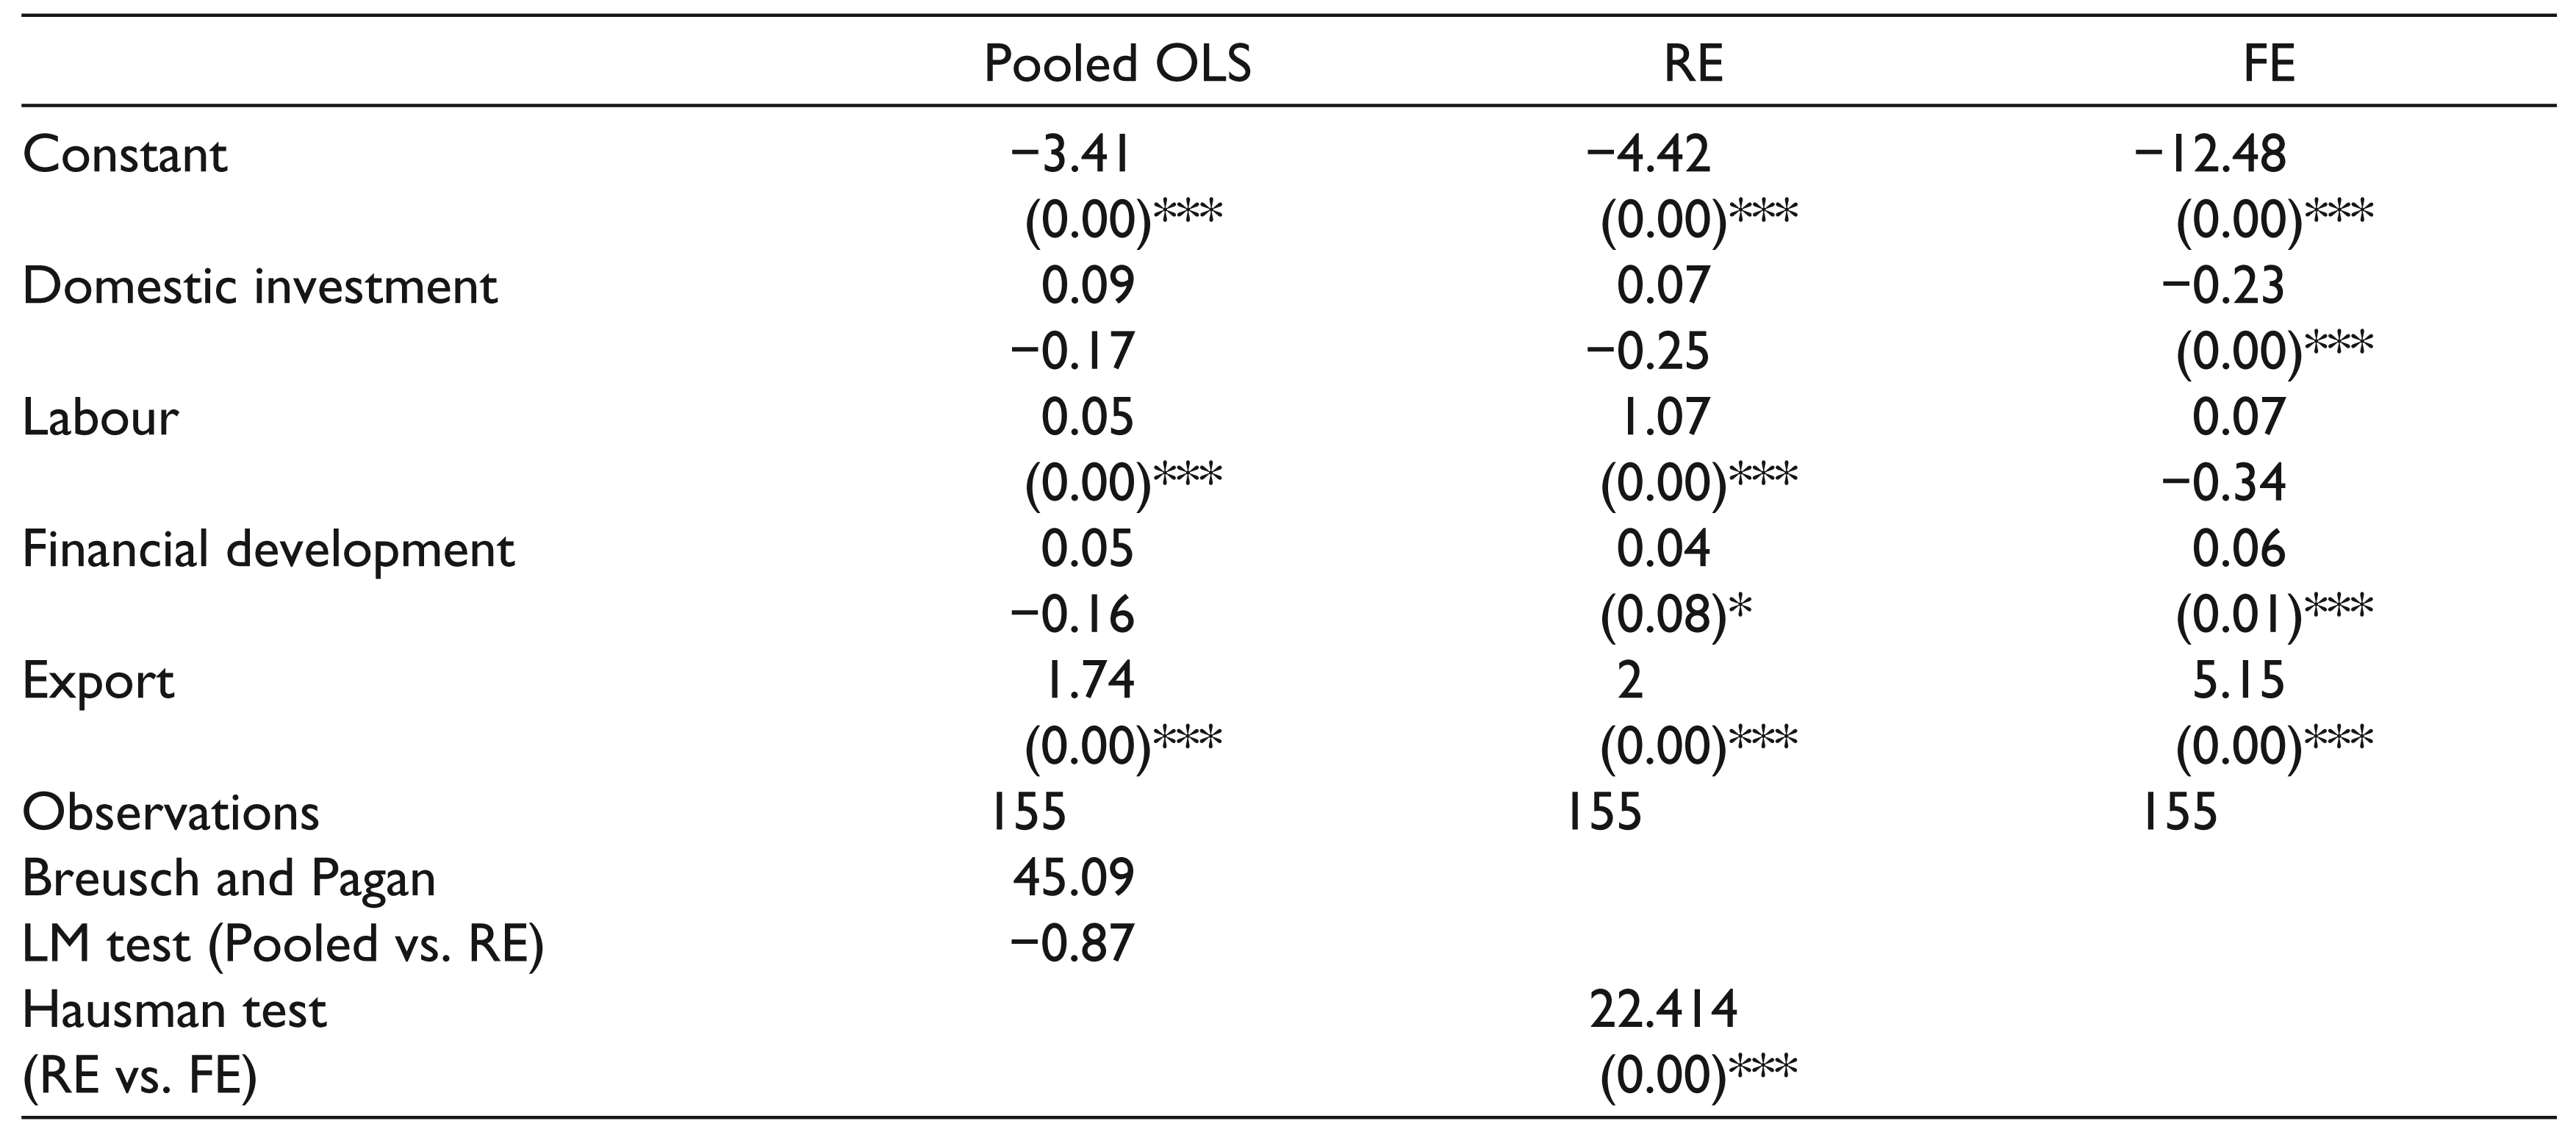
The following LM test outcome is retrieved using the first data set, which indicates an LM value of 45.09. The value that is measured is lower than the tabulated chi-squared value, which indicates that the model of RE is less appropriate compared to the model of pooled OLS. This means that there is no country-specific effect in the prediction, and the intercept could be assumed to be homogenous in this calculation.
As explained previously, the Hausman test assists in selecting either the model of RE or the FE. Table 11 reveals that the test’s p-value is more than the chosen 5 per cent level of significance, indicating that the model of FE is not appropriate, and the RE model is better.
Hausman Test

Accordingly, the results of the above tests show that, for section three, FE is more proper than the other two models. In other words, there exist no country effects in the residuals; however, the residual is correlated with the explanatory variables.
Table 12 presents a comparison of the outcomes of the three approaches, namely, RE, FE and pooled OLS. The outcome that appears in Table 12 utilizes PRIVATE to calculate the FD. Table 12 presents the results of the RE method. It shows that all the predicted factors have a positive and significant effect except for DI. This means that these variables are essential factors in ASEAN-5 countries’ economic growth. The FD, measured using PRIVATE, is significant and positive, but it is not a critical factor in ASEAN-5 countries’ economic growth.
Result for Estimated Model
As described earlier, three estimations were presented in Table 13. First, the estimated result, which utilized LLY as the form of measurement for FD, was presented. Second, the estimated result, which utilized PRIVY as the form of measurement for FD, was presented. Lastly, the estimated result, which utilized PRIVATE as the form of measurement for FD, was presented.
Summary of Results
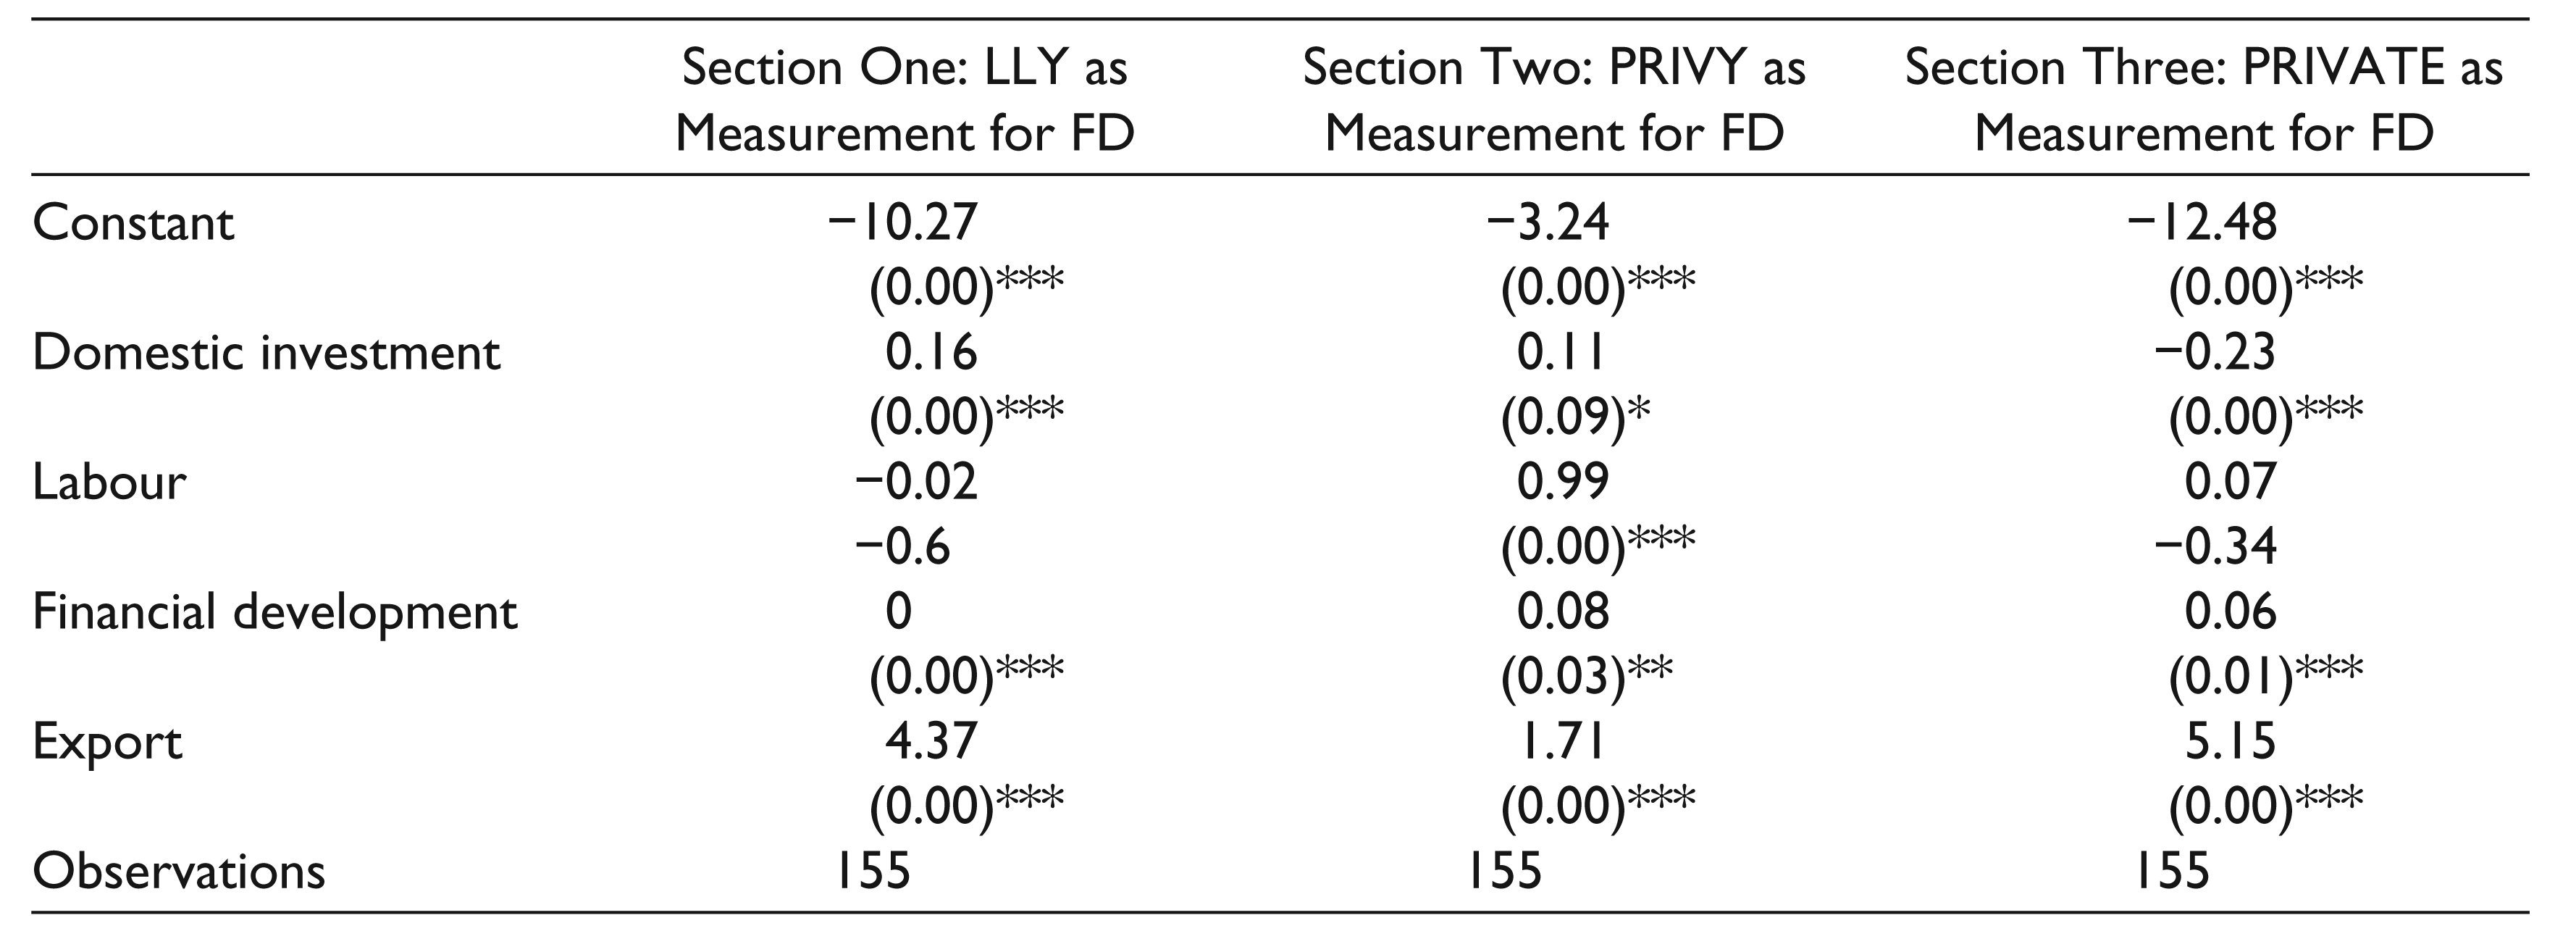
As presented in the tables, almost all the variables are positively related to GDP. This is similar to other studies that have been carried out in this area. The FD, which is calculated using three forms of measurement, is positively related to economic growth. This concurs with many empirical proofs that reviewed the relation between FD and economic growth (King & Levine, 1993). Based on the first segment, the tests indicate that the method of FE should be selected. Nevertheless, in the second segment, the pooled OLS method is more suitable. In the third segment, the tests’ results indicate that RE is more appropriate. This means that there are no country effects in the residuals, but the residual is linked to the explanatory variables. The FD, calculated using three types of measurements, is essential in all the models. The FD calculated using three types of measurements has a positive sign, but the estimated models indicate that the effect of FD, as a factor of ASEAN-5 countries’ economic growth, is not as effective as the other variables such as X and DI. Furthermore, the variables such as labour, DI and X have a significant effect on ASEAN-5 countries’ economic growth.
Conclusion
The result shows that, mostly, all variables, namely, FD, DI, labour and X, have positive correlations with the economic growth of ASEAN-5 countries. In particular, the FD, which is calculated using the three measurements, shows a positive relation with economic growth. The LM and Hausman tests provide various choices for various measurements. In the first segment, the LM and Hausman tests show that it is most suitable to select the FE method. In the second segment, however, the pooled OLS method is found to be more suitable. The Hausman and LM tests in the third segment suggest using the RE method as a better choice.
FD, which is measured using three measurements, is significant and has a positive sign; however, the estimated models show that the influence of FD, as a determinant for economic growth of ASEAN-5 countries, is less than the influence of the other variables such as DI and X. In addition, the variables of DI, labour and X affect the economic growth of ASEAN countries significantly. This study confirms the recommendation that FD can shed a new light to developing countries. In addition, based on the estimated model in this study, other factors such as DI, X and labour determine the level of economic growth of ASEAN-5 countries.
Economic theories recommend that financial liberalization/development motivates economic development. The terms of FD and financial liberalization could be used equally. It is supposed that the countries that try to liberalize the financial market achieve FD. Generally, the developing countries, which try to achieve FD, try to decrease financial repression. Countries that desire to develop their financial market must decrease the government interventions. These government interventions appear in forcing desired interest rates, allocating credits by administrative decision rather than market criteria and controlling foreign capital.
The outcomes of FD are not the same for all countries/regions. Many studies report a higher successful outcome of FD in Asia compared to some other regions. On the other side, some reports suggest that the Asian economic crisis of 1997–1998 was an unlucky consequence of weak domestic financial systems. This study confirms that FD affects the economic growth of ASEAN-5 countries, positively. Some economists debate that financial liberalization generates more variations in the exchange rate, which could cause more financial instability. In addition, the developing economies, which encourage liberalizing their financial market, are afraid of instability. For further studies, the effect of exchange rate could be investigated to control the effect of volatility of the exchange rate.
Declaration of Conflicting Interests
The authors declared no potential conflicts of interest with respect to the research, authorship and/or publication of this article.
Funding
The authors received no financial support for the research, authorship and/or publication of this article.
Footnotes
Acknowledgements
The authors are grateful to the anonymous referees and the editorial team of the journal for their extremely useful suggestions to improve the quality of the article.