
Abstract
Employee well-being is always found to be strategically relevant to organizations and individuals and has developed into one of the focal areas of research in the study of organizations. However, researchers have shown lots of interest in this field due to the lack of a proper theoretical model and comprehensive scientific tools to measure employee well-being at work. The present study aims at developing and validating a multidimensional scale of employee well-being through exploratory and confirmatory factor analysis (CFA). Based on literature and feedback received from academicians and HR practitioners, a 62-item questionnaire of employee well-being was developed for empirical validation. The samples consist of academicians and HR professionals, and they were interviewed to gauge their understanding of employee well-being. Initially, opinions from various experts were obtained regarding the instrument and its proposed dimensions. Forty-nine items were generated from the initial study for further validation through field surveys. Exploratory factor analysis (EFA) was carried out on the data collected from 316 employees of the Indian service industry to examine the factor structure of the scale. It was revealed through the use of EFA that the new instrument of employee well-being is formed by four discreet factors: social well-being, psychological well-being, subjective well-being and workplace well-being. Finally, CFA was carried out using AMOS 20, 31 items were retained for the new scale of employee well-being. The theoretical and practical applications of the study are discussed in the context of employee well-being.
Introduction
Today’s business world is much more complex, interlinked and unpredictable than before. Globalization has brought in heavy competition in the international market through creating an environment of volatility, uncertainty, complexity and ambiguity. In recent years, the service industry in India has propelled the economy forward. It contributes approximately 61 per cent to India’s GDP, with a growth of 10 per cent year on year in 2015–2016 (India Brand Equity Foundation [IBEF], 2017). This sector basically includes the information technology (IT) industry, research and development, finance, banking, insurance, non-financial business and outsourcing. According to the recent report of Department of Industrial Policy and Promotion (DIPP) (2017), the service sector marks an enhanced foreign direct investment (FDI) equity inflow (Agarwal, 2014; IBEF, 2017). India enjoys greater advantages over other countries because of its abundant young and educated talent base, accentuated by an addition of over 3.5 million new talent every year (Agarwal, 2014). Almost 50 per cent of India’s current account deficit is being addressed through the revenues generated from the export of services. Apart from the financial gains, this sector has also developed to become the largest employer with approximately 2.8 million professionals (National Association of Software and Services Company [NASSCOM], 2011–2012).
The service industry is both a knowledge- and service-oriented industry. It requires a flexible approach, round-the-clock work schedules and out-of-the-box thinking for people to be successful (Malhotra & Mukherjee, 2004, 2006; Panda & Rath, 2017). Such conditions generate highly demanding, flexible, productive, multitasker and stressful work roles. The service industry professionals often suffer from job burnout due to emotional exhaustion (Bakker, Demerouti, & Euwema, 2005). To add to the misery, the rapid change in the technology has ensured that skills are becoming obsolete at a faster pace. To cope with these changes, employees have to burn their midnight oil to keep track of all the changes around and be competitive (Currie, 2001). A recent study also reveals that employee well-being is positively related to internal branding of an organization and organizational effectiveness (Raj, 2008). Hence, there is a greater need to understand and explore the phenomenon of employee well-being in a more comprehensive way in today’s organizations.
Dual earning families have become a commonplace (Cox, Edwards, & Palmer, 2005), and these have given birth to a new set of challenges to manage the work-life balance (Agarwal, 2014; Guest, 2002; Robertson & Cooper, 2009). Such situations have created multiple issues and troubles at workplaces such as employee separation for health-related issues, severe job stress and mental disorders (Bevan, 2010; Grawitch, Gottschalk & Munz, 2006). Organizations are becoming aware that to retain their best talent and work in collaboration with them, they need to focus on how people are adapting to change and increasing pressure (Budhwar, 2000). Organizations are also realizing that they need to expand their focus to look at aspects such as identity, meaning, purpose, self-expression and creative outputs. Employee well-being works as a panacea for all these problems.
The influence of employees’ well-being on work has been a central focus of current research in organizational studies (Currie, 2001; Economic and Social Research Council, 2006; Kersley et al., 2006; Warr, 2002). Tehrani, Humpage, Willmott, and Haslam (2007) in their study indicate that employee well-being has gradually been given more importance in the business agenda as more employers have started to realize the benefits of bringing into effect the policies related to employee welfare and health. Some of the policies incorporated by policymakers for resolving employee’s health problems are good service practice, work-life balance strategies, employee assistance programmes, restoration strategies and different training policies (Department for Work and Pensions, 2006). It has also become important for employers to understand the problems of their employees by looking into their well-being through maintaining a balance between the mutual expectations of both employees and employers. In this regard, the present study attempts to both expand the understanding on the structural dimensions of employee well-being and develop a comprehensive scale to objectively measure the phenomena of employee well-being. The present study has three parts: the first part covers the analysis of literature and importance of employee well-being scale development, whereas the second part gives a clear idea of the scale development process, regarding all the empirical analyses of scale establishment and validation. The last part of the study covers the conclusion portion with a discussion of the study findings, implications and limitations of the study.
Literature Review
Employee Well-being
Research on employee well-being is well documented in organizational studies. However, comprehensive understanding, conceptual clarification and the definition of employee well-being still remain largely unclear and unresolved (Diener, Suh, Lucas, & Smith, 1999; Forgeard, Jayawickreme, Kern, & Seligman, 2011; Keyes, Shmotkin, & Ryff, 2002; Seligman, 2011; Stratham & Chase, 2010; Zheng, Zhu, Zhao, & Zhang, 2015). According to New Oxford Advanced Learner’s Dictionary (7th ed., revised 2005), the term ‘well-being’ can be defined as a state of being comfortable, healthy and happy. In this regard, employee well-being connotes the physical, psychological and emotional health, comfort and happiness of employees. In general, employee well-being is defined as the comprehensive experience and function of an employee from a perspective of both physical and psychological dimensions (Warr, 1999). Ryan and Deci (2000) explained that well-being has two important philosophical aspects: one is hedonism, which is happiness oriented, whereas other one is eudemonism, which concerns in realizing human potential power. Most often employee well-being has been defined as employees’ entire well-being that they perceive to be influenced by work and workplace interventions (Juniper, Bellamy, & White, 2011; Siegrist, Wahrendorf, Knesebeck, Jurges, & Borsch-Supan, 2006). World Health Organization (2013) gives an exhaustive definition by trying to capture the common theme running through all the above definitions about employee well-being, that is, ‘a state of every individual employee to understand his own capability, to manage with the normal stresses of life, to work productively and is able to make a contribution to her/his community’. The mere presence of various definitions of employee well-being makes it difficult to comprehend through the literature review and leads to a dissimilar perspective. For example, Van Laar, Edwards, and Easton (2007) and Sirgy, Efraty, Siegel, and Lee (2001) refer to employee well-being as quality of work life or work-related quality of life, whereas Page and Vella-Brodrick (2009) report on workplace well-being and employee mental health. Wright and Cropanzano (2007) refer to psychological well-being (PWB) as overall well-being of an employee in their studies. Interestingly, Sirgy (2012) observes the concept of employee well-being and mentions in the literature by different terms such as ‘quality of working life’, ‘work well-being’, ‘quality of work life’, ‘work quality of life’ and so on.
Elements of Employee Well-being
Previous researches report that overall well-being is not an adequate depiction of employee well-being. It is dynamic, subjective in nature and multidimensional (Juniper et al., 2011; Zheng et al., 2015). One of the most influential studies on the dimensions of employee well-being was carried out by Warr (1999, 2007). He defined employee well-being from a perspective of employees’ experiences, in general, and job aspects in particular. Well-being may also be divided into two distinct components: context-free well-being and domain-specific or job-specific well-being. Context-free well-being revolves around people’s general feelings of well-being in all aspects of their lives (e.g., life satisfaction, happiness). On the other hand, domain-specific well-being focuses on people’s feelings of well-being in a specific aspect of their lives. Job-specific well-being is a subset of domain-specific well-being and it refers to people’s feelings of well-being in relation to their jobs, for example, satisfaction with pay or co-workers. Warr (1999, 2007) has also put forth three contrary dimensions which are (a) displeasure and pleasure, (b) anxiety and comfort and (c) depression and enthusiasm. He states that most of the researches related to well-being use these dimensions as dependent variables. Displeasure/pleasure is one of the affective dimensions, associated with negative as well as positive work-related emotions in general. While anxiety and comfort both encompass the state of slight pleasure, they differ from each other based on the level of mental stimulation, that is, anxiety being high and comfort being low in mental stimulation. The third dimension, depression and enthusiasm, ranges from extremes of positive motivation and sadness. Some authors (Cotton & Hart, 2003; Daniels, 2000; Warr, 1999) are of the view that the measures of well-being are essential to capture employees’ cognitive and affective experiences at work with all its subtleties intricacies, complications and disparities of employees’ intellectual and emotional experiences at work.
In recent years, the multiple-measure approach has been used by researchers to explain employee well-being. Ryff and Keyes (1995) conducted an analysis on dimensions of well-being and proposed a multidimensional model. The model highlights three major dimensions of well-being: PWB, social well-being and emotional well-being. It has also been suggested that employee well-being (EWB) should be seen as covering both work- and non-work-associated psychological experiences and health status (Zheng et al., 2015). In the literature on mental health and well-being, Page and Vella-Brodrick (2009) have reasoned that EWB should be measured in terms of (a) PWB, (b) workplace well-being and (c) subjective well-being (SWB). PWB includes important components such as self-acceptance, purpose in life, environmental mastery, positive relations with others, autonomy and personal growth. SWB includes the traditional three constituents—high positive affect, low negative affect and a cognitive evaluation of one’s satisfaction with life as a whole. Furthermore, workplace well-being has been studied under two major components: job satisfaction and work-related affect. Work-related affects are the emotions that generally an employee experiences at work regardless of whether they are directly or indirectly related with the job. Some other researchers have considered employee well-being as positive well-being and negative un-well-being approaches (Huhtala & Parzefall, 2007).
While the significance of mental health as well as positive well-being has been accepted for a long time, there are many studies which have focused on employee ‘un-well-being’, that is, burnout or occupational stress. All the above conceptualizations recognize the multidimensional nature of the concept of employee well-being. Though well-being is now considered as a multidimensional concept, it has two crucial elements: feeling good and functioning well. Happiness, contentment, enjoyment, curiosity and engagement are characteristics of someone who has a positive experience in his life. Having a sense of purpose, experiencing positive and amiable relationships with others as well as having some control over one’s life are all important attributes of well-being (Ryff & Keyes, 1995). Few researches have also shown that employee well-being is more than just people’s medical health and includes advancement, managerial and physical workplace considerations as well as people’s physical and psychological health (Juniper et al., 2011). According to Sirgy (2012), employee well-being consists of (a) meaningful work, (b) an effective response to the work environment, (c) the ratio of job uplifts to job hassles, (d) need satisfaction, (e) satisfaction in work life, (f) a component of the broader concept of employee well-being, (g) job-specific well-being and context-free well-being and (h) the European Commission’s definition of quality of work, whereas recently, on the basis of available literature, Zheng et al. (2015) have argued that employee well-being has three major dimensions, namely, life well-being, workplace well-being and PWB.
Importance of Employee Well-being
Research shows that employee well-being is an important concern for organizations. It has a significant role on the performance and survival of organizations by affecting costs related to illness and health care (Grawitch, Gottschalk, & Munz, 2006), absenteeism, turnover (Spector, 1997) and job performance (Wright, 2010; Wright & Cropanzano, 2007). Employee’s well-being accelerates productivity at individual as well as organizational levels, whereas in the absence of it, the organization may face cumulative financial as well as non-financial loss.
Research shows that employee well-being has an impact on employees’ decisions, like the decision to quit or stay in the current job. It also exerts its influence on job satisfaction (Pradhan, Dash, & Jena, 2017), employee engagement (Sivapragasam & Raya, 2017) and job commitment of an employee (Harter, Schmidt, & Hayes, 2002; Wright, 2006). Moreover, well-being also has a significant impact on the stress-coping behaviour of an individual (Diener & Fujita, 1995; Folkman, 1997; Wright, 2010), on mental and physical health (Carver, Scheier, & Segerstrom, 2010) and overall satisfaction in both profession and personal life (Diener, 2000). Employee well-being is not only important for individuals but also plays a crucial role in organizational success. It is found that the organizations which focus on employee well-being are able to develop competitive advantage in the long run (Wright, 2006). There are multiple benefits of employee well-being to both individual and organizations as described below.
Job performance/productivity (Bevan, 2010; Bryson, Forth, & Stokes, 2017; Judge & Church, 2000; Wright, 2010; Wright & Cropanzano, 2000): A healthy, hearty and contented employee can go extra miles in his job. Work attendance (Wright, 2010): A physically fit and happy employee tries to put his best efforts by ensuring 100 per cent attendance at work. Employee turnover (Bevan, 2010; Wright, 2010): Employees’ well-being promotes individual productivity, for which the organization fairly pays and recognizes them, as a result of which employees ‘feel self-satisfied and ultimately reduce employee turnover’. Acceleration of personal resources (Wright, 2010): Employees, who experience PWB feel a greater degree of positivity. This in turn results in a more creative, sociable, outward as well as positive attitude. Positivity also plays an important role by encouraging employees to boost up their personal resources such as physical, emotional, intellectual and social resources. Hence, this positivity can help an employee in achieving higher job performance and job involvement. The employee feels less exertion, and there is more commitment and dedication to the organization leading to increase work attendance.
Need of a Measurement Tool
Success and development of organizations around the world is dependent on the well-being of its employees (Spreitzer & Porath, 2012). In this regard, employee well-being has become an important research area in organizational behaviour and related fields. While there are many studies revolving around the measurements of employee job satisfaction (Dimotakis, Scott, & Koopman, 2011), work attitude (Leavitt, Fong, & Greenwald, 2011), negative affect (Vandenberghe, Panaccio, Bentein, Mignonac, & Roussel, 2011) or flow (Ceja & Navarro, 2011), the focus has never been on employees’ well-being in a broader sense. In India, academic research in the area of employees’ well-being still lags behind in comparison to the needs of organizations.
In the current scenario, work has become the most vital part of one’s existence as it directly influences employees’ health, happiness, growth, performance and productivity. The need of the hour is to distinguish the concept of employee well-being from general well-being as the workplace situations differ greatly from general life situations. But as a matter of fact, researchers have not yet been able to come to a consensus on the definition of employee well-being (Page & Vella-Brodrick, 2009). PWB, SWB and job satisfaction are still being used interchangeably to exemplify employees’ overall well-being. How truly these reflect employees’ well-being at work is still a mystery.
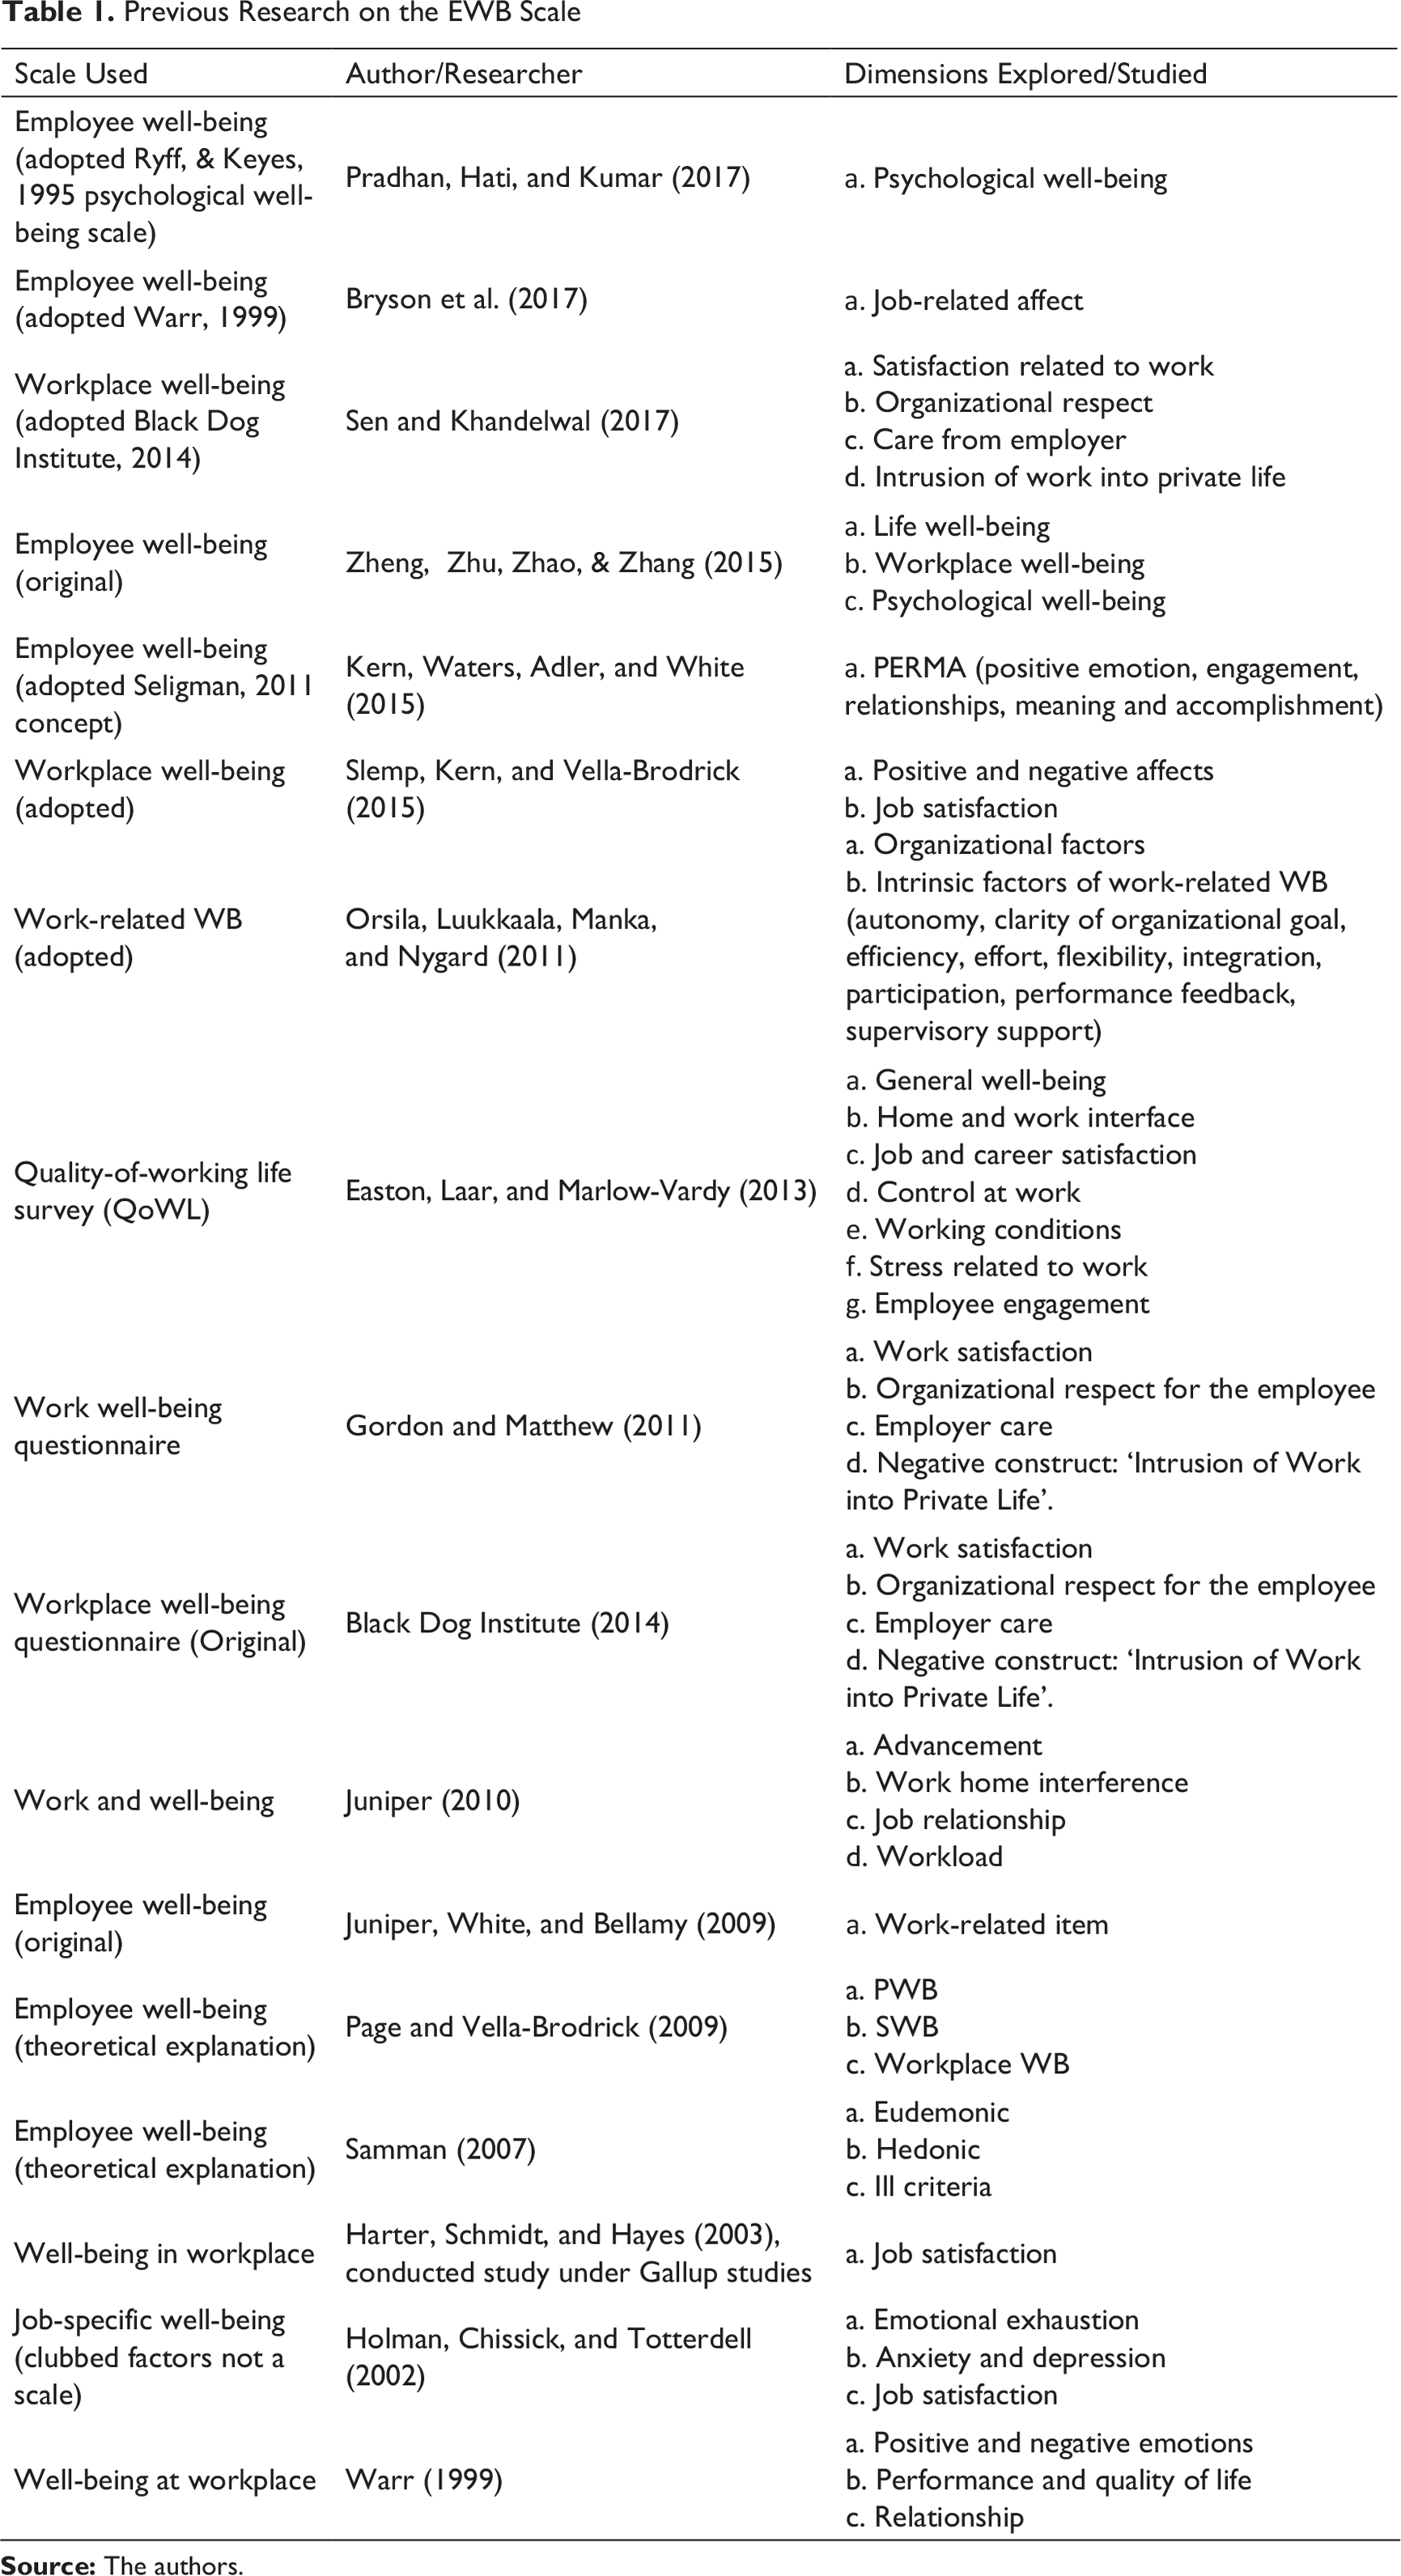
Previous Research on the EWB Scale
Summary of Different Phases of the Study, Their Procedures and Sample Characteristics
Development of the Employee Well-being Scale
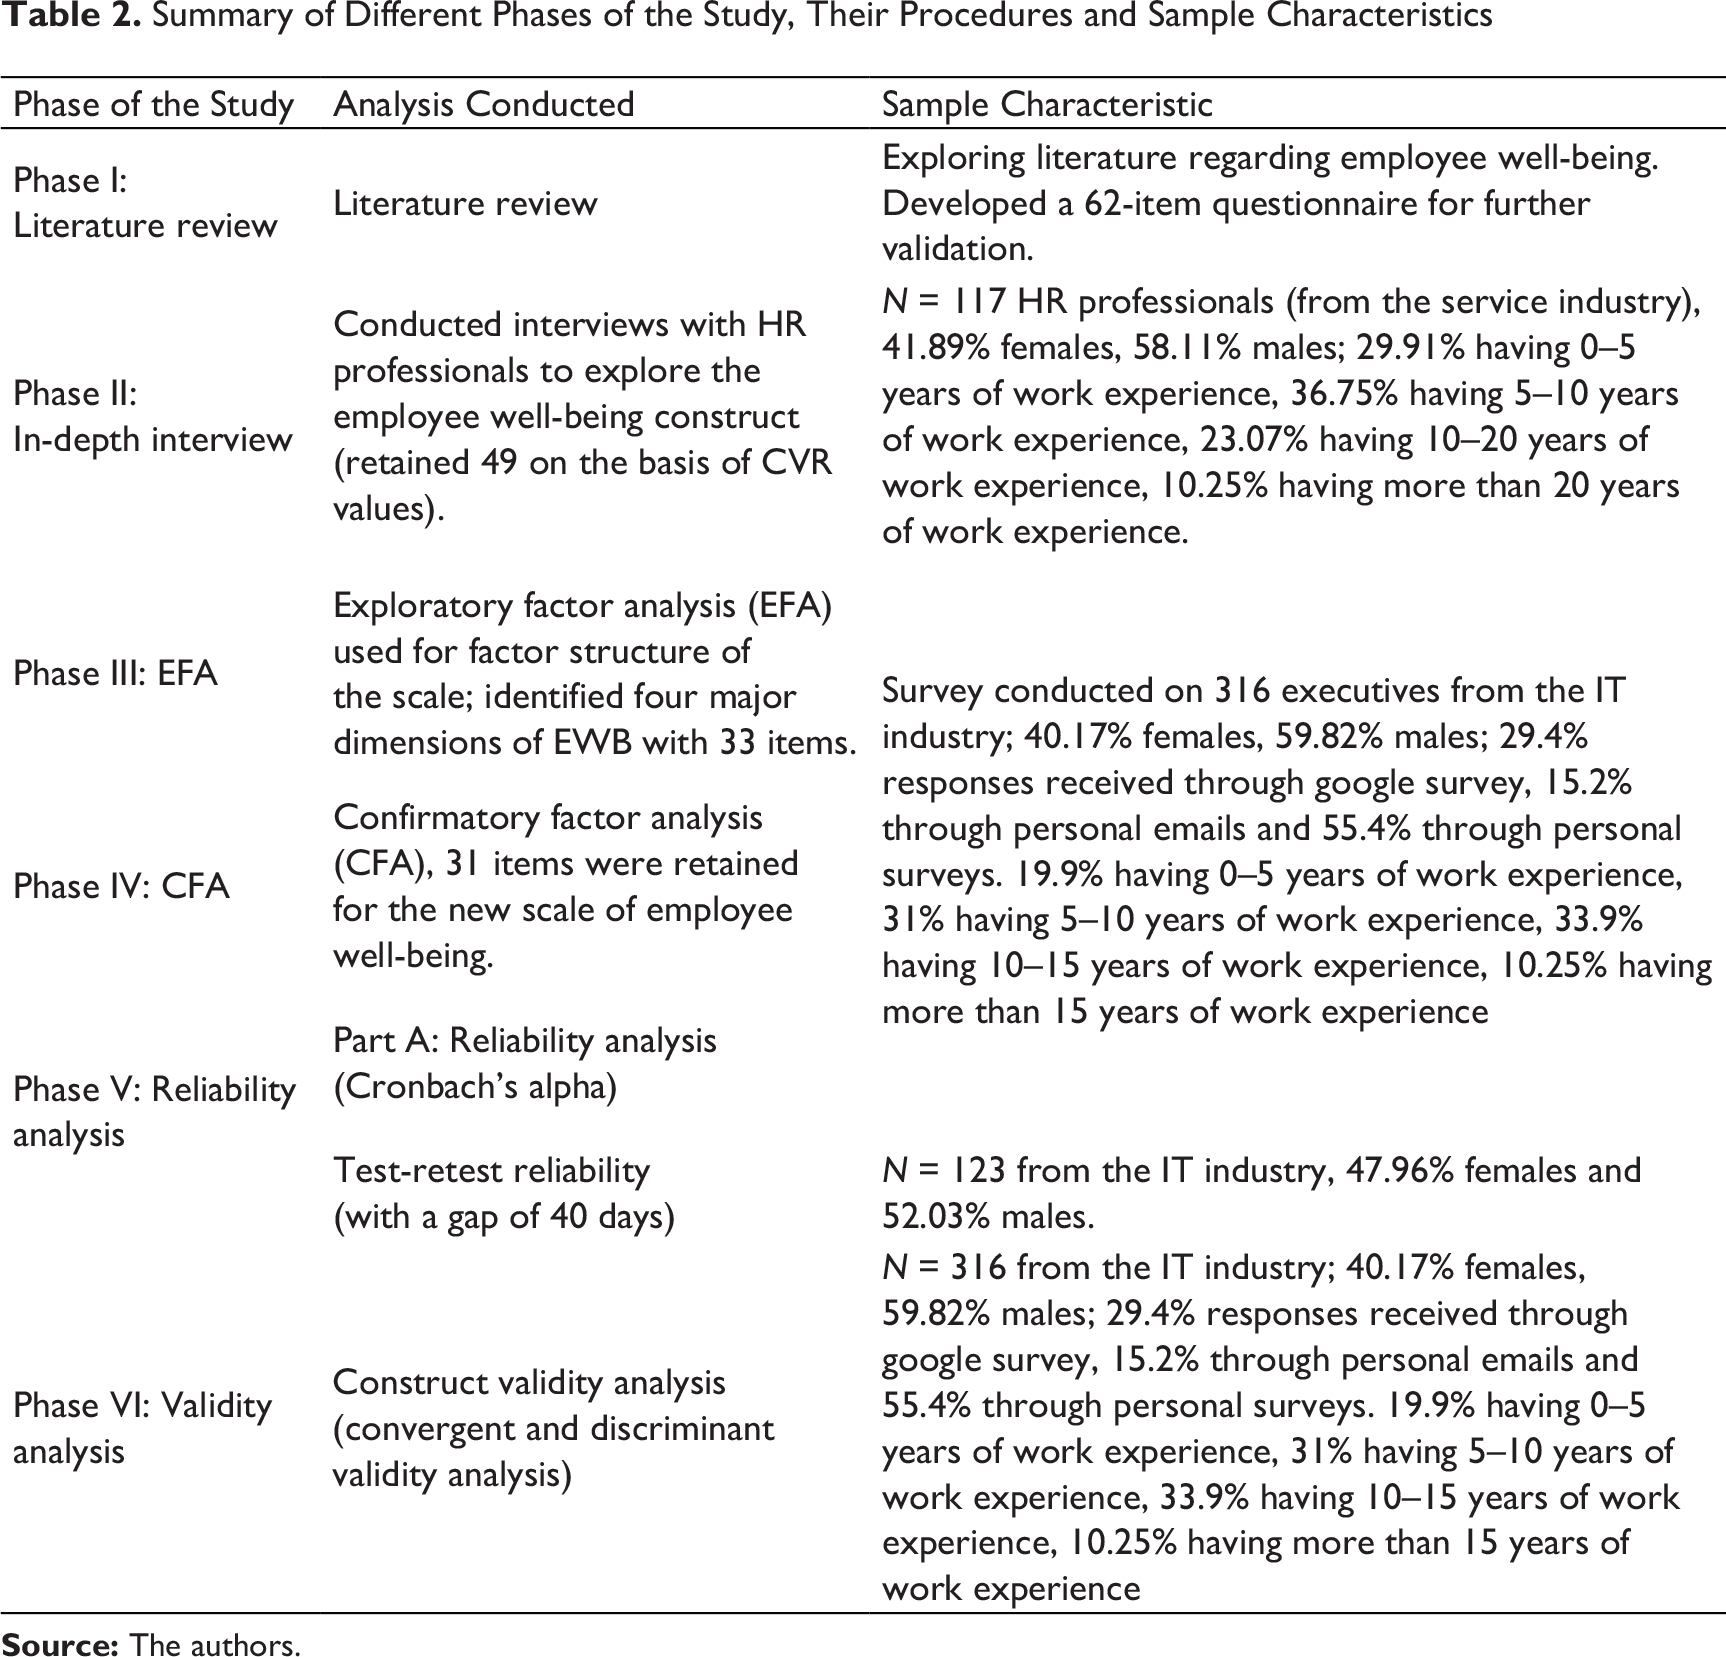
The present study tries to develop an instrument to measure employee well-being. This study has been carried out at different phases. Table 2 highlights the various phases along with a brief description of the phase.
Analysis of In-Depth Interviews
In the first phase of the study, we examined the available literature related to employee well-being and different scales associated with well-being. In the second phase of this study, content analysis of employee well-being was conducted using analytical hierarchy process (AHP), which revealed four different factors related with the construct of employee well-being (Pradhan, Hati & Kumar, 2017). The factors are PWB, social well-being, workplace well-being and SWB.
For initial validation, a 62-item questionnaire was developed on the basis of content analysis. The proposed questionnaire was conceptually classified into four major dimensions: PWB, social well-being, workplace well-being and SWB. The items along with their corresponding dimensions were validated through a discussion with HR professionals. The HR professionals who participated in the study have absolute command and experience in the field of human resource management and its practices. These HR professionals are from both academics and service industries like IT and retail. The academicians include assistant professor, associate professor, professor as well as both junior and senior research scholars who are working in the human resource area. The industrial HR professionals who participated in the study have experience, practice and education in the same field. Initially, opinions were sought from 117 HR professionals from both academics and the industry. The professionals were asked to examine the appropriateness of the instrument by judging its clarity, representativeness and comprehensiveness (Miles, Huberman, & Saldana, 2014). The subject matter professionals were asked to identify the extent to which each individual item represented their respective sub-dimensions and dimension as a whole, by indicating their agreement/acceptability.
Based on their responses, content validity ratio (CVR) was calculated. CVR is the degree that is used to validate whether the content is accurately measuring what the scale intends to measure (Yaghmale, 2003). Lawshe (1975) defined the following formula that is used to calculate CVR:

where N is the total number of professionals that participated in the survey and ne is the total number of respondents specifying an item as essential.
According to Lawshe (1975), CVR values normally range between −1 and +1, that is, from perfect disagreement to perfect agreement. CVR values above 0 indicate that over half of the panel members agree for an item to be essential. Additionally, it has also been prescribed that while interpreting a CVR for any given item, the item for which the CVR value is less than 0.49 has to be rejected.
On the basis of CVR analysis, 13 items were rejected because of disagreement between professionals. Finally, 49 items, with their respective dimensions, were retained in the scale having CVR higher than 0.49 for EFA.
Exploratory Factor Analysis
Initially, a pilot study was conducted with the 49 retained items through CVR. The major objective of the pilot study was to examine the extent to which the instrument provides relevant and sufficient data and evaluate whether it satisfies the main objective of the research or not (Hunt, Sparkman, & Wilcox, 1982). Previous studies have revealed that the standard sample size for having an accurate result through EFA should be at least 150 observations (Guadagnoli & Velicer, 1988; Hinkin, 1995).
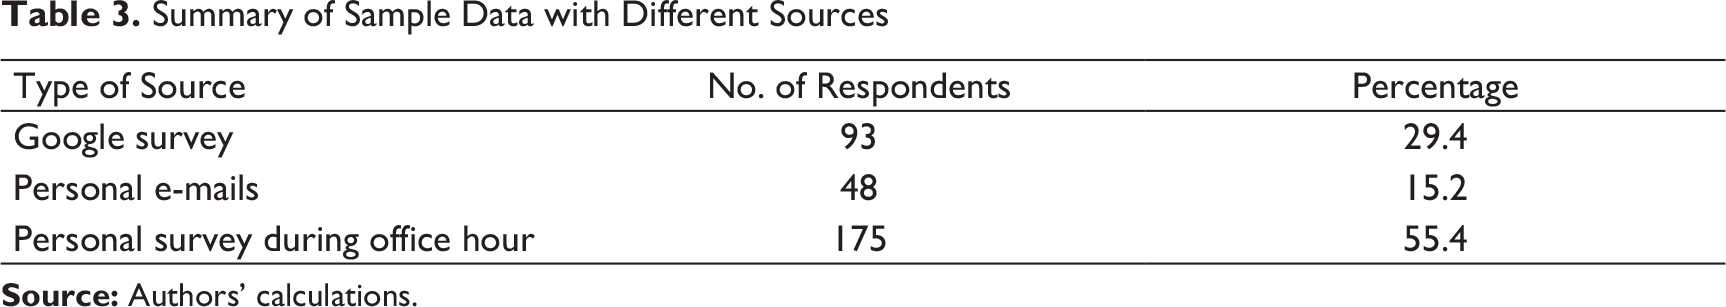
Summary of Sample Data with Different Sources
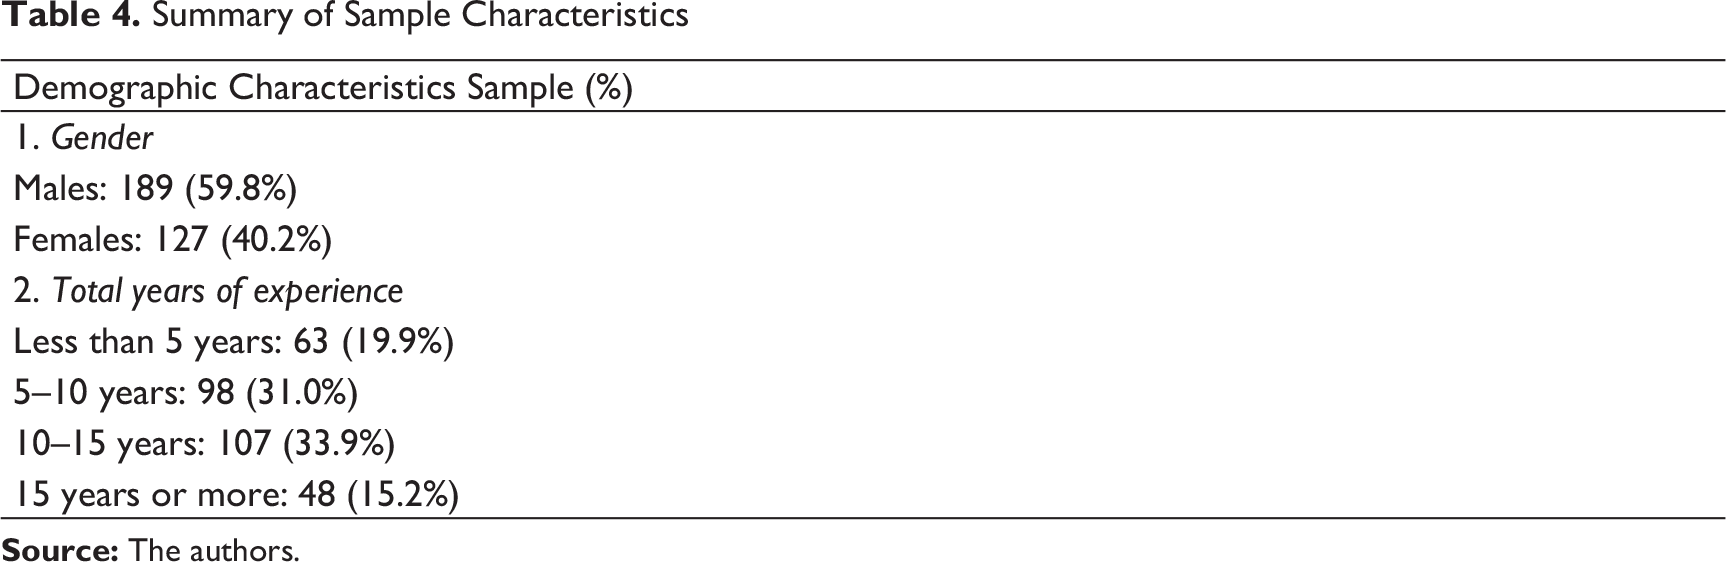
Summary of Sample Characteristics
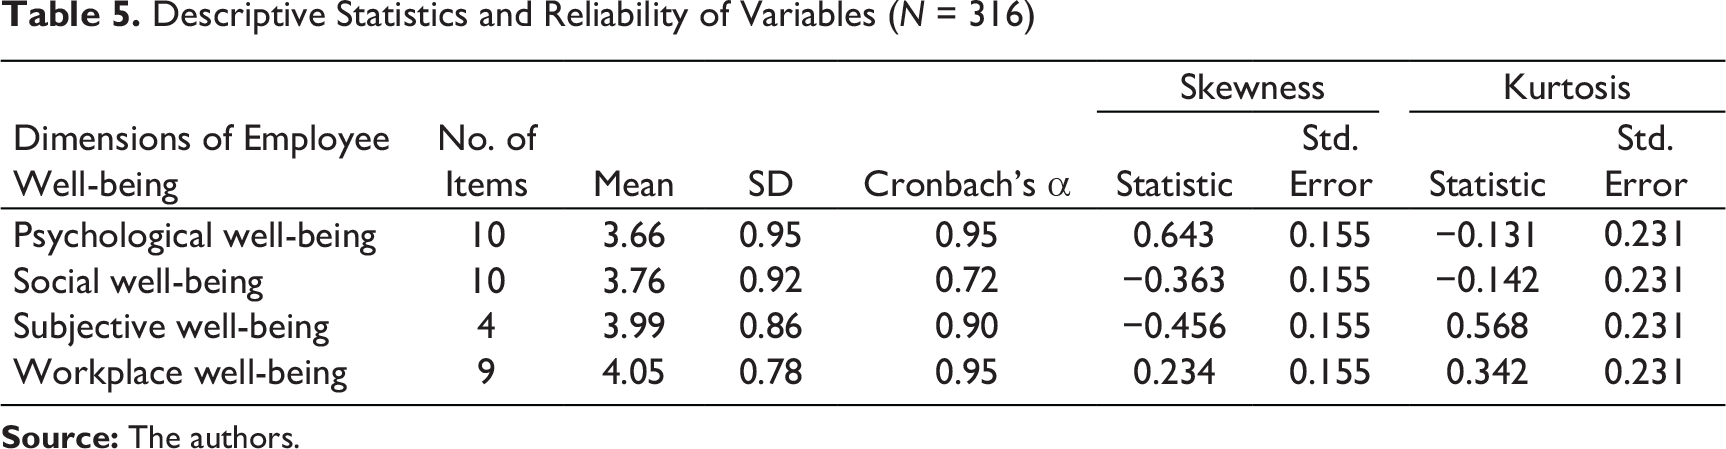
Descriptive Statistics and Reliability of Variables (N = 316)
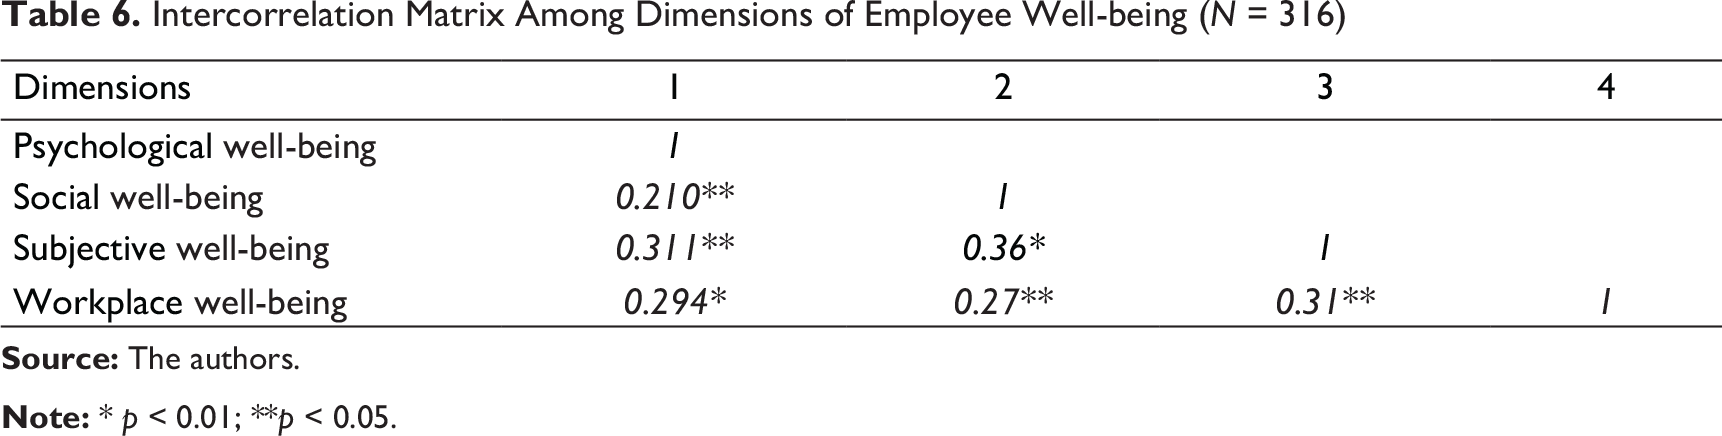
Intercorrelation Matrix Among Dimensions of Employee Well-being (N = 316)
SPSS 21 was used for conducting EFA (principal component extraction and varimax rotation primarily) to assess internal consistency of the scale as a whole and the dimensional weightage of the construct (Costello & Osborne, 2005). According to Pasquali (2008), the validity of the items that composed each factor was also analysed, based on the extent to which the statement represents the factor, that is, an item with a high loading of factor. The final factor structures were decided by looking into the (a) eigenvalues, (b) percentages of explained variance (c) and factor structure as suggested by Hair, Black, Babin, Anderson, and Tatham (2006). Comrey and Lee (1992) classified items on loadings from poor to excellent. Loadings equal or higher than 0.32 were considered poor, loadings equal or higher than 0.45 reasonable, loadings equal or higher than 0.55 as good, loading equal or higher than 0.63 as very good and loadings equal or higher than 0.71 were considered to be excellent. Therefore, items with or above 0.55 loadings are considered for further statistical analysis.
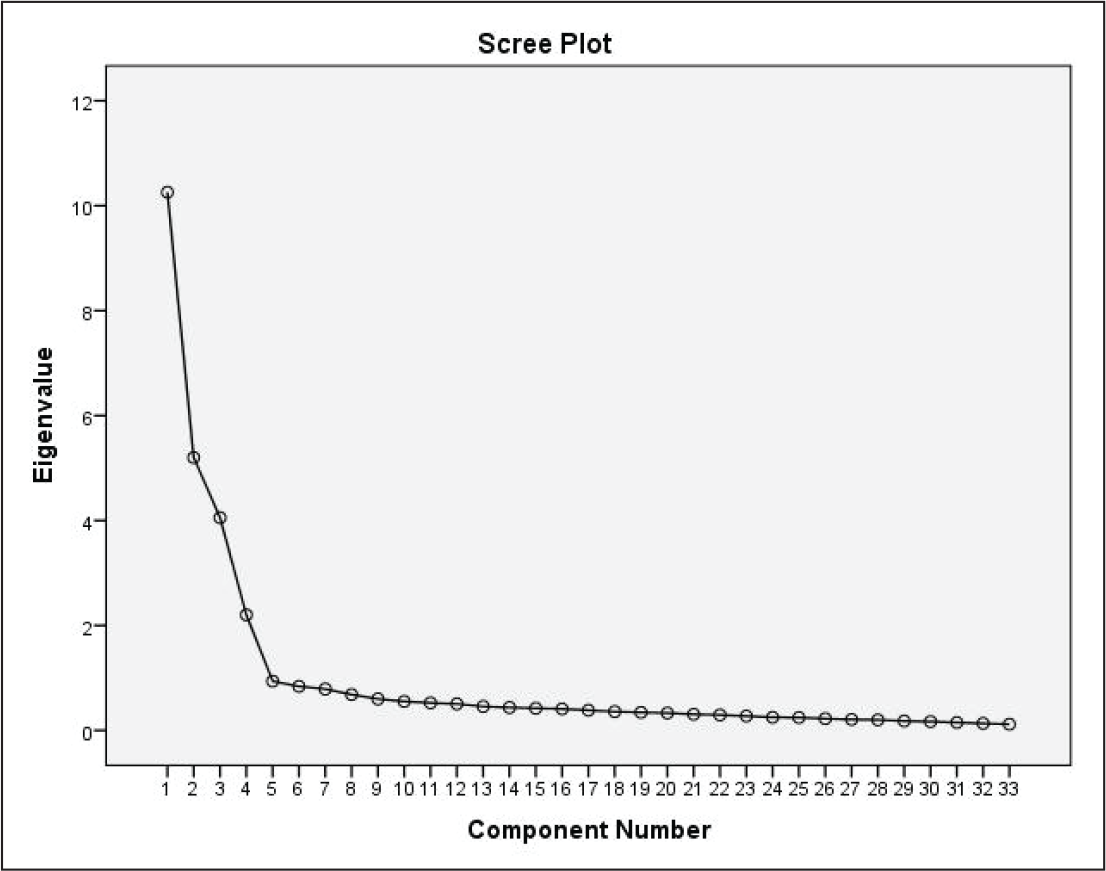
EFA was conducted with principal component analysis. Rotated factor loading matrix was evaluated and analysed thoroughly. In the rotated factor pattern, items having factor loading equal or greater than 0.50 are generally considered as a part of the proposed dimension (Moore & Benbasat, 1991). The principal component analysis of employee well-being items was produced for the four factors with an eigenvalue more than one (as shown in Figure 1). The Kaiser–Meyer–Olkin measure of sampling adequacy is 0.925. Total variance explained by all items of the employee well-being scale is 65.59 per cent. Items having loading of less than 0.70 and a few more repetitive items (Costello & Osborne, 2005) were also deleted. For example, the ‘I have opportunities to grow on my job role (sample item of workplace well-being)’ item which had a loading of 0.52 was deleted. Similarly, few items that are cross-loaded on different factors such as ‘I am satisfied with my life’ (the item of SWB) were removed for overlapping with other components of employee well-being. On the basis of exploratory analysis, we confirmed that the employee well-being scale comprised four dimensions with their corresponding 33 items: PWB (10 items), social well-being (10 items), workplace well-being (9 items) and SWB (4 items).
Factor 1 is PWB. PWB is the individual’s own perception about their lives and experience gained in their lifetime. Generally, PWB includes items related to self-acceptance, personal growth, purpose in life and environmental mastery. This factor consists of 10 items—for example, ‘I think life is a continuous process of learning’. The variance explained by the PWB factor is 31.48 per cent. PWB was previously theorized by many researchers as an important dimension of employee well-being (Page & Vella-Brodrick, 2009; Ryff & Keyes, 1995; Zheng et al., 2015) and is also supported by the findings of the present study.
Factor 2 is social well-being. Social well-being is the positive state of our relationships, our social stability and social peace. It is generally defined as the degree of feeling of belongingness and attachment towards the society. It consists of items related to social acceptance, social actualization, social contribution and social integration. This factor consists of 10 items—for example, ‘I love to spend time with my teammates’. The variance explained by the social well-being factor is 15.29 per cent. Social well-being was previously conceptualized by few researchers as an important dimension of employee well-being (Kern et al., 2015; Warr, 1999) and is also supported by the findings of the present study.
Factor 3 is workplace well-being. Workplace well-being relates to all aspects of working life, including work-life safety, employee assistance, employee growth, work facilities and environment, work climate and so on. This factor consists of nine items—for example, ‘my employer does care a lot about their employees’. The variance explained by workplace well-being is 12.323 per cent. Workplace well-being was previously theorized by few researchers as an important dimension of employee’s well-being (Page & Vella-Brodrick, 2009; Slemp et al., 2015; Zheng at al., 2015) and is also supported by the findings of the present study.
Factor 4 is SWB which involves the subjective evaluation of one’s current status. Evaluation is done on the basis of both positive and negative affects as well as general life satisfaction of an individual. This factor consists of four items—for example, ‘mostly I feel happy’. The variance explained by SWB is 6.485. SWB as an important dimension of employee well-being was previously posited by different authors (Bryson et al., 2017; Page & Vella-Brodrick, 2009; Slemp et al., 2015; Zheng at al., 2015) and is also supported by the findings of the present study.
Rotated Component Matrix of Employee Well-being
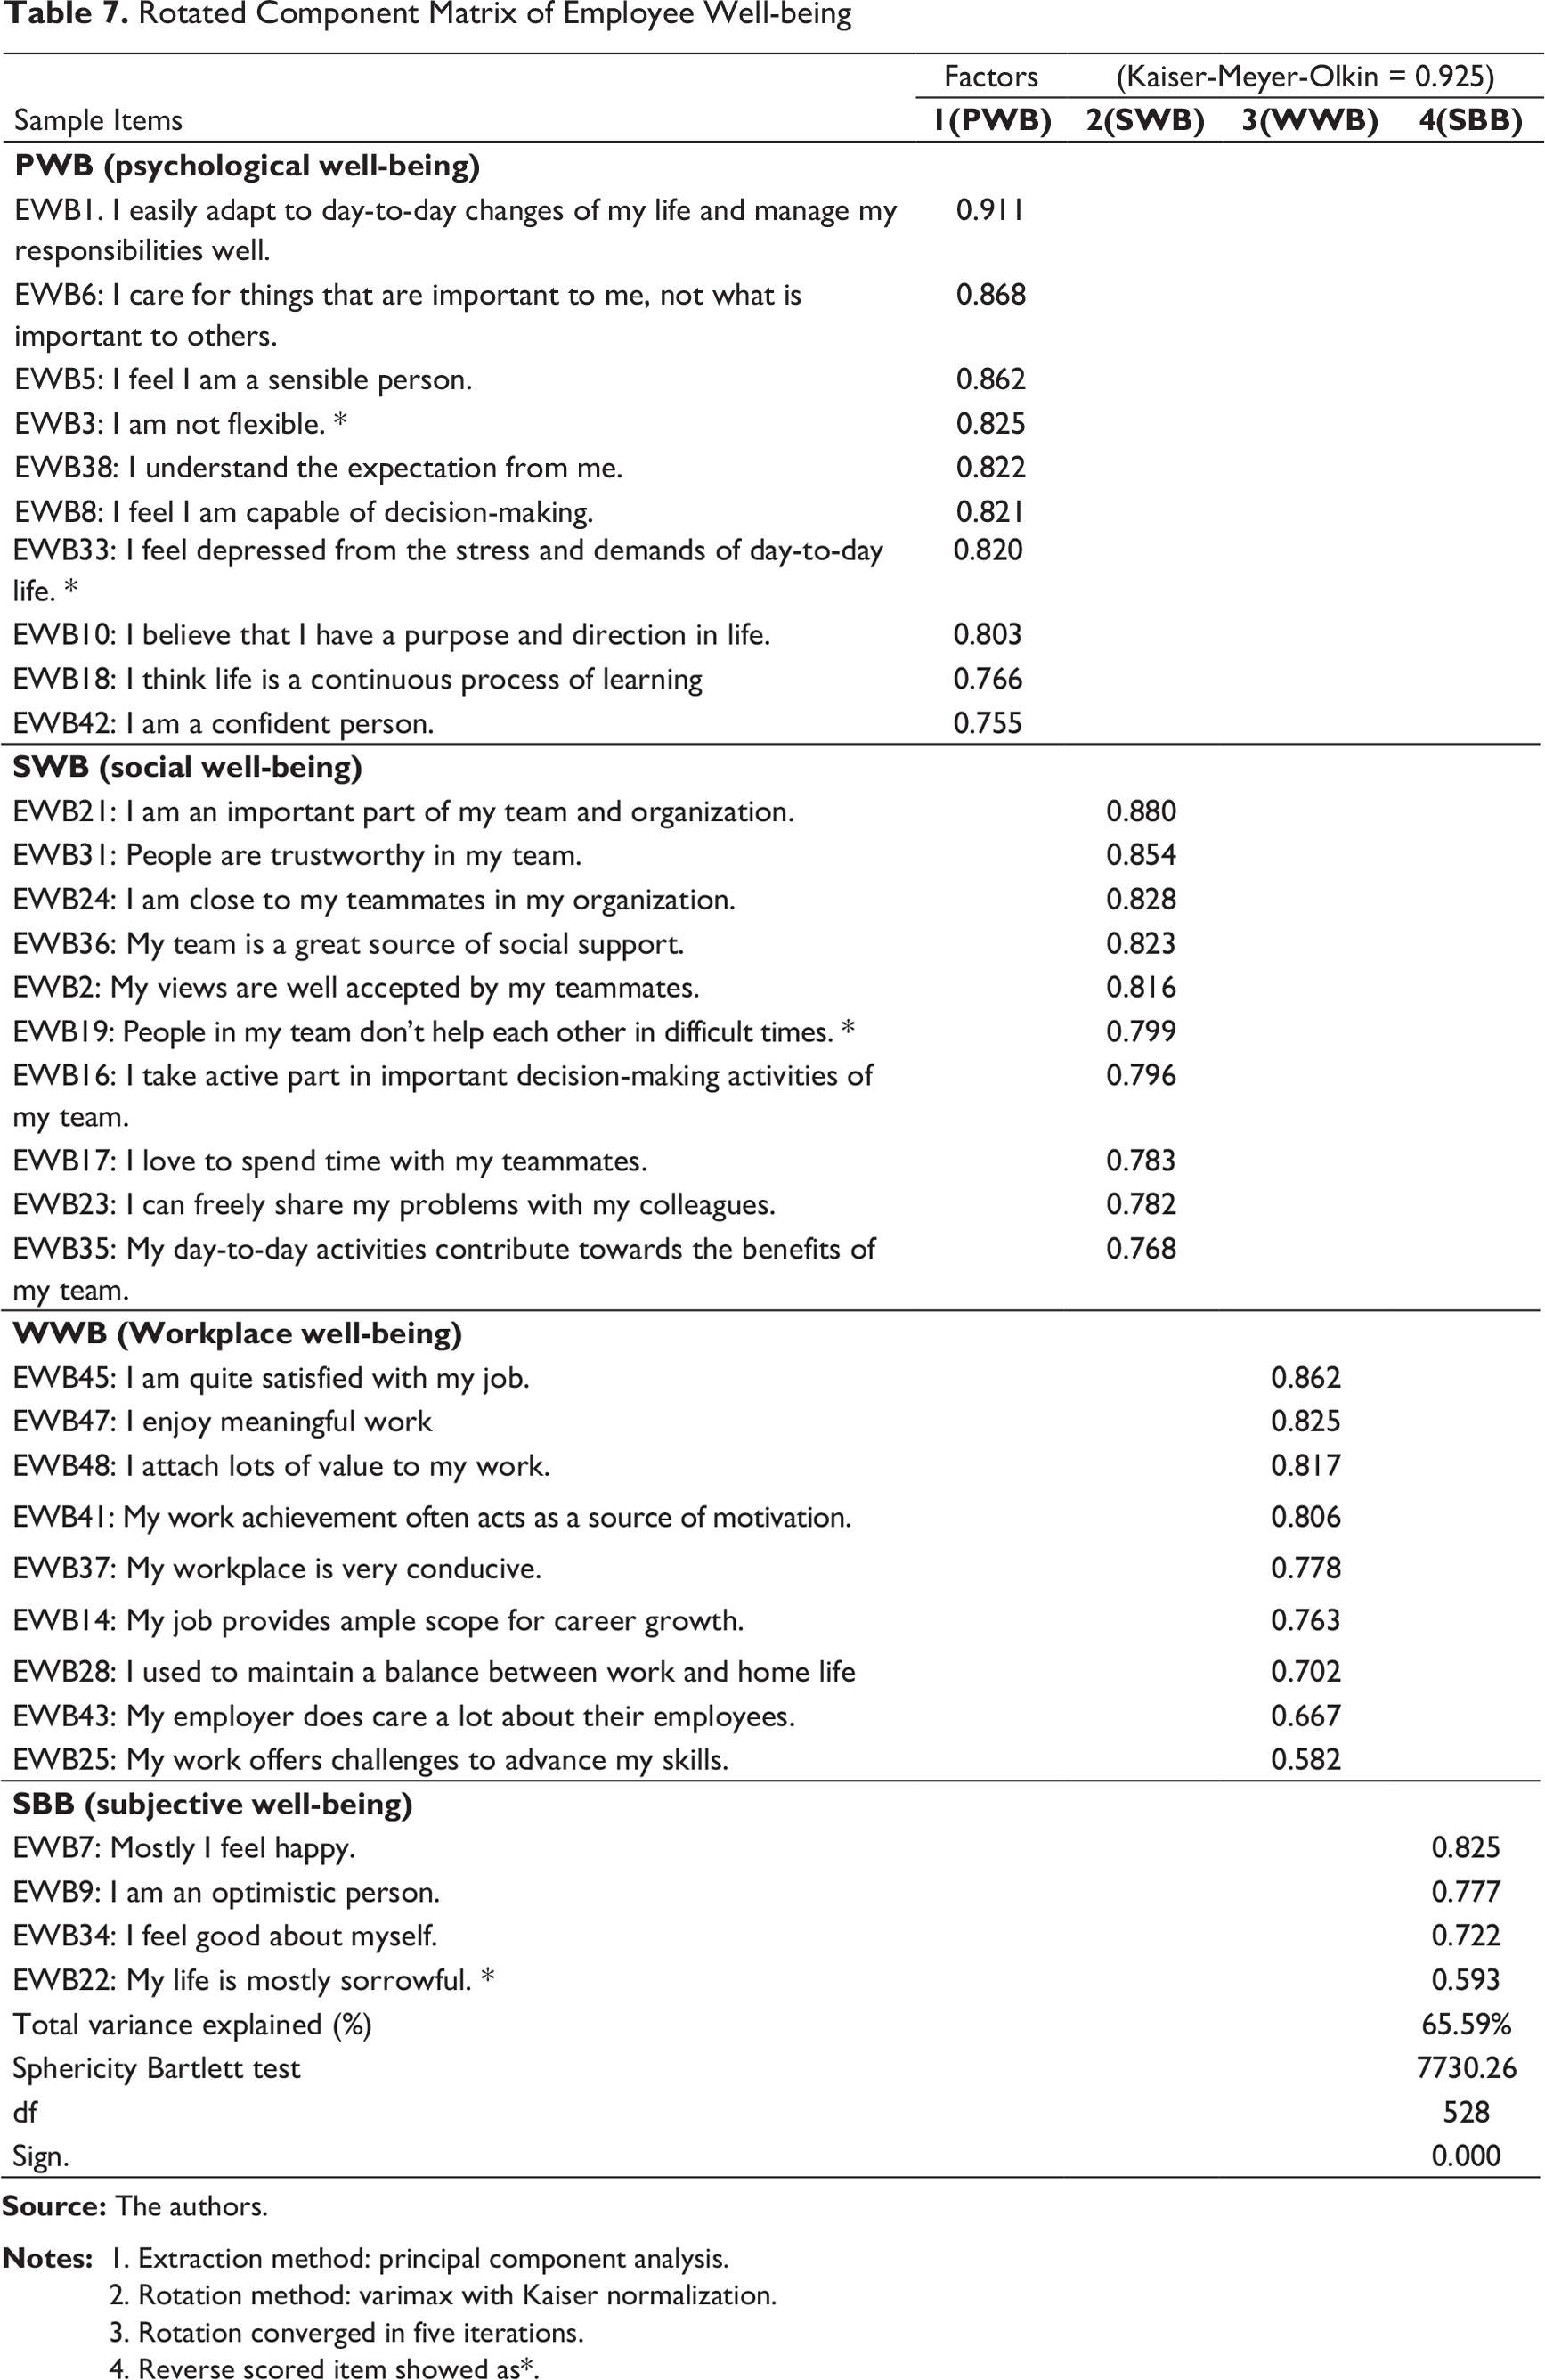
2. Rotation method: varimax with Kaiser normalization.
3. Rotation converged in five iterations.
4. Reverse scored item showed as*.
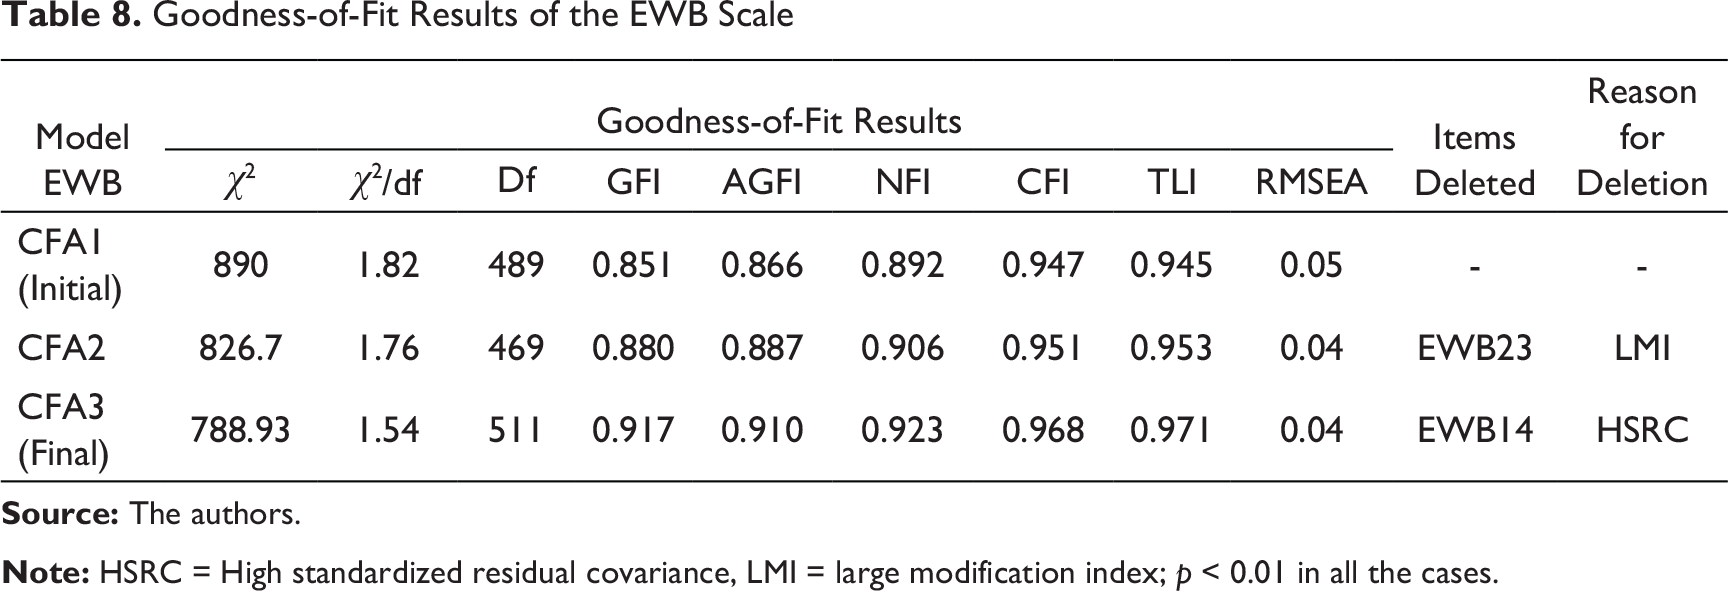
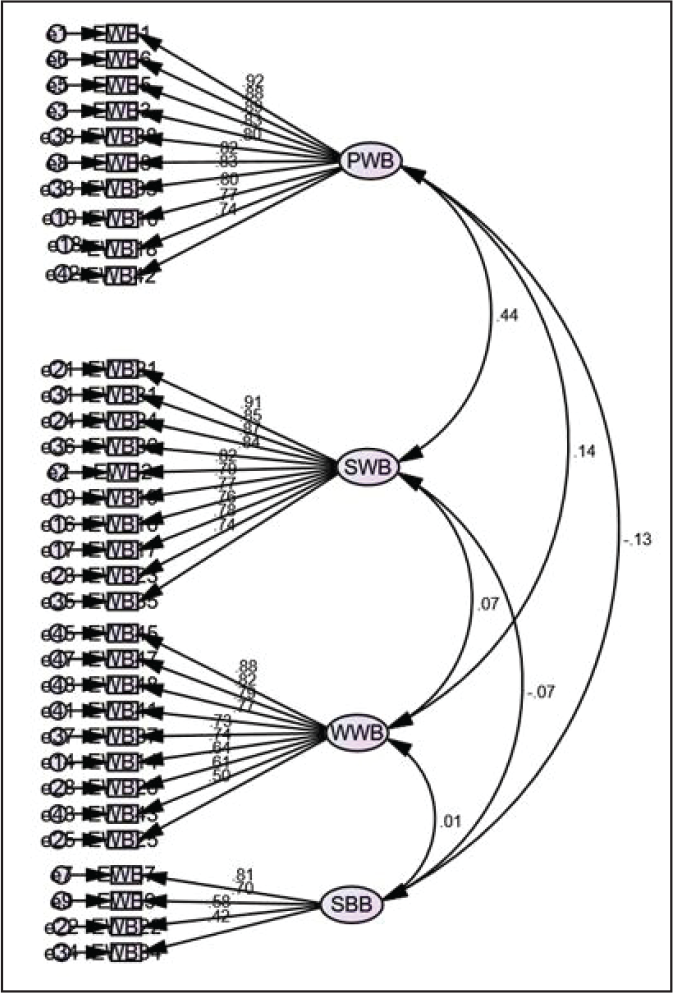
Confirmatory Factor Analysis
Confirmatory factor analysis (CFA) was carried out from the result of EFA and was conducted using AMOS 20. It is a multivariate statistical technique to analyse a structural model and examine multiple and different interrelated relationships associated with the model (Hair et al., 2006). CFA is used to study complex relationships of a model that are not possible with other multivariate techniques. Generally, a model is estimated on the basis of two important parameters, namely, overall goodness of fit and size and interpretability and statistical significance of the model parameter estimates (Hair, Anderson, Tatham, & Black, 1998). The absolute goodness of fit of the models were evaluated using absolute and relative indices (Joreskog & Sorbom, 1998) and were calculated through (a) the χ2 goodness-of-fit statistic, (b) root mean square error of approximation (RMSEA), (c) comparative fit index (CFI), (d) goodness-of-fit index (GFI), (e) Tucker–Lewis index (TLI), (f) adjusted goodness-of-fit index (AGFI) and (g) normed-fit index (NFI).
Although chi-square values were traditionally used to measure the fitness of the model, it has its limitations. Because of its sensitivity to sample size and departures for normality, it has been augmented by additional fit indices like CFI, GFI, TLI and RMSEA to assess the fitness of the model. In the present study, important fit indices such as GFI, AGFI, NFI, CFI, TLI and RMSEA were used to test the postulated model. Absolute fit measures provide the most basic assessment of how well a researcher’s theory fits the sample data. According to the guidelines (Hair et al., 1998; Kline, 2011), a model is considered to be a good fit when RMSEA is close to 0.06, CFI and GFI are higher than 0.90 and TLI and NFI values are close to 0.80.
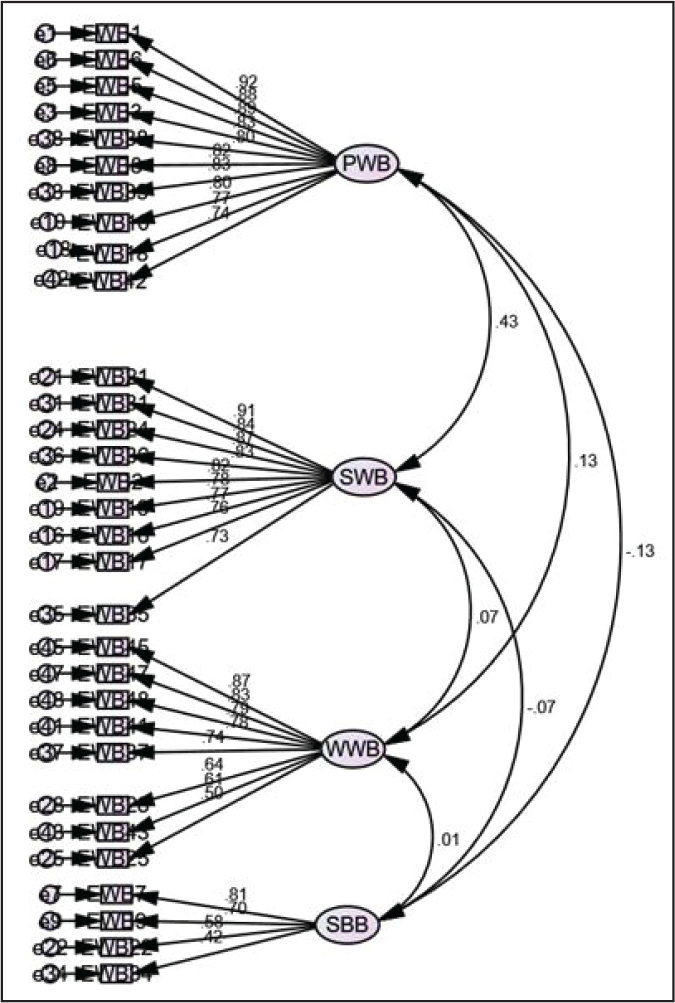
Goodness-of-Fit Results of the EWB Scale
Reliability and Validity Analysis
Test-retest Reliability
Test-retest reliability means that if a respondent is to retake the test under similar conditions, his or her score would remain similar to the previous score (Fletcher & Robinson, 2014). The test-retest reliability of the EWB scale was tested with the sample of 113 employees from the IT industry. Data were collected twice on the same sample (time 1 and time 2) with a time gap of 40 days. The results revealed that the internal consistency scores for the EWB scale for both the occasions were time 1 (α = 0.92) and time 2 (α = 0.93), correspondingly with a mean value of 4.11 and standard deviation of 0.95 for time 1 and a mean value of 4.67 and standard deviation of 0.85 for time 2. The correlation was positively significant between the scores obtained between Time 1 and Time 2 (r = 0.733, p < 0.01). The findings of the study have revealed an acceptable range of test-retest reliability that would be useful for future researches.
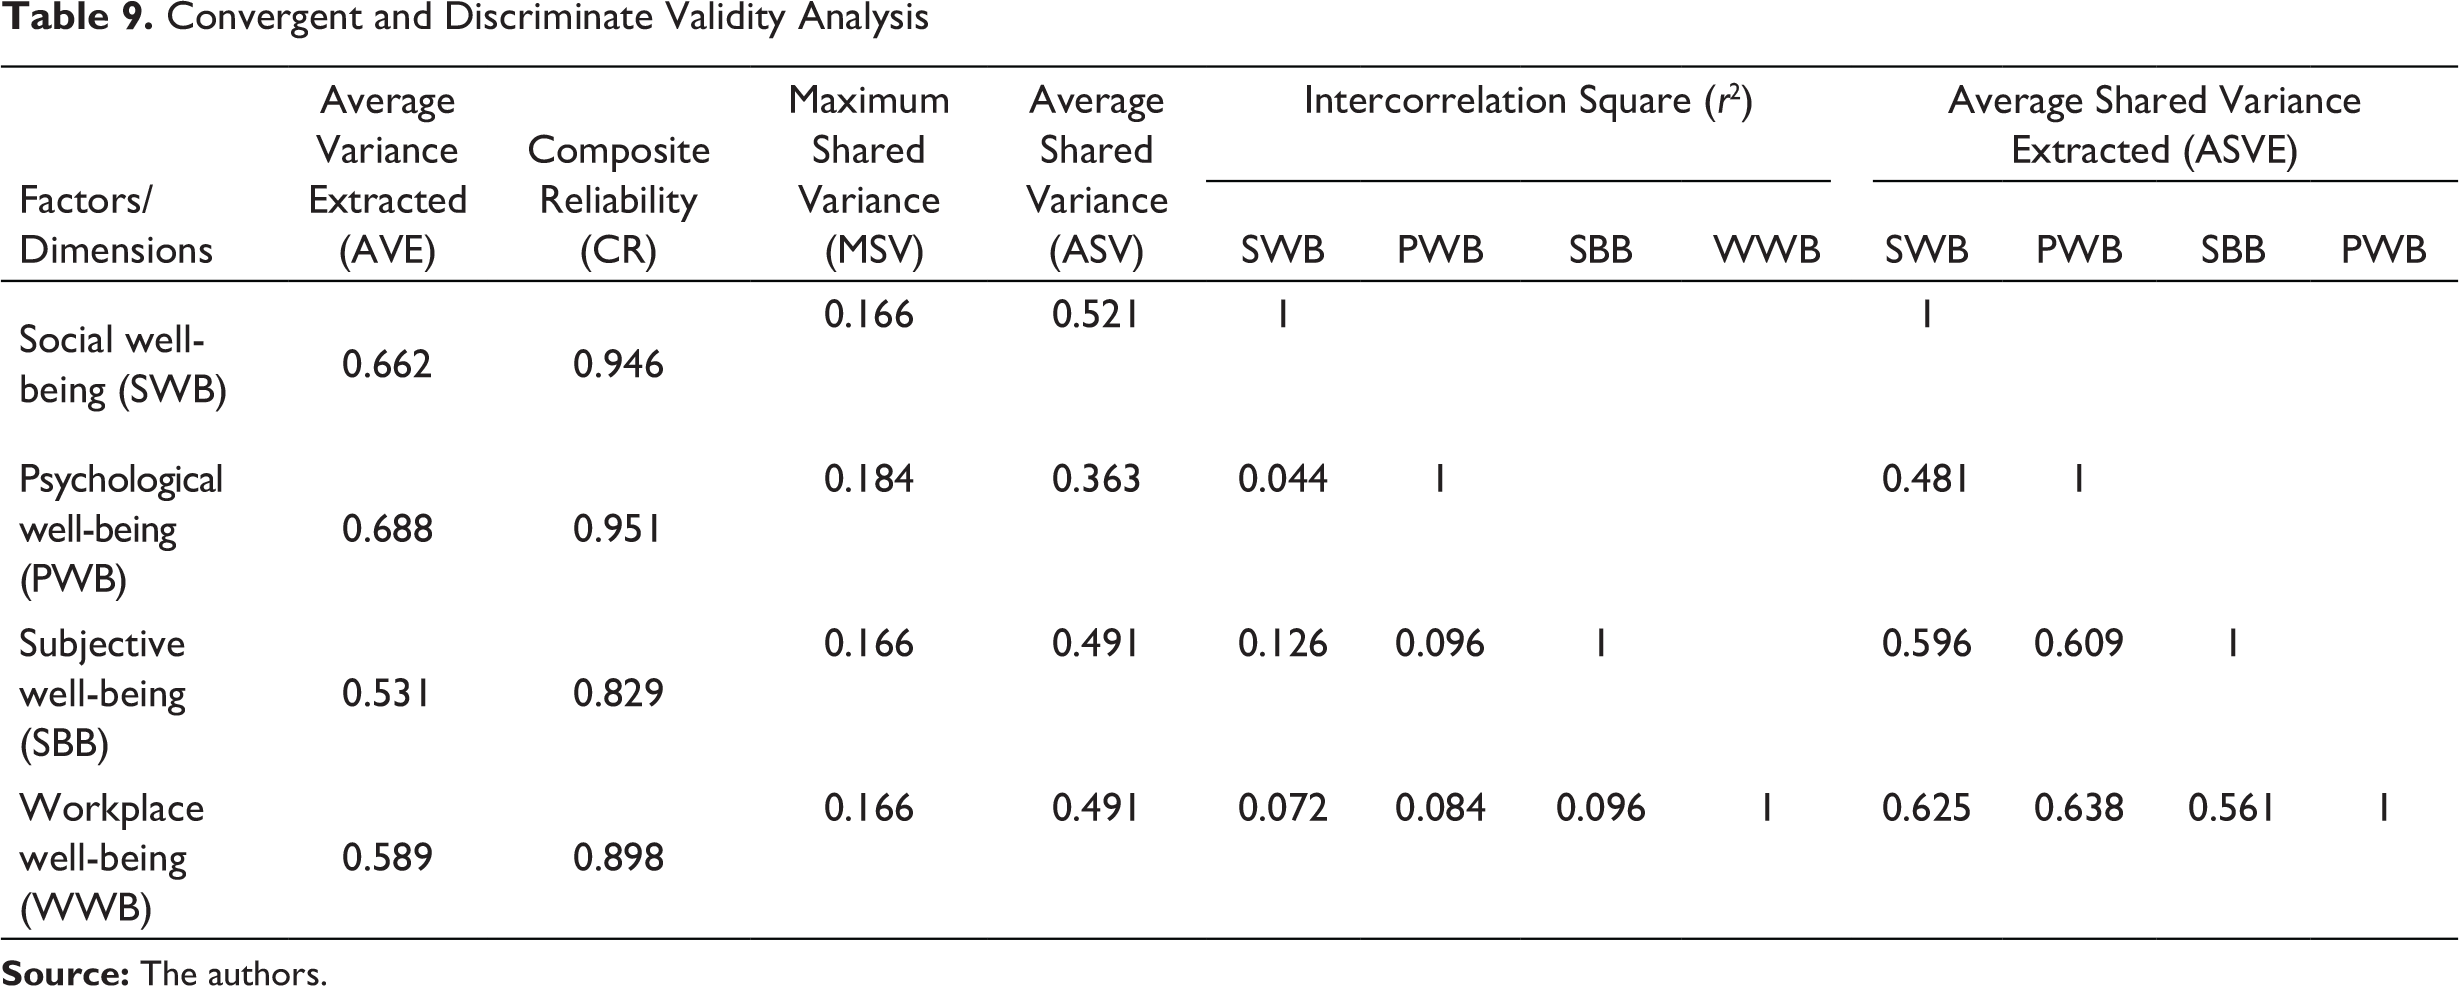
Construct Validity Analysis
Construct validity is defined as the degree to which a set of measured items actually reflects the theoretical latent construct that those items are supposed to measure (Hair et al., 2010). In the present study, construct validity of the employee well-being scale was examined by assessing convergent and discriminant validity. Convergent validity of a scale can be confirmed by two ways, the first one is by examining average variance extracted (AVE) which should be more than 0.50 and the second one is by analysing standardized loading or composite reliability of each dimension, which needs to be greater than 0.70 (Hair et al., 2010). Findings of the present study in Table 9 clearly mention that AVE for each dimension is higher than 0.50 (social well-being = 0.662, PWB = 0.688, SWB = 0.531 and workplace well-being = 0.589) and composite reliability for each dimension is higher than 0.70 (social well-being = 0.946, PWB = 0.951, SWB = 0.892 and workplace well-being = 0.898). Therefore, it can now be stated that the employee well-being scale with 4 dimensions and 31 items possessed convergent validity.
Discriminant validity is used to measure the extent to which the construct of each dimension differs from other dimensions. Discriminant validity of the scale can be confirmed by two methods: first one is that the average shared variance extracted (ASVE) of dimensions needs to be higher than the correlation square between dimensions (r2) as suggested by Hair et al. (2010) and the second one is that all maximum shared variance (MSV) and average shared variance (ASV) values must be less than average variance extracted (AVE). Table 9 clearly shows that both the discriminant validity conditions have been established.
Discussion and Conclusion
Convergent and Discriminate Validity Analysis
Theoretical Contributions
This study has helped to add many new insights to the field of EWB research in India. First, the development of this instrument to measure EWB as part of the study augments the current understanding of the concepts of organizational behaviour in India. A majority of earlier research papers have revolved around antecedents and outcomes of EWB, and all of them utilized diverse scales to measure EWB. Unfortunately, till date, no consensus has been reached on the definition and its constituents and organizations of EWB. In this study, both qualitative and quantitative approaches have been leveraged as described by Page and Vella-Brodrick’s (2009) theoretical model of EWB to scrutinize the structural dimensions of the same. One of the key findings of this study indicates that EWB constitutes four dimensions: PWB, social well-being, workplace well-being and SWB.
Second, this study has also helped to develop a new reliable and valid scientific measurement scale that can be leveraged for any future indigenous Indian organizational behaviour research.
Finally, this study has helped to leverage the existing understanding of EWB in the West and expand its horizons to include the findings in the East. While theoretically a three-dimensional EWB structure had been proposed by Page and Vella-Brodrick (2009), no empirical study has analysed or empirically tested the validity of this theory. The present study is an attempt to explore, expand and enrich the understanding of EWB theories and studies that exist in scientific literature till today.
Practical Implications
The study has a number of implications in terms of practice. First, at the individual level, the EWB scale can serve as an analytical instrument that empowers workforces to keep a track and accomplish their personal well-being and increase work performance. Increasing performance at the workplace is a subject that apart from being central to an organization also lays the groundwork for personal and professional progress. Though some of the researches reveal a positive association between employee well-being and employee performance (Meyer, Stanley, Herscovitch, & Topolnytsky, 2002), the predictive validity of the present tool about employee performance at work will be clear if new research is undertaken in the near future. The new EWB scale may assist individuals to gain a deep intuitive understanding into their personal well-being and helps them make essential alterations to increase it, which in turn may help them to achieve greater heights in terms of work outcomes, such as job performance, job commitment, intent to stay, work-life balance and so on. These need to be verified in future researches.
Additionally, this research brings forth a fresh viewpoint and a precise measurement instrument for leaders to utilize when executing EWB programmes or any wellness programme in their organizations. From the present study it can be inferred that EWB comprises not only job satisfaction but also PWB, social well-being, workplace well-being and SWB as well. This would necessitate the change in the approach of managers to give adequate importance to employees’ mental health and work-life stability, family contentment, emotional fitness and individual growth.
Limitations and Future Recommendations
The present study has certain limitations irrespective of its original contributions. We have not tested the antecedents and consequences of the employee well-being construct. The scale requires further fine-tuning in order to increase its level of reliability and ability to elucidate the variance associated with the constructs they measure in different contexts.
Future research should address the limitations inherent in this first study of the nomological net of employee well-being in the workplace. It must address the generalizability of the scale across different job levels of the organization along with more demographically diverse samples and organizational settings. Also, future studies should expand the study to include multiple cultures and employ different methodologies like focused group discussions and personal interviews. To have a full-proof and verifiable theory on the concept of EWB, various stakeholders and their associated variables need to be recognized in future researches.
Footnotes
Acknowledgements
The authors are grateful to the anonymous referees of the journal for their extremely useful suggestions to improve the quality of the article. Usual disclaimers apply.
Declaration of Conflicting Interests
The authors declared no potential conflicts of interest with respect to the research, authorship and/or publication of this article.
Funding
The authors received no financial support for the research, authorship and/or publication of this article.