
Abstract
After the approval of the Sustainable Development Goals (SDGs) by the United Nations, all the countries have tried to achieve these goals. But unfortunately, the emerging economies are still far away from this ideal track. Because, mostly, the prime focus of emerging economies is just to increase the economic growth, while ignoring its environment-related negative externalities. Following this, the present study highlights the importance of designing the SDG framework for seven emerging (E7) economies, which can be used as a benchmark for other developing and emerging economies. For this purpose, this study uses quantile regression to scrutinize the heterogeneous impact of technological innovation, institutional quality, per capita income, trade openness and population on CO2 emission by using the data of E7 countries from 1996 to 2018. The empirical outcomes confirm that technological innovation and institutional quality have performed a major role in reducing CO2 emissions. Results also reveal that the current patterns of economic growth in E7 countries are environmentally unsustainable. Based on the results, this study suggests a comprehensive policy framework for attaining SDG 8, SDG 9, SDG 16 and SDG13.
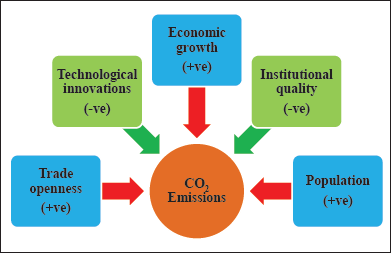
Graphical Abstract
Introduction
From the past few decades, global warming and climate change have become major hindrances in attaining social welfare and sustainable development (United Nations, 2019). Greenhouse gases (GHG) are responsible for ever-increasing CO2 emissions (CO2E) and global warming (Dong et al., 2018), as the global CO2E in 1990 was 21,331 million tons, which reached 34,169 million tons in 2019 (British Petrolium (BP) Statistical Review, 2021). Therefore, the impact of anthropogenic and economic activities on CO2E is becoming an attractive topic for researchers and policymakers (Cohen et al., 2018). In developing economies, the trade-off exists between economic growth (EGR) and environmental quality. As economic activities demand more energy, most of the time, emerging economies meet their energy requirements from fossil fuels, which increase environmental degradation.
Technological innovation (TIN) is one of the primary methods to increase EGR, save resources and impede CO2E through applying sustainable business- and energy-efficient practices (Khan et al., 2020; Razzaq et al., 2021). Saudi et al. (2019) suggest that TIN is considered a key indicator to attain sustainable development. TIN can reduce CO2E by transferring fossil fuel-based technologies into green, renewable and environment-friendly ones (Hopwood et al., 2005). TIN can reduce CO2E through several methods, such as carbon capture technology, the development of electric vehicles, the improvement of energy efficiency and the development of renewable energy (Cheng et al., 2019; Kwon et al., 2017; Salem et al., 2021). TIN can help countries to enhance their environmental quality by improving the production process (Gozgor, 2017). Most of the empirical literature provides evidence that TIN decreases environmental degradation. However, the quality of government institutions plays a vital role in the adoption of green and environment-friendly technologies through administering environment-related rules and regulations.
Government institutions can also reduce environmental pollution through the implementation of policies such as the removal of fossil fuel subsidies, feed-in tariffs and carbon taxing (Anwar et al., 2021a; Wong et al., 2010). Frankel and Romer (1999) proposed that institutions can improve GDP growth and environmental quality through a strong judicial system, better allocation of capital and attracting foreign investment. Better institutions can reduce CO2E through enhanced resource allocation (Dal Bo & Rossi, 2007; Ebeke et al., 2015). Strong institutions are a prerequisite for implementing policies of conversion from fossil fuel-based energy towards green or renewable energy (Mahjabeen et al., 2020). On the other hand, Shah et al. (2019) believe that weak institutions are unable to control the environmental damage, which arises due to the growth process. Consequently, the role of institutional quality (INQ) on environmental degradation needs serious consideration.
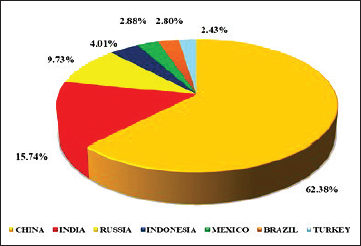
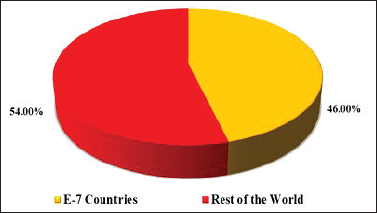
This study investigates some major determinants of CO2E for E7 (Turkey, Indonesia, Mexico, Brazil, Russia, India and China) countries for the period from 1996 to 2018. These seven economies may surpass the Group of Seven—G7 (the USA, the UK, France, Japan, Germany, Italy and Canada) countries till 2032 (Safi et al., 2021). Hence, the primary reason to carry this research on E7 countries was their emerging role in the world economies. Just before the Coronavirus Disease 2019 (COVID-19) pandemic, the total GDP of E7 countries was US$22.377 trillion as compared to US$38.468 trillion (constant US$) of the world’s most advanced G7 countries (World Bank, 2021). The consistent increase in the growth rate of E7 countries is causing a rapid increase in energy consumption, which leads to additional CO2E. The share of E7 countries in total energy consumption was almost 42% in 2018. According to BP-Statistics 2021, the share of E7 economies in global total CO2E is almost 46% as presented in Figure 1, and country wise share of E-7 countries in their total CO2E is presented in Figure 2. Therefore, in this study, we investigate the determinants of CO2E to suggest a comprehensive policy framework for attaining Sustainable Development Goal (SDG)-9, SDG-8, SDG-16 and SDG-13.
The contribution of our study in the existing literature is twofold—first, several studies examined the impact of TIN on CO2E (Govdeli, 2019; Hussain et al., 2020; Tao et al., 2021) but it is very hard to find any study that incorporates the role of INQ in innovation–emission nexus, as INQ has a major role in the adoption of modern technology through the enforcement and implementation of environment-related rules and regulations. Second, this study uses panel quantile regression (QR). This technique has several advantages as compared to classical techniques. For instance, (a) it provides a series of coefficients across the conditional distribution. (b) As compared to traditional mean regression, QR may provide comprehensive statistical outcomes. (c) QR is more suitable in the presence of outliers.
This section discussed the need, importance and background of the study. The second section presents the literature review. The third section discusses the data, model specification and methodology. The fourth section describes the results and discussion. The fifth section provides the conclusion and policy recommendations of the study.
Literature Review
This section is divided into two parts: the first part is about the theoretical development, which discusses the different channels through which macroeconomic indicators affect the environment, whereas the second part presents the empirical literature.
Theoretical Development
Attaining sustainable development has been documented as one of the important agendas across the globe. In addition, the United Nations has also stressed the significance of assuring a sustainable environment along with socio-economic sustainability worldwide. In this study, we tried to address some of the 17 SDGs (Cf, 2015) of the United Nations (e.g., SDG 13, SDG 9, SDG 12, SDG 16 and SDG 8) for suggesting policies to achieve sustainable development, which can safeguard the environment. For this purpose, this study uses the Stochastic Impacts by Regression on Population, Affluence and Technology (STIRPAT) model of Dietz and Rosa (1994). Numerous studies have already used STIRPAT for investigating the association between environmental quality and macroeconomic variables.
Several studies have documented that demand for energy and natural resources increases with the growth in the national output (EGR). Environmentally unfriendly ways are used to meet the increasing demand, eventually causing environmental degradation (Anwar et al., 2021d; Brizga et al., 2013; Farooq et al., 2021). On the other hand, various studies claim that affluent economies can finance technological development, which can increase EGR as well as mitigate environmental deterioration (Khattak et al., 2020). Based on these contrasting outcomes, most researchers claim that the growth–environment relationship is non-linear. This relationship is generally highlighted in the Environmental Kuznets Curve hypothesis of Grossman and Krueger (1991), which proposed that EGR initially increases environmental degradation, but after achieving a certain level of growth, it reduces environmental degradation (Aziz et al., 2020; Jun et al., 2021; Sharif et al., 2020). Thus, green growth policies are essential not only to protect against environmental degradation but are also supportive for the overall well-being of the environment (Ikram et al., 2020).
On the other side, INQ of the countries performs a dominant role in environmental policies. Bernauer and Koubi (2009) have reported that democratic regimes can implement environmental policies in a better way as compared to autocratic countries. Bhattacharya et al. (2017) argued that better institutions can reduce the CO2E through subsidizing green energy and strict implementation of suitable tax (e.g., carbon tax) rates. Nasir et al. (2021) reported that a better institutional framework helps in controlling pollution through formulating effective policies, incentives, regulations and management systems to guide the stakeholders, consumers and industries about renewable energy sources. Padda and Asim (2019) reported that better institutions can help to reduce environmental pollution through efficient allocation of capital, and by monitoring investment and commercial and manufacturing activities.
Moreover, TIN is considered to be a critical factor in mitigating environmental deterioration (Li et al., 2021; Balsalobre-Lorente et al., 2018). Developing economies with limited access to technology are mostly using fossil fuel-based energy, which has become a cause of environmental degradation, while TIN is mitigating environmental degradation through the use of green and environment-friendly energy resources (Ozcan & Ulucak, 2021). Likewise, prior studies have found TIN as one of the most important variables to develop such instruments, which may restrict, control and monitor the use of polluted resources (Murshed, 2021). TIN may also reduce environmental pollution by increasing the level of energy efficiency (Anwar et al., 2021d). Environmental degradation can also be reduced through public awareness regarding sustainable development with the help of TIN (Lai et al., 2017). Moreover, Samargandi (2017) reported that CO2E could be reduced through a major change in production activities with the help of TIN.
Empirical Evidence
Technological Innovations and Emission Nexus
The existing literature regarding TIN and CO2E is an imperative area of study for attaining sustainable development. This literature can be divided into two major parts: first, the role of TIN in promoting green/clean energy development. Second, the role of TIN in reducing the CO2E. TIN plays a key role in the development of green energy (Chen and Lei, 2018). By applying the autoregressive distributed lag (ARDL) technique, Sohag et al. (2015) inspected the influence of TIN, energy usage and CO2E. They claimed that TIN raises energy efficiency, which impedes the use of fossil fuel-based energy and CO2E. Similarly, Lantz and Feng (2006) scrutinized the role of TIN, population (POPU), and EGR on CO2E during the period from 1970to 2000 for Canada. They discovered that technology development impedes CO2E, while POPU and EGR increase CO2E.
Furthermore, considering the data of China from 2000 to 2011, Lin and Wang (2015) reported that TIN and low-carbon investment perform a vital role in reducing CO2E. Meliciani (2000) discovered that investment in TIN improved the environmental quality during the 1973–1993 period for 27 economies. By using ARDL for China from 1995 to 2012, Jin et al. (2017) discovered that technological improvement in the energy sector reduces CO2E. They also suggested that the government should encourage TIN in the energy sector. Mensah et al. (2018) investigated the influence of TIN on CO2E for 28 OECD nations. They discovered that investment in TIN mitigated pollution during the period from 1990 to 2014. Danish et al. (2019) suggested that EGR originates from industrialization, causing an increased use of fossil fuels (natural resources), which increases CO2E. They emphasized that natural resources could be used in a better way with the support of TIN.
According to Cho and Sohn (2018), green TIN is a key source of mitigating the CO2E for the UK, Italy, Germany and France. On the other hand, numerous studies have provided evidence that TIN has a direct inverse relationship with CO2E. For instance, Balsalobre-Lorente et al. (2018) examined the relationship between TIN and CO2E. The study findings supported the argument that TIN mitigates CO2E for European Union (EU) countries during the period from 1985 to 2016.
Institutional Quality and Emission Nexus
There is a dearth of literature in finding the relationship between INQ and environmental deterioration. However, the empirical findings of these studies are inconclusive and have mixed results. Some studies provided a positive association, while some claimed a negative association between INQ and environment. For instance, Zakaria and Bibi (2019) examined the influence of EGR and INQ on CO2E. They claimed that INQ mitigated CO2E for the South Asian economies. The empirical findings of Zhang et al. (2016) found that INQ enhances environmental quality through direct and indirect ways in the case of Asia-Pacific Economic Cooperation (APEC) countries. Abid (2016) stated that democracy, government effectiveness, corruption, and social and political insecurity also impede CO2E. Similarly, Ibrahim and Law (2016) claimed that INQ mitigates CO2E. They even suggested that institutional reforms are very important to gain favourable outcomes regarding the environment. Sarwar and Alsaggaf (2021) scrutinized the influence of governance on CO2E for Saudi Arabia during the period from 1970 to 2018. They found that better governance could impede CO2E. Haldar and Sethi (2021) examined the influence of INQ on CO2E by using the augmented mean group technique. They claimed that the INQ reduced CO2E in 39 developing economies from 1995 to 2017.
On the other hand, Andersson (2018) examined the link between INQ and the environment. After empirical analysis, he found that governance and institutions are liable for environmental deterioration. By using the system generalized method of moments technique during the period from 2002 to 2015, Nguyen et al. (2018) explored the influence of INQ on CO2E for 36 emerging nations. They found that INQ increases economic activities, causing an increase in the CO2E. During the period from 1975 to 2007, Charfeddine and Mrabet (2017) investigated the impact of INQ on the environment for 15 Middle East and North African (MENA) countries. They claimed that INQ raises environmental deterioration. By using the data involving 66 developing countries for the period from 1991 to 2017, empirical results from a study carried out by Azam et al. (2021) found a positive relationship between INQ and CO2E.
From the aforementioned discussion, we conclude that the relationship among technological innovation (TIN), INQ and CO2E is inconclusive and has mixed results. Several studies found a positive link between TIN on CO2E, while few studies claimed a negative association between TIN and CO2E. Similarly, numerous studies provide positive evidence, whereas some studies claim a negative association between INQ and CO2E. On the other hand, most of the aforementioned studies have used linear models, which may provide misleading results when data are not normally distributed. These misleading and inconclusive findings demand further investigation of the relationship between TIN, INQ and CO2E. Therefore, in this study, we re-examine the influence of TIN, INQ, TO, EGR and POPU on CO2E by using the QR, which provides the series of coefficients for a single variable.
Methodology
Data Source and Sample Period
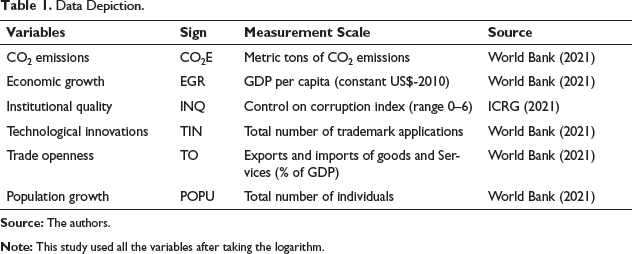
Data Depiction.
Model Specification
Following Chekouri et al. (2020), this study used the log-linear STIRPAT model, which is a stochastic version of the IPAT model (Ozcan & Ulucak, 2021). In the IPAT model, ‘I’ represents the environmental impact, while ‘P’, ‘A’ and ‘T’ represent population, affluence and technology. The model of this study is as follows:

In the aforementioned equation (1) the CO2E (CO2 emissions) is the dependent variable, and the EGR, INQ, TIN, TO (trade openness) and POPU (population) are independent variables. The beta (β) of each variable is used to present the respective coefficient, and the sign of ε presents the error term. The values of i and t present the number of countries and time, respectively. In Equation (1), we are not including the energy consumption-related variable by following the studies of Itkonen (2012), and Jaforullah and King (2017), who suggested that the total effect of income on CO2E will be underestimated if energy consumption is assumed to be a positive linear function of income.
Estimation Technique
Panel Quantile Regression
To identify the indicators of carbon emissions, most of the existing studies have used classical regression techniques like ordinary least square (OLS) (Anwar et al., 2021c), but the outcomes of such techniques are based on the mean value and fail to present the true picture of conditional distribution (Chien et al., 2021). Similarly, most of the time, the data are not normally distributed and contain outliers. In such a situation, those estimations, based on mean value, are unable to provide better outcomes. Therefore, in this study, we used panel QR. This technique provides a series of coefficients of a single indicator according to the nature of data, and it can overcome the issue of heterogeneity and outliers. QR has several advantages over the classical model. It provides a set of coefficients that detect the change in carbon emission due to the variation that occurred in the independent variables (Xu et al., 2017). Moreover, this technique can address those issues that affect the accuracy of the estimations such as unobserved heterogeneity, outliers and heteroscedasticity (Koenker & Hallock, 2001).
The following Equations (2) and (3) present the difference between the panel linear and panel QR models.
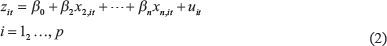
In the above-mentioned panel linear model, t and i depict the time and cross sections, respectively. The coefficient of the linear model is depicted as β, which could be changed in QR.
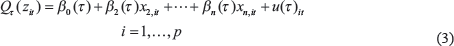
In Equation (3), the coefficients are dependent on the nth quantile.
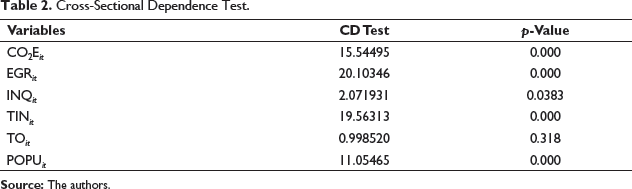
Cross-sectional Dependence Test
Cross-Sectional Dependence Test.
Results and Discussion
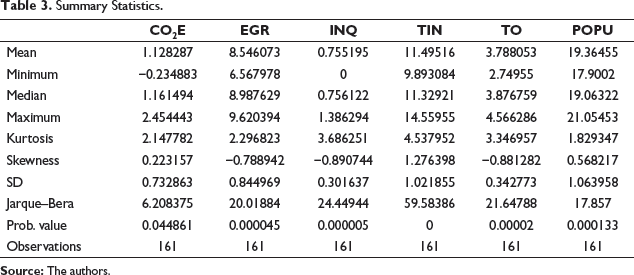
Summary Statistics.
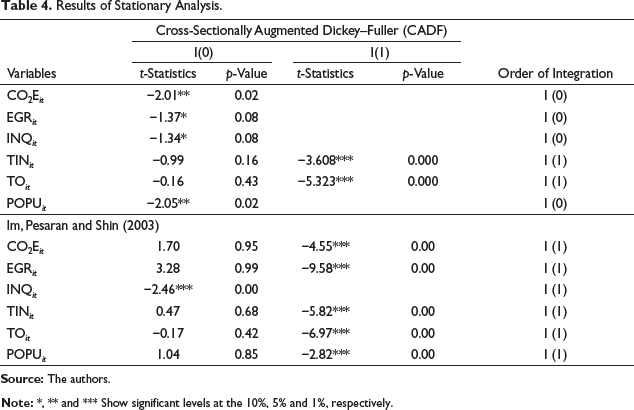
Results of Stationary Analysis.
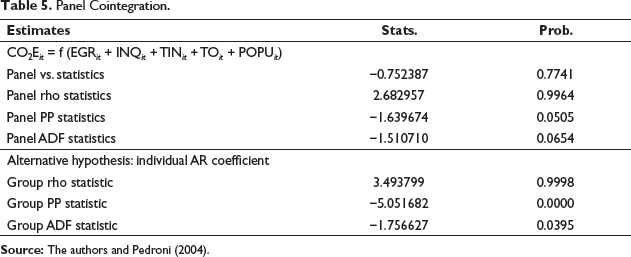
Panel Cointegration.
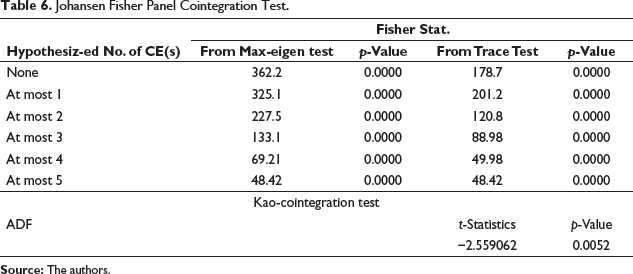
Johansen Fisher Panel Cointegration Test.
Feasible Generalized Least Square.
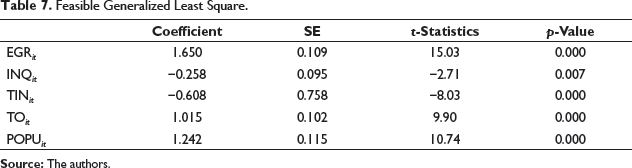
INQ is also a major determinant for mitigating carbon emissions. In the present study, we used the control on the corruption index as a measure for INQ. The outcomes demonstrate that a 1% rise in INQ mitigates CO2E by 0.258%. This result proposes that strengthening the institutions would discourage rent-seeking behaviour; in such a situation, environmental degradation would be reduced. This result is in line with Rizk and Slimane (2018), Tang et al. (2021), and Haldar and Sethi (2021). Similarly, TIN is also useful in reducing environmental pollution. The estimated outcomes verified that a 1% upsurge in TIN impedes CO2E by 0.608%. Therefore, these results advocate in favour of inspiring the E7 countries to the adoption of green energy-based advanced technology, which is environmentally friendly as opposed to outdated fossil fuel-based technologies. This outcome is analogous to the discoveries of Chen and Lei (2018), Omri and Tarek (2020), and Saleem et al. (2020).
Moreover, the TO increases CO2E. A 1% rise in TO increases the CO2E by 1.015%. This result implies that trade liberalization has an adverse influence on the quality of the environment. This result is similar to the findings of Jalil and Feridun (2011), and Mahmood et al. (2019). Finally, population growth also increases environmental pollution in E7 countries. A 1% rise in POPU increases the CO2E by 1.242%. This is understandable as when POPU increases, there is a demand for more infrastructure, leading to an increase in the demand for goods and services, which cause an increased use of fossil fuel-based energy. Thus, it leads to reduced environmental quality.
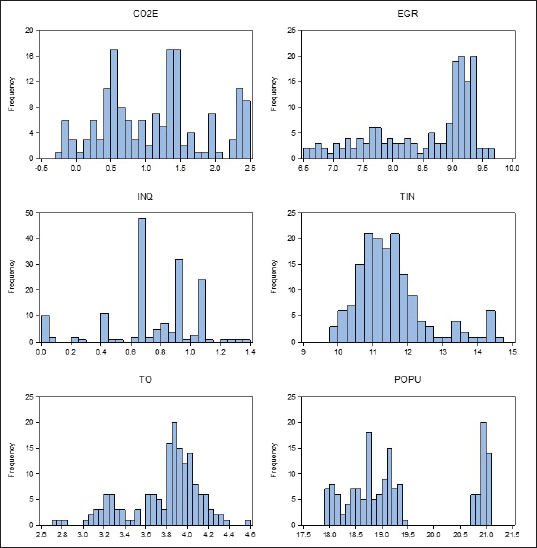
Figure 3 indicates that the data of this study are not normally distributed, and contain outliers; therefore, in this situation, the application of linear regression models may provide misleading outcomes. Thus, to get a true picture of the relationship between the variables, we use QR, which provides the series of coefficient according to the nature of data.
Results of Panel Quantile Estimations.
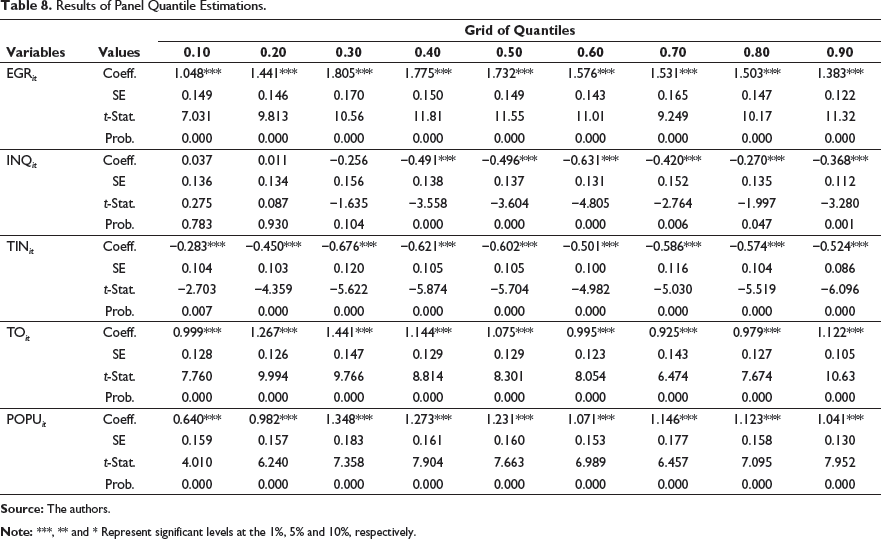
Moreover, POPU upsurges the COE across all quantiles (10th–90th). The demand for goods and services increases with the increase in population, creating pressure on economic activities, and then more energy is used that creates environmental pollution.
Variance Decomposition of CO2E.
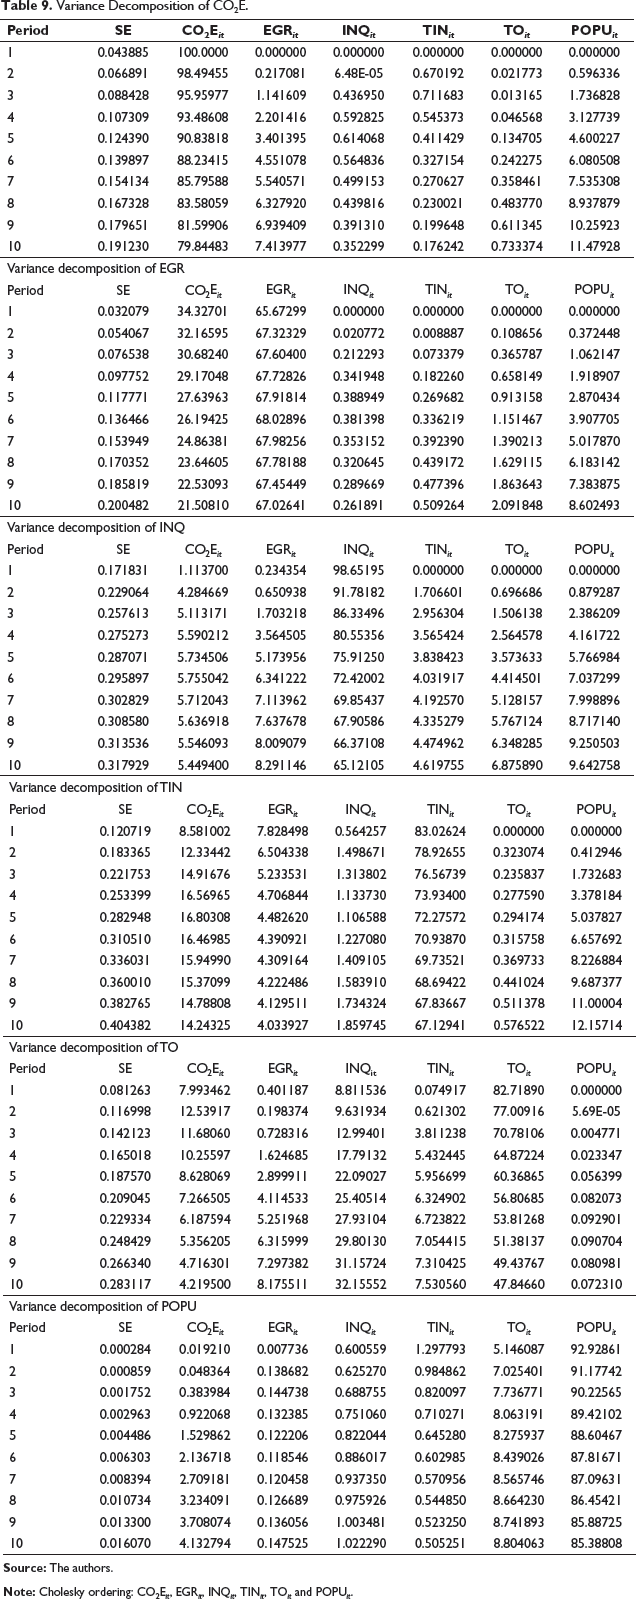
Subsequently confirming the long-term affiliation, we used generalized forms of forecast error variance decomposition method (FEVDM) and impulse response function (IRF). Table 9 presents the outcomes of variance decomposition analysis (VDA), as the change in endogenous variable, due to its own and other variables. CO2E, VDA results show that 75.82% change in CO2E is due to its own shocks, while 7.413%, 0.352%, 0.176%, 0.733% and 11.479% change in CO2E is due to EGR, INQ, TIN, TO and POPU, respectively. Similarly, 67.129% change in TIN is due to its own shocks, while 14.243%, 84.033%, 1.859%, 0.576% and 12.157% are due to CO2E, EGR, INQ, TO and POP, respectively. On the other hand, EGR, INQ, TO and POP are contributed by CO2E as 21.508%, 5.449%, 4.219% and 4.132%, and their contribution is 67.026%, 65.121%, 47.846% and 85.388%, respectively.
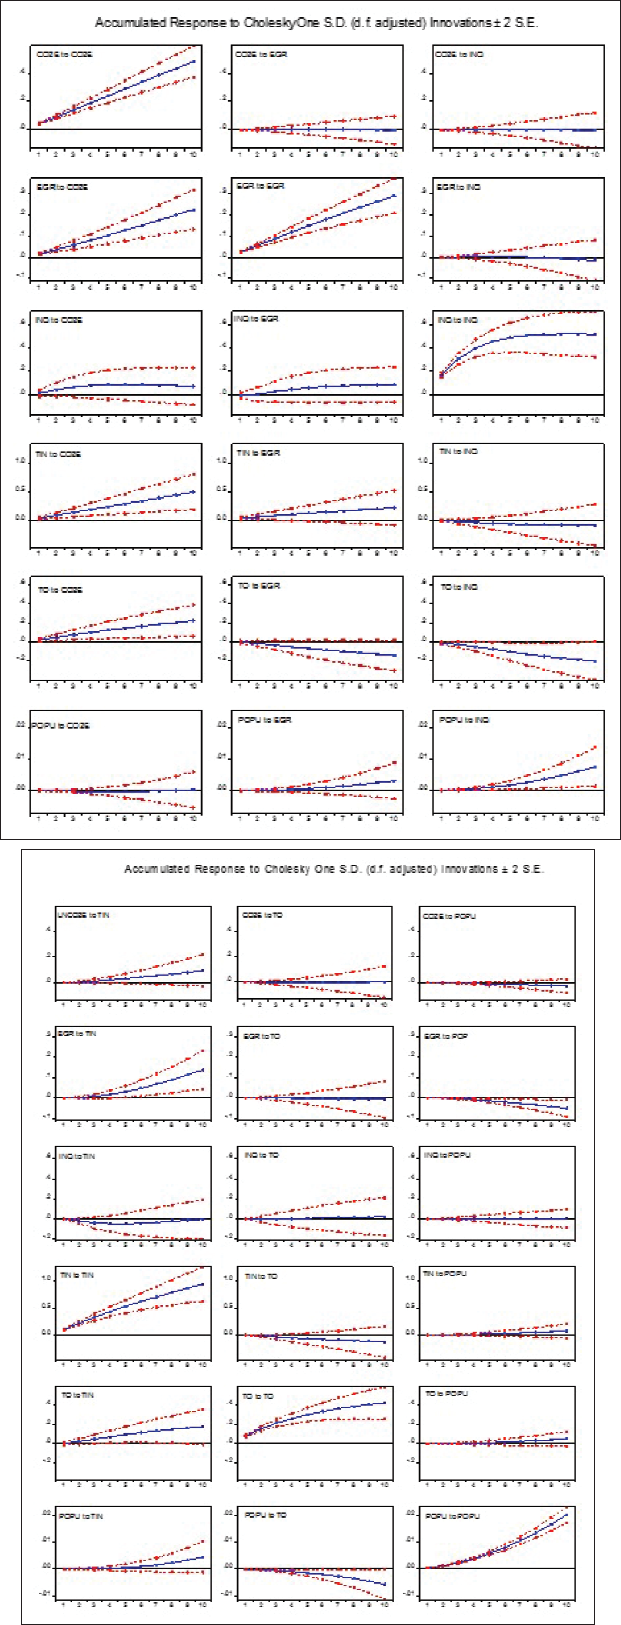
Furthermore, FEVDM results of CO2E, EGR, INQ, TIN, TO and POPU are projected with the help of IRF and presented in Figure 5. The connection between the five primary indicators was binary and measured as an exogenous response among the series of indicators. All these graphs present the same result as we draw from the econometric analysis and show the robustness of our results for a suitable policy. All graphs have presented the response function of numerical FEVDM method findings graphically. The findings of VDA are similar by estimates of the long term, which confirm the robust econometric modelling and findings, which are suitable for policy purposes.
Conclusion and Policy Implications
The present study is a pioneering attempt to reveal the quantile behaviour of the relationship among TIN, INQ and CO2E. In doing so, we used the panel QR on the data set of E7 countries during the period from 1996 to 2018. The findings of this study show that the association between the indicators is quantile-based, and the previously used OLS/ARDL and other linear techniques may provide misleading outcomes. Unlike traditional techniques, panel QR provides a series of coefficients, according to the shocks, which occur in the data. The results demonstrate that EGR, TO and POPU increase carbon emissions, whereas TIN and INQ reduce environmental pollution.
From empirical outcomes, we propose the following policy framework for achieving SDG 8 (EGR), SDG 9 (innovations), SDG 16 (government institutions) and SDG 13 (climate change) for E7 countries.
EGR increases the carbon emission in E7 countries; therefore, these economies must redesign their growth pattern and replace their outdated, polluted and fossil fuel-based technology with advanced and green energy-based technology. TIN reduces carbon emission with more intensity in the low-emission countries and has a smaller effect in high-emission countries. Therefore, the governments of E7 countries should further promote the technological process in their countries by improving the energy efficiency, by carrying out more research and by developing green energy, building such instruments that control or capture the emissions of industries, upgrading production processes and manufacturing hybrid or electric vehicles. The governments of E7 countries should further empower the institutions so that these institutions can implement environment-related policies. If institutions are independent, they can enforce rules and regulations more efficiently with no political pressure. The independent institutions can help to reduce carbon emissions in several ways, such as applying carbon tax on polluting industries, administering polluting industries to adopt advanced technology, granting subsidies on green energy and through efficient allocation of natural resources.
Footnotes
Acknowledgement
The authors are grateful to the anonymous referees of the journal for their extremely useful suggestions to improve the quality of this article. Usual disclaimers apply.
Declaration of Conflicting Interests
The authors declared no potential conflicts of interest with respect to the research, authorship and/or publication of this article.
Funding
The authors received no financial support for the research, authorship and/or publication of this article.