
Abstract
This study explores the role of credit sales in the context of business-to-business marketing using publicly traded firm data from nine developed economies and the panel data methodology. The findings indicate that offering trade credit is not a substitute for traditional marketing; on the contrary, it complements it. As the need for marketing increases, firms offer more trade credit, and this is particularly the case for those with information asymmetry. Finally, liquidity-poor firms rely more on credit sales to support marketing. The findings overall suggest that firms, particularly the ones with information asymmetry, and lack of liquidity, can utilize trade credit in achieving marketing-related goals in a business-to-business setting.
Introduction
Offering trade credit (TC) involves the timely delivery of a product and, in return, delayed receipt of payment. The main goal of this arrangement is to promote sales and profitability by closing, for example, the informational gap between buyers and sellers (Smith, 1987). Buyers, who are not familiar with the quality of the relevant goods, may demand TC before making any payment (Long et al., 1993); in this way, TC functions as a marketing tool used to reduce information asymmetry regarding product quality. Marketing expenses are also incurred to promote sales and profitability; for the same reason, sales are made on credit. While both instruments serve the same goal, the place TC holds in marketing budgets is unclear. Does offering TC complement or substitute for marketing expenses in the presence of information asymmetry? How is the balance between the two affected by a lack of liquidity? Unlike marketing expenses, TC supply can be easily financed via borrowed TC, and this can be an advantage to illiquid firms that rely on TC as an alternative form of financing.
Accordingly, the primary objective of this study is to explore the credit sales–marketing relationship in the presence of information asymmetry. We specifically focus on innovative firms because investment in research and development (R&D) is one of the paths to sustainable competitive advantage (Krishnan et al., 2009). Despite this, many R&D projects involving, for example, new drugs or software programs, are unique to developing parties (Aboody & Lev, 2009), and potential customers can gain little or no information about the new product being developed. Thus, as valuable as an R&D programme is, it significantly contributes to the information asymmetry between buyers and sellers. In order to overcome these issues and maintain a competitive advantage, companies should consider significant investment not only in R&D but also in marketing (Krishnan et al., 2009; Walwyn, 2005). The developer can also offer TC to enable buyers to verify the quality of goods through testing or use before making payment for such (Emery & Nayar, 1998). Not only does this arrangement eliminate informational issues but also gains customer loyalty and strengthens the partnership (Nadiri, 1969).
The empirical investigation consists of two parts, where the aim of the first is to find a reliable answer to the question of how credit sales are related to marketing expenses, that is, whether they replace or support traditional marketing. In achieving this objective, the TC–marketing relationship is explored by paying particular attention to the kind of firms that are more likely to suffer from information asymmetry. Since no data are available on the subject firms’ product lines, the study uses firms’ innovating activities and, for robustness, investment in fixed assets, to examine how the level of TC supply changes in the face of increasing information asymmetry. These firms develop/sell new product(s) and/or add new customers to their existing portfolios; thus, both R&D and capacity expansion efforts through investment in fixed assets are likely to give rise to information asymmetry because of which marketing becomes more important. On the other hand, buyers with a lack of knowledge as to the quality of the new product might demand TC to verify that what they are buying satisfies their expectations. Traditional marketing and offering TC are, clearly, not interchangeable, and therefore, firms increase the supply of TC in association with marketing need as a conceivable attempt to overcome information asymmetry.
Firms carry sizeable trade-related assets (accounts receivable) and liabilities (accounts payable) on their balance sheets, and management of these components provide an opportunity for them to manage liquidity by requesting more credit sales from partners, by delaying payments on their existing debt obligations or by requiring timely payments on their receivables (Amberg et al., 2016). Accordingly, TC’s role as a source of liquidity has been the subject of considerable attention in the literature (e.g., Cunat, 2007; Garcia-Appendini & Montoriel-Garriga, 2013; Martinez-Sola et al., 2014, to name but a few). Findings presented in these studies suggest that small and/or illiquid firms are offered access to TC in times of need. Thus, TC from suppliers provides firms that lack liquidity with a chance to use it in support of marketing operations. Yet, this issue, to the best of our knowledge, has not been explored in the previous literature. Identifying the nature of the TC–marketing relationship in these firms could thus demonstrate the extent to which TC can be used to pursue marketing-related goals.
Hence, the second part of the analysis considers two important facts related to variables of interest: while marketing expenditure requires cash outflow, credit sales of a firm can be financed via credit purchases. Therefore, the focus is directed towards firms that lack liquidity, measured via their levels of cash. For the purpose of robustness, firms’ short-term investments and their 2-year averages are also used. The importance of this focus group comes from their need for liquidity and, in return, the availability of TC being offered to them. The empirical evidence confirms this intuition revealing that as the need for marketing increases, liquidity-poor firms also increase their supply of TC.
The liquidity–TC relationship (Deloof & Jegers, 1996; Garcia-Appendini & Montoriel-Garriga, 2013; Karakoç, 2022) and demand for supplier financing during the recent financial crisis (Carbó-Valverde et al., 2016; Kestens et al., 2012; McGuinnes et al., 2018) have been examined, which indicate that firms rely on TC from suppliers to compensate for their lack of liquidity. The ways that borrowed TC is used, however, are not explored in these studies; this implies the need for studies considering marketing–TC supply in liquidity-poor firms and to demonstrate that they use TC to finance their supply and thus support marketing activities, as will be attempted herein.
This study contributes to the literature in the following ways:
The primary goal of a marketing programme in a firm is to achieve customer loyalty and reap its rewards, for example, increased sales and profitability, and firms spend billions of dollars on marketing each year (Watson et al., 2015). Considering the cost and return involved, the subject is clearly paramount to a firm’s success and yet studies focusing on TC’s role from a marketing perspective are rare. One such early study is the one carried out by Smith (1987), who suggested offering TC serves to satisfy buyers’ concerns about product quality. Her proposals were tested by Long et al. (1993) and Deloof and Jegers (1996), who found that information asymmetry between buyers and sellers results in the supply of additional TC. Both studies approach TC as a marketing tool and are the closest to ours. They do not, however, investigate its relation to traditional marketing. They use several measures of information asymmetry such as a firm’s size, longer production cycle and goods where product quality is difficult to ascertain. By contrast, this article uses firms’ investing activities as proxies and establishes a link between traditional marketing and TC offering and reveals that TC helps in working towards the goals set forth for marketing by bridging the gap between partners and allowing for significant savings in cost to illiquid firms. Furthermore, they test their hypotheses utilizing single-country data, whereas we use multiple countries, which shed additional light on the robustness of the results. Finally, we show that TC–marketing relationship is influenced by the level of liquidity, which is not considered previously. Hence, the study contributes to this line of research, demonstrating that TC is offered as a part of marketing strategy, and information asymmetry increases the importance of that role.
The study is also closely linked to the branch of TC literature that focuses on the motivations behind TC supply. It has been argued that TC is offered to receive financial gain from otherwise idle funds (Emery, 1984), to reduce volatility in demand (Emery, 1987), to enhance partnerships (Smith, 1987), to price discriminate against buyers (Brennan et al., 1988) and to eliminate informational issues between buyers and sellers (Nadiri, 1969; Smith, 1987). Particularly, from the seller’s perspective, none of the arguments put forward have gained relative support and indeed are subject to serious criticism. They mostly rely on imperfections in capital markets (Long et al., 1993) and fail to offer a complete and satisfying explanation for the widespread use of TC (Bastos & Pindado, 2007). One avenue, however, seems to be promising, which is considered a strategic tool that can be used to promote sales and enhance partnerships, yet the literature on this issue remains very thin.
This study is composed of five sections. The second section provides a brief review of the related empirical and theoretical work in the literature. The third section introduces the data and the methodology. In the fourth section, the empirical findings are discussed, and the fifth section concludes the study.
Literature Review and Hypothesis Development
Similar to traditional marketing strategies, TC policies are designed to serve the goal of maximizing corporate value. For example, TC is offered to reduce volatility in sales. Readjusting production capacity, which is a result of long-term planning and analysis, to accommodate an unexpected decline in demand would be a costly operation and inefficient response. Instead, firms can pass along the excess inventory to customers and stimulate sales by offering TC (Emery, 1987).
Nadiri (1969) defines TC supply as advertising, a marketing expense incurred to promote sales and to expand market share. Similarly, Smith (1987) argues that providing buyers a timely delivery of merchandise while agreeing to delayed payment constitutes a form of warranty whose goal is to reassure them that a product is of high quality. Long et al. (1993) claim that information asymmetry is a more serious problem for small firms and firms with high-technology products. Therefore, these firms tend to supply more TC for longer durations to establish trust. The purchase of goods and services requires an agreement between the seller and the buyer. The terms and conditions of such agreements describing the quality of product cannot be verified at the time of sale. For example, buyers may not be able to reveal the quality they are promised before the product is used for some time. The seller that lacks reputation for reliability and is confident that the product is of high quality offers delayed payment as a warranty on the quality (Emery & Nayar, 1998). Deloof and Jegers (1996) explored these arguments using data from Belgian small and medium enterprises (SMEs) and found supportive results. Bastos and Pindado (2007) approached the subject from a similar angle and also pointed to information asymmetry as the underlying reason behind the supply of more TC from small and less profitable firms.
Allowing buyers to check the quality of a product and then making a payment are actually about the undertakings given to them prior to the purchase. If buyers are not satisfied with a product, they can refuse to make payment. The lower the quality, the higher the cash discount for early payment will hence be the difference between taking immediate payment, and the credit is the cost of that warranty (Lee & Stove, 1993). By extending TC, the product is offered in the form of a free sample whose price is to be paid at a later date. This constitutes a chance for buyers to observe and experience the quality of the product, thus resolving any potential information asymmetry between buyers and sellers. This discussion leads to hypothesis I.
Schwartz (1974) suggests that firms with a strong access to financial resources can finance their business partners with weak access by offering them TC. Empirical evidence seems to support this proposition, for example, small financially constrained firms tend to receive more TC from their suppliers (see Atanasova & Wilson, 2003; Bastos & Pindado, 2007; Blazenkoa & Vandezande, 2003; Nilsen, 2002) in times of contraction. In a TC arrangement, firms only deal with business partners that share common long-term interests, which makes it preferable in times of need instead of borrowing from a bank (Danielson & Scott, 2004). Essentially, what will become a source of liquidity for the borrower is inventory that requires liquidation with or without a manufacturing process. Accordingly, there is a strong correlation between receivables and payables (Carvalho & Schiozer, 2015). In other words, firms tend to finance credit sales via credit purchases without exhausting their own resources. This suggests that firms that can borrow from their suppliers have a tool under their belt and may be inclined to use it to accomplish marketing objectives. That is to say, the availability of the resources may motivate firms to offer TC or to spend on marketing because marketing expenditure requires cash, whereas TC can be financed via borrowed TC, which is a valuable advantage for firms that lack liquidity.
As mentioned in the first section, the –level of liquidity and access to bank financing are important determinants of how much TC to borrow, which comes in the form of inventory that needs to be liquidated before it can be put to use. Hence, liquidity-poor firms may prefer to manage that borrowed inventory with due consideration for their marketing policies.
Data and Methodology
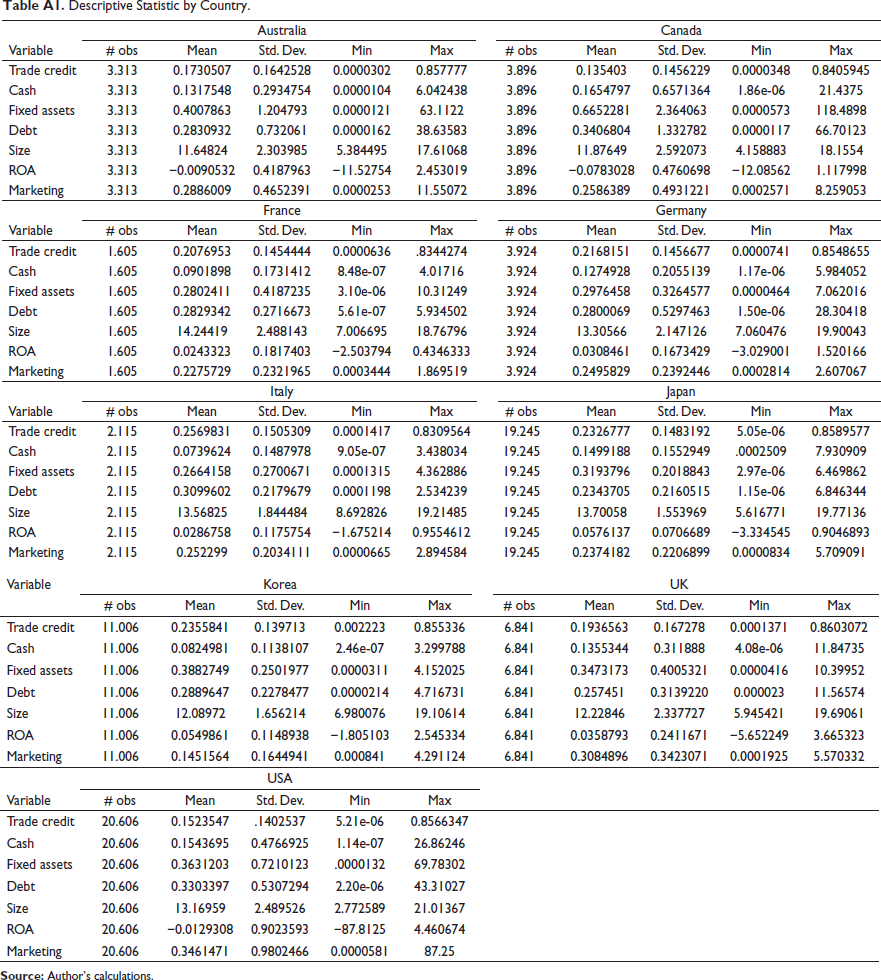
This study uses non-financial corporate data from DataStream. The firms 1 in the sample are publicly traded, relatively large and based in advanced economies (see Table A1. in the Appendix for the full list of countries). The sample countries have established and reliable legal systems, which, in the USA, the UK, Canada and Australia, are rooted in English common law, whereas, in Germany and Japan, are built upon the German civil code (La Porta et al., 1997). This particular choice is relevant because a reliable legal system protects creditor rights and affects firms’ financing decisions (Demirgüç-Kunt & Levine, 2004).
The sample period covers 2000–2014 and includes the recent global financial crisis. The severity of this period was mostly experienced by the advanced economies in this sample. The 2008 crisis can be considered an exogenous shock to firms’ financial sources as it affected both internal revenues and external credit channels. The majority of developed economies ended the 2008–2009 period showing a negative growth. In addition, financial intuitions were at the centre of the crisis, and hence, regular lending activities were hindered. If TC can be integrated into a marketing strategy in the absence of liquidity, this period should be suitable to explore that connection.
An interesting characteristic that is unique to each country in the sample is their cultural features, which were studied by Ghoul and Zeng (2016). They considered a cultural index that assigns values based on power distance, masculinity/femininity, collectivism/individualism and uncertainty avoidance. Korea and Japan received the highest scores for collectivism, uncertainty avoidance, power distance and masculinity in the sample, whereas the lowest scores were obtained by the USA and the UK; the remaining countries were placed in between. The authors report that these cultural values affect how firms do business and thus their tendency to provide and demand TC.
The initial data set contained 441,263 observations. In handling the data, cut-off points for the extreme values are determined to be 2% at each end of the variables. Next, balance sheet variables such as tangible assets, cash and debt—after being scaled to total assets—were kept within an upper bound of 1and a lower bound of 0. Third, negative sales, negative total assets and firms with less than four observations were eliminated. With regard to a firm’s exit and entry, no rule was enforced to prevent selection bias. This process resulted in an unbalanced panel data of 8,017 firms and 72,551 firm-year observations. In order to minimize loss of observation, a second data set for sales-scaled variables was created following the same procedure, which contained the data for 7,694 firms and 69,719 observations. Table 1 presents the means of the variables used in the analysis.
Means of Variables.
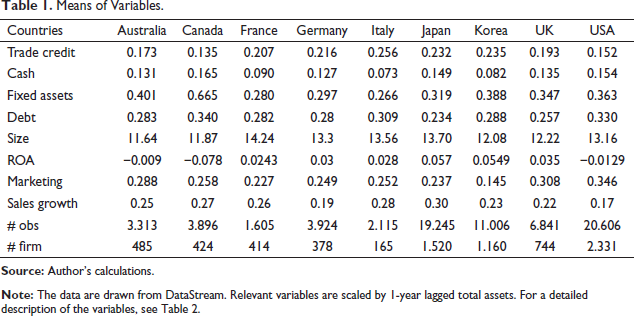
The sample includes a large number of small, medium and large firms. This variation in size and age will inevitably be reflected in their market power, access to TC, liquidity and marketing strategy, creating heterogeneity in the key variables and making it suitable to test the hypotheses of the study. The regression equations and variables are presented in Equation 1.

Here,
Variable Descriptions.
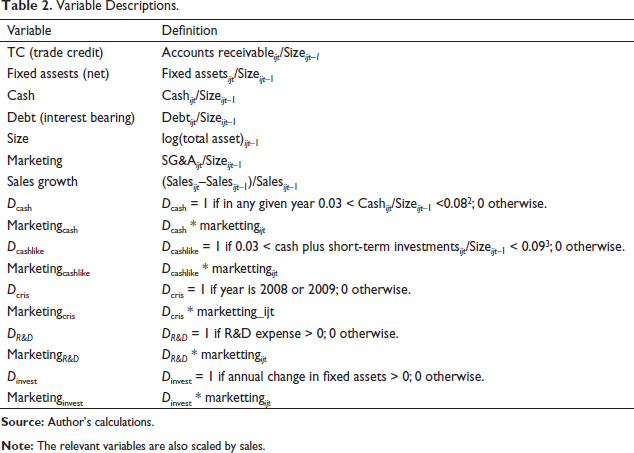
SGA&E includes a range of management-related expenses such as salaries and benefits for executives, rents and utilities and thus might be considered a noisy variable; however, marketing- and advertising-related expenses comprise a significant portion of such, and it is the only variable that is commonly reported in scholarly databases like Compustat and Datastream, and it has naturally been used in previous studies (see Ptok et al., 2018 for a list of studies that benefits SGA&E as a proxy for marketing expenditures). While Ptok et al. (2018) consider SGA&E to be a proxy for individual marketing components like advertising, and promotional- and selling-related costs, Markovitch et al. (2020) state that it can validly represent total marketing effort.
In Equation 1,
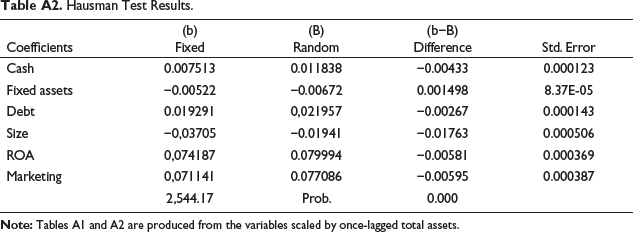
All regressions include a constant and a time dummy variable. Unit fixed-effects panel regression was determined to represent the appropriate methodology based on the Hausman test results (see Table A2), which indicates that random-effects analysis leads to biased coefficients due to a correlation between explanatory variables and residuals that include unobserved elements (Brooks, 2014, pp. 537–546). Although random-effects panel data are known for producing efficient/minimized standard errors for coefficients, time-invariant variables may correlate with explanatory variables, which biases the coefficient. Thus, fixed-effects panel data regression, which automatically removes time-invariant and unobserved characteristics, was chosen as the main methodology. Furthermore, considering variation across firms stemming from, for example, age, size, level of liquidity and the macro-level fluctuations that occur over time, fixed effects would be a better approach to investigating the relationship.
An important concern with regard to the residuals is the presence of heteroscedasticity and autocorrelation; while the coefficients are still unbiased, they can result in inefficiency, affecting the standard errors. Corporate financial data are relatively more entangled and more persistent, and they are, hence, likely to be affected by autocorrelation. Therefore, all regression analyses are run in Stata with the ‘robust’ option, which produces robust standard errors (StataCorp, 2019, pp. 455–456).
Empirical Findings
Trade Credit and Marketing Relationship in the Presence of Asymmetric Information
The first part of the analysis concentrates on identifying how credit sales are related to marketing in the presence of asymmetric information. The findings in the first (last) four columns of Table 3 are produced from the variables scaled by assets (sales). In previous studies, TC is generally scaled to either size or sales. In some cases, as in Long et al. (1993) and Deloof and Jegers (1996), days sales outstanding (DSO) and the length of time credit that have been outstanding have also been used. They argue that discovering the quality of a product whose production process takes a long time also demands a longer time for evaluation, and the extension in the payment period allows buyers to thus make this determination. Adopting a similar procedure allows for comparability. Another advantage of having variables scaled by sales is that by taking the product of the coefficient for the marketing variable and 365, one can easily calculate the number of additional days TC is offered as a response to a one-unit increase in marketing need. 4
Marketing Expense and Credit Sales.
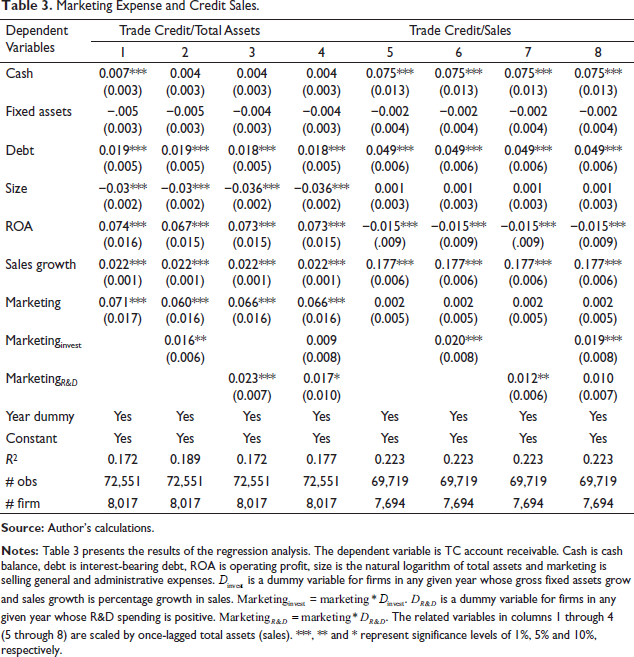
Robust standard errors are given in parentheses. A positive and significant coefficient of marketing variable would indicate that TC supply increases linearly with the need for marketing. The coefficients for marketing expense,
In the absence of an elaborate information on firms’ product lines, the validity of this proposal can be pursued by focusing on firms that are likely to face higher levels of asymmetric information, which can be remedied by making sales on credit (Nadiri, 1969; Smith, 1987). In previous studies, a number of proxies have been used to demonstrate how TC assists in the presence of information asymmetry. For example, Long et al. (1993) employed asset turnover ratio for longer production time and small size for a lack of reputation and technological products, arguing that if production time is longer, then it must be difficult to reveal true quality at the time of purchase. Deloof and Jegers (1993) used work-in-progress inventory/sales as a proxy for production time. Unfortunately, the data available to this study lacked detailed information on the nature of goods and services offered by the subject firms, and the measures used in the previous studies are clearly noisy as they reflect, in addition, other attributes of a firm. An appropriate measure should be more precise and reflect the buyers’ lack of knowledge of the product they are buying. Accordingly, two groups of firms that fall into these categories are determined. They may require greater marketing effort to overcome informational issues related to their goods and services. The first group of firms engage in the process of product development, that is, R&D positive firms. A dummy variable,
Similar results are also obtained for R&D investing firms. The coefficients for
Trade Credit and Marketing Expenditures in a Shortage of Liquidity
The substitutionary role of TC has been widely recognized in the literature. The empirical evidence indicates that firms take advantage of suppliers financing in critical times such as the recent 2008 crisis (Kestens et al., 2012), the currency crisis of the early 2000s (Bastos & Pindado, 2013) and times when financial intuitions have been reluctant to lend or firms experienced a lack of liquidity (Atanasova & Wilson, 2003; Cunat, 2007). Firms already lacking short-term funds and/or with limited access to bank loans are likely to receive support from their business partners in the form of TC. This leads to the question of whether firms with information asymmetry, in the absence of sufficient liquidity, use TC to achieve their marketing-related goals. To find an answer to this question, the relationship is investigated by focusing on the firms with a shortage of liquidity and the 2008 crisis period.
Illiquid firms are determined via their cash levels (see Garcia-Appendini & Montoriol-Garriga, 2013; Islam et al., 2022, for a similar procedure). Firms that were only able to maintain a level of cash below the median of 8% but above 3% of total assets are identified via a dummy variable,
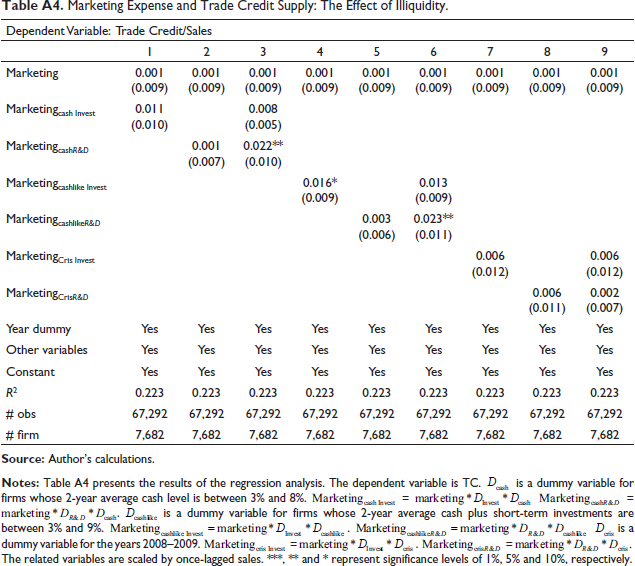
Marketing Expense and Trade Credit Supply: The Effect of Illiquidity.
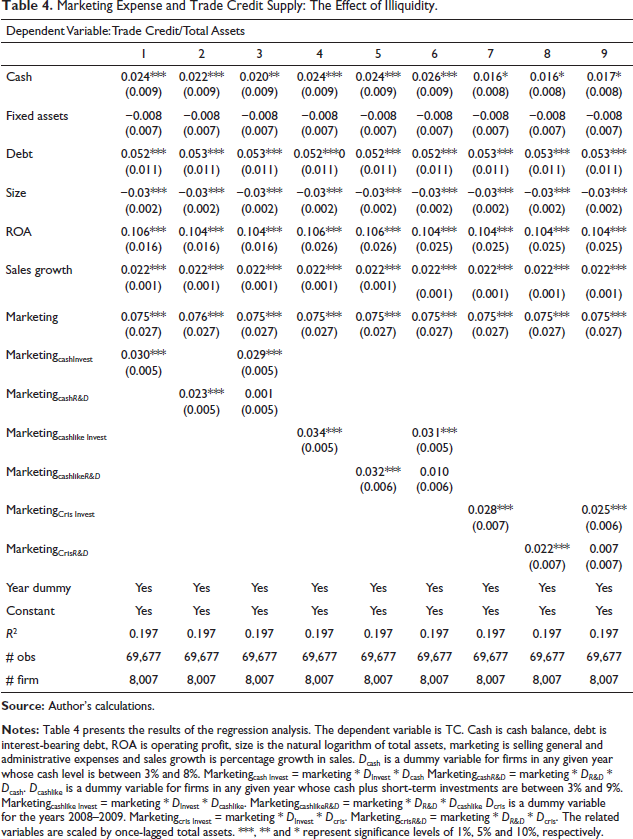
Firms with a level of cash and similar assets of between 0% and 3% of total assets are excluded because they are likely to be in a dire need of support from suppliers and thus demand credit to make up for the shortage, that is, they are likely to demand as much TC, and indeed extension for that credit, as they possibly can. It would also be difficult for them to offer TC under similar relaxed terms to their customers due to their urgent need for liquidity. Hence, it is clear that they suffer from a shortage of funds, but they are unlikely to offer the TC they receive from their suppliers to their customers to manage marketing operations. The related results obtained with total asset-scaled (sales-scaled) variables are presented in Tables 4 and 5.
The role of liquidity in determining TC policies is emphasized in a number of studies like Deloof and Jegers (1996) and Garcia-Appendini and Montoriol-Garriga (2013). Their findings are in line with the general conception that liquidity-(rich)-poor firms may demand (supply) additional TC. However, borrowed TC comes in the form of inventory, and it is only natural that liquidity-poor firms increase their supply to liquidate inventory that has previously been borrowed. For example, Afrifa et al. (2020) demonstrate that firms reduce high levels of inventory by increasing credit sales. As the cost of maintaining borrowed inventory increases, firms make more sales on credit to shift that cost to buyers (Bougheas et al., 2008). Accordingly, there exists a strong balance between accounts payable and receivable (Afrifa & Gyapong, 2017).
One important question at this point is whether firms take advantage of their access to supplier financing to achieve goals related to marketing. In other words, in the absence of liquidity, do they use TC to manage their marketing operations by offering such to their customers? The answer to this question is sought via the interaction of the dummy variables for liquidity-poor firms with marketing expenses. The first interaction variable,
The other information asymmetry variables that interact with marketing and low-liquidity dummies,
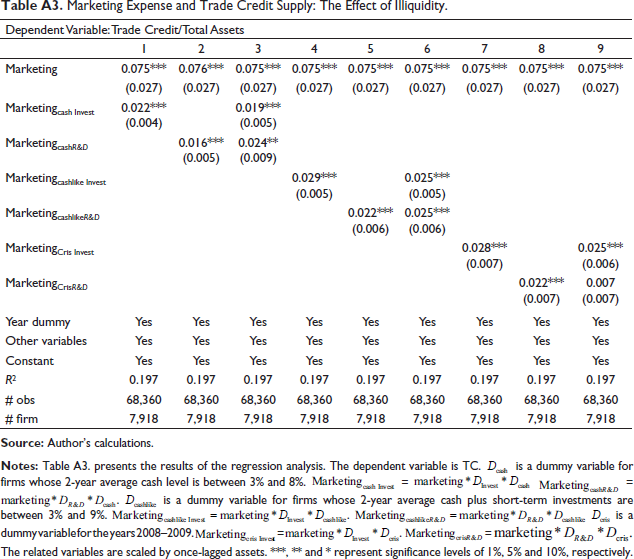
Alternative measures are used in the literature to identify firms that rely on TC as a source of liquidity. Fisman and Love (2003), for example, argue that the gap between cash flow and capital expenditure reflects firms’ propensity to use TC. Elliehausen and Wolken (1993) state that firms that carry a large amount of short-term debt financing require higher levels of liquidity in financing operations and hence are more likely to be dependent on TC as an alternative source of funding. Nilsen (2002) shows that asset size is an important determinant in the choice of financing, and small firms demand more TC due to a lack of access to bank financing. Garcia-Appendini and Montoriol-Garriga (2013) use the level of cash to identify illiquid firms that demand TC from suppliers for financing purposes. We also use cash and cash-like assets to measure the level of liquid assets at firms’ disposal because traditional marketing requires cash spending, which, by definition, these firms lack, and yet they have access to TC from their suppliers. A valid concern, however, namely whether the current levels of cash and cash-like assets reflect firms’ liquidity position throughout the year, should be addressed. Alternatively, we use the 2-year average of cash and other liquid assets, following the same procedure described earlier. 5 The results are presented in Tables A3 and A4 in the Appendix section. The findings in Table A3 provide strong support for the conclusion drawn earlier. The coefficients for the key variables increase in statistical significance, whereas the findings in Tables A4, where variables are scaled by sales, do not indicate a noteworthy increase in the duration of credit offered to buyers in response to asymmetric information. Nevertheless, the relevant coefficients are still positive and consistent with the findings from Tables 4 and 5. These results further increase our confidence that firms that are in the process of launching new products make more sales on credit to alleviate the adverse effects of information asymmetry.
Trade Credit and Marketing Expenditures in 2008 Crisis
The economies that compose the sample of this study were severely affected by the 2008 crisis, during which not only regular lending channels but also internal revenues were severely affected. TC helped to ensure the survival of the corporate sector (see McGuinnes et al., 2018). Accordingly, a number of studies have examined the role of TC during similar periods (e.g., see Bastos & Pindado, 2013; Carbó-Valverde et al., 2016; Garcia-Appendini & Montroel-Garriga, 2013). Thus, the period constitutes an exogenous shock to levels of liquidity, creating an opportunity to explore the relationship at a macro-setting. The results of this exercise imply the role of TC in marketing during a contractionary period and provide robustness to the findings related to liquidity-poor firms.
The crisis interaction variables,
Marketing Expense and Trade Credit Supply: The Effect of Illiquidity.
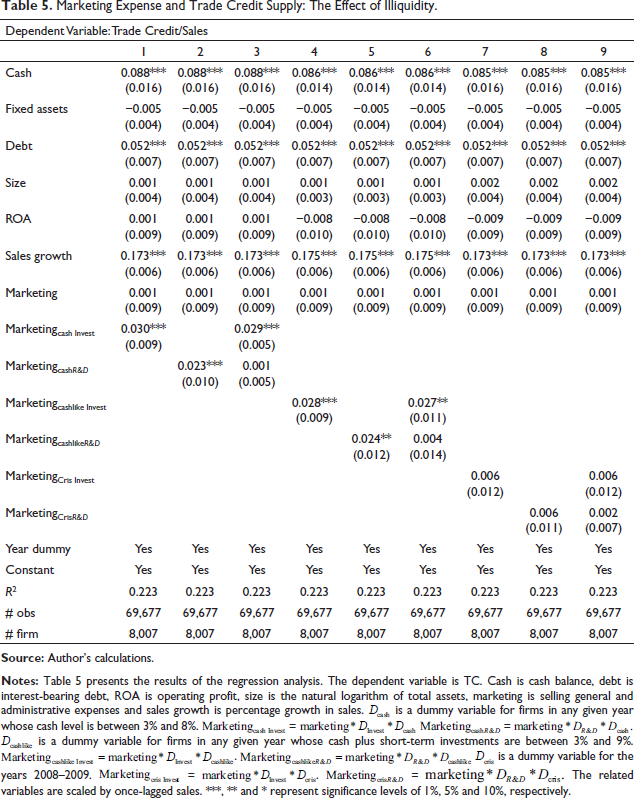
Unlike financial institutions, business partners hold an informational advantage, that is, they are well informed about one another’s growth prospects, investment activities and possibly product development projects (e.g., see Agostino & Trivieri, 2014; Biais & Gollier, 1997). If one of the firms that lacks the sufficient funding displays signs of noteworthy growth, it will likely receive support from suppliers in the form of TC because, technically, every unit that the borrower sells can be considered as sales made by the supplier. In the current case, both physical and R&D investment activities are valid indicators of future growth and attract suppliers’ support, allowing them to increase their own supply of TC to reduce information symmetry. Furthermore, firms expand their market share by investing, which naturally adds to their market power. According to Fabbri and Klapper (2008) and Demir and Javorcik (2018), in a TC arrangement, the party that has more market power dominates the partnership, receiving more favourable treatment, which is usually in the form of a larger discount or greater portion of sales made on credit for a longer duration. Clearly, by offering the support needed by a firm that lacks liquidity yet invests to grow, the supplier actually invests in the future of that partnership (Cunat, 2007). On the other hand, the borrower that obtained the support it requested from the supplier will have the liquidity to finance the sales made on credit without exhausting its own funds, which may themselves already be running low. Hence, the relationship benefits both parties.
Conclusion
Despite the wide coverage of TC literature, how it functions within the context of business-to-business marketing has not, to date, received sufficient attention. This study aimed to contribute to the literature by focusing on this omission through an analysis of the data of publicly traded firms from multiple economies. First, we examined the relationship between TC and marketing budgets of firms, which revealed how firms deploy TC in support of traditional marketing. Our findings indicated that the more a firm spends on marketing, the more TC it offers to its business partners. Next, the presence of a positive correlation between the two leads to examination of how the relationship evolves when firms suffer from asymmetric information and shortage of liquidity, given that when firms suffer from lack of liquidity, they can finance TC supply via borrowing TC from their suppliers, and it is used to reduce information asymmetry. To obtain robust results, we used alternative measures of key variables and empirical specifications. For example, the balance of cash account, the balance of cash and cash equivalents, and their 2-year averages were used as measures of liquidity. Findings strongly indicated to firms’ intensifying reliance on TC to promote their goods and services in the absence of liquidity.
Finally, the relationship was examined in times of global financial crisis, and because financial institutions were at the centre of a rather chaotic process (Garcia-Appendini & Montoriel-Garriga, 2013), borrowing rates declined considerably both in the USA (Ivashina & Scharfstein, 2010) and across Europe (Kestens et al., 2012). Therefore, the 2008 crisis can be considered an exogenous shock to firms’ levels of liquidity and to their access to bank financing. The empirical analysis revealed that TC supply and marketing expenses moved in tandem during those times. It is very likely that increasing TC activity with the lack of traditional financing led to an increased supply of TC as a part of firms’ marketing strategies. This result not only provided robustness to findings in cases of liquidity-poor firms but also introduced a new dimension to the relationship.
For information asymmetry, we used both R&D and physical capacity investments. Furthermore, the variables used in the empirical analysis were scaled by both total assets and sales and both specifications yielded consistent results. The study concluded that TC was supplied to support traditional marketing and, as the need for marketing increased with information asymmetry, firms supplied additional TC for longer durations.
From a practical standpoint, the conclusion of this study has important managerial implications. It shows that TC can be used as an instrument to support marketing activities. While advertising is about convincing customers of a product by providing information about it, offering TC allows buyers to gain first-hand experience and actually verify that information for themselves. Hence, while they are not interchangeable, TC can alleviate the need for marketing due to asymmetric information. Managers can consider employing TC to achieve marketing-related goals in the absence of liquidity. Unlike financial institutions, business partners share a common goal of doing business together (see Cunat, 2007; Garcia-Appendini & Montoriel-Garriga, 2013). Therefore, sellers are often willing to supply TC in times of partners’ need, which can be used to support marketing activities when firms have to deal with a lack of liquidity or have limited access to bank financing.
Appendix
Descriptive Statistic by Country.
Hausman Test Results.
Marketing Expense and Trade Credit Supply: The Effect of Illiquidity.
Marketing Expense and Trade Credit Supply: The Effect of Illiquidity.
Footnotes
Declaration of Conflicting Interests
The author declared no potential conflicts of interest with respect to the research, authorship and/or publication of this article.
Funding
The author received no financial support for the research, authorship and/or publication of this article.