






Abstract
The study investigated the causal nexus between innovations and economic growth of Brazil, Russia, India, China and South Africa (BRICS) countries using panel data for the period 2004–2019. The total number of patent applications, the total number of trademark applications and percentages share of research and development expenditures to GDP are used as a proxy to measure innovations. The study used a panel regression with a fixed and random effect model, panel vector autoregression (VAR) model and impulse response function for the analysis. Further, the study checked both the symmetric and asymmetric impacts of innovations on economic growth using the panel autoregressive distributed lag (ARDL) model. The results from different econometric approaches are consistent and found that innovations positively and significantly impact economic growth. The results have also shown that there is a unidirectional causality running from innovations to per capita GDP in the short run. Finally, the results have shown the asymmetric causal linkage between innovations and economic growth. The study suggests that policymakers must encourage more investments in innovations for high economic growth in BRICS countries.
Keywords
Introduction
Factors of economic growth have always intrigued economists and researchers for a long time and different researchers have contributed different factors of growth in their studies. The time period and the countries under consideration for the purpose of study are different for different studies. Researchers and economists have suggested multiple economic and non-economic factors of growth. Before going into details, it is important to mention a few prominent studies which have talked about various factors contributing to the economic growth of different countries.
The advocates of exogenous growth theories Domer (1946) and Solow (1956) argue that capital accumulation and technological progress are the main drivers of economic growth. The proponents of endogenous growth theories such as Romer (1986), Lucas (1988) and Mankiw et al. (1992) argue that knowledge, innovation, human capital and research and development (R&D) are the main components of economic growth.
Numerous other researchers, including Schumpeter (1932), Coad et al. (2016), Hausman and Johnston (2014), Agenor and Neanidis (2015), Fan (2011), Grossman and Helpman (1994), and Hudson and Minea (2013) have also identified innovation as a major factor promoting economic growth.
The term innovation has been described in several different meanings and researchers have used different proxy variables to quantify the level of innovation in the country. Previous studies have commonly used R&D (Schmookler, 1966), technical knowledge (Teece, 1986), counts of the number of patents (Ahuja & Katila, 2001), information and communication technologies (ICT) (Buabeng-Andoh & Yidana, 2015; Charles & Issifu, 2015), level of R&D expenditures (Pece et al., 2015), number of patents granted in one million people (Li & Wei, 2021) and so on to compute innovation. Some other studies have used the global innovation index ranking score for the measurement of the innovation capabilities of a country (Khedhaouria & Thurik, 2017). The study conducted by Malik (2019) to identify the macroeconomic determinants of innovation for selected Asian countries used the total number of patent applications per capita to quantify innovation.
Several recent studies have used combinations of factors to quantify innovation in addition to utilizing a single variable to indicate innovation. The most popular combination of variables that researchers most frequently utilized is the total number of patents per thousand population, and the number of researchers in R&D activities per thousand population (Maradana et al., 2019), R&D, trademark and patent (Greenhalgh et al., 2004; Gyedu et al., 2021; Sandner, 2009; Vuckovic, 2016), total real R&D expenditure in the country as a ratio to the GDP and the actual number of patents granted (Hasan & Tucci, 2010), and so on.
The most common variables used by researchers to quantify economic growth are real GDP per capita (Best et al., 2017 ; Bhattarai et al., 2021; Ho et al., 2018; Li & Wei, 2021; Maitra, 2016) and real GDP (Bilbao-Osorio & Rodríguez-Pose, 2004; Maradana et al., 2019; Pece et al., 2015).
Innovation has taken centre stage in the era of the knowledge economy, where it is essential for sustaining superior performance, gaining a competitive edge, advancing the economy and, most crucially, generating economic growth (Sesay et al., 2018). The role of innovation as a driver of economic progress, advancement and technological superiority has been studied in both developed and developing countries (Franco & de Oliveira, 2017).
As mentioned above, several empirical studies have been conducted to study the relationship between innovation and economic growth considering the different groups of countries, regions and time periods such as Hasan and Tucci (2010) for a group of 58 countries for the period 1980 –2003; Fan (2011) for China and India during the period 1981 –2004; Petrariu et al. (2013) for Central and Eastern European (CEE) countries covering the period 1996–2010; Pece et al. (2019) for CEE countries including Poland, Czech Republic and Hungary; Maradana et al. (2019) for European Economic Area (EEA) countries for the period 1989–2014; and Gyedu et al. (2021) for G7 and Brazil, Russia, India, China and South Africa (BRICS) countries for the period 2000 –2017. There are a lot of scopes to study the role of innovation in the economic progress of BRICS countries using the time series data. The scope of this study is to examine the causal relationship between innovation and economic growth of BRICS countries for the period 2004 –2019.
BRICS countries are considered as the most powerful bloc of developing nations spread over 29.3% of the total land surface of the world and contributing to 41% of the world population, 24% of global GDP and 16% of world trade (World Bank data, 2019). Further, it was estimated that the economic development in BRICS countries will outperform G7 by 2050 (Wilson & Purushothaman, 2003). Due to the growing importance of BRICS countries as the main drivers of global economic growth, it is perfectly logical to discuss the factors affecting economic growth in these countries. The major factors contributing to the economic progress of BRCIS countries so far are an abundance of natural resources, increased foreign direct investment and availability of a cheap labour force. However, in the current knowledge-based economy, the role of R&D and innovation has become more important in the sustainable development of a country, thereupon greater attention should be paid to these factors.
BRICS countries also realized the importance of science, technology and innovation for sustainable growth, and they came up with the concept of the BRICS Science, Technology and Innovation Entrepreneurship Partnership (STIEP) during the fourth BRICS STI ministerial meeting hosted by India in Jaipur, in 2016. At the fifth BRICS STI ministerial conference, held in China in 2017, the STI Ministers of the BRICS nations approved the idea and the BRICS Work Plan (2015–2018). After then, the BRICS STIEP, or BRICS Action Plan for Innovation Cooperation, was put into effect by the creation of a ‘BRICS Working Group on Science, Technology, and Innovation Entrepreneurship Partnership’ (2017–2020).
Since the start of the aforementioned cooperation, the BRICS nations have redistributed their resources in favour of the national innovation system approach, which is shown in the rising trend of R&D spending in these five nations. Figure 1 shows the trend in R&D expenditure as a proportion of GDP for these five nations. China among the BRICS nations has the strongest increasing tendency.
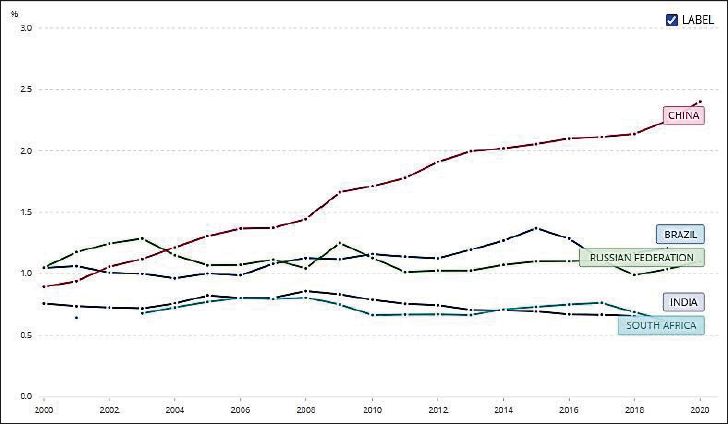
Research & Development Expenditure as a per cent of GDP.
Since the policy implications in the BRICS countries will serve as a foundation for other rising economies throughout the world, the discussion above makes it logical to research the link between innovation and economic growth in these nations. This study will add to the body of knowledge by offering empirical data on how the aspects of innovation impact economic growth. The findings will help policymakers choose which aspect of innovation should receive greater attention in the future in order to boost economic growth.
Literature Review
The simplicity of measuring innovation makes it appealing as a growth factor in empirical research. Researchers may utilize either innovation input such as R&D spending (Mansfield, 1972) or innovation outputs (Griliches, 1998). This emphasis on technological development and innovation has led to the creation of a sizable body of empirical research. These studies have demonstrated how important technical innovation is to economic success, especially at the business and industry levels. Most of the empirical research on the relationship between innovation and economic growth was based on the neoclassical approach propounded by Solow (1956) where technological innovation was considered as an exogenous factor of output and growth. After the emergence of the endogenous growth model which was based on the works of Romer (1986, 1990), Grossman and Helpman (1991) and Aghion and Howitt (1990), researchers started measuring innovation as a determinant of productivity and growth endogenously.
According to Gerguri and Ramadani (2010), innovation is crucial to both sustainable growth and economic development. Similar to this, Anwar et al. (2022) came to the conclusion that institutional quality and technological innovation both play significant roles in lowering CO2 emissions, which in turn leads to the achievement of sustainable development goals and growth. This makes it extremely appealing for scholars to turn their attention towards the link between the two. Numerous empirical investigations have been carried out by different scholars using various proxy variables, nations and time periods.
Birdsall and Rhee (1993) discovered a positive correlation between R&D expenditure and economic growth in OECD countries using cross-country growth regression. Lichtenberg (1993) examined the relationship between R&D expenditure and economic development in 74 nations between 1964 and 1989, taking into account both the public and private sectors. They discovered that there is no correlation between public sector R&D spending and economic growth. Otherwise, private sector R&D spending is having a positive impact on economic expansion. Using panel data from the years 1960 –1988, Gittleman and Wolff (1995) demonstrated the connection between R&D activities and economic development. Their research demonstrated the importance of R&D efforts for economic growth in industrialized nations. Ayres (1996) has shown that technological advances, particularly in information technology, are detrimental to economic growth. Nadiri and Kim (1996) looked at the seven largest economies for their study and examined the impact of R&D spillovers on total factor productivity growth. They discovered that the impact of R&D spillovers varies from country to country. Aiginger and Falk (2005) used a panel data model to study the factors affecting GDP per capita across OECD countries. The R&D intensity of the companies had a statistically significant positive influence on the GDP per capita. Yanrui (2010) found a favourable impact of innovation efforts on economic growth in China.
Ulku (2004) performed his research to determine the association between innovation and economic development for 20 OECD and 10 non-OECD countries during the years 1981 –1997 by applying the GMM-style panel data model. Innovation was quantified in the study using data on patents and R&D. Both OECD and non-OECD nations showed a positive association between innovation and GDP per capita as a result of the analysis; however, only OECD countries showed a positive relationship between R&D spending and innovation. Braconier (2000) also examined the relationship between R&D expenditure and GDP per capita for OECD countries for the period 1973–1992 and found a positive impact of GDP per capita on R&D expenditure.
Pessoa (2007) examines the link between economic growth and innovation, focusing on the role of R&D spending in the relationship between innovation and economic growth for Sweden and Ireland. The findings indicated that there is not a substantial correlation between research and development spending and economic growth. As a result, the innovation strategy must take other variables into account in addition to R&D spending in order to account for the complexity of the economic growth process.
On the contrary, Samimi and Alerasoul (2009) conducted their research to examine the impact of R&D on economic growth selecting 30 developing nations as a sample for the period 2000 –2006. Their calculations showed that R&D spending in emerging nations has no significant impact on economic growth.
Hasan and Tucci (2010) in his study examined the relationship between innovation inputs and economic growth based on a sample of 58 countries and found that nations that host companies with superior patents experience greater economic growth. Additionally, the results also indicated that nations with higher levels of patenting also see concurrent increases in economic growth.
Bayarcelik and Tasel (2012) investigated the connection between innovation and economic growth in Turkey. The endogenous economic development hypothesis was used to analyse the data, which showed a positive and substantial relationship between R&D spending, the number of R&D personnel and economic growth in Turkey.
Czarnitzki and Toivanen (2013) conducted their study to establish the relationship between economic growth and investment in R&D using the treatment effect model and found that public investments in R&D spur private investments, with benefits varying depending on business innovation activity history and historical labour productivity levels.
Pece et al. (2015) conducted their study using a multiple regression model for selected CEE countries namely Poland, Czech Republic and Hungary and found a positive relationship between innovation and economic growth.
Maradana et al. (2019) examined the long-run relationship between innovation and economic growth for the EEA countries using the VAR model and found both unidirectional and bidirectional causality between innovation and economic growth.
Pala (2019) examined the relationship between technology variables namely R&D expenditure and the number of R&D researchers using the random coefficient model . The results confirmed the negative relationship between R&D expenditure on economic growth for China, Egypt, Iran, Moldova, Panama, Serbia and Uzbekistan. The results also reflected the significant negative impact of the number of R&D researchers and economic growth for Iran, Mexico, Tunisia and Uzbekistan. On the other hand, the number of R&D researchers significantly affects economic growth in Ukraine, Turkey, Russia and China.
Pradhan et al. (2020) examined the causal relationship between entrepreneurship, innovation and economic growth for Eurozone countries for the period 2001–2016. The study concluded that both innovation and entrepreneurship lead to long-term economic growth while the short-run results are not consistent.
Gyedu et al. (2021) conducted their study to examine the relationship between innovation and economic growth for the G7 and BRICS countries for the period 2000 –2017. The results showed that determinants of innovation, R&D, patents and trademarks significantly affect GDP per capita. However, the influence of innovation is greater for the G7 countries than for the BRICS countries.
Anakpo and Oyenubi (2022) examined the empirical link between technological innovation and economic growth in Southern Africa for the period 2004–2017. The authors used panel dynamic Ordinary Least Square regression and found that variables of technological innovation (number of researchers in R&D, graduates from ICT, number of patents filed by non-residents, graduates from science, technology, engineering and mathematics and scientific and technical outputs) have a significant positive impact on economic growth (GDP per capita) in the long run. The study also confirmed no relationship between the number of patents filed by residents and government expenditure with economic growth.
Similarly, Sarangi et al. (2022) examined the interaction between innovation and economic growth for the G20 countries for the period 1961–2019 and found the long-run unidirectional causality from innovation to economic growth.
Ahmad and Zheng (2022) examined the cyclical and non-linear link between innovation and economic development in 36 OECD nations. The study found that positive shocks to R&D investment and patents had a significant positive impact on economic growth during the boom period. However, during a recession, the negative shock to R&D expenditure and patents significantly impacted economic growth. The study also indicated that the positive shock effect on R&D spending and the patent was stronger than the negative shock effect on R&D expenditure and patents.
When we reviewed the results of various studies conducted to investigate the nature of the relationship between innovation and economic growth in different countries and time periods where the authors used different proxies for quantifying innovation and economic growth and applied different types of methodological tools, it was revealed that innovation has both positive and negative effects on economic growth. Some studies have shown the positive effect of innovation on economic growth (Pece et al., 2015), while some other studies have concluded that there is no effect of innovation on economic growth (Vuckovic, 2016). There are very few studies that have discussed this relationship considering BRICS countries. Therefore, this study attempts to bridge this gap by examining the relationship between innovation and economic growth for the BRICS countries from the period 2004–2009. The study uses different econometric methods to examine the relationship between economic growth and innovations to find consistent results from the different models.
Data and Methodology
Finding out the nature of the connection between innovation and economic growth in the five BRICS nations is the primary goal of this article. To quantify innovation for the study, total patent applications, total trademark applications and R&D spending as a percentage of GDP have been employed, and GDP per capita in constant US (2015) dollars has been used as a stand-in for economic growth.
The sample data comprises panel data of selected variables for the period 2004–2019 which was retrieved from the World Bank and UNESCO institute for statistics databases. The natural logarithmic values of all the variables have been used for the purpose of the study which has been commonly used in other relevant studies.
The study first validates the unit root hypothesis based on the results of panel unit root tests proposed by Levin, Lin and Chu (LLC) and Im, Pesaran and Shin (IPS). The study used different econometric models after the unit root tests. The justification of different econometric models is explained in the next section. The A panel regression model with fixed and random effects is used to find the impact of innovation on economic growth. The equation is written as follows:
where t is observations on outcome GDP for country i, INNVit is an innovation (total patent, trademark and R&D spending as a percentage of GDP are used separately in the panel regression model), ci is unobserved in all periods but constant over time and uit is a time-varying idiosyncratic error. Hausman test is used to find the fixed effect or random effect model.
The panel vector autoregressive (PVAR) model was employed to investigate the short-run causal relationship between innovation and economic growth. The following vector autoregression (VAR) model is used to find the Granger causality between variables.
The significant coefficient of explanatory variables offers the short-run Granger causality. The Panel VAR model’s stability has been validated using an eigenvalue graph. Further, impulse response functions of the VAR model are used to find a more detailed insight into the causal relationship between GDP and innovations.
After estimating the unit root tests, it is important to check if there was cointegration between the variables. Therefore, Pedroni’s (1999, 2004) panel cointegration tests can be applied if both series are integrated in same order. If they are not integrated in the same order then autoregressive distributed lag (ARDL) model can be estimated to check the short-run and long-run relationship between the variables (Perasan & Shin, 1999; Perasan et al., 2001).
The authors also examined the short- and long-term effects of the independent variable (innovation) on the dependent variable (economic growth) using the symmetric and asymmetric panel ARDL model. The symmetric panel ARDL model is estimated by pooled mean group (PMG) estimators and the model can be written as
Where, αij and βij estimates the short-run coefficients, θi estimates the speed of adjustment to the long-run equilibrium, β2 estimates the long-run coefficients and ∈ t is the white noise error term. Pesaran et al. (1999) introduced the PMG estimators. It estimates the long-term coefficients are homogeneous across panel and the short-run coefficients are heterogeneous. The estimated coefficient PMG estimators are consistent and asymptotically normal for both stationary and non-stationary regression model. Equation (4) presents the symmetric panel ARDL model, where there are no decompositions of innovations into positive and negative shocks.
Further, the study used the non-linear panel ARDL model to find the asymmetric impact of innovations on economic growth. This article used the non-linear panel ARDL approach and followed the STATA program developed by Salisu and Isah (2017). The non-linear panel ARDL model is estimated by PMG estimators and is presented in Equation (5).
where,
Results and Discussion
This section of the article presents a detailed description of the data analysis and findings. Before going into a deep result discussion, the basic statistics and correlation results are presented in Tables 1 and 2, respectively. The descriptive statistics present the distribution of the variables. The results show innovation variables (total patent applications, total trademark applications and R&D expenditures) are positively skewed and leptokurtic and GDP per capita is negatively skewed and platykurtic. The Jarque–Bera normality test has shown that the variables do not follow the normal distribution. The correlation results confirm the strong positive and significant correlation between GDP per capita, total patent applications, total trademark applications and R&D expenditures.
Descriptive Statistics.

Correlation Table.

Panel Unit Root Test
Testing the stationarity of time series is the prerequisite to selecting the appropriate econometric models. For verifying the stationarity of time series, panel unit root tests have been proposed. The stationarity conditions were investigated in this study using the LLC and IPS test and the results are presented in Table 3. The LLC tests suggest that all variables are stationary at the level and IPS tests found that some of the variables are non-stationary at the level. However, both the tests found all the variables are stationary at first difference.
Panel Unit Root Test Results.

Justification for Applying Different Econometric Models
Based on the LLC unit root tests, the study applied the panel fixed effect and random effect regression model to find the impact of innovations on economic growth. Also, the panel VAR model is applied at the level of the variables to find a short-run causal link between variables. The IPS unit root found that some of the variables are stationary at the level. This result indicates that all variables are not cointegrated in the same order. Therefore, we used the symmetric and asymmetric panel ARDL model to find the short-run and long-run causality between variables. The study uses different econometric approaches which provide the robustness and consistency of the findings.
Panel Regression Model
After finding the stationarity at the level for all the variables in LLC tests, the authors have used panel regression analysis with fixed effect and random effect models to examine the impact of innovation (proxied by the total number of patent applications, the total number of trademark applications and R&D expenditure as a percentage of GDP) on economic growth. Panel data from every BRICS nation was utilized to carry out this research. The models were separately run between economic growth and all other variables used to measure innovation and the results were compiled in Table 4. After examining the results of the fixed effect model, it is clear that the elasticity coefficients of all the variables are positive and significant. All these coefficients measure the long-run elasticities. This implies that the total number of patent applications, the total number of trademark applications and the R&D expenditure as a percentage of GDP have a positive and significant impact on economic growth. The impact of R&D expenditure is maximum as it has the highest elasticity coefficient (0.867) followed by the total number of patent applications (0.482). Here, it is crucial to understand that the coefficient in the fixed effect model measures the impact of temporal variation. Only changes in the independent variable over time, not variations in the independent variable between nations, are captured by the fixed effects model since it adjusts for individual effects.
Panel Regression Model Results.

The results of the random effect model also confirm that all the independent variables have a positive and significant impact on economic growth. Here, the elasticity coefficients of independent variables measure the mean effect of all the independent variables (total number of patent applications, total number of trademark applications and R&D expenditure as a percentage of GDP) on the dependent variable (economic growth). The significant F-values and Wald Chi-square validate the overall fit of the model. The Hausman test suggests the fixed effect model when we use the total number of patent applications as an explanatory variable, and it suggests a random effect for other cases.
Panel VAR Model
Table 5 explains the result of the panel VAR model. The panel VAR model is estimated at the level of the variables because LLC unit root tests suggest that all variables have no unit root at the level. The table shows the VAR model between per capita GDP and innovations (the total number of patent applications, the total number of trademark applications and R& D expenditures) in panels 1, 2 and 3, respectively. The results have only shown that the one-directional short-run causality runs from one of the innovation variables (i.e., the total number of patent applications) to per capita GDP. We have not found any causality between variables in panels 2 and 3 in the table. Overall, these results from panel VAR clearly indicate that innovations cause economic growth.
Panel VAR Model Results.

The impulse response function is used after the panel VAR model to get the detailed causal link between per capita GDP and innovations. In Figure 2, the top-right of the off-diagonal panel shows that the effect of the growth of shocks of patent applications increased the per capita GDP in future periods. However, the bottom-left of the off-diagonal panel shows that the shocks of per capita GDP declined the patent applications initially and later, increased the per capita GDP. In Figure 3, the bottom-left panel shows that a one standard deviation shock in the change in total trademark applications raises the change of the per capita GDP and the impact of trademark applications on per capita GDP is very high. On the other hand, the results show that the impact of per capita GDP declined the patent applications in the future. In Figure 4, the shocks of GDP per capita on R&D expenditure have increased. The shocks of R&D expenditure on Per capita GDP are stable. Overall, the results from the impulse response function have found that the innovations will have a positive impact on economic growth in future periods in BRICS countries.
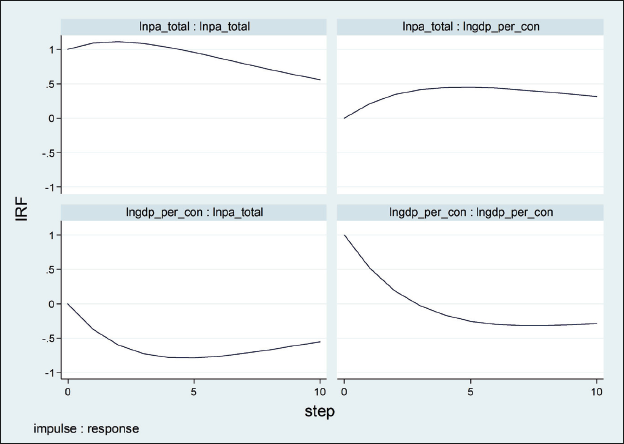
Impulse Response Function between per Capita GDP and the Total Number of Patent Applications.
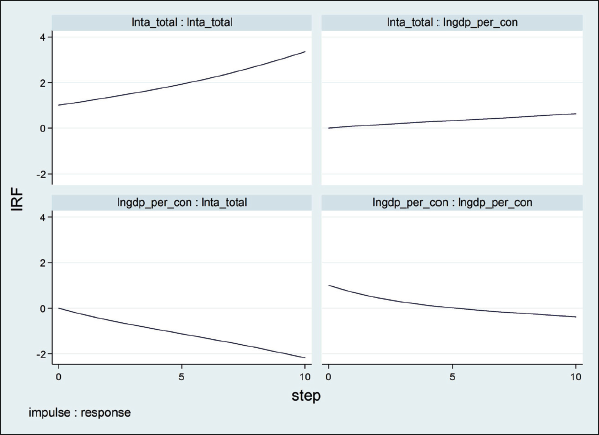
Impulse Response Function between per Capita GDP and the Total Number of Trademark Applications.
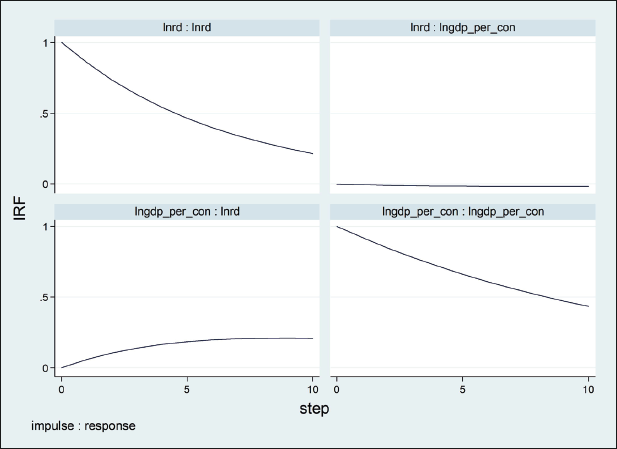
Impulse Response Function between per Capita GDP and R&D Expenditure.
Stability of Panel VAR Model
After estimating the panel VAR model and impulse response function, it is critical to test the model’s stability using an eigenvalue graph. Figure 5 depicts the panel VAR stability conditions for Models 1, 2 and 3 respectively. The graph clearly shows that the predicted model’s eigenvalue is smaller than one or the dots are located inside the outer circles. This validates the model’s stability.
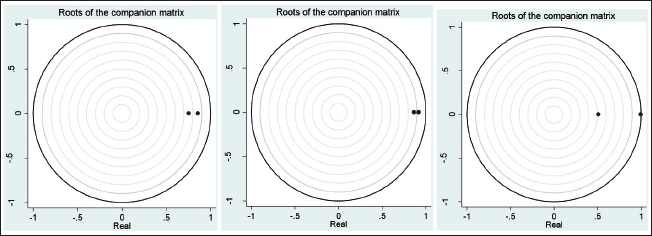
Stability of Panel VAR Model.
Symmetric and Asymmetric Panel ARDL Model
In IPS test for unit root analysis, we found that variables are not integrated in the same order. Therefore, both the symmetric and asymmetric panel ARDL models are applied to examine the short-run and long-run impact of innovation on economic growth. First, Table 6 reports the results of the panel ARDL model without asymmetric. Then, we find the results with asymmetric in Table 7.
Symmetric Panel ARDL Model Results.

Asymmetric Panel ARDL Model Results.

In Table 6, the impact of patent applications, trademark applications and R&D expenditure on per capita GDP are presented in panels 1, 2 and 3, respectively. The results found that the elasticity coefficient for the innovation variables such as total patent applications and total trademark applications have a positive and significant impact on per capita GDP in the short run. The elasticity coefficients in the long run are insignificant in all the panels. In panel 2, the results found that per capita GDP is adjusting to the previous period’s deviation to total trademark applications from long-run equilibrium.
The asymmetric impact of patent applications, trademark applications and R&D expenditures on GDP growth is reported in panels 1, 2 and 3 of Table 7, respectively. In panels 1 and 2, the elasticity coefficients of patent applications and trademark applications in the short run have been found positive and significant on GDP growth due to the positive shocks. However, the negative innovation shocks of trademark applications have a negative and significant influence on GDP growth in the short run. The error correcting speed of adjustment term in panel 1 is significant and hence GDP is correcting negatively with total patent applications for long-run equilibrium. The elasticity coefficients in the long run are insignificant for both positive and negative innovation shocks. Like the symmetric panel ARDL model, the asymmetric impacts of R&D expenditure on economic growth have not found any significant results. The results have shown that there is an asymmetric relationship between innovations and growth in the short run.
Both the symmetric and asymmetric panel ARDL model has shown that innovation has a positive and significant effect on economic growth. The results are consistent and valid with the results of the panel fixed effect and random effects model, panel VAR model and impulse response functions.
Conclusion and Policy Recommendations
The study explored the causal link between innovations and economic growth in BRICS countries. We have considered total patent applications, total trademark applications and percentage share of R&D expenditure to GDP as a proxy for innovations. The results of panel unit root tests in LLC tests found no unit root at the level. Therefore, the study used the panel regression model with fixed and random effects and the panel VAR model to establish the relationship between innovation variables and per capita GDP growth. The results from panel regression models have shown a positive and significant relationship between all innovation variables and per capita GDP. The panel VAR model found a one-direction causal link that runs from total patents application to per capita GDP. The other two innovation variables total trademark applications and R&D expenditures have not found any causal link with economic growth. The impulse response function is drawn after the panel VAR model. The results found that one standard deviation shock of patent applications and trademark applications increased the per capita GDP and the impact of shocks of R&D expenditure on per capita GDP is found stable. The study used both the linear and non-linear panel ARDL model because IPS tests found variables are not integrated in the same order. The symmetric and asymmetric panel ARDL model has shown that per capita GDP has increased due to patent applications and trademark applications in the short run. The R&D expenditure does not have any impact on per capita GDP in the short run. The long-run coefficients are found insignificant. The asymmetric models found that the positive innovation shocks have positively influenced the economic growth and the negative innovation shocks have negatively influenced the economic growth in the short run. Overall, the results from different econometric models concluded that innovations induced economic growth in BRICS countries. The study suggests that national policymakers of BRICS countries must encourage innovations to promote economic growth. The government may create a good environment in higher educational institutes to promote innovations.
Footnotes
Acknowledgment
The authors are grateful to the anonymous referees of the journal for their extremely useful suggestions to improve the quality of the article. Usual disclaimers apply.
Declaration of Conflicting Interests
The authors declared no potential conflicts of interest with respect to the research, authorship and/or publication of this article.
Funding
The authors received no financial support for the research, authorship and/or publication of this article.
