
Abstract
From reforms and fin-tech revolutions to macro-economic shocks, the Indian banking sector has witnessed rapid changes over the last two decades, which has significant implications for banks’ profitability. Viewing bank profitability from three different dimensions, Net Interest Margins (NIM), Return on Assets (RoA) and Return on Equity (RoE), this study has explored the key determinants with the help of machine learning algorithms. It has used a pooled data set of domestic and commercial banks covering 2005–2021. As a dependent variable, profitability by each measure (NIM, RoA and RoE) is reclassified into three categories, above average, average and below average, based on their quartiles. Twenty-one explanatory variables comprising bank-specific, macroeconomic and policy variables are chosen after due validation using feature selection methodology and multicollinearity check. The random forest (RF) classification algorithm is executed using the CARET package in R. The results obtained from feature selection are corroborated with the RF classification findings. The results are robust and give clear-cut visibility of unique and common factors influencing three profitability measures at varying levels. The classification estimates suggest that the bank-specific variables are major determinants of NIM, while macroeconomic and policy variables are the key determinants of RoA and RoE. Further, the results also suggest that the ratio of non-performing assets to total assets and business per employee are two such bank-specific determinants that play an important role in all three dimensions of profitability. Thus, recapitalization and automation will play an important role in bank profitability.
Introduction
Prior to banking reforms, profitability was a secondary objective for the banks in India. Banks’ primary goal was to balance regional development through distributional equity rather than allocative efficiency. The focus was on expanding the branch network in rural and semi-urban areas (Bapat, 2017). Banks were required to take on additional responsibilities that private banks in a free-market economy would not (Deolalkar, 2016). With these objectives, 14 and 6 major banks were nationalized in 1969 and 1980, respectively, the lead bank scheme was adopted in 1971 and RRBs were formed in 1975. The other important policy interventions include interest rate ceilings, high reserve requirements, quantitative restrictions in the allocation of credit, directed credit programmes and financing of central government fiscal deficit and public ventures.
Thus, prior to banking sector reforms, Indian banks operated in a highly regulated ecosystem- banks had no freedom in deciding their lending rates, were compelled to continue with their loss-making branches, were bound to invest a large portion of their deposits in low-yielding government securities and compelled to finance low yielding investment projects under priority sector lending (Kumar & Bird, 2020). Alternatively, the pre-reform era is known as the era of financial repression, which stifled competition and bred low productivity and inefficiency in the banking system (Mckinnon & Shaw, 1973). Guided by the Mckinnon–Shaw hypothesis, Narasimham Committee II 1 recommended banking sector reforms. Following the recommendations of the Narasimham committee, branch delicensing and rationalization, interest rate deregulation, dilution of directed credit programme, operational autonomy of banks at the micro level, capital adequacy norms, income recognition, provisioning norms, etc., were introduced. The reforms intended to improve the financial system’s efficiency and dynamism to usher in a significant structural transformation in the Indian banking system (Geethanjali & Ashwani, 2018; Sinha & Sharma, 2015). To align Indian banks with international best practices, asset-liability management, liquidity management and Basel III norms have also been implemented.
However, liberalization and reforms significantly increased competition among banks by lowering entry barriers (Guruswamy, 2012). The reforms allowed the entry of private and foreign banks with greater operational autonomy, be it the closer or amalgamation of loss-making branches or opening-up of new branches or lending rates. As a result, the Indian banking system has grown by leaps and bounds (Sinha & Sharma, 2015). The reforms have altered the Indian banking environment substantially, leading to increased efficiency and productivity (Rakshit & Bardhan, 2020), impacting the profitability of banks.
Apart from banking sector reforms, a host of technological innovations supported by legislative and institutional initiatives by the central Government in recent years has played a significant role in enhancing efficiency and productivity in the Indian banking sector. The innovations include Core Banking Solutions (CBS), Electronic Fund Transmission (ETF), internet and phone banking, National Payment Corporation of India (NPCI), National Automated Clearing House (NACH), Rupay Cards, Bharat Pay, Unified Payment Services (UPI), Aadhar Enabled Payment System (APES), Credit Information Bureau India Limited (CBIL), Central Know Your Customer (CKYC) database, Debt Recovery Tribunal (DRT), National Company Law Tribunal (NCLT), insolvency and bankruptcy code, robotic process automation, cyber security, cloud services, chart boats, Automated Payment Interface (API) platforms, biometrics, etc. Most of these have been introduced during the 2005–2022 period. These developments must have positively impacted the profitability of Indian banks. On the other hand, during the last decade, the Indian banking industry, especially the public sector banks, has seen an increasing pattern of non-performing assets (NPAs) ever-increasing strained assets, and slow-moving loan growth, in the recent past (Gaur & Mohapatra, 2020), which has important implications for their profitability. In 2013, RBI warned that the banking sector is under severe pressure due to increased bad loans and increased bank fraud (RBI, 2013). Further, the period of 2005–2022 has witnessed several crises and policy shocks such as global financial crises (2008–2013), demonetization (2016), the introduction of GST (2017), amalgamation and merger of several public sector banks (2019), COVID-19 crisis, etc. Moreover, the aforesaid period of 2005–2022 has witnessed a chequered history of macro-economic indicators. Inflation was as high as 12.31% in 2009 and as low as 3.43% in 2018 2 . Similarly, the US Dollar-INR exchange rate moved from as low as 37.895 to as high as 82.536 between October 2007 and 2022 3 . GDP growth was as high as 8.95% in 2010 to as low as – 6.6 % in 2020 4 . The unimpressive GDP growth between 2008 and 2018, despite huge potential, may be considered as a lost decade for India (Mehra, 2019). But it will undoubtedly be naive to consider that bank profitability could be immune to such a macro-economic environment.
However, against the backdrop of banking sector reforms, problems with the public sector banks, technological and legislative changes, and macro-economic scenarios raise the following broad research question.
The Research Question
How have the various factors influenced the profitability of Indian banks? In other words, can we identify a set of key determinants that influence the profitability of Indian banks? To find an answer to the above broad research question, we delve into the extant literature.
Review of Literature
After shortlisting about 60 recent research publications with high citation scores through a bibliometric exercise and analysing their abstracts, 37 were identified as the most relevant articles for conducting a literature review about the aforesaid research question.
In recent years, many researchers, economists and policymakers have examined the profitability and performance of banks in India (Almaqtari et al., 2018; Bapat, 2017; Eissa et al., 2018; Jain et al., 2016; Jeet & Aspal, 2020; Karimzadeh et al., 2013; Kumar & Bird, 2020; Rakshit & Bardhan, 2020; Subbarayan & Kumar, 2017).
Almaqtari et al. (2018) examined the determinants of profitability of 69 Indian commercial banks from 2008 to 2017. They found that assets management ratio, bank size, ratios of asset quality and liquidity assets ratio had a favourable effect on RoE. Macroeconomic determinants such as inflation, exchange and interest rates also significantly impacted RoE. External and internal factors influencing the performance of banks (Karimzadeh et al., 2013) have a substantial effect on profitability. However, Sufian and Mohamad Noor (2012) in their study conducted during 2000–2008 concluded that the impact is not uniform across banks of different countries of origin. Panel data comprising 10 years across 60 Indian commercial banks analysed by Eissa et al. (2018) shows that the leverage ratio exerts a negative influence on all proxy profitability measures, RoA, RoE and NIM. Seenaiah et al. (2015) analysed data from 1995 to 2012 on Indian banks corresponding to four banking groups, namely nationalized banks, the SBI group, private banks and foreign banks. Results show that lending provided to the priority sector does not affect bank profitability in India, while wage bills, operating profits, NPAs and NIM impact the profitability of Indian banks. Jain et al. (2019) studied 26 public-sector and 19 private-sector banks in India during the post-global financial crisis from 2010 to 2016. The results suggested that the private banks’ performance was better than that of the public sector banks. The findings of their random effect model divulged that both bank-specific factors and macroeconomic variables explained the commercial banks’ profitability. The study by Karimzadeh et al. (2013) confirms that the deposit and loan asset ratios of banks have an essential impact on Indian banks profitability. Results estimated by Rakshit and Bardhan (2021) for Indian banks show that higher competition worsens bank profitability. Results also show that the growth in the incidence of credit and other banking risks impedes bank profitability across all kinds of ownerships. Subbarayan and Kumar (2017) used discriminant analysis to identify the significant discriminants of 38 Indian private and public sector banks for the years 2015–2016. Kumar and Bird (2020) utilized a panel dataset from 230 banks (58 banks from India and 172 from China) over the period 2004–2019, comprising 2,834 bank-year observations, to investigate the determinants of bank profitability. Bank’s CAR has a positive impact on bank profitability. Bank profitability in both countries is found to be negatively related to size, financial inclusion and NPLR-Non-Performing Loan Ratio. However, the impact of LDR-loans to deposit ratio on profits for Indian banks is found significant but not for Chinese banks. During the banking crisis of 2015–2016, the subprime crisis of 2008–2010, and also during high credit off-take periods of 2011–2014, the liquidity of banks was severely impacted, leading to the unfolding of systemic economic effects (Roy et al., 2019).
Bapat (2017) studies 25 public sector and 17 private sector banks from 2007 to 2013 to assess the determinants of profitability using GMM estimators. Non-performing loans (NPLs) are considered a threat to the stability of banking stability, with regulators concerned about worsening asset quality in Indian banks, especially in the public sector banks (RBI Financial Stability Report, 2013). Amongst numerous factors, priority sector lending directed by the regulator and credit interference of government harms the credit culture, specifically in public sector banks. It is recommended that public sector banks change their focus on improving profitability rather than depending on increasing the size of the balance sheet.
Gaur and Mohapatra (2020) assess the NPA-profitability relationship for 37 scheduled commercial banks of India over a 14-year time frame (2005–2018) using a fixed and random effect model. NPA is the primary determinant of profitability and bears an immense negative influence on profitability measures (De Bock & Demyanets, 2012; Gaur & Mohapatra, 2020; Kadioglu et al., 2017; Kanoujiya et al., 2021; Karimzadeh et al., 2013; Swami et al., 2019).
Jeet and Aspal (2020) apply a fixed effect model to Indian public sector banks’ data from 2015 to 2019. Human capital, asset quality, liquidity and management efficiency are found to positively and significantly influence bank performance (RoE). The impact of capital adequacy and earning quality on profitability is found insignificant. Mohanty and Sarkar (2020) conducted a study encompassing 21 PSU banks [inclusive of the State Bank of India (SBI) and its associates] from 2012–2013 to 2016–2017. They recorded the impact of external and internal factors on its returns. The study concludes that banks should effectively manage their operational expenses and costs to remain efficient and maximize profits in light of increased banking regulation and competition. Sidhu et al. (2022), in their study, used the GMM estimation technique on annual data from 2010 to 2019 to examine the impact of liquidity regulation. Findings show that NPAs grow in response to higher levels of liquidity. This adds stress to bank profitability (Gaur & Mohapatra, 2020; Ramli et al., 2018). Several other studies, such as Swami et al. (2019); Rakshit and Bardhan (2021) and Kaur et al. (2023), have investigated different dimensions of banking operations that eventually impact the profitability of Indian banks.
Shrivastav (2019) considered 58 private and public sector banks in India during 2000–2017 to predict bank failure using machine learning techniques. A total of 23 variables, including bank-specific, macroeconomic and market structure variables, were considered to comprehend the key factors accounting for the survival of the Indian banks through feature selection methods.
Overall, the results appear to be mixed and ambiguous. No evidence of convergence has been found in studies that have observed bank-specific and macroeconomic factors influencing the profitability of Indian commercial banks (Almaqtari et al., 2018). Further, hardly any study has captured a period between 2005 and 2022. In addition, there is a paucity of studies that have covered a wide range of bank and industry-specific policy and macroeconomic variables to study the determinants of bank profitability in India. Moreover, although machine learning (ML) techniques are being used increasingly to study the behaviour of banks owing to their superior predictive power, their use has been limited in the context of the profitability of Indian banking.
Hence, the present study intends to address the aforesaid research gap by exploring the determinants of bank profitability among a wide range of variables using ML techniques. In particular, a comprehensive set of 21 variables representing bank, industry, policy and macroeconomic conditions has been taken into consideration. Apart from a wide range of variables and the use of ML techniques, the uniqueness of this study arises in terms of its study period and profitability assessment. Data from a comprehensive period from 2005 to 2022 is considered for the study. Finally, the explanatory variable, profitability, is viewed from a multidimensional perspective. Instead of a single measure, three profitability measures, namely Return on equity (RoE), Return on Assets (RoA) and Net Interest Margin (NIM), have been considered. Further, each measure of profitability is classified into above-average (AA), average (A) and below-average (BA) levels based on their dispersion assessed through box plots.
The article is designed as follows. Besides the previous two sections, the Introduction and Review of the literature, there are three more sections. The methodology, data description and model metrics section are foollowed by the section that corroborates with the findings of previous studies, analysis of the result and discussion. The last section is devoted to presenting the conclusion and policy implications.
Data and Methodology
RBI data covering 65 domestically owned scheduled commercial banks (excluding the foreign banks) operating in India from 2005 to 2021 are considered for this study. After dropping all the rows with missing values, we arrived at a pooled data set with 798 observations in 18 independent variables, of which 422 are from the public sector.
Three measures of profitability, namely NIM, RoA and RoE, are considered as a dependent variable (Athanasoglou et al., 2008; Garcia & Guerreiro, 2016; Zampara et al., 2017). NIM represents a bank’s position in making investment decisions based on its relative interest expenses (Maudos & Guevara, 2004). RoA measures a bank’s ability to generate profits by using the bank’s funds. It also shows the earnings (profits) per unit of assets (Hassan & Bashir, 2005). RoE measures the profit a bank generates from the funds invested in equity by shareholders (Ongore & Kusa, 2013). Further, to investigate the relative importance of explanatory variables, each of the above measures of profitability is classified into Above Average (AA), Average (A) and Below Average (BA) categories based on quartile values. The values below Q1 come under the BA class, values above Q3 are the AA class, while all the values between Q1 and Q3 are the A class.
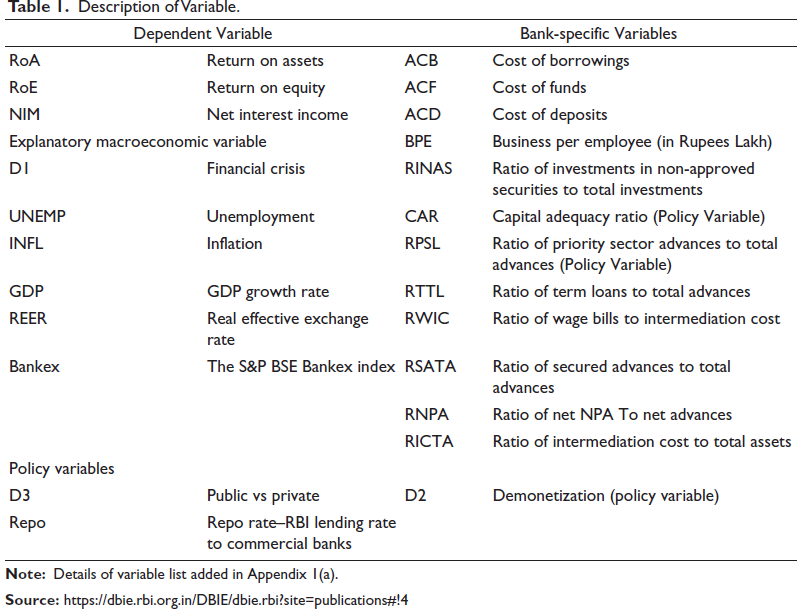
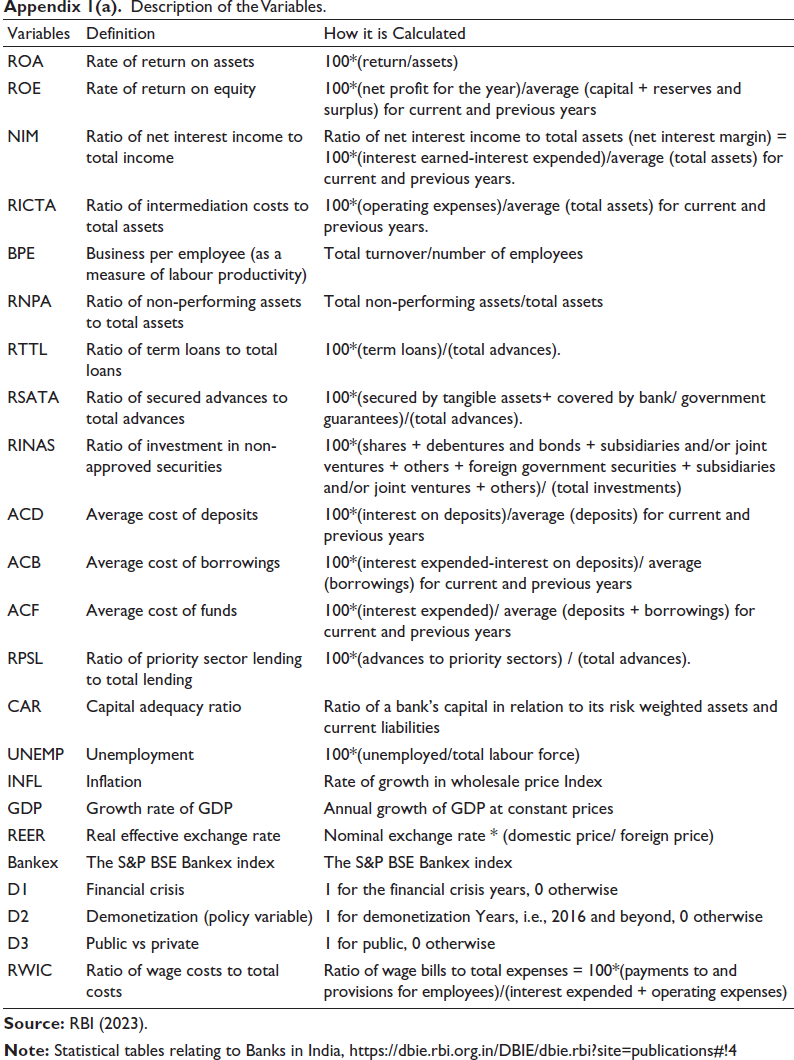
However, to trace the possible determinants of profitability by each of the above measures and categories, in addition to the abovementioned 18 explanatory variables, three dummy variables are also used. The three dummy variables are D1 representing the financial crisis impact spanning 2009–2014 (1 for year 2009–2014 but 0 otherwise), D2representing demonetization (1 for the year 2016–2022 but 0 otherwise, as demonetization was done in the year 2016) and D3 representing the type of bank (1 for public but 0 otherwise). However, the 21 explanatory variables are further classified into six macroeconomic variables, three policy variables and 12 bank-specific variables (Table 1).
Description of Variable.
We used the variance inflation factor (VIF) for checking the multicollinearity amongst variables. The Boruta algorithm (Kursa & Rudnicki, 2010) for feature selection is used to validate the significance of the variables. The algorithm is a wrapper around the random forest classification algorithm executed in R’s ‘randomForest’ package (Liaw & Wiener, 2002). The random forest ML algorithm (Breiman, 2001) is used for the classification of bank performance into BA, A and AA for this study. We normalized our independent variables to bring all data to a level playing field. The data was partitioned into two random subsets in an 80:20 ratio, maintaining the percentage of classes of the dependent variables (Gholamy et al., 2018). We used 80% data for building the model and 20% for testing. We also used the method of repeated cross-validation with 10-folds, which was repeated five times to circumvent the problem of over-fitting. The algorithms are run using the CARET (Classification and Regression Training) package (Kuhn, 2008) of the R software.
Model Performance Metrics
The model performance during training uses accuracy, sensitivity and specificity. In contrast, we used accuracy, sensitivity, specificity, Cohen’s Kappa, precision and F1-score for checking the testing performance.
The model’s accuracy provides evidence about the degree of proximity between the predicted and actual values of the population parameters; sensitivity is the proportion of true classes predicted as true, whereas specificity is the fraction of correctly predicted negatives. Precision represents the proportion of the true positive out of the predicted positive. The F1-score provides us with a single measure to evaluate the performance of our model (a normalized value between 0 and 1). It is the harmonic mean of sensitivity and precision. A high F1 value implies that the chosen model has a lower level of misclassification (Meitei et al., 2022). Cohen’s kappa statistic (T) is a very useful measure in case of imbalanced data and multiclass classification, and when the predicted and actual values are aligned, the statistic value will be higher (Meitei et al., 2022). If the T statistic is less than zero, then there is no agreement between the predicted and actual value; a slight agreement is there if it lies between 0 and 0.2; the agreement is fair if the value is between 0.2 and 0.4, moderate when it is between 0.4 and 0.6, a good degree of agreement when it is between 0.6 and 0.8, and almost perfect agreement when the value is between 0.8 and 1.0 (McHugh, 2012).
Results and Discussion
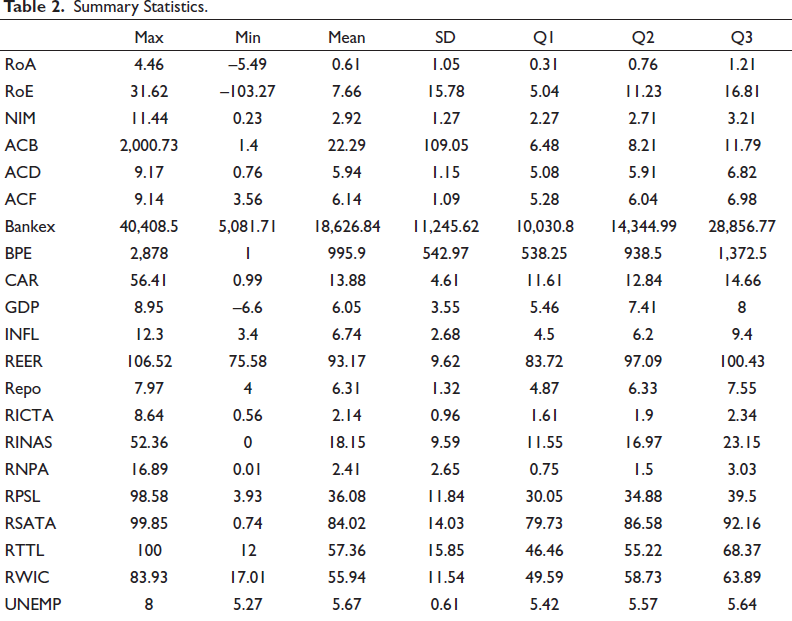
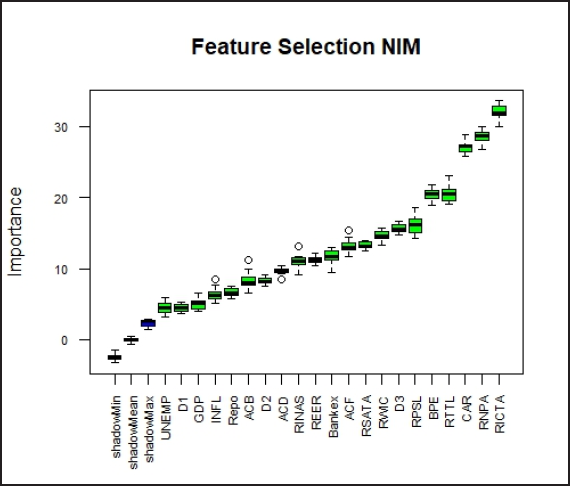
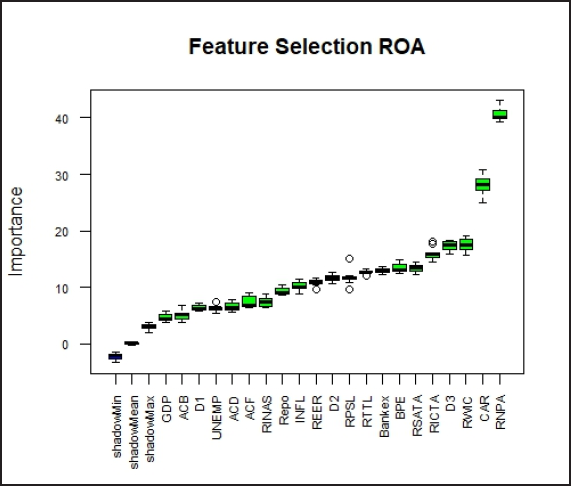
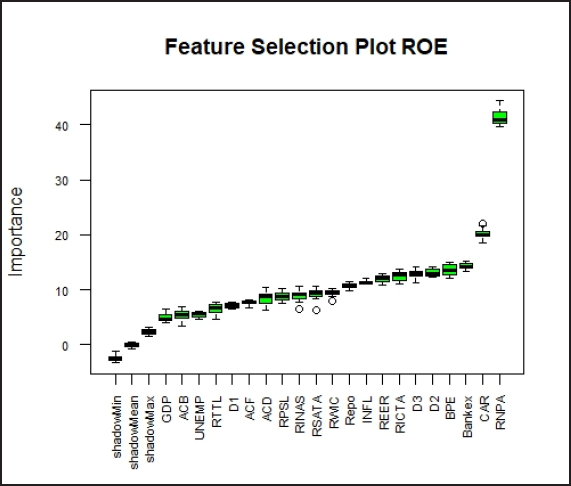
We start the analysis by checking the multicollinearity using the VIF values computed using the Companion to Applied Regression (Fox & Weisberg, 2019) package in R. The VIF values of all the independent variables are found to be less than 10, indicating no serious multicollinearity between the independent variables. In Table 2, summary statistics of all the explanatory variables are presented. The significance of all the variables is also checked using the feature selection algorithm of the Boruta package. However, the degrees of importance of the explanatory variables vary for the three dependent variables as per the feature selection score [Appendix 1(b), (c), (d)]. All 21 variables are identified as significant for classifying the NIM, RoE and RoA into different classes.
Summary Statistics.
For an in-depth analysis of 21 variables impacting the three performance measures, the variables are bracketed into three segments in descending order of the VIP scores. These segments are identified as Top-segment influencers, Mid-segment influencers and bottom-segment influencers.
Each segment brackets seven variables showing the relative strength of variables in influencing the profitability measure. The summary statistics of the variables are given in Table 2.
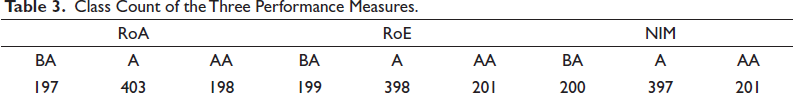
The financial year 2020–2021 has seen a contraction in GDP by 6.6%. The class count for each sub-class for the three dependent variables is given in Table 3.
Class Count of the Three Performance Measures.
Training Report
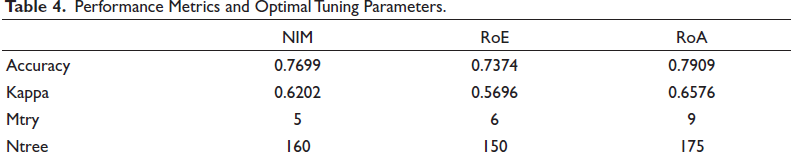
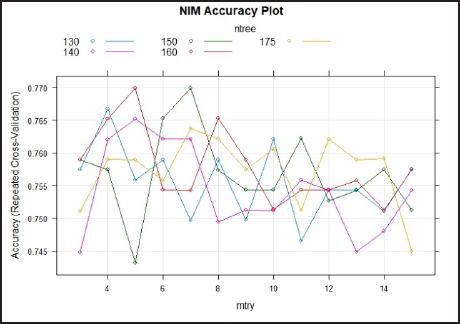
The RF with repeated cross-validation (10-folds with five repeats) can accurately classify the NIM, RoE and RoA into three different classes. The highest accuracy is 78.69% in the RoA, followed by NIM and RoE with 76.65% and 74.60%, respectively. The high kappa values also suggest that misclassification is on the lower side. The RoA and NIM having kappa above 60% suggest that the agreement between the predicted and actual value falls in the good category. Table 4 gives the performance metrics of the models for the training phase along with their best tune, and the accuracy plots for different tunning parameters are given in Figures 1(a)–1(c).
Performance Metrics and Optimal Tuning Parameters.
Accuracy Plot for NIM for Different Tuning Parameters. Maximum accuracy is achieved at 76.99% and the optimal value of mtry is 5 and ntree is 160.
Accuracy Plot for RoE for Different Tuning Parameters. Maximum accuracy is achieved at 73.74% and the optimal value of mtry is 6 and ntree is 150.

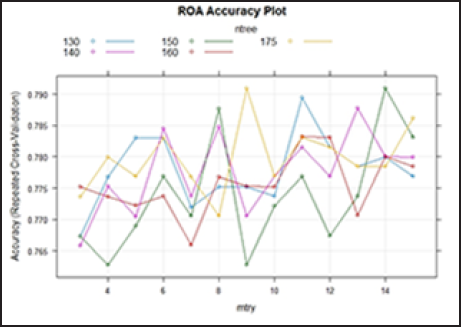
Accuracy Plot for NIM for Different Tuning Parameters. Maximum accuracy is achieved at 79.09% and the optimal value of mtry is 9 and ntree is 175.
Testing Report
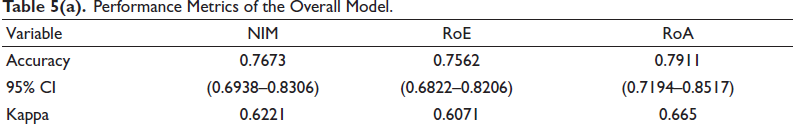
The RF algorithm worked with high accuracies with the training data for all three dependent variables; we now test the models with the 20% test data. The overall performance will be assessed using the accuracy and kappa statistic, while the class accuracies will be evaluated using sensitivity, specificity, precision, F1-score and balance accuracy. The balanced accuracy is the mean of the sensitivity and specificity. Tables 5(a) and 5(b) give the values of the models’ overall performance metrics and class accuracies.
Performance Metrics of the Overall Model.
Performance Metrics of the Class Classifications.
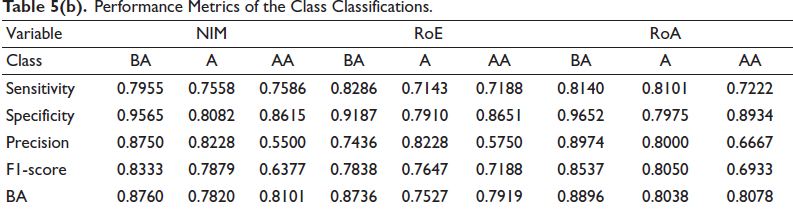
The overall performance of the models with the test data shows high accuracies (Table 5(a)), with the RoA having the highest at 79.11%. The kappa values are also all in the sixties, indicating a decent degree of agreement between the actual and predicted values. The balanced accuracies of all the sub-classes except the average and above-average class of RoE and average for NIM are above 80. The highest balanced accuracy is 88.96% for the below-average class of RoE, followed by below average class of NIM. The high values of the F1-score are another indication of the models working well with the test data. The feature importance scores of all variables based on the three profitability measures are discussed as determinants of NIM, ROA, and ROE across three segments (Table 6(a)–6(c)).
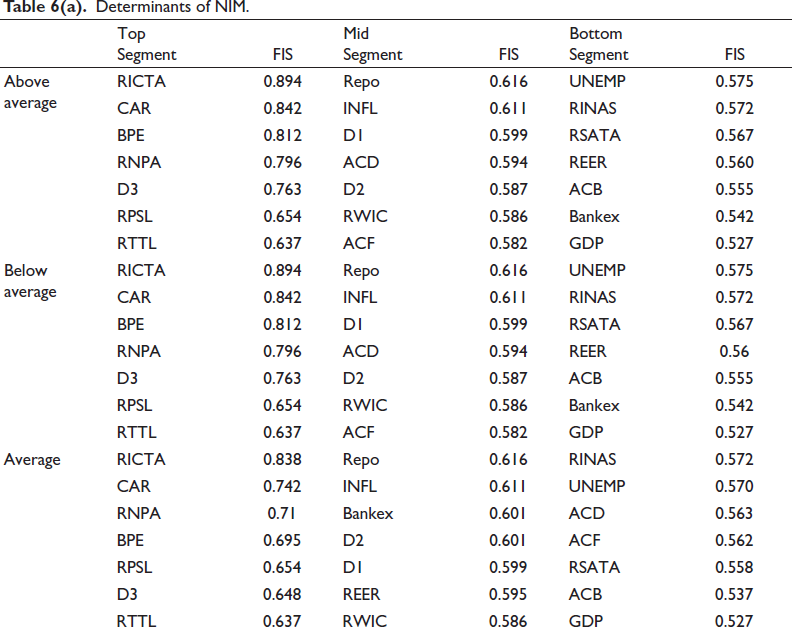
Determinants of NIM.
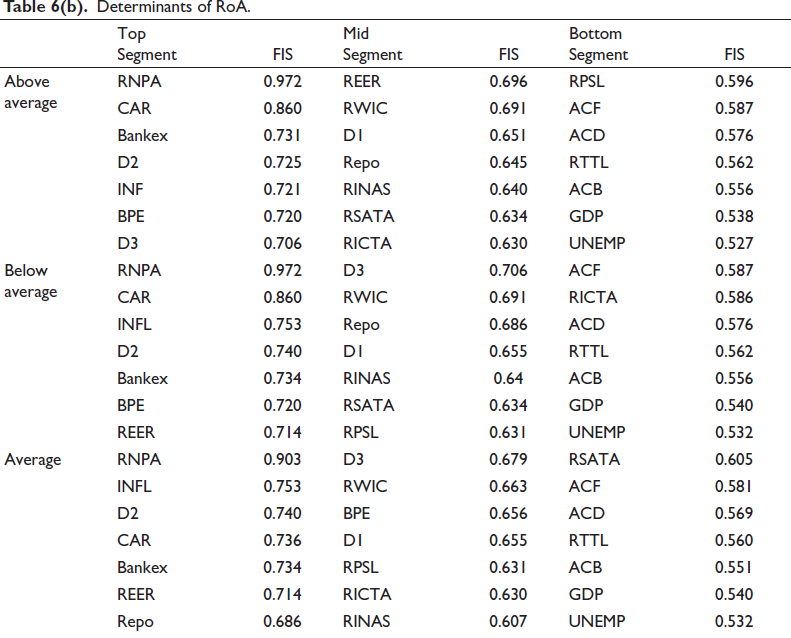
Determinants of RoA.
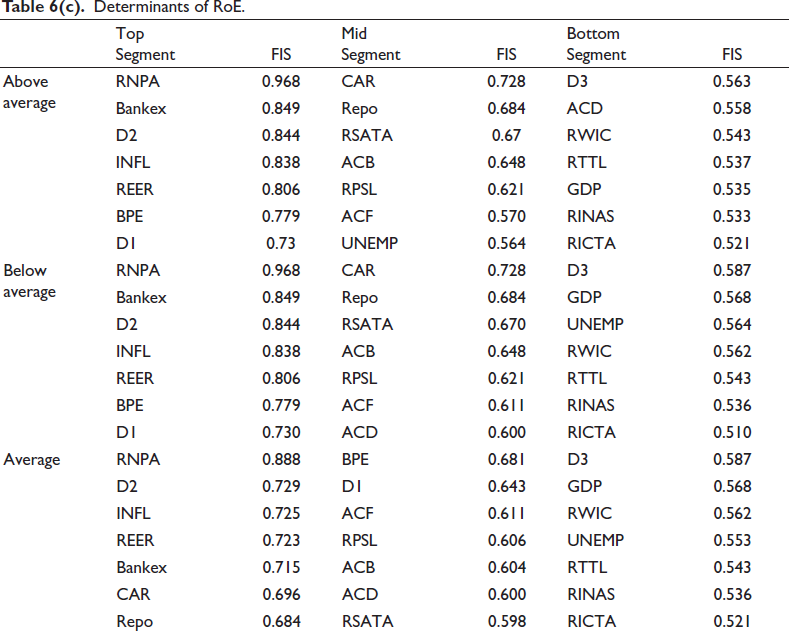
Determinants of RoE.
Determinants of Profitability
As maintained in the previous sections, we have considered the three alternate measures of bank profitability: NIM, RoA and RoE. The determinants of profitability for each of these criteria arrived through ML algorithms of classification are discussed in turn.
Determinants of NIM
The classification estimates suggest that the variables such as RICTA, CAR, BPE, RNPA, D3, RPSL and RTTL are top segment influencers of NIM. These variables rank high not only in terms of their importance for NIM at an overall level [Appendix 1(b), obtained using Boruta] but also across the three categories of NIM, Above Average (AA), Average (A) and Below Average (BA). Table 6(a) represents the feature importance (FI) details measured on a scale from 0 to 1, 0 indicating the feature is not relevant, and 1 denoting the feature is essential, extracted from the variable importance plot of the training phase. Feature importance score (FIS) is a critical notion in ML that directs to the relative importance of each feature in the training data.
The primary role played by the variables described above towards NIM could be because the factors such as intermediation costs, provisioning for doubtful or substandard assets as per the required capital adequacy norms, and the quantum of NPA adversely affect the net interest margins of the banks (Kadioglu et al., 2017; Saluja & Sharma, 2017). Similarly, business per employee (BPE), a measure of labour productivity, favourably affects the net interest margins. Importantly, besides the aforesaid bank-specific variables, the industry-specific dummy variable D3, representing private vs public ownership of the bank, and the policy variable, the ratio of priority sector lending to total lending (RPSL), also count as essential determinants of NIM. The former could be because of the sheer dominance of the public sector in the Indian banking space, while the latter could be constraining the lending discretions of commercial banks.
Interestingly, in contrast to the variables mentioned above, the macroeconomic variables such as unemployment (UNEMP), GDP growth rate and bank-specific variables such as average cost of borrowing (ACB) and the ratio of investment in non-approved securities (RINAS) are relatively less important determinants of NIM, both at an overall level and across the selected categories. Financial crises represented by the dummy D1 primarily affect the weak banks; inflation blows up the measurement in nominal terms, while the real effective exchange rate (REER) affects the NIM when banks depend more on the external sector. REPO affects interest rates banks offer and hence influences banks’ NIM. Bankex affects the NIM of the banks with a low deposit base.
Thus, the NIM of banks across all performance categories is mainly affected by bank-specific variables such as RICTA, CAR, BPE, RNPA, etc., barring a few policy variables such as D3 and RPSL, respectively.
However, it is essential to emphasize that the FIS lies between 0.616 and 0.527 for the variables falling in the mid-segment and bottom-segment influencers of NIM, signifying a close relative difference in scores.
Determinants of RoA
The significant determinants of RoA include bank-specific variables such as RNPA, CAR and BPE, and macroeconomic variables such as Inflation, Bankex and REER; policy variable D2 (indicating demonetization) across the three performance levels (Table 6(b)); the results are more or less in agreement with the overall feature importance analysis of Boruta (Appendix 1(c)). This finding is similar to that of Eissa et al. (2018). In contrast to that NIM, RoA appears to be dominantly influenced by macroeconomic and policy variables as well, as found by Athanasoglou et al. (2008), Al-Homaidi et al. (2018) and Almaqtari et al. (2018). D3, REER and REPO uniquely influence above-average, average and below-average performance levels, falling in the top influencer category segment.
RWIC and D1 appear to be moderate influencers at all levels of performance measures of both NIM and RoA. RWIC, RINAS and D1 are mid-segment common influencers across the three levels of performance measure RoA. It is pertinent to note that the distribution of RoA is more or less symmetrical, whereas that of NIM is more skewed towards its upper end (Summary Table 2).
Thus, the study reveals that the performance measure RoA is impacted by bank-specific and macroeconomic variables across the three performance levels when top segment influencers are distinctly examined. In contrast, NIM’s top segment influencers are predominantly bank-specific variables. RINAS, D1 and RWIC are common mid-segment influencers of RoA across the three performance levels.
Determinants of RoE
Strikingly, the determinants remain more or less the same even if we change the performance criterion from RoA to RoE. The significant determinants of RoE include RNPA, D2, Bankex, Inflation, REER, BPE, D1, etc. Like RoA, the macroeconomic and policy variables appear to be significant determinants of RoE (Meitei et al., 2022). Table 6(c) depicts the FIS of the determinants of RoE.
Further, when we compare various levels of profitability across the three measures, at the above-average level of RoA and RoE, among the top seven influencers, RNPA, D2 (demonetization), INF, Bankex, BPE are common, while CAR and D1 are unique influencers. However, the influence of Bankex on RoE is higher in the case of RoE. At the mid-range level of performance, common influencers are RSATA, Repo and D1 (financial crisis). Among the top seven NIM influencers are RNPA, BPE (also common to RoA and RoE), D3, RTTL, Repo, RSATA and RICTA. Interestingly, the GDP growth rate is not impacting NIM and RoA but is weakly influencing RoE. Among the top seven NIM influencers at above average (AA) levels in a descending order are RICTA, CAR, BPE, RNPA, D3 RPSL and D2. In our analysis, RNPA, BPE and D2 are common to all three profitability measures at AA levels. The top seven strong and common influencers at low RoA and RoE (BA category) are RNPA, Bankex, D2, INF and BPE, while D3, CAR, REER, D1 are unique influencers of RoA and RoE, respectively. Thus, in a nutshell, the determinants of NIM are dominated by bank-specific factors, while the impact of macroeconomic and policy variables is more distinct on RoA and RoE. The influence of bank-specific variables and external factors on the performance of banks is acknowledged by earlier studies (Al-Homaidi et al., 2018; Almaqtari et al., 2018; Jaber, 2014; Karimzadeh et al., 2013; Meitei et al., 2022; Shrivastav, 2019). Further, even if RoA and RoE are affected by a limited number of bank-specific variables compared with NIM, a commonality in the influence exerted by RNPA and BPE cannot be disregarded. The overall feature importance plot of RoE is given in Appendix 1(d).
It is pertinent to mention that the Variable Importance Scores of mid-segment and bottom-segment influencers range between 0.616 and 0.527 for NIM, while for ROA, the range is between 0.696 and 0.527. The FIS scores of explanatory variables for ROE are between 0.728 to 0.521. This indicates the relative strength of the 14 variables impacting the three profitability measures is close. At the same time, the strength of the top segment influencers across three profitability measures ranges between 0.894 and 0.637 for NIM, 0.972 and 0.686 for ROA and 0.968 and 0.684 for ROE.
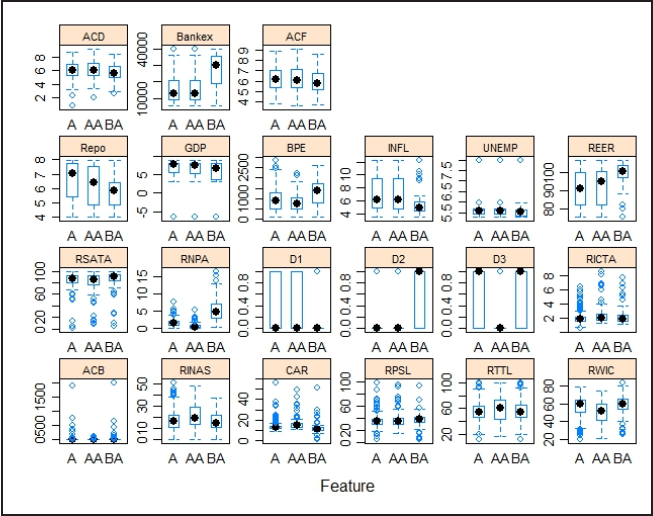
Feature selection technique for identifying the variables of importance also lends support to the study’s basic premise. The differences in the results of several studies could be due to the differences in the study period and the distributional aspect of variables across countries. This is vindicated in the present study across the three profitability measures at varying performance levels of above average, average and below average performance levels by meticulously looking at a distributional pattern of variables depicted in the box plots shown in Appendix 2(a)–2(c). The observed variation in the subclasses of each variable made it further relevant to analyse the relationships amongst variables based on the classification algorithm.
Conclusion
Taking the implications of banking sector reforms, technological, legislative and institutional changes, recurrent economic and policy shocks, and the swirling macro-economic environment for bank profitability in India into consideration, the present study intended to trace the critical determinants of bank profitability using ML classification algorithms such as ‘random forest’. The study used RBI data on domestic and commercial banks from 2005 to 2022. In contrast to previous studies, this study used a more extended period of data and an ML algorithm and defined profitability from a multidimensional perspective. It used three different measures of profitability, NIM, RoA and RoE, as the dependent variables and classified them into three categories, above average, below average and average, based on their quartiles. It used 21 explanatory variables, of which 12 are bank-specific, six are macroeconomic and three are policy variables. The study found that bank-specific factors such as the ratio of intermediation costs to total assets, capital adequacy ratio, BPE and the ratio of NPAs to total assets are the major determinants of NIM. Apart from the bank-specific variables, the policy variables such as bank ownership, that is, public vs private, and the ratio of priority sector lending to total lending are a few other essential determinants of NIM.
On the contrary, the macro-economic variables such as inflation, secondary share market activity with regards to banking stock (Bankex) and Real Effective Exchange Rate (REER), and policy variables such as demonetization (captured through dummy) are the significant determinants of RoA. Of course, apart from these macro-economic and policy variables, a few bank-specific variables (Almaqtari et al., 2018; Mohanty & Sarkar, 2020), like the ratio of NPAs to total assets, capital adequacy ratio and BPE, are the critical determinants of RoA. Study results across the globe over different time horizons appear to concede that banks’ productivity and performance substantially suffer owing to higher NPAs, which may eventually precipitate to economic downturn (De Bock & Demyanets, 2012; Kadioglu et al., 2017). The determinants of RoE are pretty similar to that of RoA. Succinctly, NIM is mainly influenced by bank-specific factors, while the macroeconomic and policy variables primarily influence the RoA and RoE. Pertinently, the proportion of NPAs to total assets and BPE are two such bank-specific determinants that play a crucial role for all the three dimensions of profitability considered here, that is, NIM, RoA and RoE. From a policy perspective, it implies that addressing the issue of NPAs, especially that of the public sector banks, will improve their profitability. Of course, the central government has recently recapitalized the public sector banks-only time will tell its impact on their profitability. However, as BPE represents the labour productivity in a bank, it will improve with better technology adoption. Indeed, automation dictated by artificial intelligence (AI) will significantly improve the banks’ profitability in India. Nevertheless, macroeconomic stability and policy consistency can hardly be neglected.
Limitations and the Way Forward
Despite the aforesaid policy implications, the study has a few limitations. The set of variables chosen to explore the profitability determinants of Indian banks is exhaustive. However, due to the paucity of data, it has yet to incorporate variables to capture the other essential factors such as developmental commitments, financial fragility, quality of lending, locational advantages, etc. Further, the study period spans from 2005 to 2021, although the banking sector reforms have started since 1993. Last but not least, the data set used for the study could be more balanced. Thus, future research should be comprehensive enough to address the above-mentioned limitations of data availability.
Description of the Variables.
Feature Selection for NIM Generated Using Boruta Package.
Feature Selection for ROA Generated Using Boruta Package.
Feature Selection for ROE Generated Using Boruta Package.
Box Plots Showing the Variations of the Three Sub-classes of all the Independent Variables for NIM Generated Using Caret package.
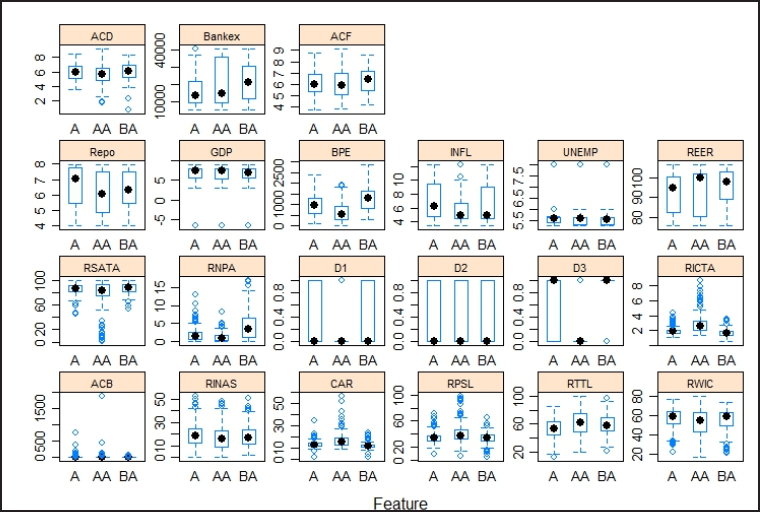
Box Plots Showing the Variations of the Three Sub-classes of all the Independent Variables for RoE Generated Using Caret Package.
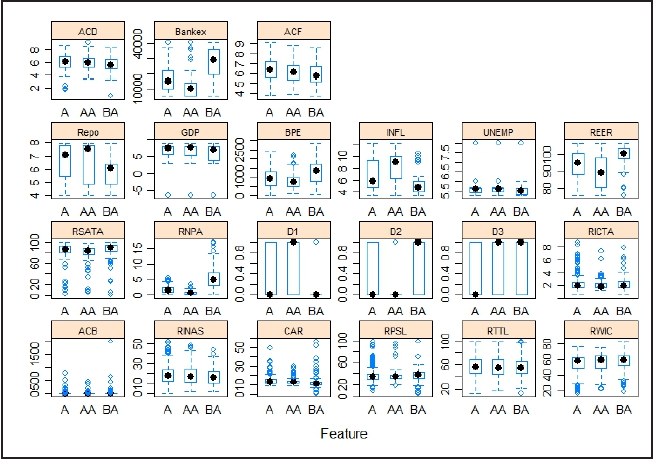
Box Plots Showing the Variations of the Three Sub-classes of all the Independent Variables for NIM Generated Using Caret Package.
Footnotes
Acknowledgement
The authors are grateful to the journal’s anonymous referees for their extremely useful suggestions to improve the quality of the article. Usual disclaimers apply.
Declaration of Conflicting Interests
The authors declared no potential conflicts of interest with respect to the research, authorship and/or publication of this article.
Funding
The authors received no financial support for the research, authorship and/or publication of this article.