
Abstract
This article investigates the dynamic connectedness between non-fungible tokens (NFTs), cryptocurrencies and conventional currencies using an innovative approach to R2 decomposition. We test volatility spillovers and the transmission of shocks across assets by decomposing the connectedness into its contemporaneous and lagged components. The database ranges from March 2020 to December 2023, considering several global situations: the COVID-19 pandemic, the 2021 cryptocurrency bubble, the war in Ukraine and the crash of cryptocurrencies in 2022. Our results suggest that the cryptocurrency and NFTs markets are the primary net volatility emitters, having a significant and immediate impact on the traditional currency market. In contrast, most traditional currencies act as net receivers, primarily adopting a shock-absorbing behaviour rather than shock transmission. The results show that the majority of volatility spillovers are contemporaneous, accompanied by small lagged effects. This research provides important insights into the increasingly essential role of digital assets in the global financial system, particularly regarding their influence on volatility transmission between markets.
Introduction
Today, financial markets are already at a new stage of development, associated with the emergence of new blockchain-based assets, including cryptocurrencies, Decentralized Finance (DeFi) and non-fungible tokens (NFTs). These are new kinds of assets, different in their nature and structure, which develop in some specific segments of the financial markets, while their response to changes and dynamics of traditional markets differs. Each of these technologies, born in the last decade, has come like a bomb into traditional economic models, offering new opportunities never seen before, which have allowed for portfolio diversification and at the same time challenged centralized structures of the global financial system. The above dynamic certainly reaches a higher plane of interest when considering the economic crises of the world, such as those brought about by the COVID-19 pandemic, which really made investors find new paths toward securing and maximizing returns.
Cryptocurrencies represent a real financial revolution. They have been introduced since the year 2009 with the launching of Bitcoin (BTC). The cryptocurrency market opened new investment horizons, and finally changed our perception and use of money. Investing in cryptocurrency opens the scope for investors to diversify from traditional investment options like stocks and bonds. This is all about investment opportunities; it also enhances the independence of financial users. Cryptocurrencies have created a global financial ecosystem where every individual from any part of the world is able to participate, being a developer, investor or user and contribute to investment and more people participating in financial markets for the accrual of wealth. There are several digital assets in the cryptocurrency market, with the leading currencies being BTC, Ethereum (ETH), Ripple and Binance Coin. This cryptocurrency range is highly traded and identified as digital assets that boast huge liquidity and are growing in adoption by investors and traders across the world. BTC is dominant in this market not only for its leading position in market capitalization but also as a cryptocurrency that has offered potential gains to many investors. Therefore, it dominates because it manages to maintain a top position through high diffusion, enhanced security and integration into institutional investment strategies. This is why it is often known, within the crypto space, as ‘store of value’ and at one point found itself being touted as digital gold. ETH boasts about its smart contract functionality, including multiple applications in DeFi. Ripple focuses on cross-border settlements but with speed, whereas Binance Coin is the native cryptocurrency of the Binance platform, one of the leading cryptocurrency exchanges globally. The market of cryptocurrencies is still characterized by extreme volatility and the formation of speculative bubbles. These assets have also conveyed tremendous sensitivity to worldwide events, particularly in the COVID-19 pandemic, a period that has underlined their potential for protection against uncertainty while exposing associated risks of instability.
From a risk management perspective, many empirical analyses—for instance, by Bouri, Jalkh, et al. (2017) and Bouri, Molnár, et al. (2017) have underlined the essential role played by BTC in portfolio diversification. Particularly, these works have shown how BTC, being poorly correlated with traditional financial markets, may represent a hedge against exogenous shocks and extreme movements in stock markets. It thus turns out to be a very powerful tool in risk management, thereby reducing any kind of potential losses when the economy is facing high volatility, especially in times of global economic crises. Given the diversity of this market, be it in leading cryptocurrencies such as BTC, ETH, Ripple and Binance Coin, or of secondary importance, a complex interrelationship does exist among these different cryptocurrencies. Qureshi et al. (2020) examined the dynamics of interdependencies among these cryptocurrencies, finding mostly unpredictable relationships whereby fluctuations within major cryptocurrencies affect those of secondary coins and vice versa, hence creating a complex spillover network of co-movements.
On the contrary, DeFi is a rediscovery of those very conventional financial activities into their digital and intermediary-free versions. Driven by blockchain technology, via decentralized applications and protocols, DeFi enables a set of financial services that are open and accessible to all beyond geographical and institutional constraints. It has introduced possibly one of the largest innovations in the form of alternatives to traditional financial services such as loans and insurance, completely excluding centralized intermediaries in the process. DeFi has completely changed the way investors interact with financial markets, and their utility in portfolio diversification is already widely recognized, not to mention crises like the COVID-19 pandemic, which accelerated the usage of these decentralized services. With the inclusion of a wide variety of products and services, such as lending, borrowing, decentralized exchange and yield farming, DeFi offers open financial opportunities to anyone anywhere in the world. As stressed by Yousaf, Abrar, et al. (2023), Yousaf, Pham, et al. (2023) and Yousaf, Riaz, et al. (2023), DeFi is increasingly viewed as a diversifier within the cryptocurrency asset class, but also has proven to be an asset class unto itself, offering a hedge against the risks inherent in cryptocurrency markets. Besides, the level of correlation of DeFi in respect of global macroeconomic events and/or government policies is very low. It suggests that it does not share a close link with traditional financial institutions. The only good thing with this is that this level of resilience in DeFi makes it safer avenue in case of systemic vulnerabilities. This resilience has been proven by Corbet et al. (2022, 2023).
During the evolution of DeFi and cryptocurrencies, a favourable environment emerged in which new digital assets appeared, such as NFTs. It is said that it is one of the sections within this area that grows quickly, something that was pointed out by Bouri et al. (2022). Contrary to cryptocurrencies, which are fungible and interchangeable, this class of token represents unique assets, often employed as a means to represent digital objects such as artworks, collectibles or other rare virtual content. The rise in their appeal has received a serious boost from their astronomic rise in the digital art market, but also from their quickly growing use as investment vehicles, especially as diversifiers in portfolios. Indeed, NFTs contain certain attributes that determine their uniqueness from other forms of asset. They could represent everything from digital artworks, videos and audio clips to virtual goods within online games, tickets to exclusive events, intellectual property rights and even titles of ownership for physical goods. Besides that, several specialized sub-markets for NFTs are emerging to focus on specific kinds: CryptoPunks, Axie Infinity, Decentraland, NBA Top Shot and Art Blocks NFTs. As was pointed out by Bao and Roubaud (2021), most of the assets are on the ETH blockchain to maximize the transparency and security of deals. They change hands on special platforms such as OpenSea, Rarible, SuperRare, Nifty Gateway and Decentraland. This opens up an active and developing environment in the realm of digital assets, where the user purchases, sells or exchanges unique digital assets.
The risk behaviour of conventional currencies, cryptocurrencies and NFTs differs significantly due to their underlying mechanisms, market dynamics and volatility. If traditional currencies are relatively stable because they are backed by central banks and governments, and because they are subject to inflation, government policy changes and economic shifts, cryptocurrencies are known for extreme price volatility (Bouri, Jalkh, et al., 2017). Their value can change dramatically in short periods due to speculative trading, market sentiment or regulatory news. However, the market value of NFTs can be highly volatile, driven by trends, social media influence and speculation, with little inherent value outside of demand (Apostu et al., 2022).
All these assets have experienced continuous growth, both in terms of transaction volume and risk management, particularly during periods of crisis and uncertainty such as the COVID-19 pandemic, the 2021 cryptocurrency bubble, the war in Ukraine and the crash of cryptocurrencies in 2022. They are now perceived as effective portfolio diversification tools, offering risk reduction. These crises have led to increased demand for digital art and, by extension, NFTs, due to lockdowns and remote work. These events have played a significant role in the rise of NFTs (Alam et al., 2023), which has benefited from changes in consumer and investor habits. In rethinking their portfolio structure, investors have integrated more safe-haven assets, such as BTC, which has demonstrated its informational efficacy (Fernandes et al., 2022; Wu et al., 2021). In times of uncertainty, BTC has established itself as a resilient asset, providing protection against financial shocks. Simultaneously, NFTs have acted as risk absorbers during crises, demonstrating a capacity to withstand shocks comparable to that of gold and the dollar, which have traditionally been used to hedge against risks during critical periods. The pandemic thus changed investors’ behaviour and strengthened the role of digital assets in risk management. NFTs started to be perceived not just as collectibles but as sound financial assets, serving as an equivalent to traditional safe-haven assets in times of high volatility. This review, therefore, covers three of the largest emerging markets: cryptocurrencies, DeFi and NFTs what each is, their origin, and the incredible velocity at which they are evolving. These financial innovations are put to the test in light of their central role assigned in portfolio diversification as a function of their respective performances and resilience in the face of economic crises, particularly the COVID-19 pandemic. This review, however, will emphasize how these markets have managed not only to survive but have become attractive and strong alternatives in conditions of great uncertainty; therefore, they offer an investor an opportunity for more diversification and protection from the volatility within the traditional financial markets.
Against this backdrop, the present study investigates in detail the structure of individual characteristics for three kinds of markets: the NFT market represented by MANA, THETA and XTZ; the traditional currency market including EUR, JPY, AUD and GBP; and the cryptocurrency market with BTC, ETH, BNB and XRP; a study which, to our knowledge, has not been carried out before by researchers. It will be an in-depth analysis, using the recent quantile connectivity approach based on the quantile vector autoregression (Q-VAR) model, of the dynamic interconnection of such markets in normal conditions as well as during extreme events. While traditional methods of linear regression do not provide this opportunity, the Q-VAR model does offer analysis peculiar to each quantile of the distribution. It thus opens a way to get insights into nonlinear dependencies and dynamic effects of shock transmission across different segments.
This, in turn, provides the methodology of the underlying article with special relevance for understanding how the interlinkages between such markets switch over under different conditions-operating at bullish, bearish or neutral levels of different quantiles. The purpose of this analysis is to identify how those assets react to changes in market conditions through an examination of the transmission of shocks, as well as asset behaviour in various phases of the market. The result of such research will weigh considerably in the understanding of global financial dynamics and will help explain dynamic interrelations among the claims of different types of financial assets, also hinting at whether these relationships have grown stronger or weaker under specific circumstances. Further, this interconnection will be decomposed to distinguish between the contemporaneous contribution, that is, immediate interlinkages, and the lagged contribution, which considers the effects of the interlinkages after some delay. This temporal analysis will allow for the investigation of the shocks and the identification of the underlying mechanisms of this transmission.
These motivations are based on the need for an in-depth study of the interaction of three key markets: NFTs, conventional currencies and cryptocurrencies. Since the Q-VAR model is quantile-specific, this research is unique in its ability to conduct non-linear dynamic and shock transmission investigations between these markets at various states. One of the key goals is to ascertain which variables emit a shock in net terms and which receive a shock in net terms. This would provide an excellent understanding of information flows and volatility across these assets. Moreover, the decomposition into contemporary and lagged contributions will be allowed by the immediate and delayed impact of the interconnections between these markets. More specifically, this study will combine the relationships between NFTs and traditional currencies and the one between NFTs and cryptocurrencies under one analysis, a matter that had not been addressed by researchers before. The dual perspective given would provide insight into the dynamics of inter-markets, and that itself would be a valuable lesson for investors who are interested in diversifying their portfolios in a rapidly changing financial environment.
This research is organized into several major sections. Section 2 assesses a literature review with the aim of analyzing previous studies related to the field. Section 3 reports the methodology on which this study relies by presenting its theoretical and empirical framework. Afterwards, Section 4 provides the empirical results by underlining the main insights from our analysis. Section 5 outlines a robustness test. Finally, the article concludes with all the results summarized and a discussion on the theoretical and practical implications of this research, mentioning suggestions for further work.
Literature Review
This review covers three of the largest emerging markets: cryptocurrencies, DeFi and NFTs. Indeed, the contributions of this review are threefold. First, it will emphasize how these markets have managed not only to survive but have become attractive and strong alternatives in conditions of great uncertainty; therefore, it offers investors an opportunity for more diversification and protection from the volatility within the traditional financial markets. Second, it will provide insights into the complex and dynamic nature of these markets so as to understand how different studies that adopt similar statistical and econometric methodologies come up with diversified results for the various markets under study. Third, it will provide a critical comparison of the reviewed literature with works that apply similar methodologies to analyze the dynamic connectedness between these three kinds of assets.
Applications range over time-varying parameter vector autoregression (TVP-VAR), Markov-switching vector autoregression (MS-VAR) and Q-VAR. Basically, these models are popular for capturing the dynamic interaction of financial assets with each other through time. Such a model quantifies the shocks between such assets and how these relationships have changed in the contexts of evolving economies. Indeed, that is particularly relevant in the field of digital assets such as cryptocurrencies, NFTs and DeFi, which are much influenced by highly volatile market conditions. A TVP-VAR model, analyzed by Aharon and Demir (2022), proved the dynamic connection between NFTs and other asset classes while at the same time examining stocks, bonds, currencies, gold, oil and ETH during COVID-19 stress periods. The results show that NFTs behave as a risk absorber in times of economic stress, thus stabilizing portfolios, and as net risk emitters under more normal circumstances. Using a TVP-VAR model, Ante (2022) emphasizes that shocks in BTC prices increase the sale of NFTs, signalling interdependence between those markets. The shocks of ETH, on the other hand, decreased the active wallets, thus meaning a high sensitivity of the NFT market regarding this cryptocurrency, which is one of the most important blockchains for this kind of operation. Apostu et al. (2022) apply a classical vector autoregression (VAR) to study the interplay between NFT and cryptocurrency prices. Their study has shown the volatility and responsiveness of NFT concerning cryptocurrencies, especially ETH, which serves as a bridge between the two assets. Based on the findings, a causal effect of the NFT price on that of ETH exists, but NFTs do not have a considerable effect on the other cryptocurrencies. Furthermore, the correlations between the price of NFTs and that of traditional assets are very low, making NFTs an extremely interesting portfolio diversifier. These divergences in the results of the different studies using VAR models and their extensions can be explained through several elements. The periods under analysis also vary: Aharon and Demir (2022) focus on the COVID-19 period, Ante (2022) does so between January 2018 and April 2021, while Apostu et al. (2022) focus on the period ranging from September 2020 to February 2022. Ante (2022) focuses on NFT-specific variables, such as sales and active wallets, while Aharon and Demir (2022) examine the connectivity of NFTs with a wide panel of traditional assets.
While the first three articles analyzed the TVP-VAR and classic VAR models, this study looks at another extension: Corbet et al. (2022) introduce the MS-VAR model in establishing the key drivers of DeFi token prices by analyzing the influence of BTC, ETH and investor attention measured by Google Trends. The results point out that there is a strong bidirectional relationship between DeFi tokens and investor attention, especially in bear markets, thereby underlining that attention is a substantial factor for DeFi token prices. The extension of this analysis by considering TVP-VAR, classic VAR and MS-VAR models is followed by the Q-VAR model, an application of which is one that considers connectivity across different quantiles between stocks, tokens and other financial asset classes. The results indicate that this class of assets exhibits variable connectivity with traditional financial assets at extreme quantiles. Whereas at high quantiles, they act like transmitters of the shocks to the other markets, thereby causing contagion, at low quantiles, they become shock receivers. On the other hand, gold and treasury bonds emerge as a key transmitters of the shocks, indicating migration towards safe assets during crises. The Q-VAR model was considered by Naveed et al. (2025) in investigating the statistic and dynamic connectedness between NFTs and the Association of Southeast Asian Nations (ASEAN) equity markets. If the static connectedness results reveal a moderate level of connectedness, the dynamic results indicate that total connectedness fluctuates over time. These authors argue that the way NFTs are integrated into the ASEAN market is unique, which has significant implications for investors looking to adjust their portfolios over time to achieve optimal diversification.
Wavelet analysis is a very powerful tool to explore the dynamic relationships in several financial assets along the two dimensions: time and frequency. In fact, by using this approach, one can uncover how the different correlations or coherence of the assets has changed over time and detect the periods and frequencies at which their interactions might be stronger or weaker. It is particularly useful for the study of assets whose relationships can be non-linear, such as NFTs and cryptocurrencies, which may be susceptible to exogenous events such as market shocks or economic crises. Specifically, wavelet coherence analysis was performed in the study of Umar et al. (2022) and that of Dowling (2022) to study the temporal relation of NFTs with other asset classes. However, their findings are going to vary according to different assets and time horizons being studied. Whereas Umar et al. (2022) focus on the relationship between NFTs and stock, bond and cryptocurrency during COVID-19. They observe a remarkable increase in the short-term coherence, which may indicate that in those periods of turmoil, NFTs and these assets move together, presumably in response to macroeconomic uncertainty. This increased synchronization is particularly strong at higher frequencies—that is, short-term—which suggests that investors rebalance their portfolios very quickly in reaction to market volatility. Another study by Dowling (2022), though, focuses solely on the relationship between cryptocurrencies (BTC and ETH) and NFTs. Whereas the findings of Umar et al. (2022) present otherwise, Dowling (2022) finds that the volatility transmission between these two markets is relatively limited; thus suggesting weak long-term interconnection. On the other hand, the author does identify synchronized movements during specific periods, probably linked to speculative events or general market declines, which hint that temporary interactions might exist between these two markets, especially during bubble or correction periods. Thus, though both studies use similar wavelet analysis techniques, Umar et al. (2022) stress a higher short-run synchronization of NFTs with other assets in pandemic times, while Dowling (2022) underlines a kind of relative decoupling of cryptocurrencies from NFTs with respect to the transmission of volatility, with spillover effects, if any, materializing only in specific periods.
The differences in the outcomes of the two articles relate to several factors, including the respective periods and economic contexts under study. Indeed, Umar et al. (2022) focus on the COVID-19 pandemic period, marked by global financial turmoil. It is within this framework that the linkages between assets had been amplified since investors who faced enhanced uncertainty responded to it with portfolio adjustments in a more harmonious manner. This dynamic, of course, created greater short-run coherence in returns, as found by their results. By contrast, Dowling (2022) assesses a longer period largely defined by fewer significant crises, whereby substantial periods of time even saw relatively stable markets. This is indicative of the more usual dynamic whereby NFTs and cryptocurrencies do not show linkages over a long period. The latter is thus strongly predisposed to maintain a close relationship with these assets only under certain market conditions; it tends to have a higher synchronization during crisis periods and reduced interconnections during stability phases.
The Granger causality analysis is widely used for testing if one variable can support the forecast of another variable, which enables one to detect a causal link between two time series. For example, Apostu et al. (2022) use this approach to prove that NFT prices depend on the prices of cryptocurrencies, especially ETH, but nothing works in reverse. On the other hand, Ante (2022) also uses this approach within the TVP-VAR model to show that the BTC price shocks increase the number of sales in NFT markets. The bottom line of the studies conducted by Apostu et al. (2022) and Ante (2022) coincides in the influence taken by cryptocurrencies on the NFT market. Apostu et al. (2022) point out that the prices for NFT are dependent on changes in cryptocurrencies, ‘essentially Ethereum’, while Ante (2022) has already managed to show that changes in the price of BTC drive NFT sales. Together, these findings would point out an increasing interdependence between cryptocurrencies and NFTs, with movements of cryptocurrency markets now having great potential eventually to shake up the dynamics of the NFT market.
The comparison of these articles provides an understanding that, despite the great interest in cryptocurrencies, DeFi and NFTs, many of the studies use similar methodologies or extensions of the same models. However, their results turn out to be fundamentally different depending on the assets analyzed and on the more specific contexts of markets and periods considered. Diversity underlines the interest in differential approaches to understand the complex relationships established for these emergent markets, which will further help investors and researchers in the field of digital assets arrive at important insights.
Materials and Methods
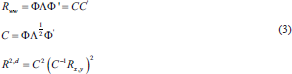
The approach of R2 decomposition, in cases where the variables are interrelated, is usually analyzed, especially in very complex contexts such as financial markets and economic relationships. The dynamics accorded by this method amplify interaction over time between these different variables. Perhaps one of the most important strengths of the R2 approach is in its ability to detect dynamic relationships, thus decomposing variable effects on others at different points in time—both contemporaneous and lagged—thereby showing how one variable may affect another, not only during the current period but also in later periods. Besides, R2 is an approach that summarizes contemporaneous and lagged contributions to the variance of a target variable as a way of measuring the strength of links between variables, hence allowing the identification of which variables significantly influence others. Finally, it is possible to test the robustness of the results obtained by using R2 as an indicator of the goodness of fit for the models to make sure that the conclusions reached about the relationship existing among the different variables are reliable and valid. This method was chosen over more traditional approaches, such as Granger causality tests or standard VAR models, for several reasons. First, Granger causality tests are primarily designed to detect lagged effects and are limited in capturing the contemporaneous interdependencies that often exist in financial markets. VAR models, while capable of modelling dynamic relationships, require careful variable ordering and may not be well suited to high-dimensional systems or time-varying analysis. In contrast, the R2 decomposition approach, especially when implemented using the generalized forecast error variance decomposition (GFEVD), is invariant to variable ordering and allows for the measurement of dynamic, directional spillovers in a time-varying framework. This makes it particularly appropriate for our analysis, which focuses on understanding the evolving nature of interconnected risks and returns among the studied assets.
The Model
To examine the propagation mechanism across the different uncertainty indices, we employ the newly R2 decomposed connectedness approach of Balli et al. (2023). The choice of this approach is driven by its ability to discriminate/split between contemporaneous and lagged connectedness.
To formally present the approach, we begin by defining a VAR(q) model with contemporaneous impacts:

where
Instead, the sketched representation is expressed as:

where
where
The former (S–1) values of
Based on the connectedness approach of Diebold and Yılmaz (2012, 2014),

According to Balli et al. (2023), the TCI can be expressed in terms of contemporaneous

Lastly, based on the same principle, the total directional connectedness TO and FROM others; and the net total directional connectedness metrics can be expressed as:


While
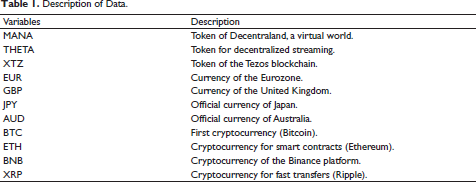
We are exploring the quantile connectivity between NFTs, traditional currencies and cryptocurrencies. We use MANA, THETA and XTZ to represent NFTs. For traditional currencies, we have EUR, GBP, JPY and AUD. Finally, we consider BTC, ETH, BNB and XRP to represent cryptocurrencies (Table 1). The sampling period runs from 6th March 2020, to the end of December 2023, providing 1,291 observations sourced from Yahoo Finance and Investing.com. Given the heterogeneous nature of these asset classes, appropriate preprocessing steps were applied, including log-return transformations. During this time, several global events had a significant impact on investors in NFTs, cryptocurrencies and traditional currencies, such as the COVID-19 pandemic between March 2020 and the end of 2022, the 2021 bubble, increased regulations, the war in Ukraine and the 2022 cryptocurrency crash. In the modelling process, we differentiate between asset classes based on their inherent risk profiles. NFTs and cryptocurrencies, characterized by higher volatility and speculative trading behaviours, are treated as more reactive to short-term market shocks. In contrast, traditional currencies, which are generally influenced by macroeconomic fundamentals and monetary policies, exhibit lower volatility and different risk transmission mechanisms. Although all assets are integrated into the connectedness framework under a unified methodology, their interpretation considers these fundamental differences. Additionally, robustness checks are performed to assess whether these assets serve as risk transmitters or receivers under various market conditions.
Description of Data.
Description of Data.
Figure 1 shows the price trends of NFTs, traditional currencies and cryptocurrencies from 6th March 2020 to 14th December 2023. We can see that the period with the highest volatility and the biggest price changes for cryptocurrencies and NFTs is from early 2021 to the first quarter of 2022. This period is marked by noticeable price increases and decreases, mostly explained by the impact of the COVID-19 pandemic, which affected prices, especially for NFTs and cryptocurrencies. The pandemic boosted the adoption of cryptocurrencies and NFTs as alternative assets to the traditional financial system. The demand for digital assets like BTC, ETH, BNB and XRP grew significantly. At the same time, NFTs saw a massive rise starting in 2021, with people investing in these unique digital assets, especially in the fields of art and gaming, during the pandemic. We also see that from the beginning of the sample period until the first quarter of 2021, there is an upward trend in prices, especially for the EUR, GBP and AUD currencies, showing an appreciation of these three currencies. This appreciation can be explained by central banks’ response to the COVID-19 pandemic, particularly through the expansionary monetary policies implemented by the US Federal Reserve (Fed), the European Central Bank (ECB) and other central banks, which injected large amounts of liquidity into the economy. However, over time, these policies had consequences for the three currencies, which worsened with the rise of alternative assets like NFTs and cryptocurrencies in 2021. We then see a downward trend in the prices of the euro, the British pound (GBP) and the Australian dollar (AUD), indicating a depreciation of these currencies as these alternative assets grew. This downward trend can be explained both by the consequences of the policies adopted during the COVID-19 period and, significantly, by the rise of the NFT and cryptocurrency markets, as well as by the behaviour and sentiments of investors in response to these changes.
Daily Price Series.
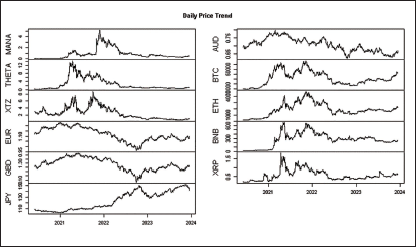
This analysis provides an overview of the part of the curve that shows the most fluctuations and volatility. However, by digging deeper and looking at the period-by-period changes in chronological order, we see several sub-events that impact the prices of the three market categories: the NFT market, the traditional currency market and the cryptocurrency market. We observe that 2021 had a significant impact on the three types of NFTs as well as on the four main cryptocurrencies. This is due to the cryptocurrency bubble, where BTC, ETH, BNB and XRP reached historic highs. At the same time, the NFT market boomed with record sales in digital art, gaming and collectibles, leading to an exponential increase in transaction volumes on platforms like OpenSea. On the other hand, for traditional currencies, we see a downward trend in 2021, largely due to a change in investor behaviour, as they shifted to alternative assets to diversify their portfolios. Over time, and more specifically at the beginning of 2022, with the war in Ukraine, we see a downward trend in prices across the three market categories: NFTs, cryptocurrencies and traditional currencies. This downward trend became more pronounced for the cryptocurrency and NFT markets due to the crypto crash in 2022, where major cryptocurrencies lost a significant portion of their value. The NFT market also experienced a decline in transaction volumes and values, mainly due to excessive speculation around NFTs and new regulations introduced during this period. This 2022 crash, which greatly affected the values of cryptocurrencies and NFTs, ultimately made traditional currencies more attractive by the end of the year, and led to an increase in demand for traditional currencies during this crisis.
Finally, in the last year of the sample, which is 2023–2024, the major global economies have reached a certain level of macroeconomic stability after the major disruptions caused by the COVID-19 pandemic and the war in Ukraine. More cautious monetary policies and interventions by central banks have helped stabilize traditional currencies. This stability is reflected in all the curves for 2023–2024.
Let us move to a more reliable analysis by converting price series into return series. This involves calculating the difference between consecutive prices to obtain the return series. This approach aims to ensure the stationarity of the data, which means achieving a more stable behaviour over time. This allows for a thorough assessment of risks and volatility, making investment decisions more relevant. Figure 2 shows the return series for each variable in the three markets during the sampling period. We see that all the series become stationary, with a constant mean, meaning they fluctuate around the average and a constant variance σ2 that varies within a defined range. Within this range, we can identify periods of high and low volatility, reflecting a clustering of return volatility. This coincides with major events such as the COVID-19 pandemic, the war in Ukraine, the cryptocurrency bubble, the explosion of the NFT market, the cryptocurrency crash and more.
Daily Return Series.

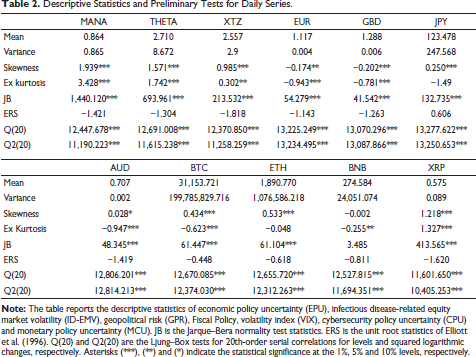
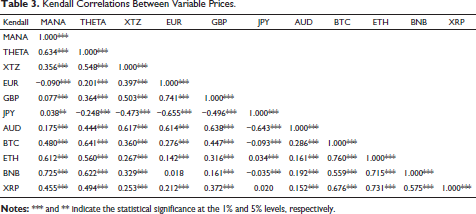
Table 2 presents the summary statistics and preliminary tests for the daily price series of NFTs, traditional currencies and cryptocurrencies, allowing for a comparative analysis of their statistical properties. First, looking at mean values, cryptocurrencies such as BTC and ETH exhibit significantly higher average prices compared to NFTs like MANA and THETA and traditional currencies like EUR, GBP and JPY, indicating the generally higher valuation of cryptocurrencies. In terms of variance, cryptocurrencies and NFTs demonstrate much higher volatility, as evidenced by the large variance values for BTC, ETH and THETA, in contrast to the relatively stable variance of traditional currencies such as the EUR and GBP. When it comes to skewness, both NFTs and cryptocurrencies exhibit positive skewness, particularly MANA and THETA, indicating that their price distributions are more likely to experience large upward movements. On the other hand, traditional currencies, such as EUR and GBP, show negative skewness, suggesting more frequent smaller gains but occasional large losses. This contrast highlights the difference in risk profiles between traditional currencies and digital assets. Furthermore, the excess kurtosis values for NFTs and cryptocurrencies are notably positive, especially for MANA and THETA, suggesting fat-tailed distributions with more frequent extreme price changes. This is in sharp contrast to traditional currencies like the EUR and GBP, which have negative kurtosis, indicating less extreme price movements and distributions closer to normality. The Jarque–Bera (JB) test confirms this pattern, as all assets except BNB show significant deviation from normality, with NFTs and cryptocurrencies displaying the greatest departures. In addition, the ERS unit root test results suggest that all the series are likely non-stationary, implying that their prices follow a random walk and do not revert to a long-term mean. The Ljung–Box Q(20) and Q2(20) tests further reveal significant autocorrelation in both price levels and squared returns across all assets, though this effect is more pronounced in cryptocurrencies and NFTs, reflecting the strong influence of past price movements on future behaviour. Lastly, Kendall’s correlation coefficients highlight strong positive correlations within asset classes, such as between THETA and MANA, as well as among traditional currencies like EUR and GBP (Table 3). Interestingly, there are weaker but still positive correlations between cryptocurrencies and traditional currencies, such as between BTC and EUR, indicating some interconnection, although these relationships are less robust compared to the stronger correlations observed within each market type. Conversely, JPY shows negative correlations with other traditional currencies and NFTs, reflecting its role as a safe-haven currency during periods of market volatility. Overall, this comparison reveals the distinct behaviours of these markets, with digital assets showing greater volatility and correlation within their asset class, while traditional currencies exhibit more stability but weaker cross-market relationships.
Descriptive Statistics and Preliminary Tests for Daily Series.
Kendall Correlations Between Variable Prices.
To investigate the connectedness between the considered uncertainty indices, we employ the novel R2 decomposed connectedness approach proposed by Balli et al. (2023). The empirical investigation begins by scrutinizing the averaged connectedness measures. Next, we present the dynamic connectedness measures.
Averaged Connectedness Analyses
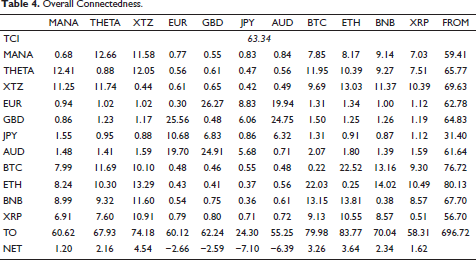
Overall Connectedness.
Overall Connectedness.
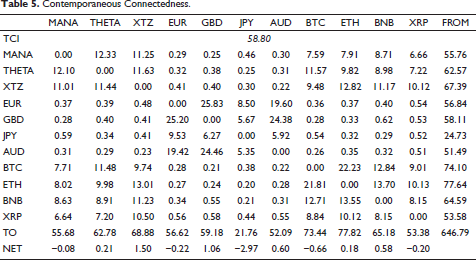
Contemporaneous Connectedness.
Lagged Connectedness.
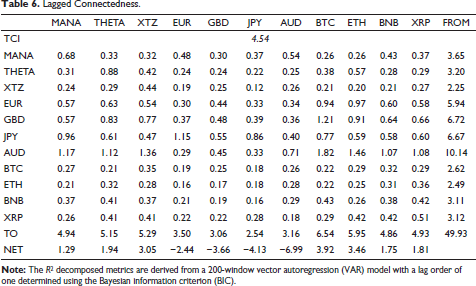
In all, from the three tables in the results, we note that variable connectivity amounts to 63.34%. For the most part, this is due to immediate connectivity—that is, in t—which reaches a value of 58.80%, while the share of connectivity following t periods reaches only 4.54%. That seems to mean that connectivity is higher in the present compared to the future and increases even more following any given event. This fact is reflected in the ratio that expresses the propagation of conditional total connectivity relative to total connectivity. We can see that, for all variables, this ratio is less than 100%, which implies that total connectivity is considerably greater than conditional total connectivity. The disparate magnitudes of this ratio are largely due to contemporaneous contributions rather than lagged contributions, thus suggesting that variables strongly and instantaneously respond to external shocks. This suggests that most of the decisions and adjustments in the system take place in response to current events or information. Contemporaneous connectivity dominates over lagged connectivity in this system, which may indicate that the system is more sensitive to immediate rather than delayed effects of shocks. Alternatively, the impact of the time course of the shock does not persist and does not show persistence in the impact on other variables. Hence, though unstable within the short period, the system shows an ability to return to the point of equilibrium within a minimum period.
Generally, the three kinds of NFTs and the four types of cryptocurrencies are regarded as net shock transmitters since they transmit shocks to the traditional currency market, perceived as a net shock receiver. This gives a general idea about how each variable affects others and its role in the network. Now, when decomposing this propagation among the different variables, it is obvious that their behaviours will be consistent in only the lagged contribution among the three markets. In other words, the overall contribution is like that obtained after a certain delay. On the contrary, contemporaneous contribution reflects the shift in asset behaviour. MANA will be a net shock receiver at time t, while GBP and AUD are net shock transmitters; BTC and XRP, on the other hand, will become net shock receivers. This dynamic reflects the complexity of relationships in financial markets, particularly between digital assets and traditional currencies. This would be because, in the immediate short term, such assets are highly volatile and sensitive to any new information. In the immediate short run, investors behave emotionally and react instantly. On the other hand, in the long run, reactions are more rational and logical, being based on the economic fundamentals underlying such activity. The immediate effects, then, disappear as the situation returns to one of greater balance.
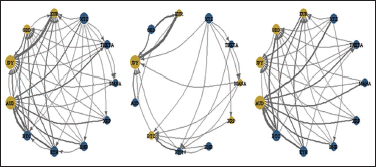
Additionally, we present the averaged global, contemporaneous and lagged connectedness measures in Figure 3. It shows the network plot of the connectedness between NFTs, cryptocurrencies and traditional currencies concerning overall (left panel), contemporaneous (central panel) and lagged (right panel) connectedness. This plot helps describe how the assets are integrated with one another and how various shocks transfer from one asset to another, either simultaneously or with a time lag, thus representing total, contemporaneous and lagged spillovers. First, it appears that cryptocurrencies, especially ETH and BNB, are the main net transmitters of volatility throughout the period studied meaning that their price movements have strong and simultaneous impacts on the prices of other assets, including traditional currencies and NFTs. This is reflected in the strong connections visible in the contemporaneous network. This is particularly evident in real-time connectedness, as cryptocurrencies are highly volatile and immediately influence other markets, which strengthens the overall connectedness. Similarly, assets like NFTs (THETA and XTZ) are mainly net transmitters of shocks. In contrast, currencies like EUR and JPY are primarily net receivers of shocks. These two currencies are more reactive to external volatility, acting as shock absorbers for other markets rather than as transmitters of volatility. This is evident in the contemporaneous network, where these two traditional currencies immediately respond to shocks from cryptocurrencies (ETH and BNB) and NFTs (THETA and XTZ). However, the overall level of connectedness is significantly lower in the lagged network, suggesting that delayed volatility transmission is less relevant in this system. Cryptocurrencies, on the other hand, show a relatively weaker lagged connectedness, confirming that their impact is mainly contemporaneous. By integrating both contemporaneous and lagged effects into an overall network, we observe that cryptocurrencies and NFTs position themselves as net transmitters, while traditional currencies emerge as net receivers of shocks. This confirms the central role that cryptocurrencies and NFTs play in the volatility dynamics of the global financial system.
Network Plot: Overall (Left), Contemporaneous (Centre) and Lagged (Right).
Given the potential for averaged connectedness measures, we extend the analysis to explore dynamic connectedness. Figure 4 presents the dynamic total connectedness of the system, depicting a decomposition of how connectedness evolves over time between NFTs, cryptocurrencies and traditional currencies. The black line is the overall total connectedness, the red line is contemporaneous connectedness and the green line is lagged connectedness. Over the sample period, the overall dynamic total connectedness swings widely, and the variations pinpoint the differing volatilities of spillovers across asset classes. Peaks in the overall connectedness coincide with major events in the world: the COVID-19 pandemic in 2020, the cryptocurrency bubble and subsequent crash in 2021–2022, and the war in Ukraine at the beginning of 2022. Each event was followed by increased volatility across NFTs, cryptocurrencies and traditional currencies, which in turn raised the level of connectedness in the system. As most spillovers in volatility are almost immediate, the red line showing contemporaneous connectedness usually mirrors the overall connectedness. That would be a reasonable indication that any shock at any time to an asset class, say, cryptocurrencies, would quickly affect other asset classes, especially in this period of high volatility. This result confirms the one found by Naveed et al. (2025) in their study focusing on dynamic connectedness between NFTs and the ASEAN equity markets and demonstrating that the system integration amplifies during COVID-19 and the Russia–Ukraine conflict.

To illustrate, during the 2021 cryptocurrency bubble, contemporaneous connectedness soared, meaning that cryptocurrency price fluctuations had a real and profound instantaneous effect on the entire financial system, including NFTs and traditional currencies. Lagged connectedness, plotted by the green line in the figure, is rather stable and considerably lower than contemporaneous connectedness during the sample period. It means that most spillovers in the system happen contemporaneously, while the rest of the volatility is transmitted through time. Whereas there are periods of increased lagged connectedness—for example, after the crash of cryptocurrencies in 2022—these appear quite minor compared to contemporaneous effects, suggesting that delayed responses to market shocks play a minor role in the overall system. In sum, Figure 4 is indicative of the dynamic nature of volatility spillovers between NFTs, cryptocurrencies and traditional currencies. Major events in these markets have, therefore, driven fluctuations in connectedness. The cryptocurrency market plays a leading role in transmitting shocks to other asset classes, at least in real time. This limited role of lagged connectedness suggests that the financial system is more reactive to immediacy rather than being driven by delayed responses to past volatility.
Figure 5 describes the time-varying net total directional connectedness between NFTs, cryptocurrencies and traditional currencies. The above measure would enable us to comprehend how assets position themselves as net transmitters or net receivers of volatility at different instants. The decomposition of this estimate into its contemporaneous and lagged connectedness parts further illustrates how shocks propagate instantly and over time through the system. Preliminary evidence of Figure 5 reveals the dynamic and asymmetric nature of shock transmission across asset classes. Among all other asset classes, cryptocurrencies, including BTC and ETH, turn out to be the dominant net volatility transmitters through contemporaneous connectedness, implying that price movements within these two cryptocurrencies have a very immediate and considerable effect on other assets in the general financial system. On the other hand, NFTs such as the THETA and XTZ, along with conventional currencies like EUR and GBP, tend to be net receivers of shocks in general. They themselves tend to absorb the volatility from the system during times of greater market turmoil, reinforcing their relatively more reactive role than that of cryptocurrencies. Furthermore, while the overall contribution from lagged connectedness is smaller, some assets—especially traditional currencies and NFTs—do show shock-absorbing evidence with a delay, indicating that some volatility spillovers in fact happen really with a delay. These findings underline the increasing role of cryptocurrencies as volatility transmitters across both digital and traditional markets; whereas their real-time impact has been the most important, the reaction of traditional assets to such shocks is more gradual.

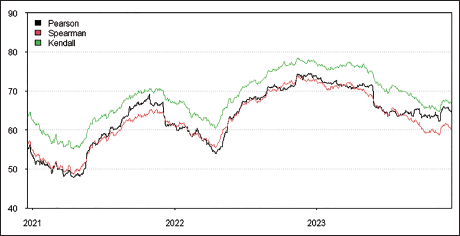
In the interest of the robustness of our results, we performed a robustness analysis using the R2 decomposition method as a means of gauging the sensitivity of the results under different assumptions using alternative measures of correlation. The result gives evidence that the pattern of curves of the Pearson, Spearman and Kendall correlation coefficients just run together up and down; when the Kendall correlation coefficient goes up, the other two increase and vice versa (Figure 6). However, it must be outlined that the Kendall coefficient curve is represented in green and often appears above those from Pearson and Spearman. This being higher would therefore suggest that the correlation in our study is more robust and stronger. What it means is that the relationship described by the variables under study is consistent across different measures of correlation, with the Kendall coefficient capturing even more nuances, thereby enhancing the reliability of our conclusions.
Robustness Analysis: Dynamic Total Connectedness.
The aim of this article is to investigate the connectedness between NFTs, cryptocurrencies and traditional currencies considering volatility transmission and shock spillovers. We decompose contemporaneous and lagged connectedness via the R2 decomposition approach, hence offering a more detailed view of how the assets interact over various time horizons. The results suggest that cryptocurrencies—which are mainly representatives of BTC and ETH—are indeed continually net transmitters of volatility that significantly shock both NFTs and traditional currencies. While digital currencies act as pure net transmitters, traditional currencies like EUR and JPY are net receivers, cushioning the shocks and remaining stable against extreme volatility from digital assets. On the contrary, NFTs fall into a special category—they can be both transmitters and receivers depending upon situations, which shows the future role they may come to play in financial markets. We also notice that contemporaneous connectedness overwhelmingly dominates lagged connectedness; thus most of the spillover of volatility occurs because of instantaneous rather than extended period horizon. The implication is that market participants—mostly those in the digital asset space move very quickly to respond to shocks. This would, therefore, imply that these markets bear a stamp of high sensitivity and integration. Events like the COVID-19 pandemic, the cryptocurrency bubble in 2021, and the crash in 2022 further amplify these spillovers and show how systemic events set the dynamics of connectedness. While the R2 decomposition approach has considerable merit, the incorporation of several time series presents overparameterization problems that could affect forecast reliability. Future studies can work on the limitation of the approach by embedding methods such as Lasso or Ridge regression to improve the stability and accuracy of the estimates. Besides that, regime-switching models or further advanced machine learning methods can enhance our knowledge of nonlinear dynamics and delayed shock impacts in these markets. The contribution of the study to literature reveals the dynamic and asymmetric nature of interconnections that develop within and across different types of financial assets. This information is likely of special importance to investors and policymakers when trying to work out portfolio diversification and risk management strategies in a world where financial interconnectivity is gaining pace. Future work may extend this analysis to other fledgling asset classes or peer inside cross-market linkages in greater detail as part of the path to global financial stability.
Footnotes
Acknowledgement
The authors extend gratitude to all for their invaluable contributions that significantly enhanced the quality of the article.
Authors’ Contribution
Declaration of Conflicting Interests
The authors declared no potential conflicts of interest with respect to the research, authorship and/or publication of this article.
Ethical Declaration
The authors abide by all the ethics involved in this academic work and have not submitted it to any other journal.
Funding
The authors received no financial support for the research, authorship and/or publication of this article.