
Abstract
This study examines the volatility dynamics of eight major stock market indices using a comprehensive set of parametric and semiparametric generalized autoregressive conditional heteroskedasticity (GARCH) models, including long-memory variants such as fractionally integrated GARCH (FIGARCH) and fractionally integrated log-GARCH (FI-Log-GARCH). The research utilizes daily closing values from January 2004 to April 2025 to identify the most effective models for forecasting value at risk (VaR) and expected shortfall (ES) by evaluating their performance through backtesting methods, including traffic light tests and the weighted average distance (WAD) selection criterion. The findings reveal that semiparametric models, particularly Semi-FIGARCH, outperform traditional parametric models in capturing asymmetric effects and long-memory properties in financial time series data. These models provide more accurate and robust volatility forecasts, especially during periods of market turbulence. The study underscores the importance of incorporating advanced volatility models into risk management frameworks to enhance financial stability and decision-making in global markets. The insights derived from this research offer practical implications for investors, risk managers and regulators, emphasizing the need for adaptable and comprehensive volatility modelling techniques in financial markets.
Keywords
Introduction
The study of financial market volatility has long been a cornerstone of financial economics, with profound implications for risk management, portfolio optimization and regulatory frameworks. The ability to accurately model and forecast volatility is crucial for financial stability and decision-making in global markets. Among the various methodologies developed to capture the dynamics of financial market volatility, the generalized autoregressive conditional heteroskedasticity (GARCH) family of models has emerged as particularly prominent. These models have been instrumental in understanding the time-varying nature of volatility and its clustering behaviour, where periods of high volatility tend to be followed by more high volatility and vice versa (Bollerslev, 1986; Engle, 1982).
However, despite the advancements in GARCH modelling, several challenges persist. Traditional GARCH models often assume a constant volatility structure, which may not fully capture the complexities and asymmetries observed in real-world financial data (Bauwens et al., 2012; Iseringhausen, 2020; Petrozziello et al., 2022; Yoldas, 2023). Moreover, the presence of long-memory processes in financial time series, where the impact of past volatility decays slowly over time, has been documented but not adequately addressed by standard GARCH models (Arouri et al., 2012; Baillie et al., 1996; Baillie & Bollerslev, 1991; Dark, 2024; Kirman & Teyssiere, 2002; Saâdaoui & Rabbouch, 2024). These limitations highlight the need for more sophisticated models that can better capture the intricacies of financial market volatility.
The quest for models that accurately capture these complex dynamics is ongoing. Seminal work by Zumbach (2003) demonstrated that incorporating long memory through a multi-component volatility structure could provide a systematic improvement over GARCH(1,1) and describe data across multiple time horizons. Subsequent research has continued to explore long memory within the GARCH framework, often using intraday data to enhance forecasts (Duppati et al., 2017) and extending multivariate systems with features like asymmetries and long memory for improved accuracy (Karanasos et al., 2021). More recently, the field has seen a surge in hybrid approaches that combine the strengths of GARCH-type models with the pattern recognition power of machine learning, such as long short-term memory (LSTM) networks, to achieve significant gains in forecasting performance (Kim & Won, 2018; Kumar et al., 2025; Léber & Egyed, 2025). Furthermore, the integration of external sentiment data and heavy-tailed distributions has been shown to refine volatility and value-at-risk (VaR) forecasts substantially (Basira et al., 2024; Léber & Egyed, 2025).
This study aims to address these gaps by exploring the application of parametric and semiparametric GARCH models, including long-memory variants such as the fractionally integrated GARCH (FIGARCH) and fractionally integrated log-GARCH (FI-Log-GARCH) models. By comparing the performance of these models, we seek to provide a more comprehensive understanding of the volatility dynamics of stock market indices. The analysis covers a diverse set of indices from different geographical regions and economies, ensuring a robust and generalizable set of findings. Furthermore, this study addresses the asymmetric impact of positive and negative shocks on volatility, a critical aspect often overlooked by traditional models. By incorporating leverage effects and skewness, we aim to develop models that more accurately reflect the behaviour of financial markets during periods of high volatility, such as financial crises and pandemics.
The main objective of this study is to compare the performance of various parametric and semiparametric GARCH models in capturing the volatility dynamics of stock market indices. The selection of the eight stock market indices1 was guided by several key considerations. First, these indices represent a diverse set of geographical regions and economies, including developed markets (e.g., USA, Germany, Japan) and emerging markets (e.g., Brazil). This diversity ensures that our findings are generalizable and applicable to a wide range of market conditions. Second, the selected indices are among the most widely followed and traded globally, making them highly relevant for investors, policymakers and researchers. Third, these indices exhibit varying levels of volatility and sensitivity to global economic events, allowing us to assess how different markets respond to shocks and uncertainties.
By including these indices, our study captures a broad spectrum of market behaviours, from highly liquid and stable markets to more volatile and emerging ones. This diversity allows us to provide a comprehensive analysis of volatility dynamics and to identify patterns that may not be evident in studies focusing on a single market or region. Specifically, we aim to accomplish the following: Assess the impact of long-memory processes on the modelling of financial market volatility. Evaluate the asymmetric effects of positive and negative shocks on volatility.
To guide the research process, we have developed the following research questions: how do parametric and semiparametric GARCH models compare in capturing the volatility dynamics of stock market indices? What is the role of long-memory processes in modelling financial market volatility? How do positive and negative shocks asymmetrically impact volatility, and how can these shocks be incorporated into GARCH models?
While numerous studies have explored long-memory and asymmetric effects in stock market indices, this study distinguishes itself by providing a comprehensive comparison of both parametric and semiparametric GARCH models, including advanced long-memory variants such as FIGARCH and FI-Log-GARCH. Unlike previous research, which often focuses on either parametric or semiparametric approaches in isolation, this study integrates both methodologies to offer a more robust analysis of volatility dynamics. Additionally, the study introduces semiparametric long-memory models (e.g., Semi-FIGARCH), which have not been extensively explored in the literature. These models are shown to outperform traditional parametric models, particularly in capturing the complexities of financial market volatility during periods of high uncertainty, such as the 2008 financial crisis and the COVID-19 pandemic. Furthermore, this study emphasizes the practical implications of these models for risk management and regulatory frameworks, providing actionable insights for investors and policymakers. By combining advanced modelling techniques with a diverse set of stock market indices from different geographical regions, this research offers a more nuanced understanding of volatility dynamics, filling a critical gap in the existing literature.
The contributions of this study are twofold. First, it provides a comprehensive comparison of various GARCH models, highlighting the strengths and weaknesses of each in capturing the volatility dynamics of stock market indices. By analyzing the performance of standard GARCH, asymmetric power ARCH (APARCH), exponential GARCH (EGARCH), FIGARCH, FI-Log-GARCH and their semiparametric counterparts, this study offers a detailed assessment of how well these models can capture the complexities and asymmetries observed in real-world financial data. This comparative analysis not only identifies the most effective models for different market conditions but also underscores the limitations of traditional GARCH models in fully capturing the intricacies of financial market volatility.
Second, it offers practical insights into the use of these models for risk management and regulatory purposes, emphasizing the importance of considering long-memory processes and asymmetric effects. The study demonstrates that incorporating long-memory properties and accounting for the asymmetric impact of positive and negative shocks can significantly enhance the accuracy and robustness of volatility forecasts. These findings have direct implications for financial market regulators, investors and risk managers, providing them with tools to better anticipate and manage market risk, especially during periods of high volatility, such as financial crises and pandemics. By highlighting the necessity of considering alternative GARCH models and long-memory processes, this study contributes to the development of more effective risk management practices and regulatory frameworks.
The methodology employed in this study involves applying various GARCH models to the daily closing values of eight stock market indices, with the number of observations ranging from 3,678 to 5,435 trading days, spanning from January 2004 to April 2025. The models include standard GARCH (1,1), APARCH (1,1), EGARCH (1,1), FIGARCH (1,d,1), FI-Log-GARCH (1,d,1) and their semiparametric counterparts. The models are fitted via the ‘rugarch’ function of the R package proposed by Ghalanos (2014) and the ‘arima’ function of the R package proposed by the R core team in 2013. The 1-day rolling forecasts were also obtained via these packages.
The results of this study have the potential to significantly impact the broader field of financial economics by providing more accurate and robust models for capturing the volatility dynamics of financial markets. This, in turn, can lead to improved risk management practices, more effective portfolio optimization strategies and enhanced regulatory frameworks.
The remainder of the study is organized as follows: Section 2 presents the literature review, focusing on key developments in GARCH modelling and their applications to stock market indices. Section 3 describes the materials and methods used in the study, including a detailed description of the data and the econometric models employed. Section 4 discusses the empirical results of the GARCH model estimates for the stock market indices and provides a discussion of the findings, highlighting the key trends. Section 5 presents the conclusions and policy implications of the study, along with limitations and suggestions for future research. Section 6 explores the managerial implications of the findings.
Literature Review
The modelling of financial market volatility is a crucial research area in financial economics, with significant implications for risk management, portfolio optimization and regulatory frameworks. This literature review focuses on key developments in GARCH modelling and its variants, emphasizing their application to stock market indices and their ability to capture the complex dynamics of market volatility. Table 1 provides a concise summary of relevant studies.
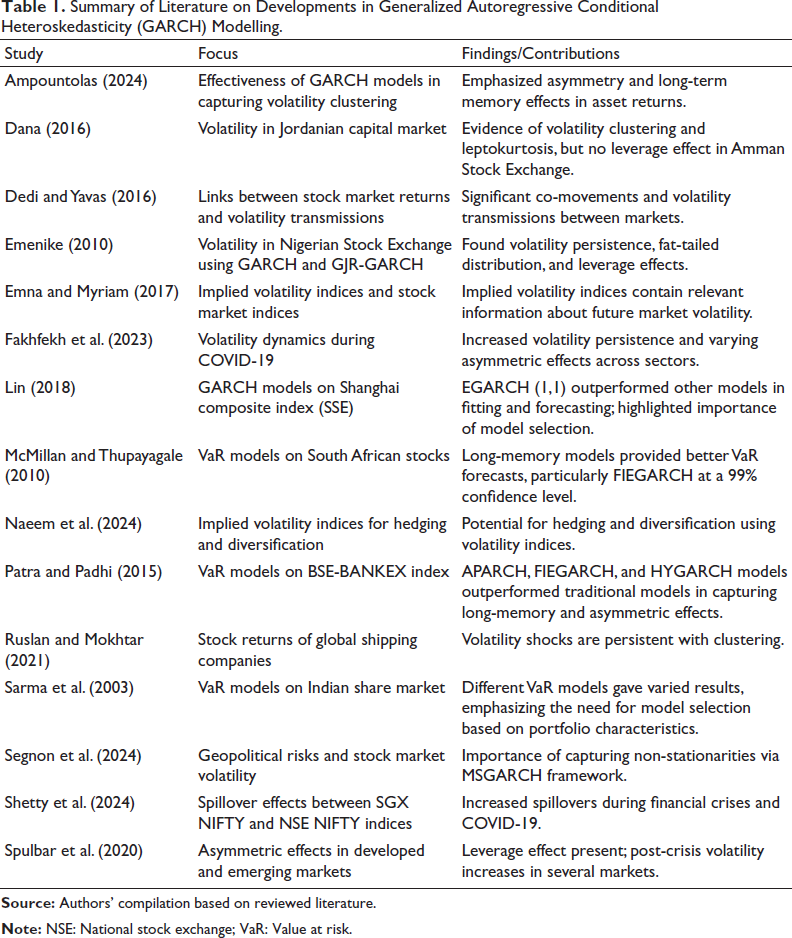
Summary of Literature on Developments in Generalized Autoregressive Conditional Heteroskedasticity (GARCH) Modelling.
Summary of Literature on Developments in Generalized Autoregressive Conditional Heteroskedasticity (GARCH) Modelling.
Based on this synthesis, we test: H1: Semiparametric GARCH models (e.g., Semi-FIGARCH) yield more accurate volatility forecasts than parametric versions, particularly during crises. H2: Long-memory processes (d > 0.5) significantly improve VaR/ES predictions across both developed and emerging markets. H3: Negative shocks increase volatility disproportionately (γ > 0 in APARCH), with effects amplified in high-uncertainty periods.
Data Descriptions
The data used in this study were sourced from Yahoo Finance, a reliable and publicly accessible platform for financial information. The data set includes daily closing prices of eight major stock market indices: the DAX 40, CAC 40, Nasdaq Composite Index, Nikkei 225, IBOVESPA, Dow Jones Industrial Average, UK 100 and Russell 2000. The analysis period spans from 1 January 2004 to 1 April 2025, covering a total of 3,678–5,435 trading days, depending on the index. The daily closing prices of the eight stock market indices used in this study are presented in Appendix A (Figure A1).
The choice of this analysis period is justified for several reasons. First, it encompasses a wide range of market conditions, including periods of economic stability, growth and major crises such as the 2008 financial crisis and the 2020 COVID-19 pandemic. These events are critical for assessing the ability of GARCH models to capture volatility dynamics during times of heightened stress (Aït-Sahalia et al., 2011). Additionally, the extended period allows for the examination of long-memory effects in time series data, which is essential for models like FIGARCH and FI-Log-GARCH.
The selected indices were chosen for their representativeness of diverse geographical regions and economies. They include developed markets (such as the USA, Germany, Japan and the UK) and emerging markets (such as Brazil). This geographical and economic diversity ensures that the results are generalizable and applicable to a broad range of market conditions. Furthermore, these indices are among the most widely followed and traded globally, making them highly relevant for investors, policymakers and researchers.
Daily return series were calculated using the following formula:
where
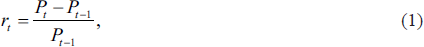
Figure 1 displays the daily return series of eight major stock market indices from January 2004 to April 2025, highlighting the volatility dynamics and market behaviours over time. Each subplot represents the evolution of returns for a specific index, providing insights into periods of heightened volatility and market stability. The GDAXI (DAX 40, Germany) and FCHI (CAC 40, France) exhibit significant fluctuations, with notable spikes during the 2008 financial crisis and the 2020 COVID-19 pandemic, reflecting increased market turbulence. The IXIC (Nasdaq Composite Index, USA) and N225 (Nikkei 225, Japan) show similar patterns, with pronounced volatility during these periods, underscoring the global impact of economic crises. The BVSP (IBOVESPA, Brazil) demonstrates even greater volatility, characteristic of emerging markets, while the DJI (Dow Jones Industrial Average, USA) mirrors the trends of other US indices, with clear spikes during crises. The BUK100P (Borsa Istanbul 100, Turkey) exhibits moderate volatility compared to others, though still influenced by global economic stress. The RUT (Russell 2000, USA) shows heightened volatility, particularly among small-cap stocks, reflecting their sensitivity to market conditions. Overall, Figure 1 illustrates volatility clustering, where periods of high volatility tend to follow one another, emphasizing the need for dynamic volatility modelling to capture these complex market behaviours effectively (Francq & Zakoian, 2019).
The statistical analysis of financial asset returns, as detailed in Appendix A (Descriptive Statistics), reveals a distribution centred around zero with heavy tails, as illustrated by the histogram. The Q–Q Plot indicates deviations from normality, particularly at the extremities, suggesting that the returns do not perfectly adhere to a normal distribution. The autocorrelation function (ACF) of the returns shows an absence of significant autocorrelation, which is typical for financial returns. However, the ACF of the squared returns reveals significant autocorrelation, indicating the presence of volatility clustering, where periods of high volatility tend to follow one another. These findings are consistent with the common characteristics of financial returns and can be utilized for volatility forecasting models, such as GARCH models.
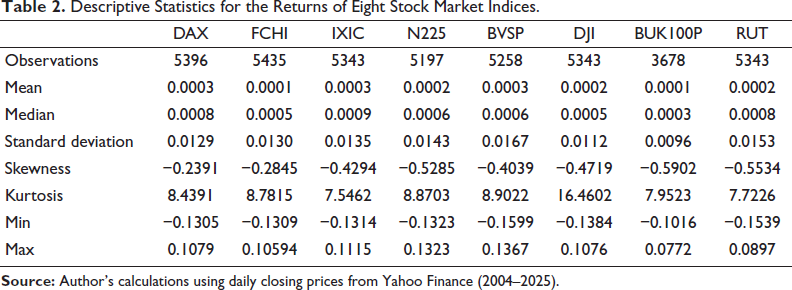
Table 2 presents the mean, median, standard deviation, skewness, kurtosis, minimum and maximum values for each index. These statistics reveal distinct characteristics for each index, such as higher volatility for the BVSP and RUT indices and negative skewness for most indices, indicating a tendency towards more frequent or extreme negative returns. The high kurtosis values suggest distributions with fatter tails than normal, implying a higher probability of extreme events.
Descriptive Statistics for the Returns of Eight Stock Market Indices.
This study employs various econometric models to analyze the volatility dynamics of stock market indices. The models used include standard GARCH (1,1), APARCH (1,1), EGARCH (1,1), FIGARCH (1,d,1), FI-Log-GARCH (1,d,1) and their semi-parametric counterparts. The choice of these models is motivated by their ability to capture different aspects of financial market volatility. The standard GARCH (1,1) model is a foundational approach that assumes a constant volatility structure and is widely used for its simplicity and effectiveness in capturing basic volatility clustering (Gaunersdorfer & Hommes, 2007). The APARCH (1,1) model extends the GARCH framework by incorporating asymmetric effects, allowing for a more nuanced understanding of how positive and negative shocks differently impact volatility (Gupta, 2023). The EGARCH (1,1) model further refines this by using a logarithmic transformation, which ensures that the conditional variance remains positive and captures the leverage effect more robustly (Laurent et al., 2012).
The FIGARCH (1,d,1) model is chosen for its ability to account for long-memory processes in financial time series, where the impact of past volatility decays slowly over time. This is particularly relevant for financial markets, where shocks can have persistent effects (Kirman & Tessier, 2002). The FI-Log-GARCH (1,d,1) model combines the advantages of the FIGARCH model with a logarithmic transformation, providing a more stable and accurate representation of long-memory volatility.
Additionally, the study includes semi-parametric counterparts of these models to address potential limitations of purely parametric approaches. Semi-parametric models offer greater flexibility by not relying solely on a fixed parametric structure, thereby allowing for a more adaptive and potentially more accurate capture of volatility dynamics. By comparing the performance of these models, the study aims to provide a comprehensive understanding of the strengths and weaknesses of each approach in capturing the complexities of financial market volatility.
The models are fitted via the ‘rugarch’ function of the R package proposed by Ghalanos (2014) and the ‘arima’ function of the R package proposed by the R core team in 2013. The 1-day rolling forecasts were also obtained via these packages. The backtesting results include the N1, N2, TES test statistics and WAD values for the eight models examined in this study. The models are compared based on traffic light tests2 and the WAD selection criterion proposed by Feng et al. (2020). This study aims to provide a comprehensive understanding of the volatility dynamics of stock market indices and to identify the best-performing models for forecasting the VaR and ES.
The methodology employed in this study involves the application of various GARCH models, including standard GARCH (1,1), APARCH (1,1), EGARCH (1,1), FIGARCH (1,d,1) and FI-Log-GARCH (1,d,1), as well as their semiparametric counterparts. These models are chosen for their ability to capture different aspects of financial market volatility, such as asymmetry, long memory and leverage effects. Detailed descriptions of the econometric models and their equations tailored to our return series are provided in Appendix A (Methodology and Model Equations).
Results and Discussions
In this section, the standard GARCH and APARCH models were fitted using the ‘rugarch’ function from the R package proposed by Ghalanos (2014), as well as the ‘arima’ function from the R package proposed by the R core team in 2013, with 1-day rolling forecasts obtained via these packages, while the semiparametric GARCH models were derived using the adapted kernel estimator of the conditional variance (Heiler & Feng, 1998).
Results
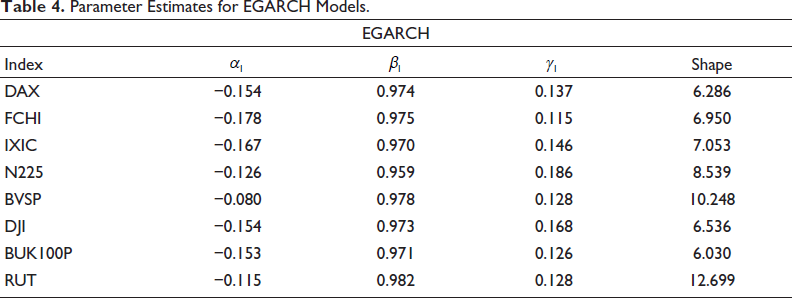
The estimates for the GARCH (1,1) model across the eight stock market indices range from 0.975 to 0.990. The parameter estimates for the GARCH and APARCH models are presented in Table 3, while those for the EGARCH model are shown in Table 4. For the APARCH model, the estimates range from 0.914 to 1.003, while the EGARCH model’s estimates lie between 0.800 and 0.887. All three models exhibit sums of
Parameter Estimates for GARCH and APARCH Models.
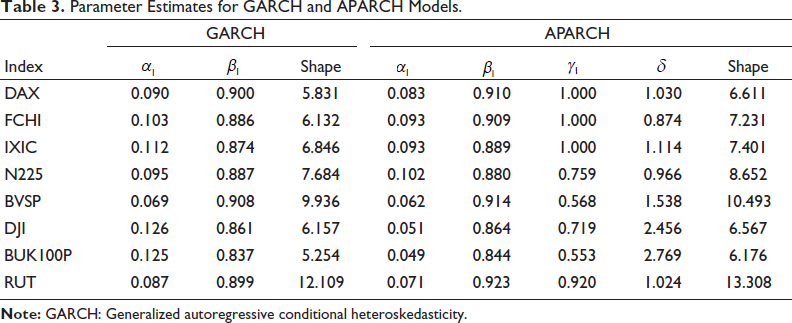
Parameter Estimates for GARCH and APARCH Models.
Parameter Estimates for EGARCH Models.
The leverage parameter (γ) for the APARCH model ranges from 0.60 to 1.0. Four return series exhibit a perfect leverage of 1, suggesting that a positive return in the previous period does not affect volatility. This finding is consistent with Engle and Ng (1993), who demonstrated the asymmetric impact of news on volatility. The asymmetry parameter of the fitted model indicates skewness in the return series, a common observation in financial markets as noted by Fakhfekh et al. (2016). The estimation results reveal that negative past returns are more volatile than positive past returns, irrespective of the slight differences in coefficients.
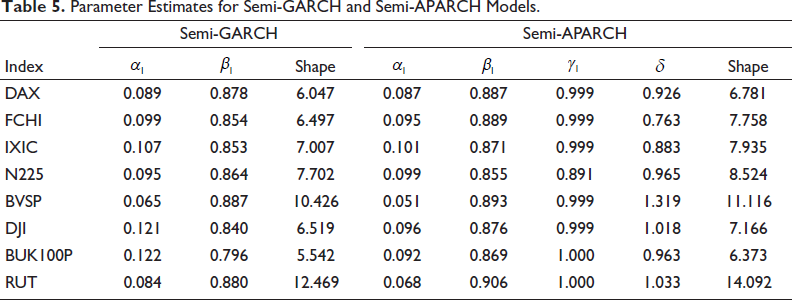
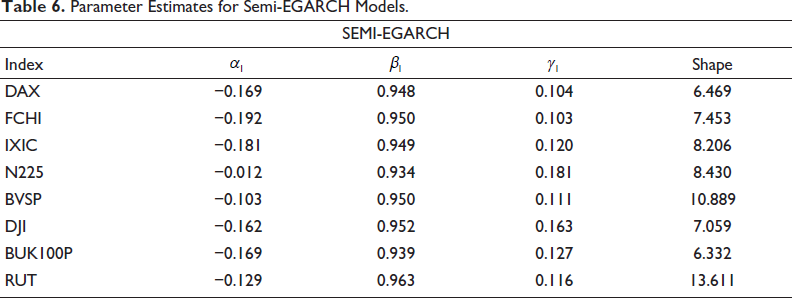
The sum of α and β for the Semi-GARCH, Semi-APARCH and EGARCH models ranges between 0.901 and 0.966, 0.941 and 0.978 and 0.728 and 0.835, respectively. Notably, the Semi-GARCH and Semi-APARCH models yield lower sums of α and β compared to the standard GARCH and general APARCH models. This supports the findings of Feng (2004), who argued that nonconstant scaling functions can lead to overestimation of
Parameter Estimates for Semi-GARCH and Semi-APARCH Models.
Parameter Estimates for Semi-EGARCH Models.
As a comparative study, we examine in detail the parameter estimates of the parametric long-memory GARCH models reported in this thesis. Table 7 summarizes the estimates for the FIGARCH (1,d,1) model and the FI-Log-GARCH (1,d,1) model. The FIGARCH model parameter estimates and their rolling 1-day forecasts are derived from the R package ‘rugarch’, whereas the FI-Log-GARCH model is estimated via the ‘fracdiff’ package integrated into R by Feng et al. (2023). For this model, we denote
Parameter Estimates for FIGARCH and FI-Log-GARCH Models.
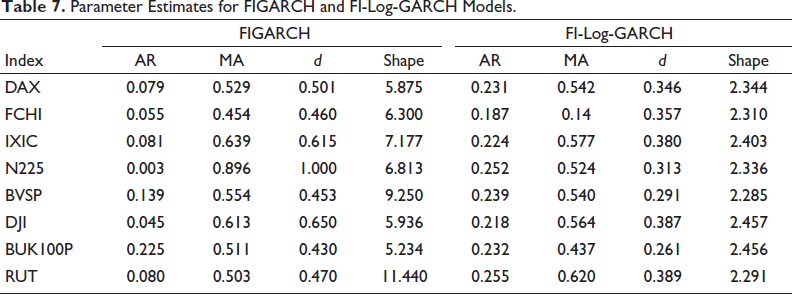
According to Table 7, the estimates of the FIGARCH (1,d,1) model for all stock return series range from
The estimates of the fitted FI-Log-GARCH (1,d,1) model range from [0.163 to 0.236] for
Table 8 shows the estimates for the Semi-FIGARCH and Semi-FI-Log-GARCH models. The Semi-FIGARCH model’s estimates of
Parameter Estimates for Semi-FIGARCH and Semi-FI-Log-GARCH Models.
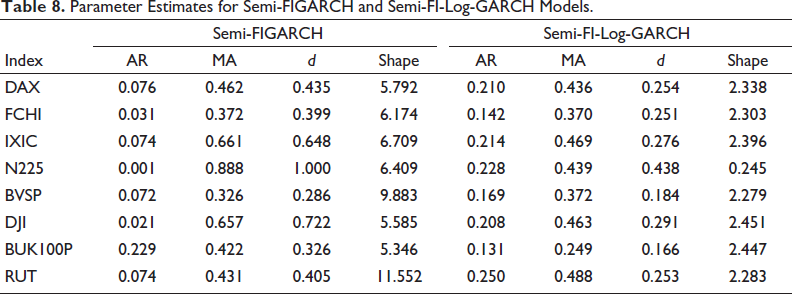
The Semi-FI-Log-GARCH model’s estimates of
In summary, both the Semi-FIGARCH and Semi-FI-Log-GARCH models show promising results in modelling the long-memory properties of stock market indices. The Semi-FIGARCH model has lower estimates of d except for the N225 index, whereas the Semi-FI-Log-GARCH model tends to be more stable. These findings align with previous research by Letmathe, Beran et al. (2021), which highlighted the flexibility and stability of semiparametric models in capturing long-memory effects in financial time series.
For each of the eight-return series, the fitted models are compared based on the backtesting results of their rolling 1-day forecasts of VaR and ES. The N1, N2 and TES test statistics, along with the WAD values for the eight models examined in this thesis, are presented in the tables below. A model is considered to have passed the traffic light test when its quantities (N1, N2 and TES) are all within the green zones indicated by the Basel Committee on Banking Supervision (BCBS). The most appropriate or accurate model for predicting VaR and ES is determined using the WAD selection criterion proposed by Feng et al. (2020).
Our analysis of the eight stock market indices revealed several interesting patterns in their volatility dynamics. For instance, the Nasdaq Composite Index and Russell 2000 Index exhibited higher volatility compared to other indices, reflecting their sensitivity to technology and small-cap stocks, respectively. This aligns with previous research showing that technology and small-cap sectors are more prone to rapid price fluctuations (Lin, 2018; Spulbar et al., 2020). The Nikkei 225 and DAX 40 showed strong reactions to global economic trends, such as the 2008 financial crisis and the COVID-19 pandemic. These indices experienced significant volatility spikes during these periods, highlighting their sensitivity to external shocks (Dedi & Yavas, 2016; Fakhfekh et al., 2023). The IBOVESPA Index, representing an emerging market, displayed unique volatility patterns influenced by commodity prices and domestic economic policies. This underscores the importance of considering local factors when analyzing volatility in emerging markets (Ruslan & Mokhtar, 2021).
These findings demonstrate that the selected indices provide a robust and diverse data set for studying volatility dynamics. By capturing a wide range of market behaviours, our analysis offers valuable insights into how different markets respond to shocks and uncertainties, contributing to a more nuanced understanding of global financial markets.
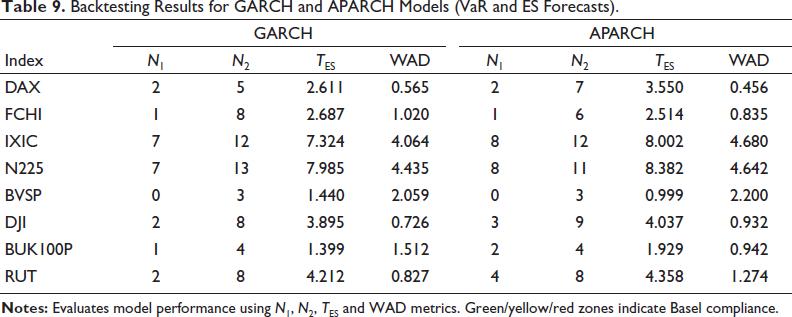
Tables 9 and 10 present the backtesting results for the fitted parametric short-memory GARCH models. In the case of the standard GARCH model fitted to the series of eight returns, the model is suitable for measuring inherent risk. The TES values of the different stock market indices do not exceed 5.7, which is the benchmark. All eight-return series are in the green zone, except for IXIC and BUK100P for the GARCH model (1,1), DJI for the APARCH model (1,1) and IXIC and BUK100P for the APARCH model (1,1). All these stock market indices are, in fact, in the red zone (N2 > 10), whereas only the N225 is in the yellow zone (N2 = 4) for the respective APARCH and EGARCH models. The stock market indices with the lowest WAD values are the FCHI for the GARCH (1,1) and EGARCH models and the DAX for the APARCH model (1,1).
Backtesting Results for GARCH and APARCH Models (VaR and ES Forecasts).
Backtesting Results for EGARCH Models (VaR and ES Forecasts).
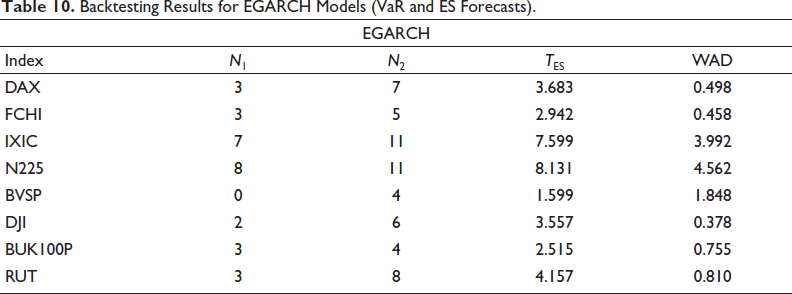
Table 11 presents the backtesting results of the semiparametric extensions of the standard GARCH, APARCH and EGARCH models. The results indicate that the return series of the eight stock market indices for these fitted semiparametric models are predominantly in the green zone
Backtesting Results for Semi-GARCH and Semi-APARCH Models.
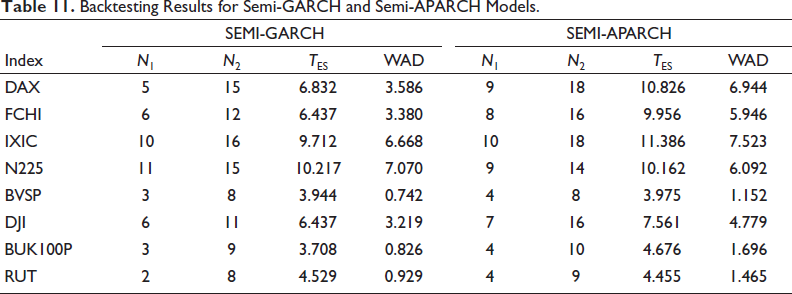
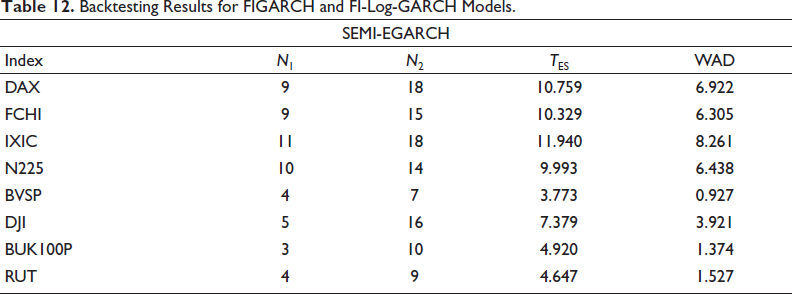
Table 12 provides the backtesting results for the SEMI-EGARCH models. The results show that the DJI and IXIC indices are in the red zone, indicating higher volatility and less accurate forecasts. The Semi-EGARCH model demonstrates competitive performance, with several indices showing low WAD values.
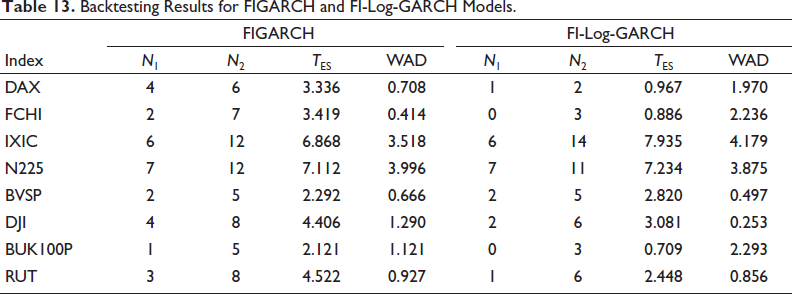
Backtesting Results for FIGARCH and FI-Log-GARCH Models.
Tables 13 and 14 compare the performance of the parametric long-memory FIGARCH and FI-Log-GARCH models. The FIGARCH model shows all return series in the green zone, passing the traffic light test with
Backtesting Results for FIGARCH and FI-Log-GARCH Models.
Backtesting Results for Semi-FIGARCH and Semi-FI-Log-GARCH Models.
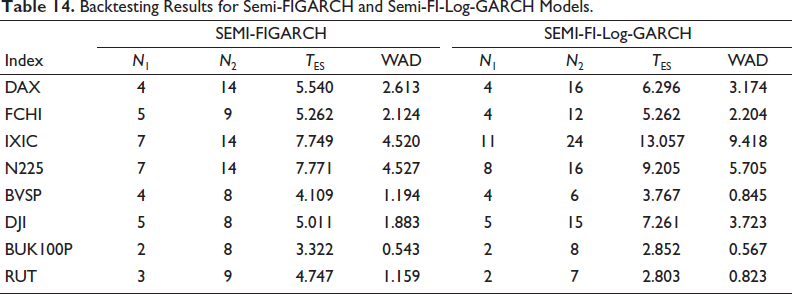
Table 14 compares the semiparametric FIGARCH and FI-Log-GARCH models. The Semi-FIGARCH model satisfies all traffic light test rules, unlike the Semi-FI-Log-GARCH model, which shows higher (TES) values for the IXIC and DJI indices. The Semi-FIGARCH model generally provides lower WAD scores, indicating better performance. This result is consistent with findings by Letmathe, Feng et al. (2021), emphasizing the effectiveness of semiparametric models in scenarios where parametric models fall short.
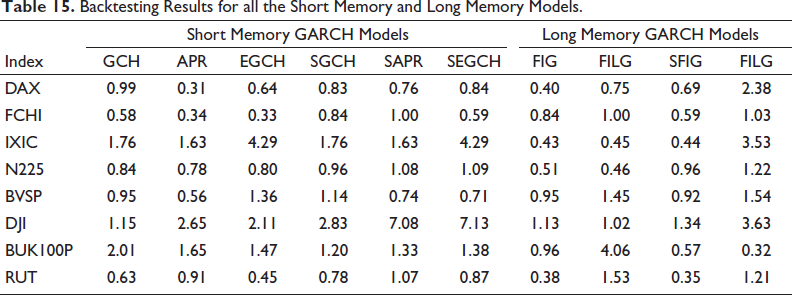
Table 15 summarizes the overall WAD scores for all eight models across the eight-return series. The parametric and semiparametric long-memory models, particularly the FIGARCH and Semi-FIGARCH models, outperform other models, with seven out of eight indices showing the best WAD values. This is followed by the parametric APARCH model. These results corroborate the findings of Letmathe, Beran et al. (2021). The detailed backtesting results for the VaR and ES forecasts, including the N1, N2 and TES test statistics, are presented in Appendix A (Backtesting (VaR and ES) Results in Figures).
Backtesting Results for all the Short Memory and Long Memory Models.
The results presented in the empirical section of this study reveal several trends in the context of GARCH model estimation for stock market indices. First, the unconditional variances of the fitted models are likely to vary over time, as the sum of
Second, the leverage parameter (γ) of the return series in the APARCH model is significant, with four return series having a perfect leverage of 1, which aligns with findings from Engle and Ng (1993) on the asymmetric impact of news on volatility. This finding indicates that negative shocks have a more substantial effect on the volatility of stock returns than positive shocks do, a well-documented stylized fact in financial markets. However, the contribution of yesterday’s negative return to today’s volatility is approximately twice that of a positive return for four stock market indices, a higher ratio than that reported in some previous studies. For example, Engle and Ng (1993) find that the ratio of the impact of negative and positive shocks on volatility is approximately 1.5.
Third, the parameters of the EGARCH model are significant, but the negative skewness effect persists. This is consistent with previous research, such as the study by Fakhfekh et al. (2016), who find that the EGARCH model does not fully capture the asymmetric volatility patterns observed in financial markets. The Semi-GARCH and Semi-APARCH models provide lower sums of α and β than the standard GARCH and general APARCH models do, which is consistent with Feng’s (2004) argument that a nonconstant scaling function can lead to an overestimation of β1 in the GARCH and APARCH models. The elimination of inconsistent variance from the stock indices leads to improved parametric GARCH models.
Fourth, all eight return series for the Semi-GARCH, Semi-APARCH and Semi-EGARCH models indicate the presence of skewness in the stock indices studied. This finding aligns with previous research, such as the study by Härdle and Feng (2020), who find that skewness is a common feature in financial markets. However, the coefficients of α and β in both models are statistically significant for all return series of the stock indices, suggesting that these models can still capture the volatility dynamics of the stock market indices.
Overall, the results presented in this study are consistent with previous research on GARCH model estimation for stock market indices. However, the study emphasizes the importance of considering alternative GARCH models, such as the Semi-GARCH and Semi-APARCH models, to better capture the volatility dynamics of financial markets.
Additionally, the results presented in this study can be compared with those of previous studies on the long-memory properties of financial time series. Long memory processes have been studied extensively in the literature and their presence in financial data has been documented in several studies (Baillie et al., 1996; Baillie & Bollerslev, 1992; Ding et al., 1993).
The long-memory properties of financial time series can be modelled via FIGARCH models, which extend the standard GARCH model by introducing long-memory in the variance equation. The FIGARCH model proposed by Baillie et al. (1996) is a popular choice for modelling long-memory in financial returns. This study’s findings showed that the FIGARCH model fits well for the majority of stock market indices. However, the performance of the FIGARCH model is sensitive to the value of the long-memory parameter (d). When d is close to 1, the FIGARCH model reduces to the IGARCH model proposed by Bentes (2015). The N225 index and BUK100P have the highest values of d (1.000) in the FIGARCH model, which indicates that the FIGARCH model reduces to the IGARCH model for these indices. These results support the literature, which suggests that the IGARCH model is more appropriate for modelling the long-memory properties of some stock market indices (Baillie et al., 1996; Baillie & Bollerslev, 1992).
Furthermore, this study introduced the Semi-FIGARCH model, a semiparametric long-memory GARCH model. The Semi-FIGARCH model is a flexible alternative to the FIGARCH model because it does not rely on the assumption of a parametric structure for the variance equation. The study’s findings showed that the Semi-FIGARCH model fits well for the majority of stock market indices, and its performance is comparable to that of the FIGARCH model.
The results of this study align with previous research emphasizing the importance of advanced GARCH models in capturing long-memory and asymmetric effects in financial time series. For example, Patra and Padhi (2015) demonstrated that models like APARCH, fractionally integrated exponential GARCH (FIEGARCH) and hyperbolic GARCH (HYGARCH) outperform traditional approaches in predicting VaR for the BSE-BANKEX index. While their study identified HYGARCH as the most effective model, our findings suggest that semiparametric models, such as Semi-FIGARCH, offer even greater flexibility and stability. This indicates that semiparametric approaches may provide a more robust framework for modelling financial market volatility, particularly in the presence of complex dynamics.
Moreover, this study considers the log-GARCH model proposed by Sucarrat (2019) and the scaled log-GARCH model proposed by Sucarrat and Escribano (2018). These models extend the standard GARCH model by introducing long-memory properties in the volatility equation via a logarithmic variance function. The study’s findings showed that the log-GARCH model and the scaled log-GARCH model perform well for the majority of stock market indices. However, the log-GARCH model may not be appropriate for modelling the long-memory properties of financial returns when the variance is bounded away from zero.
Conclusion
The main objective of this study was to investigate the volatility dynamics of eight major global stock market indices using a comprehensive suite of parametric and semiparametric GARCH models, including advanced long-memory variants such as FIGARCH and FI-Log-GARCH. By analyzing daily closing values from January 2004 to April 2025, this research provides a nuanced understanding of how different modelling approaches capture the intricate complexities of financial market volatility. The methodologies employed involved fitting standard GARCH, APARCH, EGARCH, FIGARCH and FI-Log-GARCH models, along with their semiparametric counterparts, using established R packages. The 1-day rolling VaR and ES were rigorously evaluated through backtesting, focusing on regulatory traffic light tests and the modern WAD selection criterion.
This research builds upon the established importance of long memory in volatility modelling (Duppati et al., 2017; Karanasos et al., 2021; Zumbach, 2003) by rigorously testing and validating the performance of fractionally integrated models within a comprehensive comparative framework. While recent studies have highlighted the superior forecast accuracy of complex hybrid models that merge GARCH with machine learning techniques (Kim & Won, 2018; Kumar et al., 2025), our findings demonstrate that significant improvements can be achieved within the GARCH paradigm itself through semiparametric estimation. The superiority of the Semi-FIGARCH model shows that enhancing the flexibility of traditional econometric models is a highly effective and interpretable alternative to increasingly complex hybrid approaches. Furthermore, our results on asymmetry and skewness align with and reinforce the critical need to account for these features, as identified in studies on commodities and hybrid sentiment models (Basira et al., 2024; Léber & Egyed, 2025).
The empirical findings reveal several key trends. First, the unconditional variances of the fitted parametric models were found to be nonconstant over time, with sums of (α + β) persistently close to unity. This indicates that the rigid parametric structures of traditional GARCH models may be insufficient to fully capture the evolving nature of market dynamics, a limitation effectively addressed by the more flexible semiparametric versions. Second, the significant leverage effect parameter (γ) in the APARCH model underscores the profound asymmetric impact of negative shocks on volatility, confirming a well-documented yet critical stylized fact in financial markets. The Semi-APARCH model further refined these estimates, demonstrating improved handling of leverage across most indices. Most importantly, the study confirmed the pervasive presence of long-memory properties in the financial time series analyzed. Both the parametric FIGARCH and semiparametric Semi-FIGARCH models exhibited strong and robust performance, with the latter generally providing superior stability and lower WAD scores, highlighting its effectiveness for accurate VaR and ES forecasting.
The demonstrated superiority of semiparametric long-memory models provides a strong and robust foundation for future research. A logical and highly promising extension would be to integrate these econometrically sound foundations with the predictive power of artificial intelligence. For instance, using the volatility forecasts from a Semi-FIGARCH model as an input feature for an LSTM network or other machine learning architectures could create a powerful hybrid model. This approach would combine the interpretability, theoretical grounding and efficiency of advanced GARCH models with the ability of machine learning to capture complex, non-linear patterns missed by traditional methods, potentially setting a new benchmark for forecasting accuracy.
For policymakers and regulators, our results carry significant weight. They underscore that current risk management frameworks and stress-testing methodologies, such as those mandated by the Basel Committee, must evolve beyond the limitations of standard GARCH assumptions. Adopting and encouraging models that explicitly capture long memory and asymmetry, as empirically validated here, is no longer just an academic exercise but a practical necessity. Integrating these more accurate models into regulatory capital calculations and risk assessment protocols is crucial for developing more resilient financial institutions and systems capable of withstanding periods of extreme market stress, ultimately promoting greater financial stability.
However, this study is not without limitations. The focus on daily closing values, while standard, may not fully capture the richness of intraday volatility patterns. Future research could leverage high-frequency data to provide a more granular analysis. Additionally, incorporating external macroeconomic variables, geopolitical risk indices or market sentiment data could provide a more holistic understanding of the drivers of financial market volatility. Extending the analysis to a broader range of assets, including bonds, commodities and cryptocurrencies, could further test the generalizability of the findings.
Managerial Implications
The findings of this study offer profound managerial implications for financial market participants, including investors, risk managers, portfolio managers and regulators. By leveraging the insights derived from advanced GARCH models, these stakeholders can enhance their decision-making processes and improve their risk management strategies.
The superior performance of semiparametric long-memory GARCH models, such as Semi-FIGARCH, indicates that these models provide more accurate and robust forecasts of volatility, particularly during periods of market turbulence. For risk managers, this means having more reliable tools to anticipate and mitigate risks associated with market volatility. By integrating these models into their risk management frameworks, managers can better prepare for potential market downturns and develop more effective hedging strategies. This proactive approach to risk management can help protect portfolios from significant losses and ensure stability during volatile market conditions.
The significant leverage effect observed in the APARCH model highlights the asymmetric impact of negative shocks on volatility. Investors can use this insight to develop strategies that account for the heightened volatility following negative events. For instance, incorporating models that capture this asymmetry can help investors time their entries and exits more effectively, capitalizing on market rebounds while minimizing exposure to downturns. Additionally, understanding the leverage effect can guide investment decisions in sectors or assets that are particularly sensitive to negative news, allowing for more strategic allocations.
The presence of long-memory properties in financial time series, as captured by FIGARCH and Semi-FIGARCH models, suggests that past volatility trends significantly influence current market conditions. Portfolio managers can use these models to optimize their portfolios by considering the long-term volatility patterns of different assets. By doing so, they can achieve a better balance between risk and return, ensuring that their portfolios are resilient to market shocks while still capitalizing on growth opportunities. This long-term perspective can lead to more stable and profitable investment outcomes over time.
For regulators, the findings underscore the importance of incorporating advanced volatility models into regulatory frameworks. By adopting models that account for long-memory and asymmetric effects, regulators can develop more robust stress-testing methodologies and capital requirements. This can help ensure the stability of financial institutions and markets, particularly during periods of heightened volatility. Moreover, regulators can use these insights to inform policy decisions aimed at mitigating systemic risks and promoting market stability.
The persistence of skewness in the return series across various models highlights the need for financial institutions to account for the asymmetric nature of financial returns. This can lead to more accurate risk assessment tools and strategies that consider the potential for extreme market movements. By integrating these insights into their operational processes, financial institutions can enhance their efficiency in managing risks and allocating resources, ultimately leading to improved financial performance and customer trust.
The ability to accurately forecast volatility using advanced GARCH models enables financial market participants to make more informed strategic decisions. Whether it’s adjusting investment strategies, rebalancing portfolios or implementing risk mitigation measures, having reliable volatility forecasts allows for proactive and data-driven decision-making. This can lead to better financial outcomes and a competitive edge in the market.
Footnotes
Acknowledgements
The authors extend their sincere gratitude to the editor and anonymous reviewers for their invaluable time and expertise. Their constructive feedback and insightful comments greatly enhanced the quality, clarity and rigour of this manuscript.
Author Contributions
Vatis Christian Kemezang: Conceptualization, methodology, software, formal analysis, investigation, data curation, writing—original draft, writing—review & editing, visualization, supervision, project administration. Zacharie Nkengwou Deutou: Methodology, validation, formal analysis, investigation, resources, writing—review & editing. Prince Hikouatcha: Software, validation, formal analysis, data curation, writing—original draft, writing—review & editing. Ivette Gnitedem Keubeng: Validation, investigation, resources, writing—original draft, writing—review & editing.
Declaration of Conflicting Interests
The authors declare no potential conflicts of interest with respect to the research, authorship and/or publication of this article.
Ethical Declaration
The authors abide by all the ethics involved in this academic work and have not submitted it to any other journal.
Funding
The authors received no financial support for the research, authorship and/or publication of this article.