
Abstract
This study examines herding behaviour among traditional value investors in Environmental, Social and Governance (ESG) portfolios across Southeast Asian emerging markets, defined by reliance on a single valuation metric (the market-to-book ratio). It challenges prior literature that examined undifferentiated investor populations and reported generalized resistance to herding in ESG portfolios. We argue that bounded rationality drives these investors to simplified analysis, triggering information cascades and rational herding. Using daily returns (2017–2024) from five markets, we apply a nonlinear cross-sectional absolute deviation model with a Generalized Autoregressive Conditional Heteroskedasticity robustness check to control for volatility clustering and isolate rational herding from common-information drivers. Results show traditional value investors exhibit significant herding conditional on market phase, contrary to aggregate-level analyses. We identify notable market-phase asymmetry: shock-driven reactions during bear markets (years of negative regional index returns) contrast with momentum-chasing behaviour during bull markets, highlighting the complementary roles of bounded rationality and information cascades. Our study advances herding literature by showing investor type matters, proposing a joint bounded rationality-information cascade explanation for rational herding, and revealing market-phase dependencies. As herding behaviour amplifies valuation distortions by driving prices from fundamental value, practically incorporating these patterns into risk models may help mitigate such distortions.
Keywords
Introduction
Herding behaviour, which refers to investors’ tendency to follow collective decisions instead of conducting independent analysis (Bikhchandani et al., 1992), has critical implications for value relevance in accounting research. Empirical evidence shows that this behaviour drives stock prices away from fundamental values (Tan et al., 2008), potentially biasing analyses of how accounting information, including both financial and non-financial data, relates to market prices (Holthausen & Watts, 2001). Such distortion raises particular concerns in light of the growing importance of Environmental, Social and Governance (ESG) disclosures. When investors base their decisions more on market sentiment than on fundamental analysis, the increasing dominance of ESG information may intensify herding effects. The relevance of herding is further underscored in the ESG context due to the distinctive nature of ESG disclosures, which often involve qualitative metrics, long-term horizons and diverse reporting frameworks. This can present greater interpretation challenges compared to conventional financial statements, possibly leading investors to place additional weight on observed market behaviour. This domination could further weaken the relationship between stock prices and the information contained in financial statements.
Given those important issues, unfortunately, research on herding behaviour in ESG stock portfolios remains limited (e.g., Danila, 2023; Gavrilakis & Floros, 2023; Papade et al., 2021). Prior studies in emerging markets (Egypt, India, Brazil, China, Taiwan) have found that ESG investors typically act independently, and herding behaviour issues are only reflected during commodity shocks (Danila, 2023). Similarly, Papade et al. (2021) observed no herding behaviour in India’s ESG stocks. Conversely, in developed European markets, Gavrilakis and Floros (2023) detected herding behaviour in Portugal, Italy and Greece during the COVID-19 crisis.
While these studies provide initial insights into herding in ESG contexts, their methodological approach of testing for market-wide or portfolio-level herding limits the generalizability of conclusions about investor behaviour. Papade et al. (2021) and Danila (2023) test for herding in broad ESG indices or pools of ESG stocks without differentiating investor types. Similarly, Gavrilakis and Floros (2023) examine herding across a broad sample of ESG-scoring firms. This aggregate-level analysis inherently assumes homogeneity among investors trading these ESG assets. However, Hsieh (2013) demonstrates that herding propensity varies significantly across investor types. Therefore, a finding of no herding at the portfolio level does not preclude its existence within specific investor subgroups trading those same assets. A more granular, investor-level analysis is thus critical to uncover conditional herding, particularly within groups like traditional value investors who may apply unique heuristics to ESG information.
This study addresses the unexplored variation in herding susceptibility by testing the presumed behavioural immunity of a specific investor subgroup: traditional value investors. Unlike general investors, value investors are characterized by contrarian tendencies and a focus on fundamental metrics like a low market-to-book (MB) ratio. Within this broad category, we focus specifically on traditional value investors, whom we define operationally as those who rely predominantly on a single, simplified valuation metric, namely the MB ratio, as their primary screening tool. This approach is consistent with the extensive literature on value investing, where the MB ratio serves as the primary proxy for value (e.g., Fama & French, 2012, 2015), a practice also reflected in more recent strategy discussions (Fong, 2018). This narrow heuristic-based approach distinguishes them from more sophisticated value investors who may employ multifactor models or holistic fundamental analysis. We posit that it is precisely this reliance on a limited analytical framework that may render them susceptible to herding when faced with the complex information characteristic of ESG investing.
We test this hypothesis using secondary market data (2017–2024) from five Southeast Asian emerging markets with developing sustainability frameworks: Indonesia, Malaysia, the Philippines, Thailand and Vietnam. This regional and temporal focus distinguishes our study from prior work (e.g., Danila, 2023; Gavrilakis & Floros, 2023; Papade et al., 2021), which examined different markets and periods. More critically, our methodological distinction lies in the unit of analysis: rather than testing for herding in aggregate ESG indices or undifferentiated pools of ESG stocks, we construct a portfolio that mirrors the investment decisions of our defined traditional value investor subgroup and test for herding specifically within that portfolio. This subgroup-specific approach allows us to directly investigate the conditional herding that aggregate analyses may obscure.
We draw on information bounded rationality theory and cascade theory, which are complementary. Bounded rationality describes the cognitive state of investors facing complex ESG information, where their limited capacity leads to uncertainty. Information cascade theory then details the behavioural mechanism through which investors rationally resolve this uncertainty by observing and following the observed actions of others in the market. Based on this complementary framework, we hypothesize that traditional value investors exhibit herding behaviour in ESG stock portfolios through two rational channels: (a) Information cascades driven by the widespread adoption of ESG metrics and (b) cognitive simplification necessitated by the complexity of ESG analysis.
We found no evidence of herding behaviour in the ESG stock portfolio when investors’ types were not differentiated. Nevertheless, when we focus our analyses on traditional value investors, we found herding behaviour within these ESG stock portfolios. This result can be explained from the perspective of single matrix valuation as a primary investment strategy. The reliance on single-metric valuation arises from inherent resource constraints that restrict investors from conducting a comprehensive analysis of all financial accounting data. 1 The additional complexity of ESG data relative to financial accounting data may further enhance these constraints. Consequently, value investors may rationally choose to imitate other investors, considering them as superior resources and avoiding potential missed opportunities during market momentum shifts.
In addition, this study observed distinct herding patterns among traditional value investors across market phases. During bearish periods, traditional value investors demonstrate greater susceptibility to shock-driven herding and exhibit faster-decaying responses compared to those bearish periods. Conversely, their herding behaviour shows greater persistence during bullish periods. These behavioural dichotomies reflect different psychological drivers: (a) reactive herding in bearish periods aligns with loss aversion and (b) prolonged herding behaviour during bullish periods aligns with missing out on positive market trends.
Our study offers several contributions to the existing literature. First, our findings provide additional insights into the existing empirical literature on herding behaviour, particularly in the context of ESG stock portfolios within traditional value investing strategies (e.g., Danila, 2023; Gavrilakis & Floros, 2023; Papade et al., 2021). While these studies found no herding behaviour when examining undifferentiated investors, our study specifically identifies herding behaviour among traditional value investors. Furthermore, we extend the study of Ju (2020) and Hsieh (2013) by demonstrating how rational herding mechanisms behaviour are manifested differently based on the behavioural dichotomy of reactive herding and prolonged herding behaviour.
Second, this study introduces a theoretical integration by analyzing ESG herding among traditional value investors through the complementary perspectives of bounded rationality theory and information cascade theory. These complementary perspectives were previously unexplored. Our empirical evidence supports the theoretical integration of bounded rationality theory and information cascade theory. These contributions highlight two key avenues for future research: (a) comparative analysis of herding patterns across investor categories (e.g., domestic/foreign, institutional/retail) and (b) examination of value investors employing multi-metric valuation, which may differentiate rational from irrational herding behaviour more clearly.
The next section describes the theoretical foundations to hypothesize the herding behaviour of traditional value investors in an ESG stock portfolio, followed by a detailed presentation of the materials and methods. The empirical findings are then comprehensively discussed, with particular attention to their theoretical contributions and practical implications for investors and policymakers. The conclusion outlines evidence-based policy recommendations and suggests productive avenues for future research.
Literature Review
Investment herding behaviour, defined as following the majority while disregarding independent analysis (Devenow & Welch, 1996), has evolved from being considered purely irrational to being understood as potentially rational (Ju, 2020). Ju (2020) organizes herding behaviour theories into rational explanations (i.e., payoff externality, information cascades, principal–agent theories) and irrational explanations (i.e., conservative bias, overconfidence, conformity, congruity).
The key distinction between these two forms of herding lies in their underlying decision-making processes (Hsieh, 2013). First, rational herding emerges from deliberate economic calculations, where investors consciously imitate others due to logical constraints such as information limitations, prohibitive analysis costs or the perception that peers possess superior knowledge. This behaviour represents a rational strategy to optimize returns or mitigate risks under conditions of information uncertainty. Viewed through the lens of the adaptive market hypothesis (Lo, 2004), rational herding constitutes an adaptive response to information asymmetries.
Second, irrational herding originates from psychological biases and the inability to make independent judgments (Ju, 2020). This occurs when investors follow market trends without proper analytical justification, often driven by emotional factors such as fear of missing out (FOMO) or panic during market downturns. Such behaviour typically disregards fundamental asset values and instead reflects prevailing market sentiment or collective euphoria.
Both rational and irrational herding behaviour can lead stock prices to deviate from their fundamental values (Scharfstein & Stein, 1990). Consequently, herding behaviour represents a crucial factor that must be considered in accounting value relevance research. This applies equally to studies examining financial and non-financial information. These dynamics underscore the necessity for researchers to distinguish between fundamental value signals and herding-induced price movements when assessing accounting information relevance.
This study examines the potential for herding behaviour in the formulation of an ESG stock portfolio, particularly in light of the growing popularity of ESG investments. As ESG information becomes increasingly prominent in investment decision-making, recent studies have begun to explore whether herding behaviour exists in ESG stock portfolios (e.g., Danila, 2023; Gavrilakis & Floros, 2023; Papade et al., 2021). Danila (2023) examined ESG stock herding across multiple countries (Egypt, India, Brazil, China and Taiwan), both within individual markets and in cross-national contexts. Danila (2023) found that ESG investors generally make independent decisions, with no herding behaviour detected, except during periods of external shocks such as commodity price fluctuations. These findings are consistent with those of Papade et al. (2021), who also found no evidence of herding among ESG investors in India, under both normal and extreme market conditions. Similarly, Gavrilakis and Floros (2023) did not find signs of herding in ESG portfolios across developed European markets. However, Gavrilakis and Floros’s (2023) partial analysis during crisis periods found the presence of herding behaviour in specific countries, particularly Portugal, Italy and Greece.
These three studies (i.e., Danila, 2023; Gavrilakis & Floros, 2023; Papade et al., 2021) yield important insights into herding behaviour within ESG stock portfolios. First, investors in emerging markets show resistance to herding tendencies when constructing an ESG stock portfolio. This finding challenges the argument by Baig et al. (2022), who explained that herding behaviour is typically more pronounced in emerging market investors. Second, herding behaviour emerges selectively under certain external shocks. These include commodity price volatility, such as oil price spikes in Egypt and India or drops in Brazil, China and Taiwan, as well as systemic disruptions like the COVID-19 pandemic in Southern Europe. The contrast between general resilience and event-driven herding suggests that ESG investors are not entirely immune to extreme market conditions.
A synthesis of this literature points to three key insights regarding herding in ESG investing. First, it is established that undifferentiated pools of ESG investors generally do not exhibit significant herding. Second, what remains contested is the universality of this finding, specifically whether it holds for all investor types during periods of systemic stress and across different methodological approaches. Third, a significant gap persists. It is unknown whether specific, behaviourally-defined investor subgroups exhibit distinct herding dynamics within ESG portfolios. One such subgroup is traditional value investors, who rely on simplified heuristics. This study directly addresses this latter gap by shifting the unit of analysis from the aggregate market to a precisely defined investor subgroup.
Examining herding behaviour among value investors is critical for resolving persistent gaps in the literature, particularly regarding underexplored variations in herding susceptibility across different investor types. Distinct from general investors, value investors are characterized by their focus on fundamental stock valuation metrics such as low MB ratios and high dividend yields. These investors typically demonstrate contrarian behaviour that runs counter to prevailing market trends. Given their analytical approach to investment decisions, this orientation would hypothetically reject irrational herding behaviour. However, whether value investors are completely immune to herding or whether they engage in rational herding patterns remains an empirically unanswered question that warrants further investigation. This oversight in prior research is not specific to value investors but is a direct consequence of its aggregate-level methodology. By examining herding in undifferentiated pools of ESG investors, these studies were not designed to detect behavioural differences across any investor subgroups, whether value, growth, institutional or retail. Therefore, the herding behaviour of specific subgroups like traditional value investors remains unexamined, not due to a particular conceptual bias against them, but because the necessary investor-level analysis has not been conducted.
This study provides an empirical discussion of herding behaviour among value investors who construct an ESG stock portfolio, using the complementary theoretical frameworks of information cascade and bounded rationality theory. Investment herding behaviour explained by information cascade theory (Bikhchandani et al., 1992) predicts that individuals tend to disregard their private information and instead follow the actions of prior investors. Ju (2020) applies this theory to argue that herding behaviour can be categorized as a rational action.
Information cascade theory explains herding as rational behaviour through a sequential decision-making mechanism driven by the belief that prior decisions are superior (Bikhchandani et al., 1992). Imitating of previous investors or the majority is considered rational because it relies on the assumption that collective decisions are more informed than individual judgment. This herding mechanism is relevant in an ESG stock portfolio, where investors observe that a growing number of market participants are incorporating ESG performance into their decisions, coupled with value investors’ belief that such portfolios consist of undervalued stocks.
In addition to information cascade theory, this study also proposes bounded rationality theory to explain traditional value investors’ rational herding behaviour in ESG stock portfolio construction. The concept of bounded rationality, first introduced by Simon (1955), becomes particularly relevant in stock investments when cognitive limitations, time constraints and incomplete information prevent investors from making fully rational decisions. Faced with complex financial data, market uncertainties and information overload, traditional value investors frequently resort to simplified decision-making heuristics instead of performing comprehensive analyses. A concrete example from our sample illustrates this phenomenon: many value investors rely primarily on basic valuation metrics (such as the MB ratio) rather than conducting thorough examinations of complete financial statements, a practice consistent with the established value investing literature (Fama & French, 2012, 2015; Fong, 2018). Similarly, some may adopt analyst recommendations without independent verification due to constraints in both time and specialized expertise.
This behaviour can be considered rational given constraints in information access, cognitive limitations and time pressures. However, such reliance on similar reference points by multiple investors may ultimately result in herding behaviour. Our study demonstrates this mechanism through the case of traditional value investors choosing ESG stock portfolios. When confronted with the complexity of ESG data analysis, these investors frequently turn to established ESG rating agencies as practical substitutes for thorough evaluation, while simultaneously incorporating these ESG metrics with their single matrix valuation approaches.
Drawing upon information cascade theory and bounded rationality theory, we can formulate the hypothesis that herding behaviour occurs in traditional value investors’ ESG portfolio formation through two complementary rational mechanisms. First, when the majority of investors incorporate ESG performance metrics, this creates an information cascade effect where others follow these collective decisions. Second, as ESG analysis often exceeds individual cognitive capabilities and resource constraints—consistent with bounded rationality principles—investors resort to simplified approaches such as relying on rating agencies’ assessments. This dual mechanism framework explains how rational herding emerges in ESG investing among typically independent value investors.
Materials and Methods
This study analyses traditional value investors herding behaviour through secondary market stock trading activities in five emerging Southeast Asian markets: Indonesia, Malaysia, Thailand, the Philippines and Vietnam. Emerging markets demonstrate particular vulnerability to investor herding behaviour, as established by Baig et al. (2022). This stands in direct contrast to the conclusions reached by Danila (2023) and Papade et al. (2021), making a valuable opportunity for examining alternative herding mechanisms. Furthermore, corporate ESG disclosure regulations in these markets remain underdeveloped compared to developed market standards. In such information-constrained ESG markets, herding behaviour is particularly susceptible to triggering panic selling, thereby exacerbating market volatility. This effect becomes especially pronounced when negative market sentiment emerges, such as that induced by potential greenwashing incidents. Our analysis employs a regionally aggregated portfolio. This approach integrates cross-country variation. However, we acknowledge that differences in regulatory frameworks and ESG disclosure enforcement across the constituent markets introduce unobserved heterogeneity. This variation forms an important contextual layer for interpreting the regional-level findings presented in this study.
We focus on ESG-compliant companies, defined as those with at least one ESG performance disclosure during the observation period that were also selected by value investors. Following the methodologies of Piotroski (2000) and Battisti et al. (2019), we identify value investors’ stock portfolios using the MB ratio as the primary selection criterion. The sample is divided into tertiles based on MB ratio classification. We apply several exclusion criteria: financial firms, companies without industry competitors, zero-trading-volume observations, firms with consecutive annual losses, and those with negative MB ratios. These selection requirements necessarily result in annual variations in sample size.
Following these screens, the remaining firms are sorted annually into tertiles based on their MB ratio. The lowest tertile (MB1) is classified as the value portfolio and constitutes the primary investor subgroup for our analysis of herding behaviour. The middle (MB2) and highest (MB3) tertiles serve as neutral and growth portfolios, respectively. We acknowledge that these criteria, while standard for isolating traditional value investors, may introduce a selection bias. Our findings are therefore most directly generalizable to this defined subgroup. They may not extend to excluded firm types, such as financially distressed companies (i.e., filtered by the consecutive loss and negative MB criteria) or financial institutions.
The use of the MB ratio as a single-metric heuristic operationalizes our definition of traditional value investors. We recognize that this parsimonious approach, while precisely targeting our phenomenon of interest, comes with a trade-off: it may not capture value investors who employ more comprehensive analysis. This focus is deliberate, as it isolates the documented practice, in both market behaviour and academic literature (e.g., Fong, 2018), of investors using a single valuation metric as a sufficient screen for value. Consequently, our findings are specifically contextualized within the behaviour of this investor subgroup. Future research could test the generalizability of these herding patterns by employing alternative identification methods, such as composite scores of traditional value metrics (e.g., MB combined with dividend yield) or, with access to different data, holdings-based classifications of institutional portfolios.
All data, including MB ratios and daily raw returns, were obtained from the London Stock Exchange Group. Table 1 presents the annual distribution of firms across MB ratio tertiles, with the MB1 portfolio representing value investors’ preferred stock selection. Our dataset comprises 2,093 firm-year observations with ESG data from 2016 to 2023.
Annual Firm Observation by Market-to-book (MB) Ratio Tertile.
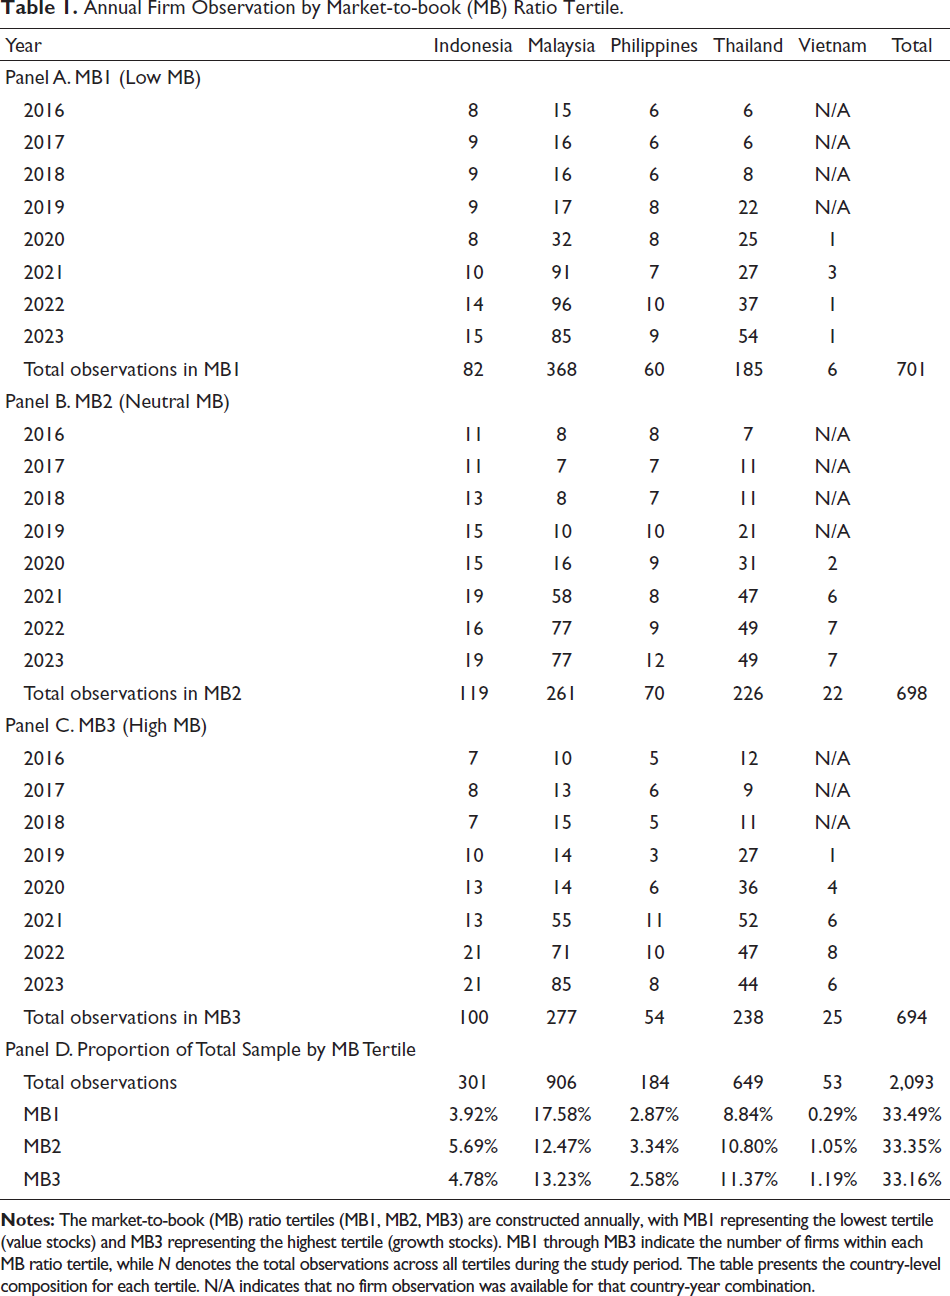
Annual Firm Observation by Market-to-book (MB) Ratio Tertile.
This study analyzes daily stock prices from 2017 onward (year t+1 relative to the ESG performance period t). Adopting the methodology of Chang et al. (2000), we utilize the Cross-Sectional Absolute Deviation (CSAD) model to identify investor herding behaviour, an approach recently employed in ESG investment research by Danila (2023) and Gavrilakis and Floros (2023). The herding behaviour detection model employs nonlinear regression to analyze the relationship between value investors portfolio returns and CSAD (Equation 1). Higher CSAD reflect diversified investment decisions stemming from independent assessments, while declining CSAD during high market volatility periods—characterized by coordinated investor movements (either collective buying or selling)—serves as a key indicator of herding behaviour. Herding as a behavioural phenomenon is characterized by a nonlinear reduction in the cross-sectional dispersion of stock returns (i.e., returns become more uniform) under market stress, a specific pattern that a standard linear model could not adequately capture. Therefore, the nonlinear CSAD specification is necessary to test for the presence of this hypothesized behavioural pattern.

The CSAD measures return dispersion among stocks within ESG portfolios (n), calculated from daily price changes during the 2017–2024 observation period. Ri,d denote the daily raw return of individual stock i in portfolio n at year t, and Rn,d represent the corresponding portfolio average daily return. These annual averages are computed as daily means and transformed into absolute values. This absolute value transformation captures the magnitude of deviation between individual stock returns and market returns, ensuring positive and negative deviations (from outperforming and underperforming stocks) do not cancel each other out. We detect herding patterns using the nonlinear regression model specified in Equation (2).

RMB1 denotes the average daily raw return of portfolio n, which consists of stocks with low MB ratios (MB1) identified in period t – 1. The absolute value of RMB1 (|RMB1|) quantifies linear volatility in portfolio returns. A statistically significant positive coefficient β1 suggests that return dispersion (CSAD) grows with increasing market volatility, indicating typical investor behaviour. Conversely, herding behaviour is identified by a statistically significant negative coefficient β2. The squared term RMB1² captures extreme portfolio returns. Under normal market conditions, such extreme returns would trigger varied investor reactions (e.g., simultaneous buying and selling), leading to greater return dispersion. However, when extreme returns (RMB1²) coincide with reduced return dispersion (as shown by a significantly negative coefficient for RMB1²), this provides definitive proof of herding behaviour. This phenomenon implies investors are moving uniformly in response to price signals rather than making independent decisions.
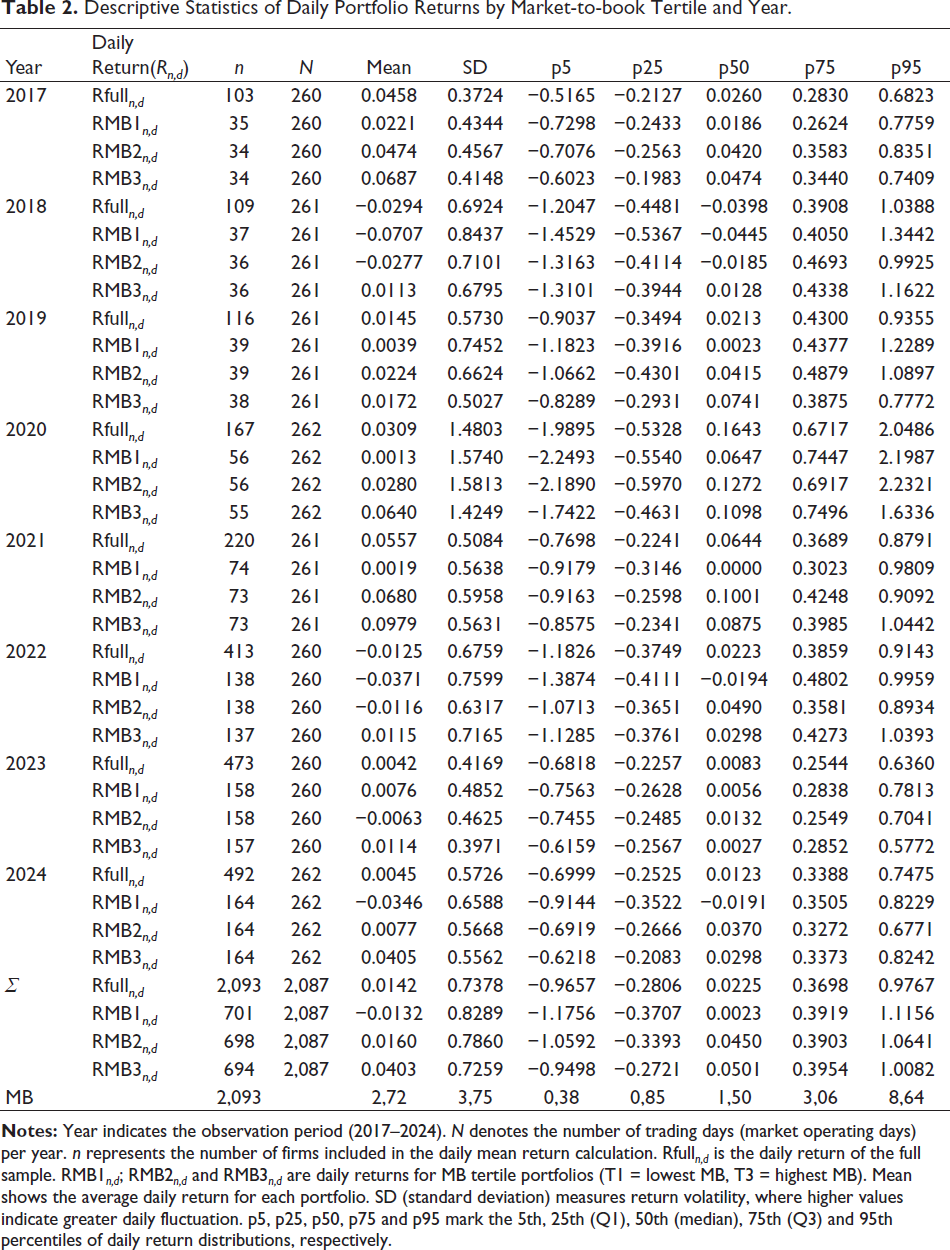
Table 2 reports the descriptive statistics for the mean raw returns of the stock portfolio (comprising n stocks), presented annually to account for yearly variations in the number of qualifying firms. These statistics are shown for both the full sample (following our sampling criteria) and the split-sample analysis based on MB ratios. Following this, Table 3 presents the annual distribution of CSAD values for both the full sample and MB-based split samples. It is important to note that a higher average CSAD for a portfolio (such as MB1) does not preclude the presence of herding. Herding is specifically identified by a nonlinear decline in CSAD during periods of extreme market returns, not by its absolute level.
Descriptive Statistics of Daily Portfolio Returns by Market-to-book Tertile and Year.
Descriptive Statistics of Cross-sectional Absolute Deviation (CSAD) by Market-to-book (MB) Tertile and Year.
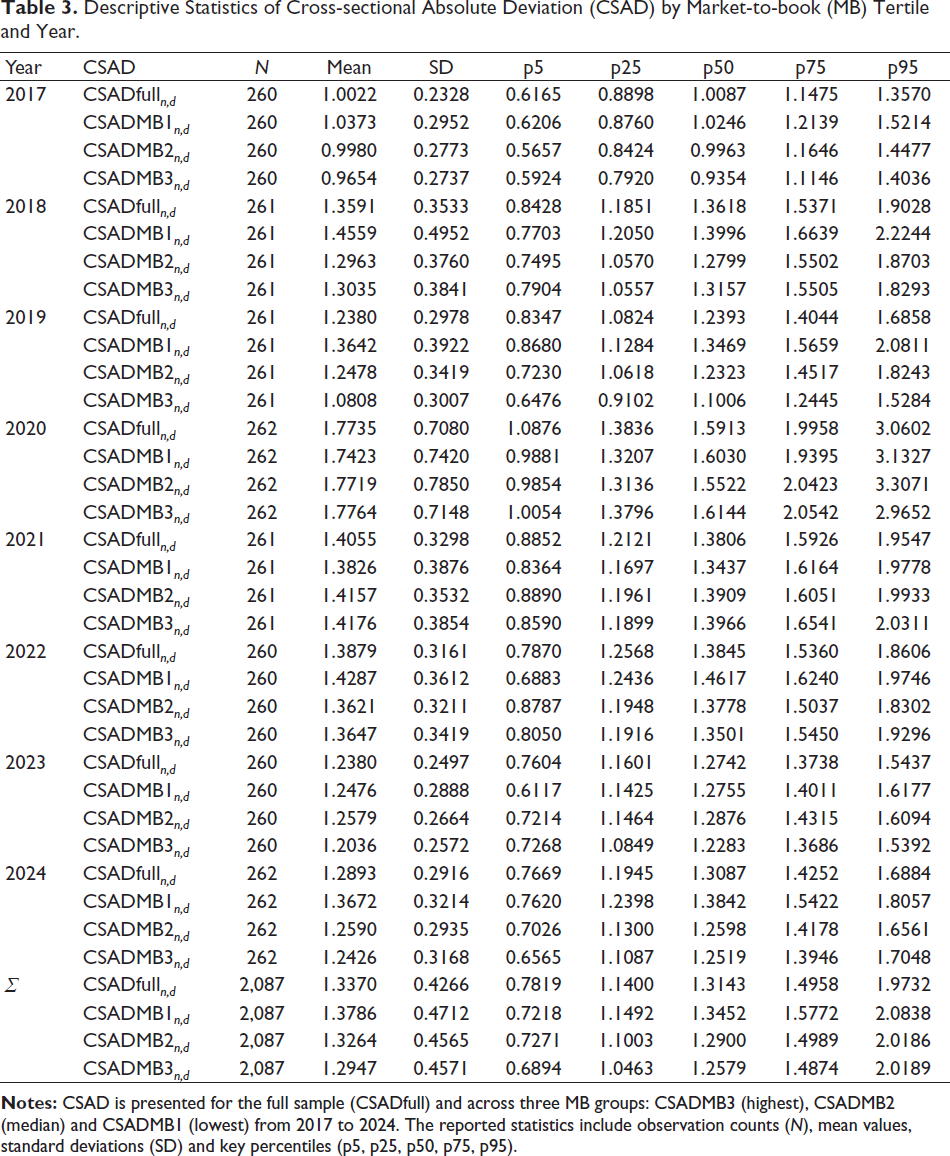
The descriptive data provide limited but noteworthy evidence that may partially support herding behaviour among MB1 (value stock). First, during crisis periods such as 2020, the CSAD difference between MB1 and MB3 narrowed, with MB1’s CSAD (1.7423) approaching MB3’s value (1.7764). This pattern could be interpreted as value investors’ tendency to follow market trends during extreme uncertainty. Second, MB1’s return distribution shows more pronounced left-skewness (more extreme 5th percentile), potentially reflecting panic-selling behaviour that might be associated with herding.
The higher CSAD values of MB1 compared to MB3 suggest that value investors predictably make more independent investment decisions. The high return volatility of MB1 also aligns better with the fluctuating nature of value stocks rather than herding patterns, which are usually characterized by reduced return dispersion. While temporary herding might occur during special circumstances like the 2020 crisis, these descriptive data are not sufficiently strong to support consistent herding behaviour in MB1. Further analysis using nonlinear regression approaches is needed to test the statistical significance of these observed patterns.
The initial nonlinear CSAD regression analysis, while useful for identifying potential herding through return dispersion patterns, presents notable limitations. Most critically, to distinguish between routine market volatility and shock-induced volatility effects. A decreasing CSAD during low-volatility periods may not indicate herding behaviour, but rather uniform stock returns resulting from market stability and lack of informational shocks.
To address these confounding factors, we implement robustness checks using dynamic regression models within the nonlinear CSAD framework. Following Yang and Chuang (2023), we incorporate Autoregressive Conditional Heteroskedasticity (ARCH) and Generalized ARCH (GARCH) models. This approach enables more precise herding detection by controlling for volatility-related distortions and isolating genuine herding signals from common-information effects.
The ARCH model identifies market shocks through residual analysis, measuring whether shocks in period t – 1 influence subsequent CSAD dynamics. This approach uncovers herding behaviour patterns that standard nonlinear regression might overlook. Building upon ARCH, the GARCH model introduces two critical components: (a) lagged shocks (ARCH term) and (b) historical volatility persistence (GARCH term). This dual mechanism effectively separates true herding behaviour (sustained CSAD decreases) from spurious reductions due to low volatility, while mitigating volatility clustering bias in nonlinear CSAD residuals. The integration of GARCH modelling with nonlinear CSAD regression thus provides a more robust framework for herding behaviour detection.
Following Bollerslev’s (1986) foundational work, we implement a GARCH (1,1) specification with single lags for both past residuals (ARCH) and historical variance (GARCH) in the conditional variance equation—an optimal structure for capturing daily stock price dynamics. Consistent with Neves et al. (2021), findings on economic variability’s influence, we conduct separate analyses for bullish and bearish market conditions. Market conditions are classified using the FTSE Emerging Markets Asia-Pacific Index’s cumulative daily returns: bullish periods (2016, 2017, 2019, 2020, 2023) and bearish periods (2018, 2021, 2022). This market-specific approach enhances the precision of herding behaviour assessment across different market environments.
The choice of the FTSE Asia Pacific Index as the benchmark for defining bullish and bearish years is motivated by the need for a consistent, regional market signal that corresponds to the multi-country nature of our ESG portfolio. A year is classified as bullish if the cumulative daily return of the index over that year is positive, and bearish if it is negative. This approach ensures that the classification reflects a common investment climate for all sample stocks, avoiding noise from country-specific cycles that may diverge from the regional trend. We acknowledge that alternative definitions, such as those based on local indices or different technical thresholds, could offer complementary perspectives. The exploration of how such alternative market-phase characterizations might influence herding dynamics presents a valuable avenue for future research.
Table 4 summarizes the nonlinear regression analysis of CSAD, presented in two complementary panels. Panel A displays the full-sample results incorporating all 2,093 firm-year observations. Panel B focuses specifically on value investors’ portfolios, defined operationally as stocks in the lowest market-to-book (MB1) ratio tertile—a classification consistent with the value investing frameworks established by Piotroski (2000) and Battisti et al. (2019). This dual-panel structure enables both broad market analysis and targeted examination of value investment behaviour.
Estimates of Herding Behaviour with Full Sample and Split Sample Using Ordinary Least Squares (OLS).
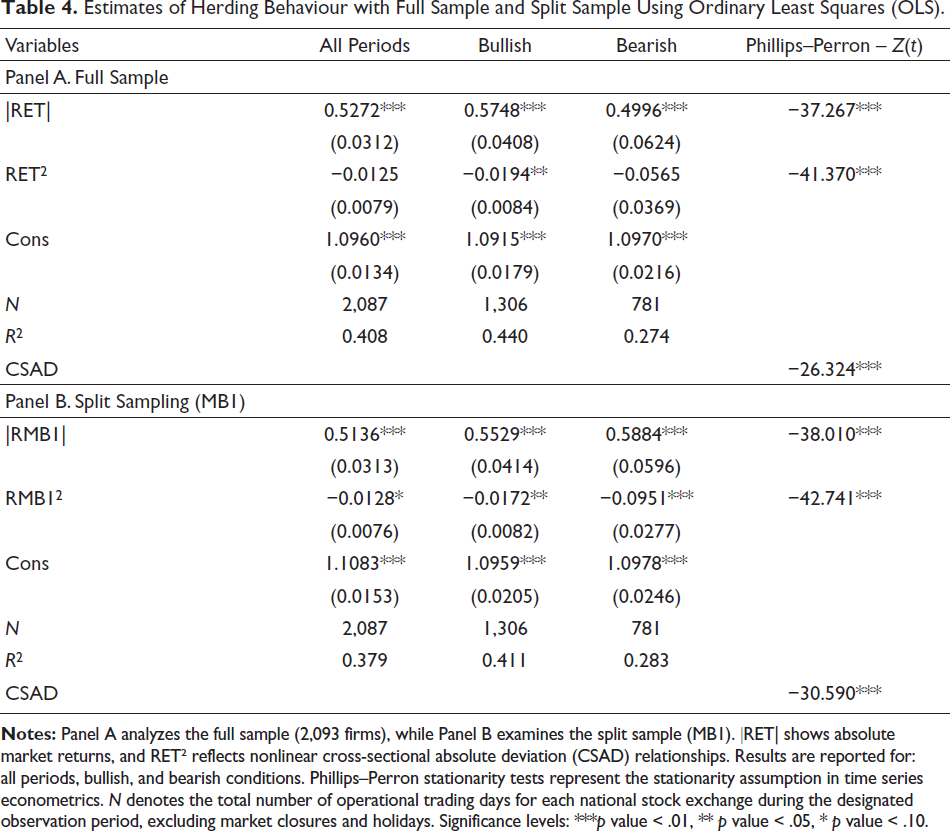
Estimates of Herding Behaviour with Full Sample and Split Sample Using Ordinary Least Squares (OLS).
We begin our empirical results with the full sample of ESG-disclosing firms (Panel A), which reflects the behaviour of general investors within the ESG segment. The results show no statistically significant herding behaviour (RET² = −0.0125, p value > .1). This null finding persists even in bearish market subsamples, contradicting Chang et al. (2000) explanation that herding behaviour becomes more susceptible during market bearishness. Conversely, we find significant herding behaviour during bullish markets, as evidenced by the negative and statistically significant RET² coefficient (p value < .05). This finding suggests a pronounced herding tendency when markets are rising, a pattern that merits further investigation given its implications for sustainable investment strategies.
The following analysis presents split-sample results for the lowest MB portfolio (MB1), which captures value investors’ primary stock selections (Panel B). The findings offer tentative support for our hypothesis, demonstrating a marginally significant negative coefficient for RMB12 (p value < .1) across all market conditions. This negative relationship not only remains consistent but also strengthens in magnitude when examining subsamples stratified by market condition (both bullish and bearish periods).
The robustness of these results across diverse market phases underscores the importance of contextual factors in herding behaviour analysis, including investor characteristics and prevailing market conditions. Additionally, the Phillips–Perron stationarity test (p value < .01) confirms that the dataset meets the stationarity requirement (constant mean and variance over time), a critical precondition for avoiding spurious correlations in regression modelling. Our analysis for split sampling stands in sharp contrast to the full-sample analysis, in which herding behaviour was largely undetectable except during bullish market phases.
Robustness testing was conducted within the GARCH (1,1) model, with specific application to the value investors portfolio (MB1). As summarized in Table 5, the analysis is organized into two complementary panels. Panel A reports the mean equation results, examining the relationship between CSAD and both absolute market returns (|RMB1|) and their squared values (RMB1²) to capture nonlinear effects. These relationships are estimated through three approaches: standard ordinary least squares (OLS), baseline GARCH (1,1), and separate GARCH (1,1) estimations for bullish versus bearish market phases. Panel B presents the volatility equation components, presenting the relative contributions of the ARCH term (reflecting immediate shock impacts) and GARCH term (indicating volatility persistence) to the residual variance of Panel A’s mean model.
Estimates of Herding Behaviour with Split Sample Using Ordinary Least Squares (OLS) and Generalized Autoregressive Conditional Heteroskedasticity (GARCH).
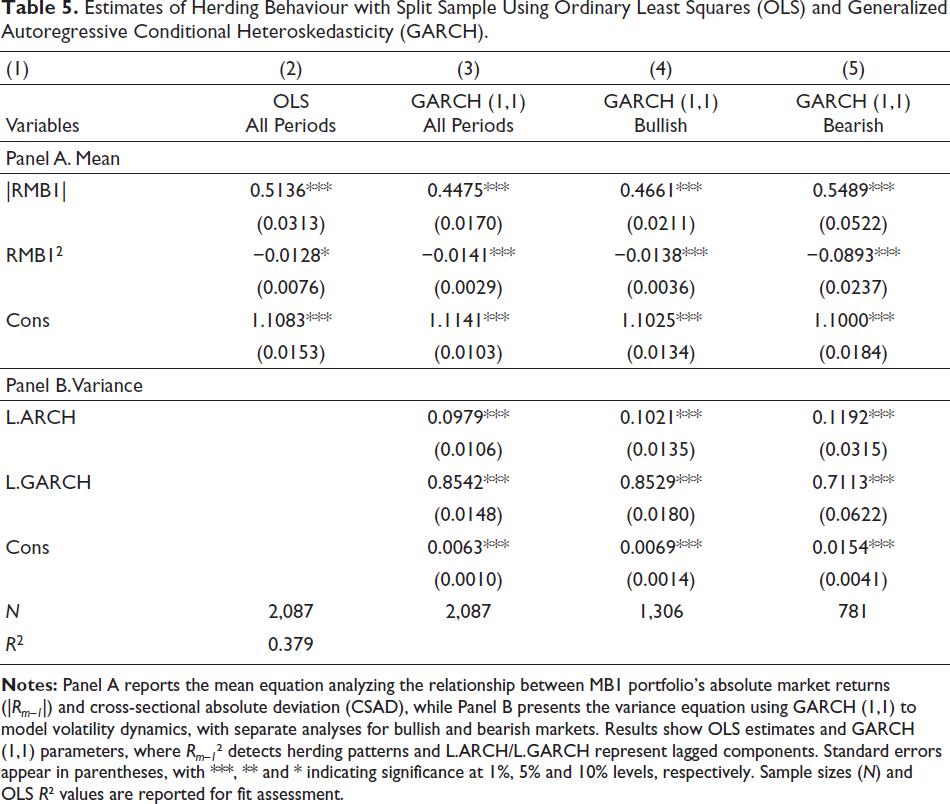
Panel A results present a consistently significant positive coefficient for |RMB1| across all model specifications (p value < .01), indicating that periods of higher absolute market returns are associated with greater CSAD values. This positive association suggests enhanced heterogeneity in investor decision-making during substantial market movements.
Furthermore, the significantly negative relationship of RMB1² remains consistent across all model specifications (p value < .1), evident in both OLS and GARCH estimations under both bullish and bearish market phases. The concave nonlinear relationship reflected by this negative coefficient is indicative of herding behaviour, where investors converge towards market consensus during extreme price movements, thereby reducing cross-sectional return dispersion among individual stocks.
While evidence of herding in the value investors portfolio appears relatively weak in the OLS model, the GARCH (1,1) analysis, particularly when separated for different market conditions (i.e., bullish and bearish), presents a stronger and more consistent negative relationship (p value < .01). Notably, the GARCH (1,1) estimation also yields smaller standard errors, indicating more efficient parameter estimates after controlling for heteroskedasticity. These results provide robust support for the hypothesis that traditional value investors stock portfolios exhibit herding behaviour.
The consistently significant positive coefficients for |RMB1| indicate that CSAD’s responsiveness to market returns escalates with mounting market pressure, with this effect being particularly amplified during bearish conditions. The higher |RMB1| coefficient observed in bear markets (0.5489) compared to bull markets (0.4661) presents a higher magnitude. Furthermore, the RMB1² coefficient exhibits a greater magnitude during bearish (−0.0893) than in bullish periods (−0.0138), further substantiating the presence of more pronounced herding behaviour in declining market conditions. This differential in coefficient values across market conditions implies that value investors demonstrate a heightened propensity to herd during market downturns relative to upward market trends.
Panel B presents the volatility dynamics driving the herding behaviour identified in Panel A. The statistically significant ARCH term (p value < .01) confirms that market shocks in period t – 1 significantly affect CSAD volatility in period t. This shock sensitivity is particularly accentuated during bearish markets, as demonstrated by the larger ARCH coefficient (0.1192) compared to bullish periods (0.1021). In contrast, the GARCH coefficient shows lower persistence during bearish markets (0.8529) relative to bullish conditions (0.7113), suggesting distinct volatility patterns across market phases. This suggests that while volatility persistence exists in both market conditions, it follows a more reactive pattern during bearish markets compared to bullish markets. Specifically, (a) the higher ARCH effect in bearish markets implies that investors respond more strongly to recent market shocks, amplifying short-term volatility and (b) the lower GARCH persistence in bearish markets indicates that volatility decays faster, reflecting a more transient yet intense reaction to adverse market movements.
The GARCH (1,1) results in Panel B demonstrate that the observed CSAD reduction (negative RMB1² coefficient) in Panel A reflects authentic herding behaviour rather than spurious effects of market volatility or shocks. As previously established, normal investor responses to market shocks (L.ARCH) and volatility persistence (L.GARCH) would typically increase return dispersion (higher CSAD). Nevertheless, our findings present that the RMB1² coefficient maintains its significant negative association even after controlling for these volatility components. This persistent pattern suggests progressively convergent investor behaviour despite rising market shocks.
Notably, these results persist after controlling for both market shocks (ARCH effects) and volatility clustering (GARCH persistence). The robust negative association provides compelling evidence that the documented return dispersion patterns stem from intentional herding rather than automatic responses to market fluctuations. This robustness model carries important implications, as it confirms the efficacy of combining nonlinear CSAD modelling with GARCH techniques to disentangle genuine herding behaviour from volatility-related effects.
Additionally, our analysis of Table 5 in Panel B presents asymmetric volatility patterns that illuminate distinct herding dynamics across market conditions. The results demonstrate significantly lower volatility persistence during bearish markets (L.GARCH = 0.7113) compared to bullish periods (L.GARCH = 0.8529), accompanied by greater sensitivity to recent shocks in declining markets (L.ARCH = 0.1192 versus 0.1021 in rising markets). This volatility asymmetry manifests in two behaviourally distinct patterns: crisis-period herding exhibits stronger initial reactions to negative shocks (supported by both elevated L.ARCH and more negative RMB1² coefficients) yet faster dissipation (lower L.GARCH), indicating intense but transient clustering behaviour.
Conversely, bull-market herding shows more gradual but enduring convergence (higher L.GARCH), suggesting persistent though less pronounced coordination among investors. These findings collectively show that market stress triggers more dramatic but shorter-lived herding responses, while favourable conditions foster steadier, more sustained clustering—a dichotomy consistent with behavioural finance theories predicting asymmetric investor responses to gains versus losses. The results particularly align with the disposition effect framework, where investors typically demonstrate greater sensitivity to losses than equivalent gains.
The analysis uncovers two distinct herding regimes contingent on market conditions. During bearish periods, herding behaviour demonstrates reactive characteristics, as captured by elevated L.ARCH coefficients (0.1192 vs 0.1021 in bullish markets) that signify heightened sensitivity to market shocks. This pattern reflects rapid information cascades wherein value investors interpret widespread selling activity as indicative of superior private information, leading to immediate divestment decisions without comprehensive analysis. The consequent sharp contraction in CSAD measures occurs despite elevated volatility conditions that would normally amplify return dispersion.
Conversely, bullish market conditions exhibit more gradual herding dynamics, evidenced by greater volatility persistence (L.GARCH = 0.8529 compared to 0.7113 in bear markets). In these circumstances, value investors systematically emulate buying trends based on anticipated market expansion, even though with more measured initial responses. This behavioural pattern corresponds with momentum trading strategies, 2 where market participants utilize collective actions as informational signals, yielding more stable investment behaviour manifested through modest CSAD reductions (RMB1² = −0.0138 in bullish periods versus bearish markets). These differential patterns substantiate that herding phenomena are fundamentally context-contingent, varying systematically with prevailing market conditions.
The results reveal fundamentally distinct herding mechanisms between bearish and bullish markets. (a) Reactive herding in bearish markets: the observed pattern aligns with loss aversion behaviour, where investors exhibit strong but short-lived clustering in response to negative shocks. (b) Persistent herding in bullish markets: the enduring nature of herding during upward trends reflects momentum-driven behaviour, where investors’ FOMO on positive trends sustains the clustering effect over time.
These findings both align with and extend prior literature. Consistent with Chang et al. (2000), we document stronger herding during bear markets. However, we identify a previously undocumented asymmetry: shock-driven convergence during downturns (information cascades) versus momentum-based dispersion during upturns (bounded rationality). This challenges aggregate-level studies (e.g., Danila, 2023; Gavrilakis & Floros, 2023; Papade et al., 2021). A more comprehensive discussion, including how our findings extend Ju’s (2020) framework, is provided in the Implications subsection.
This study establishes that traditional value investors utilizing single-metric valuation in ESG portfolios demonstrate unique herding behaviours that diverge fundamentally from general investor patterns. Contrary to their typical contrarian disposition, traditional value investors exhibit rational herding when confronted with ESG evaluation complexities, a phenomenon best explained through the complementary lenses of information cascade theory and bounded rationality theory. Our analysis presents crucial asymmetries: bearish markets trigger reactive, panic-driven herding with rapid decay (consistent with loss aversion), while bullish conditions foster persistent momentum-chasing behaviour. These findings advance sustainable behavioural finance literature by demonstrating how market phases and analytical constraints jointly shape investment decisions, highlighting the need for herding metrics that account for both investor-specific characteristics and market conditions.
Several limitations should be considered. First, while the research utilizes the MB ratio as a well-validated value investing metric in financial literature (Battisti et al., 2019; Piotroski, 2000), its exclusive focus on single-metric value investors may not completely represent the spectrum of value investing. Crucially, the observed herding behaviour specifically characterizes traditional value investors, suggesting this phenomenon may not generalize to other value investor types. Consequently, our finding of market-phase-dependent herding asymmetry is most directly applicable to this specific subgroup. This finding, which manifests as panic-driven behaviour in bear markets versus momentum-chasing in bull markets, may not fully capture the behaviour of value investors using composite or multifactor metrics.
Second, the Southeast Asian emerging market context may limit generalizability to other regions with different market structures. Therefore, the external validity of the documented market-phase asymmetry in herding is constrained by this limitation. This asymmetry may be particularly pronounced in the high-volatility context of Southeast Asian emerging markets. Therefore, caution should be exercised when generalizing these specific patterns to developed markets with different volatility regimes and investor compositions. Third, variations in ESG reporting standards across markets could affect comparability. Consequently, our interpretation of herding as a response primarily to ESG evaluation complexity is the most sensitive to this data limitation. Heterogeneous reporting quality may introduce an alternative channel of information uncertainty.
Separately, it is important to emphasize that these findings are derived from value investors’ stock portfolios that depend principally on single valuation metrics (specifically, the MB ratio), rather than comprehensive fundamental analysis that evaluates the relationship between ESG performance and corporate financial performance. In accordance with established studies (Fama & French, 2012, 2015; Fong, 2018), we classify these investors as traditional value investors, defined by their predominant use of single-factor valuation approaches. This definition aligns closely with the characteristics observed in our sample, ensuring methodological consistency. Taken together, the findings most sensitive to these limitations are the observed market-phase asymmetry in herding and its interpretation as a response to ESG evaluation complexity. These results should therefore be interpreted primarily within the context of traditional single-metric value investors. This interpretation is specific to investors operating in emerging markets with heterogeneous ESG reporting environments.
These constraints suggest four promising research directions: (a) comparative studies of herding patterns across investor categories (institutional/retail, domestic/foreign), (b) investigations of value investors employing multifactor analytical frameworks, (c) cross-regional analyses between developed and emerging markets and (d) longitudinal examinations of how evolving ESG reporting standards influence herding dynamics. Future research should particularly explore how varying levels of analytical sophistication moderate both rational and irrational herding in sustainable investing contexts.
Managerial Implications
This study extends prior research (i.e., Danila, 2023; Gavrilakis & Floros, 2023; Papade et al., 2021) by specifically demonstrating this phenomenon among value investors, particularly those following traditional value investment approaches. Our additional finding aligns with Chang et al.’s (2000) conclusion regarding stronger herding behaviour during bearish market conditions compared to bullish periods. Building on Chang et al. (2000), we identify a previously undocumented market-phase asymmetry: value investors exhibit shock-driven convergence during downturns (consistent with information cascades) but momentum-based dispersion during upturns (reflecting bounded rationality). This dichotomy challenges the assumption of uniform herding behaviour in prior studies (e.g., Danila, 2023; Papade et al., 2021) and offers new evidence of how cognitive frameworks interact with market conditions.
This study advances theoretical understanding of herding behaviour by demonstrating how information cascade theory (Bikhchandani et al., 1992) effectively explains the asymmetric patterns observed in ESG investing. While Ju’s (2020) comprehensive framework identifies multiple theoretical drivers of herding behaviour, our findings particularly validate the relevance of information cascades in sustainable investment contexts. The emergence of herding tendencies among typically independent value investors suggests that ESG investing introduces unique social-informational dynamics that transcend traditional value investing. This represents a significant contribution to the behavioural finance literature, revealing how non-financial investment criteria can modify conventional market behaviour patterns.
Our findings further demonstrate that bounded rationality theory (Simon, 1955), a perspective not previously identified by Ju (2020) in herding contexts, complements information cascade theory in explaining the herding behaviour observed among traditional value investors. Simon’s (1955) foundational work suggests investors often make suboptimal decisions due to cognitive limitations when processing complex information, a challenge particularly relevant for value investors attempting to incorporate ESG data into portfolio construction. This complexity arises from persistent inconsistencies in empirical research regarding the ESG financial performance relationship (e.g., Danni et al., 2024; Gupta & Roy, 2023; Nirino et al., 2021; Simin et al., 2023; Velte, 2017; Zhang, 2025), creating an information environment that may prompt investors to rely on heuristic simplification. Supporting this view, Sood et al. (2023) demonstrate that investors only meaningfully incorporate ESG information, when it has a positive financial impact. Value investors operating in environments, where ESG financial materiality remains empirically contested rationally default to herding behaviour as an efficient decision-making strategy. Such behaviour represents a cognitively constrained response to ESG information that demands complex verification processes and linkages.
The full sample analysis in this study aligns with findings from Danila (2023) and Papade et al. (2021), who could not detect herding behaviour in both cross-country and single-country analyses of emerging markets. However, our research presents distinct herding patterns when differentiating by value investors’ types across bullish and bearish market conditions. We further examine these patterns through the complementary lenses of information cascade theory and bounded rationality theory. These differential herding patterns provide additional explanation for Gavrilakis and Floros (2023)’s finding that herding occurs not only during extreme economic crises. Our results suggest that herding may also manifest among investors with analytical limitations, as identified in our sample, potentially occurring even in developed markets
The comparison between full-sample and split-sample analyses highlights the necessity of examining herding behaviour through an investor-specific lens. These empirical findings present distinct herding patterns among value investors during ESG portfolio formation that conventional aggregate measures have not fully captured. Previous ESG herding studies (e.g., Danila, 2023; Gavrilakis & Floros, 2023; Papade et al., 2021) have yet to adequately address these specific behavioural patterns. The observed differences demonstrate how traditional herding metrics may overlook important variations across investor types. These results underscore the value of developing more differentiated approaches to studying herding behaviour, particularly in ESG investing contexts where investor motivations and strategies may vary substantially.
Our findings highlight actionable opportunities for both market oversight and the ESG data industry. For regulatory and standard-setting bodies, the evidence of investor-specific and market-phase asymmetric herding underscores the value of developing more nuanced surveillance approaches. It also highlights the need to advance disclosure frameworks. Such frameworks should enhance the comparability and decision-usefulness of ESG information. For ESG rating agencies and data providers, these results reveal a significant market opportunity. Creating products that reduce the complexity of integrating ESG data into traditional value screens could meet a clear investor need. This could involve developing integrated ESG metrics or scores that align directly with conventional valuation heuristics, such as the MB ratio. Such tools would empower more autonomous decision-making and potentially mitigate herd-driven volatility.
Footnotes
Authors’ Contribution
Nugroho Wisnu Murti: Conceptualization, methodology, investigation, formal analysis, writing—original draft, visualization.
Slamet Sugiri: Supervision, writing—review & editing, validation.
Singgih Wijayana: Supervision, writing—review & editing, validation.
Zuni Barokah: Writing—review & editing, validation.
Declaration of Conflicting Interests
The authors declared no potential conflicts of interest regarding the research, authorship and/or publication of this article.
Ethical Declaration
The authors abide by all the ethics involved in this academic work and have not submitted it to any other journal.
Funding
The authors received no financial support for the research, authorship, and/or publication of this article.