
Abstract
This article examines the factors and processes of export diversification in a sample of 95 countries in the years 2010–2023 using dynamic spatial Durbin model as estimated by quasi-maximum likelihood. The use of spatial dependence by incorporating nearest neighbour and inverse distance weighting matrices shows that there is a strong dependence on path, implying that there is persistence in the patterns of diversification with time. Human capital becomes the biggest contributor, where it brings in a lot of long-run benefits but with low spillover impacts. Conversely, GDP per capita and trade openness have direct negative effects on diversification, and the positive indirect effects of these measures under the global weighting scheme are not enough to counter these decreases. Natural resource rents and population size are statistically insignificant. The spatial feedback effects are different in the weighting schemes, whereas the tests of diagnostics prove the model’s robustness. Overall, the results highlight the importance of human capital investment, inclusive diversification policies and regional cooperation as crucial to sustainable export diversification and sustainable economic development.
Introduction
The growth of the economy of lower- or middle-income nations is largely dependent on heightened diversification, but not on specialization; thus, export diversification is commonly perceived as one of the elements in raising the economic growth foundation of a nation. It is not inherent, but export diversification is an indication of the basic economic development and productive potential of the country. Export diversification transforms the export composition and structure of a country, and this could be done by either technological innovation or by alternating current patterns of export commodities (Dennis & Shepherd, 2011). So, export diversification plays a very important role in economic growth and makes the economy less risky by reducing dependence on a limited number of products and markets (Wani, 2026). As a critical element of economic growth since the middle of the 20th century, policymakers have tried to enhance sustained growth and structural change, especially in low- and middle-income countries (Rujun et al., 2019).
Although a growing body of research indicates that diversification of exports may be beneficial to the economic growth of an economy, there is also an emerging school of thought that increased levels of income, increased levels of human capital and increased market size are themselves important stimuli to diversification. Economic growth aids in the diversification of exports by loosening financial and technological bottlenecks that allow firms a chance to embrace new production processes and facilitate learning and knowledge dispersion among the sectors. In this regard, diversification, as in the expansion of higher-technology products, often results rather than causes the development of work, as well as helps in stabilizing the macroeconomic environment in general (Aditya & Acharyya, 2013). In the same way, the shift of the primary exports to manufactured goods is also associated with the process of structural change that is strictly correlated with the increasing income rates and the accumulated potential (Hesse, 2009). Similarly, increased economic complexity, such as transitioning from low-tech to high-tech innovative products, further supports export diversification, which in turn significantly enhances economic growth (Canh & Thanh, 2022).
The Industrial Revolution in the past suggested that economic growth and technological advancement allowed countries to produce more and reorganize the export structure, thus shifting the trend in international trade. Empirical research shows that innovation and export diversification are closely related, and those countries where the assortment of products is greater tend to be more productive, grow quicker and have better living standards (Daude & Fernández-Arias, 2010; Klinger & Lederman, 2006). These trends signify that the process of diversification is a dynamic one that changes with the increase in the economy, as well as with the buildup of capabilities, as depicted in Figure 1.
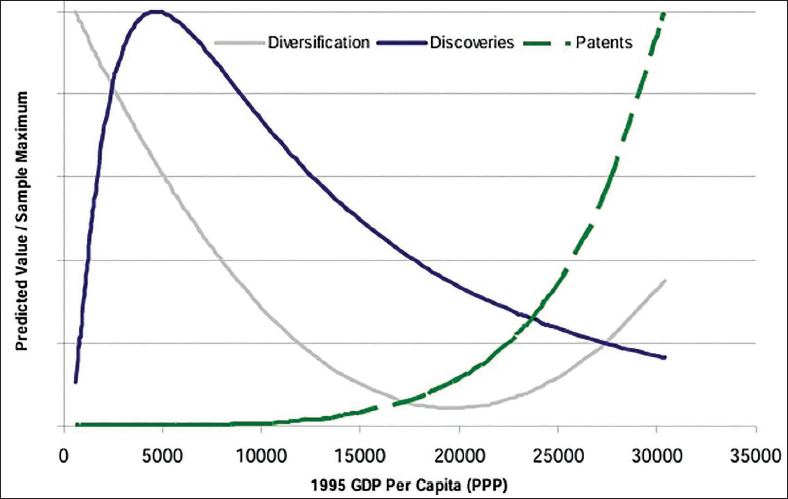
Countries that have greater product mixes in terms of exports tend to have greater productivity, rapid economic development, as well as better standards of living (Daude & Fernández-Arias, 2010). Diversification of exports allows companies to gain new knowledge and distribute the risk and resource allocation in a more effective way. The example of Brazil provides evidence that the new exports are frequently the result of product and process innovation, domestic strategies, including brand building, and more effective distribution channels. It implies that the success of a business is not only determined by the endowments of natural resources, but businesses can grow thanks to innovative solutions and adequate positioning in the market even in settings where resources are limited (Cirera et al., 2015). Governments can achieve this by encouraging diversification of exports, funding innovative companies, investing in research and enhancing intellectual property rights. These practices decrease the dependence on a few types of commodities and lead to more predictable long-term export earnings (Chang et al., 2024). With a globalized economy, trade in various goods and different destinations intensifies relationships between markets, making it possible to have a smoother exchange of ideas, capital and goods (Oliveira et al., 2024).
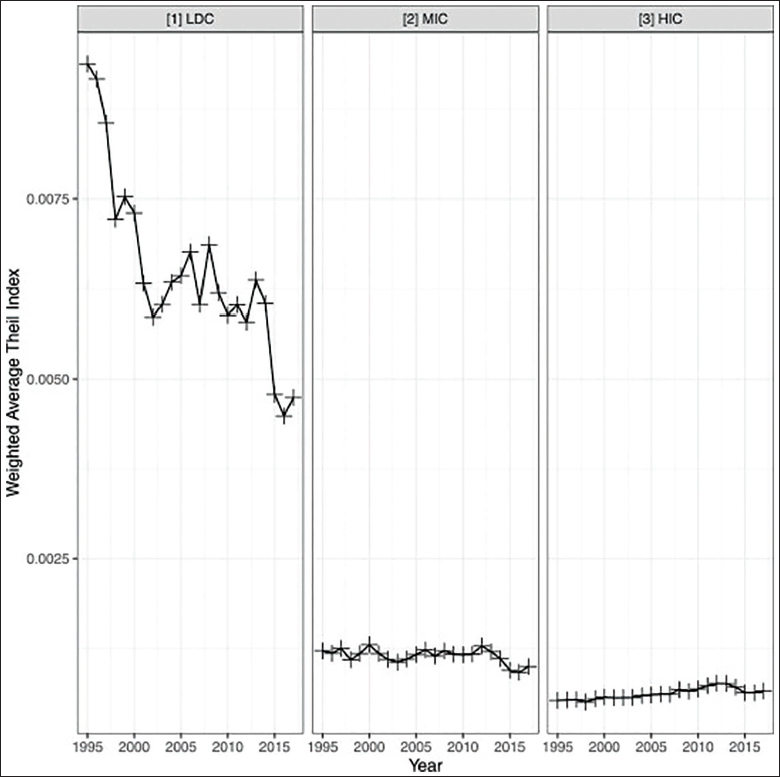
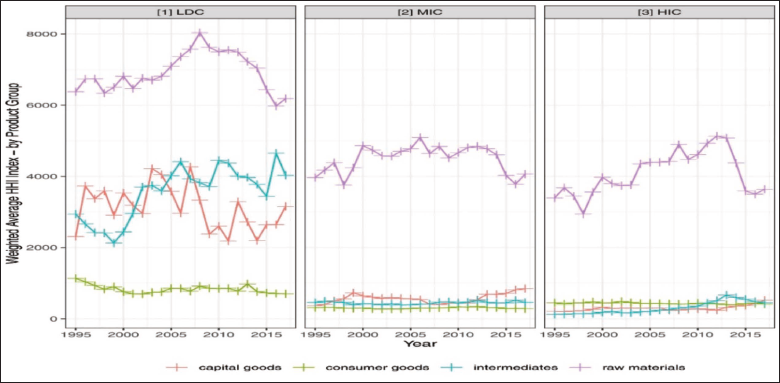
Export diversification has both positive and negative effects on growth depending on income groups. Although there are conflicting empirical findings, the bulk of the literature suggests that diversification is a major factor that supports the economic growth of low-income and developing nations (Sarin et al., 2022). This effect is seen to have a positive effect on the GDP per capita in lower- and middle-income countries and a negative effect in high-income countries (Gozgor & Can, 2016). Graphical results in Figures 2 and 3, based on Theil and Herfindahl–Hirschman indices, indicate that least developed countries are more diversified, middle-income countries are stable and high-income countries are slightly concentrated, which shows variations in the structure of exports (Mora & Olabisi, 2023).
The manufacturing export performance effect on service export diversification reveals that manufacturing export promotes diversification in the service export, especially in less developed countries where manufacturing exports are not so common (Gnangnon, 2021). On the same note, another study concludes that richer nations are more likely to export due to their high technology, whereas larger nations enjoy the advantage of economies of scale (Basile et al., 2018).
Studies on the relationship between export structure and economic growth depict inconsistent results. Even though it has been stressed in many studies that the diversification of exports into more products and markets will spur growth and stability, especially in the smaller or low-income nations with strong institutions, this has not always been the case. Some studies also no longer see a significant long-term relationship (Benli, 2020; Siswana & Phiri, 2021); however, some studies do not (Facts, 2012; Lee & Zhang, 2022). Strategic diversification and not over-concentration have been positive for the countries in the BRIC organization, where China leads the pack in terms of gains, and Brazil and South Africa have recorded positive performance. In emerging economies, export expansion is generally dependent on increasing sales of the available products (intensive margin) and not on the introduction of new products (Amurgo-Pacheco, 2008). Diversification is encouraged by human capital, infrastructure, market size and macroeconomic stability, and specialization might be promoted by augmented openness and exchange-rate volatility. The prospective opportunities of the products and markets may be further highlighted using emerging tools, such as digital trade and outward foreign direct investment (FDI), but the overall impact of the openness and FDI is still subject to context (Agosin et al., 2012; Ngassam, 2024; Ouyang & Park, 2024; Zhang et al., 2024).
Although it is understood that the diversification of exports is very crucial in influencing the growth of the economy, most of the research assumes that nations exist in a vacuum and ignores the impact of the surrounding economies. The gap is also evident, especially between 2010 and 2023, when the emerging economies, more so the BRICS, formed new patterns of trade and global linkages. The interdependence of countries and the existence of integration, supply-chain linkages and regional shocks imply that they are interdependent, which is why the relationship between spatial spillovers and the diversification–growth nexus should be analyzed. In this work, a relative Theil index was generated based on the data of UN COMTRADE (AG6) on 95 countries between 2010 and 2023 to test the hypothesis that GDP per capita, openness to trade, population, dependence on resources and human capital index influence the diversification of countries.
To fill the identified gap, the proposed study addresses the following two key questions: What is the relationship between export diversification and economic growth across countries, and what are the spatial spillovers in both the immediate and the long-term effect on the relationship? The research aims include: first, to investigate the immediate and secondary impacts of economic growth on export diversification; second, to evaluate the implications of spatial dependence in determining country-specific and cross-border outcomes; and third, to offer evidence-based research on how to inform policies towards trade, regional cooperation, and development in both developing and developed economies. The primary value of the given article is its ability to determine major economic and structural factors that determine export diversification, as well as to evaluate the impact of spatial dependence on the diversification process on a country basis. The study considers export diversification as an endogenous and path-dependent variable determined by economic growth, human capital, trade openness and cross-border spillovers as opposed to analyzing the growth impact of diversification using a dynamic spatial Durbin model (DSDM).
Emerging Economies
The economies-of-scale hypothesis implies that, with access to both large domestic and international markets, the firms can utilize the large market to disperse fixed costs, innovation and differentiated products, hence encouraging diversification of exports and economic growth in the emerging economies. The bidirectional correlation between export diversification and growth has been proven by E7 countries, which is supported by the growth of market size and absorptive capacity (Can et al., 2024). Within the BRICS framework, Siswana and Phiri (2021) demonstrate that the export concentration may provide a boost to growth in certain circumstances by taking advantage of scale economies, but the result varies across countries, with China faring better because of its large market and integration into the global economy, and Brazil and South Africa being more susceptible to external demand shocks.
Correspondingly, Ozkaya and Yucel (2021) discovered a high causal relationship between export diversification and growth in Turkey and BRIC economies. They emphasize the influence of the global demand in enhancing scale and specialization effects. The export bundle view also highlights the significance of export composition, where Naude and Rossouw (2011) find that there is a U-shaped relationship between diversification and income in which early diversification shifts to specialization as capabilities are built.
Aulakh et al. (2000) provide firm-level evidence that differentiation strategies are more useful in developing markets, and the benefits of diversification are accrued by larger firms. Rising protectionism has also strengthened the necessity of diversification, which Shalupayeva (2021) has suggested to ensure diversification of products and markets to minimize vulnerability. The size of domestic markets is also an important factor, as it allows companies to experiment and scale innovation (Cirera et al., 2015), whereas diversification is path-dependent and policy-influenced (Alonso & Martín, 2019). Indian evidence shows the ability-based diversification by using related products (Aggarwal, 2021), and the Asian financial crisis indicates that diversified economies are better able to withstand external shocks, despite risks of regional dependence (Tantisantiwong, 2010).
Developing Economies
In developing economies, export diversification and economic growth have a mutually reinforcing relationship, which is mainly fuelled by increasing market size and economies of scale. The CEMAC region (1995–2015) evidence supports the idea of bidirectional causation of diversification and growth, but country-specific variations remain (Ntavoua et al., 2025). This linkage is also supported by cross-country analyses. Based on the data on 62 developing countries, Handoyo and Ibrahim (2021) determine that diversification is positively correlated with the growth of GDP, population, competitiveness, and research and development, and the role of human capital varies among the income groups. The broader evidence of 101 countries points to the significance of income levels, the openness of trade, the manufacturing capacity and the FDI, but the dependence on agriculture and the strict exchange rate regimes limit diversification.
Dynamic panel studies can offer a better understanding of scale mechanism. Aditya and Acharyya (2013) reveal that export diversification and composition are more growth-inducing than infrastructure or investment, especially when income is low, and it is more concentration-inducing when income is high because of scale economies. The same results are provided by Hamed et al. (2014), who indicate that diversification decreases volatility and improves growth, particularly in less developed economies.
The heterogeneity of regional evidence is also observed in ASEAN, where the relationship between diversification and growth is determined by structural factors (market size and industrial composition) (Hinlo & Arranguez, 2017). Mania and Rieber (2019) warn that involvement in global value chains without structural transformation can lead to long-term reliance on imports. The Latin American experiences support these observations, in which growth commonly occurs through the current products even though the export structure is diversified (Agosin & Arango, 2015), and in which diversification is usually a consequence of a structural change, not a prerequisite. Horizontal and vertical diversification boosts growth due to the effects of learning and competition (Herzer & Nowak-Lehnmann, 2006).
The significance of scale economies and institutions is further supported by sectoral and policy evidence. Diversification contributes to the development of major industries in Thailand (Jongwanich, 2020), and the success of Malaysia is the result of good industrial policy and investment in research and development (ESCAP, 2004).
Institutional factors such as FDI, human capital and macroeconomic stability are critical (Alemu, 2008), whereas resource dependence often leads to concentration, particularly in Africa (Ross, 2019). In Pakistan, diversification is closely linked to GDP growth, supported by human capital and manufacturing capacity (Mufti & Ali, 2024).
Low-income Economies
Low-income economies have very strong structural limitations in the process of attaining export diversification, although the potential gains are high. Diversification lowers volatility in exports, improves economic resilience and sustainable development, especially in countries with good institutional quality (Facts, 2012). Yet, poor facilitation of trade and a mismatch between government policies and the requirements of the private sector are still key challenges (Bonaglia & Fukasaku, 2003). As empirical data indicate, product and market diversification are more beneficial to the economies of smaller and less developed countries, which are more susceptible to external shocks (Lee & Zhang, 2022). Export-led growth in Sub-Saharan Africa has a relationship with economic performance in the long run, but diversification is still weak (Ee, 2016). Resource dependence also increases the concentration of exports, especially in Central African economies (Bertelet et al., 2022). There are structural patterns of diversification, as examined by global analyses. Zheng et al. (2024) find that the effect of population and education on the export structures is hump-shaped, and that diversification and income levels have a hump-shaped relationship, which is in line with the economies-of-scale hypothesis.
Materials and Methods
Theoretical and Conceptual Framework
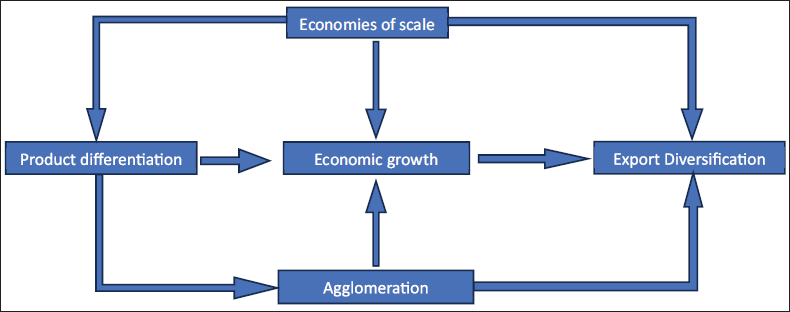
Export diversification extends the number of goods that a country can sell in the international market, and this makes it less vulnerable and facilitates its growth and stability. Spatially, the economies that are adjacent to one another affect each other, and the diversification and development process can take a non-linear form: the initial growth stimulates the diversification process, and the subsequent stages can lead to the concentration of activities in some areas. New Trade Theory (NTT) is the explanation of diversification through economies of scale, differentiation of products and imperfect competition, demonstrating that even similar countries with resources continue to trade, and that integration can lead to an increase in productivity and welfare (Evaggelos, 2024; Krugman, 1979). In the meantime, New Economic Geography (NEG) also examines how agglomeration and dispersion work to drive industry agglomeration (Krugman, 1991; Mossay & Picard, 2020). This work is based on a spatial approach to considering the export patterns (Basile et al., 2018).
The framework associates critical variables with either export concentration or export diversification, and these variables include the Theil index and the GDP per capita, which show the level of development. The size of the population is an indicator of market size that promotes specialization and diversity. Openness to trade improves access to the market and competition, which generally leads to an increase in diversity (Agosin et al., 2012; Mau, 2016). Human capital increases the possibility of transforming towards more sophisticated sectors (Ali, 2017). This dependency on natural resources can keep economies in the primary sectors, preventing any diversification and expansion in the high-tech sectors (Mania & Rieber, 2019; Zarach & Parteka, 2023). Cross-border spillovers are parallel to the NEG, where the framework and the essentials of the surrounding areas affect domestic performances; spatial lags of the dependent variable and the key covariates depict this.
This research is conducted using NTT/NEG, and it evaluates both direct and indirect impacts of GDP per capita, population, trade openness, human capital and dependence on natural resources on export diversification. It considers cross-border interaction and agglomeration impacts. These relationships are summed up in Figure 4.
Variables and Their Description
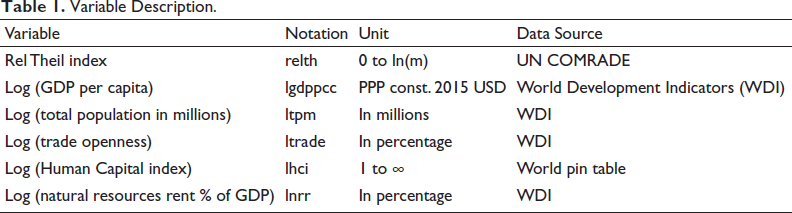
The relative Theil index measures a country’s export diversification and is also used as a dependent variable. Explanatory variables include GDP per capita, trade openness, total population in millions, resource dependence and the human capital index, which help determine the factors affecting countries’ export diversification. Table 1 briefly presents the variables and their data sources.
Variable Description.
Variable Description.
The data utilized to construct the Rel Theil index are sourced from the UNCOMTRADE website as HS6 data, reported by exporting nations, encompassing all modes of transportation costs to the rest of the world. Based on Basile et al. (2018), the Rel Theil index was utilized to assess export diversification and was computed as follows for each year for each country:
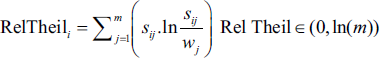
where
Global Moran I and Local Indicators of Spatial Association
Spatial dependence reflects how neighbouring regions influence one another through spillover effects and shared characteristics, creating interdependence across space (Anselin, 1995). Global Moran’s I is widely used to detect spatial autocorrelation and justify spatial modelling. It is calculated as:
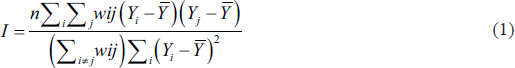
where n is the number of regions, Yi is the observed value, Ȳ is the mean, and Wij represents spatial weights with wii = 0. The null hypothesis assumes no spatial autocorrelation. I ranges from +1 (clustering) to −1 (dispersion), while 0 indicates randomness (Moraga, 2023).
To identify local clustering, Local Indicators of Spatial Association (LISA) decompose global patterns. The local Moran’s I is defined as:
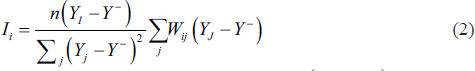
The sum of the local Moran’s I for each location determines the global Moran’s I:
Wij is a weight metric that provides both a numerical measure of geographic effect among observed individuals and a necessary condition for Moran I testing and spatial econometric modelling (Zhang & Yu, 2018). In academic research, spatial weight matrices are typically defined by factors like geographic proximity, distance and economic distance (Zhang et al., 2017). This involves selecting two weight metrics. The first is the KNN6 weight metric, which ensures that each country is connected to at least six neighbours, thereby maintaining geographic proximity. The second is the inverse distance metric, which enhances robustness by accounting for export diversification with slightly higher distances. The first matrix (W1) is a k-nearest neighbours 6 (KNN6) weight metrics matrix with row standardization, and the second matrix (W2) is an inverse distance matrix, also row standardized. It is defined by its general term as follows:
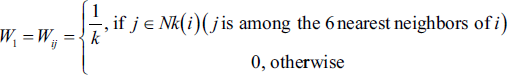
Similarly, select W2 as the inverse distance metric with row standardization.
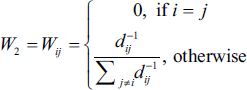
In W2, a fully connected inverse distance was used with a row-standardized weight matrix. Nearby countries will have higher weights compared to distant countries. Each row will be equal to 1, and every country is connected to all others. This helps create a comprehensive network of relationships among countries, especially for trade.
The improved form of cross-sectional dependency is redefined by Pesaran (2015), who tests cross-sectional correlation in errors that are not handled in panel models, making estimates that are not consistent. The cross-sectional dependence (CD) test checks whether residuals are correlated between units. If they are, you might need factor structures, spatial panels or strong covariance estimators. Equation (3) outlines the method for determining the cross-sectional dependency among the variables.
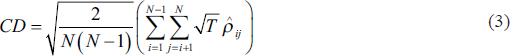
In Equation (4), the sample correlation of residuals between cross-sections is shown. Cross-sections i and j.
Conventional unit-root tests for panels (such as Levin–Lin–Chu [LLC] and Im–Pesaran–Shin [IPS]) presume cross-sectional independence. This assumption is broken in the presence of unobserved common factors, such as international trade cycles or spatial spillovers between nations, which result in low power and size distortions. The cross-sectionally augmented IPS (CIPS) test ‘filters out’ cross-section dependence by adding 
where for every i, to estimate the CADF regression below:

Choosing the right model for spatial estimation is an important step that involves conducting a Lagrange Multiplier (LM) test to find out which model fits best. As explained by Anselin et al. (1996), the robust versions of the LM test—developed by Burridge (1980) include the robust LMlag (RSlag), robust LMerr (RSerr), and the joint SARMA test. There are also two additional tests, adjRSerr and adjRSlag, which are designed to provide robust LM p values that are pooled yearly using Stouffer and Fisher methods.
Spatial Dynamic Durbin Model
A Spatial Dynamic Durbin Model (SDDM) is employed to estimate the model. It builds upon the traditional spatial Durbin model by adding a temporal autoregressive component and capturing the immediate spatial effects through Wyt and Wxt. The SDDM is estimated using quasi-maximum likelihood (QML) and is integrated into the model via eigen. Both maximum likelihood (ML) and QML estimators are well regarded for being bias-corrected and for not relying on the assumption that the error term is normally distributed. Here is a general equation for the two weight matrices, W1 and W2. Using these two matrices, the overall SDDM model is illustrated below:

Equation (6) demonstrates that its own past (
Based on the above model, we formulate separate equations for the variable of interest using both spatial weight matrices, 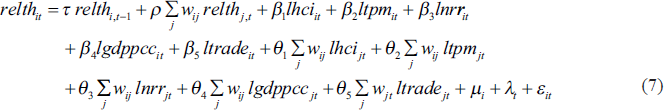
The Reil–Theil index (relth) is defined as the dependent variable in Equation (7), while other variables such as lhci (log of the human capital index), ltpm (log of the total population in million), lnrr (log of the total natural resources rent), lgdppcc (log of the GDP per capita) and ltrade (log of the trade openness) are considered independent or explanatory variables.
Global Overviews of Export Diversification
The Relative Theil index results in Figure 5 indicate that most countries fall within a moderate range of export diversification, suggesting neither heavy dependence on a few products nor complete diversification. But there are significant cross-country differences. The lowest index values are constantly recorded in China and India, with well-dispersed export structures. China is the most diversified exporter during the 2010–2023 period, with its index decreasing to 0.82, and this indicates that the country is shifting to more advanced and high-tech production, but the export base is very broad. Conversely, those countries that are least diversified are mostly resource-based economies. Gambia, the Central African Republic and Yemen have the highest index values recorded over the years, which means that they have a high dependence on a few commodities like agriculture, timber, diamonds and oil. Most medium and large economies are in the middle range (2–4), with moderate levels of diversification.
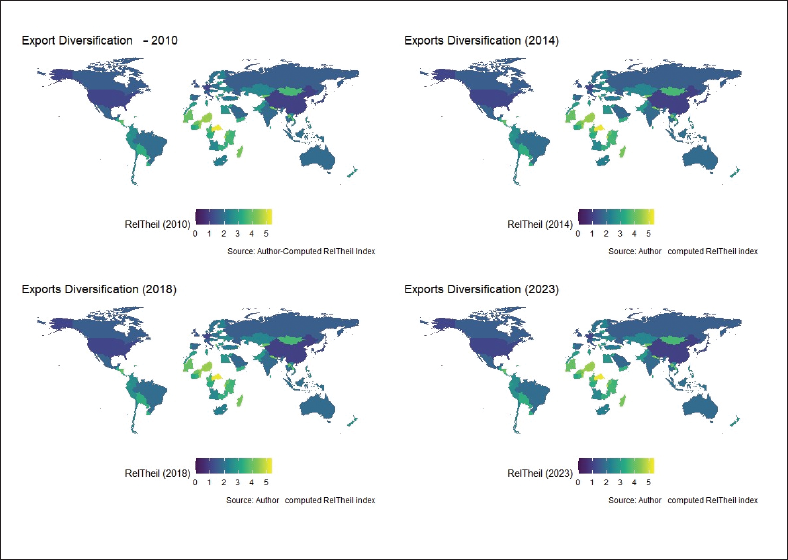
Large Theil indexes are an indicator of susceptibility to external shocks because of reliance on a small export base (Balavac & Pugh, 2016). UNCTAD (2024) argues that this concentration does not provide enough time to absorb price and demand variability, which highlights the importance of diversification. On the other hand, the diversified exports enjoyed by countries such as China and India improve their economic stability, decrease the risks of the sector and promote long-term growth (Giri et al., 2019).
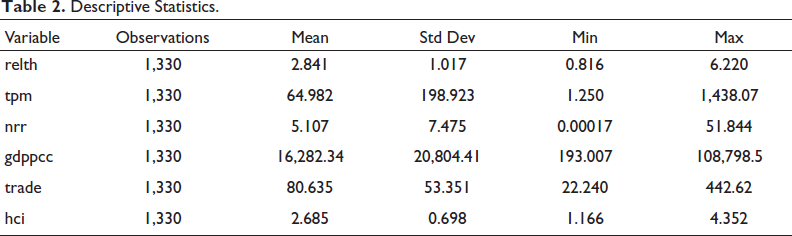
Table 2 presents the descriptive statistics of the variables in the pre-logarithmic forms. The analysis of 1,330 observations showed a moderate range of diversifications in exports (mean = 2.84), followed by most of the countries. Population and GDP per capita, on the other hand, have significant inequalities. The natural resource rents also differ widely, as does trade openness, whereas human capital is not so varied, implying convergence in both education and health despite global economic disparities.
Descriptive Statistics.
Descriptive Statistics.
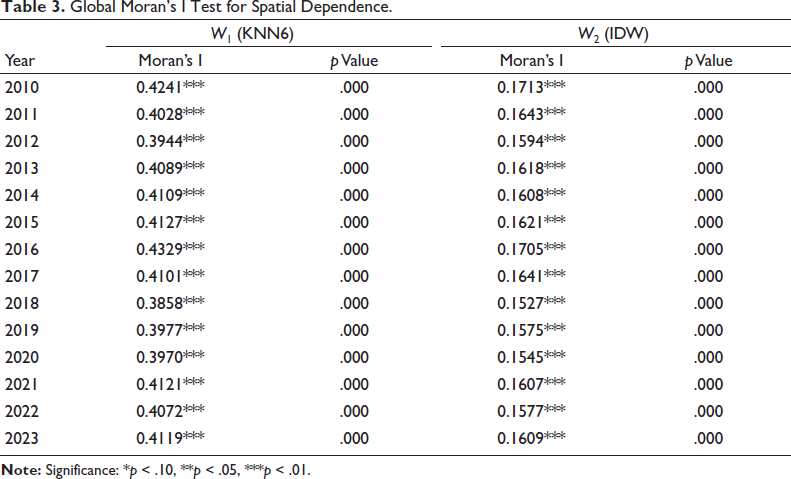
When we analyze Global Moran’s I using W1 and W2 as measures of spatial dependency, we find that we have positive values in all years, implying that we have geographical clustering. Even though the autocorrelation is not that high, Table 3 illustrates that it has consistently better results with W1 as compared to W2. The null hypothesis of spatial randomness is rejected at the 1% level (p < .01) in both cases.
Global Moran’s I Test for Spatial Dependence.
Global Moran’s I Test for Spatial Dependence.
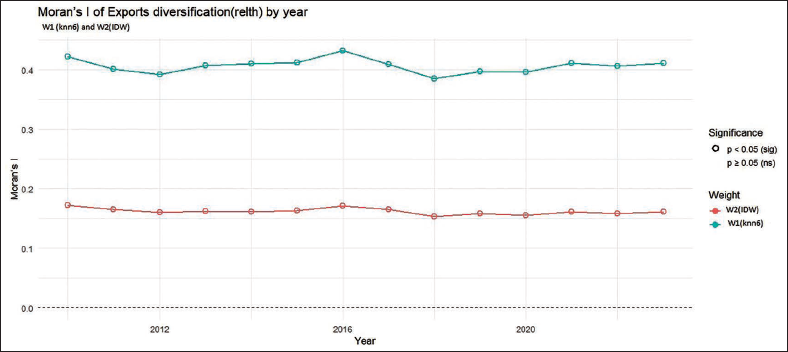
Table 3 is also given in the form of a graph; this aids in showing its relevance at every point of the graph below, and therefore becomes easy to comprehend.
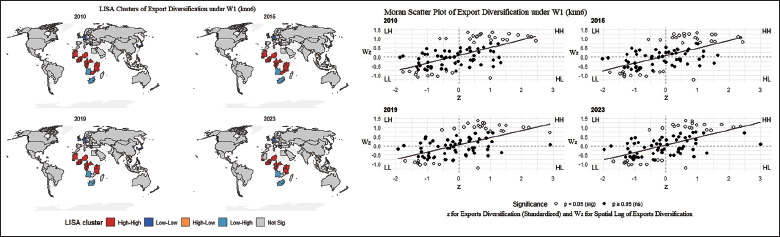
Export diversification patterns are analyzed using LISA clustering and Moran scatter plots using spatial weight matrices W1 (KNN-6) and W2 (inverse distance). The difference in clustering in the world over time is shown in Maps 01–02. Figure 6 presents LISA maps of 2010, 2015, 2019 and 2023 with the use of W1, with lower relative Theil index values indicating greater diversification in the exports among countries.
High–high clusters are low diversification in the presence of similarly concentrated economies, whereas low–low clusters are highly diversified countries clustering together. Mixed patterns are picked up in low–high clusters. There is a strong positive spatial dependence on the Moran scatter plot. Figure 7 (W1) indicates a larger global clustering pattern, which proves interrelated dynamics of export diversification and stability amongst the neighbouring countries.
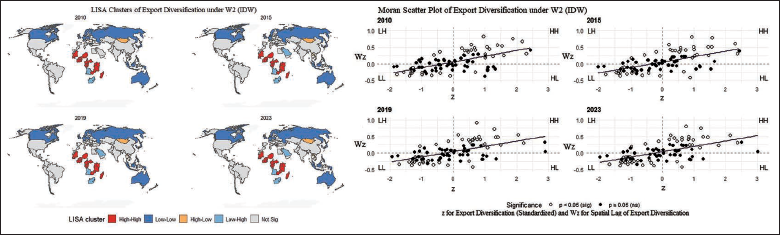
The Moran scatter plot exhibits a significant positive slope, which is not as steep as in W1. The blue (low–low) areas show high diversification that is surrounded by highly diversified nations. The red (high–high) areas, on the other hand, reveal low-diversification countries enclosed by like-low-diversified countries. The W2 approach is much more significant than W1, since the inverse distance is less sparse and results in a distance-decay network, which is less noisy and one that avoids the island-neighbour problem. Therefore, local Moran statistics will outperform the permutation threshold with a flatter slope. The W2 (IDW) findings in general prove the spatial dependency of W1 (KNN6) but indicate it in a much broader space.
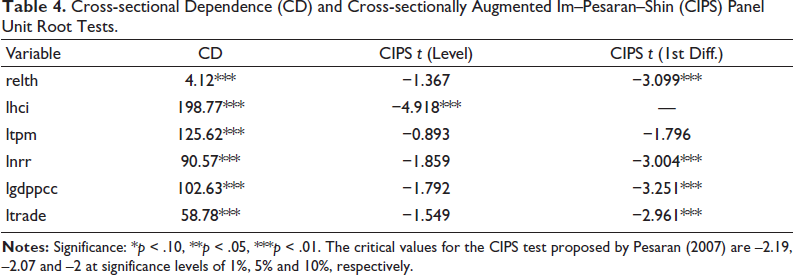
Table 4 provides the CD test, which indicates a high level of interdependence among countries, and the CIPS unit root test (Pesaran, 2007), which is resistant to CD. Findings reveal that there is a large CD in all the variables, which implies that there is transmission of shocks among nations. The CIPS test shows that lhci is stationary at the level, and relth, lnrr, lgdppcc and ltrade are stationary after being differenced, but ltpm is not stationary after differencing. These results support the application of spatial panel models to provide good and consistent estimation results.
Cross-sectional Dependence (CD) and Cross-sectionally Augmented Im–Pesaran–Shin (CIPS) Panel Unit Root Tests.
Cross-sectional Dependence (CD) and Cross-sectionally Augmented Im–Pesaran–Shin (CIPS) Panel Unit Root Tests.
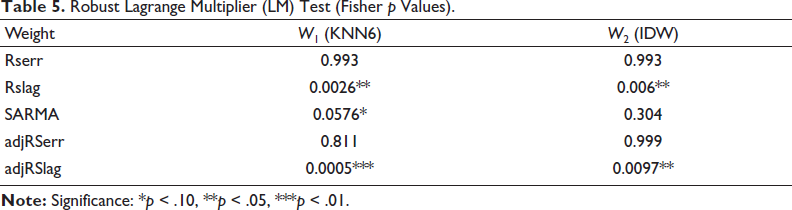
The robust LM results indicate strong spatial lag dependence. In Table 5, RSlag and adjRSlag are significant under both W1 and W2, while RSerr and adjRSerr are insignificant, and SARMA results are inconsistent. These support using the DSDM, incorporating spatial lags of both dependent and explanatory variables.
Robust Lagrange Multiplier (LM) Test (Fisher p Values).
Robust Lagrange Multiplier (LM) Test (Fisher p Values).
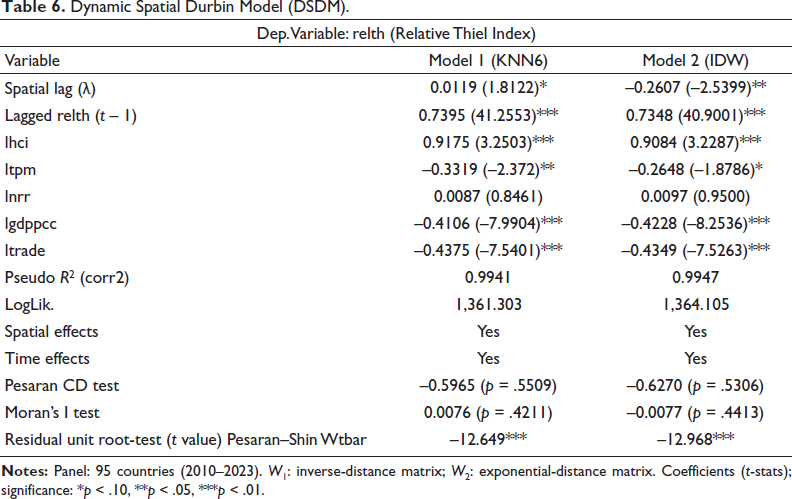
The DSDM can be estimated at the level under mixed stationarity conditions for both weight metrics, W1 (KNN6) and W2 (IDW), as reported in Table 6. In such settings, it is essential to verify the dynamic stability (stationarity) condition, which requires that
Dynamic Spatial Durbin Model (DSDM).
Dynamic Spatial Durbin Model (DSDM).
The positive, insignificant spatial lag coefficient (0.0119) in the KNN6 model indicates that countries follow others in the formation of export structures. Because KNN6 refers to the six closest neighbours of every country, usually bearing a resemblance in their policies and institutions, such as EU members, the positive l implies policy diffusion and collaboration. As an illustration, in the EU, the common trade policies and policies encourage homogenous diversification trends. Hence, it is found that countries are likely to diversify when their neighbours do the same, and convergence is weak but positive, in line with Basile et al. (2018). Conversely, the W2 (IDW) model presents a negative spatial lag (l = –0.2607), which is very significant and can be understood as a negative spillover of the export diversification to the neighbour, which can be taken to be a result of competitive pressure. This is because when the global structure IDW is in place, other countries that produce similar products may consume the common international markets, making other countries not diversify in the world. Two countries that export related items may restrict the potential of each other in terms of new products, particularly when the remote countries are incorporated in lesser number, yet they add to global competition. As mentioned in the descriptive state, most countries are characterized by a moderate level of diversification, neither diversified nor concentrated. Under these circumstances, the global growth of export industries may cause some competitive pressures, which are in line with the dispersion forces outlined by Krugman in NEG (1991) and those competitive forces emphasized by Klinger and Lederman (2006).
The lhci coefficients under W1 and W2 are 0.9175 (t = 3.2503) and 0.9084 (t = 3.2287), respectively, and both are significant at the 1% level. An increase in lhci of 1% increases the level of diversification of exports by 0.81 units and 0.90 units, respectively, at W1 and W2. Well-educated and skilful employees assist companies in a variety of exporting activities. The close relationship between W1 and W2 shows the great importance of lhci in the export diversification. Empirical proof of these findings is in the literature (Agosin et al., 2012; Golo, 2024).
Investigating the ltpm, the growth is coupled with a minor decrease in the export variety, which is important at 5% W1 and 10% W2. This implies that the export basket of a country does not increase as the population increases. Even though an increase in the ltpm can boost labour and demand, difficulty in converting population size to new export goods remains a challenge due to institutional, infrastructural and financial constraints, implying that market access, institutions and human capital are more significant than population size in diversifying exports. The higher value of ltpm in W1 indicates that the role of local demographic spillover among nearby neighbours is important, and the population size is a more effective promoter of export diversification. In this regard, the size of the population and the market size would tend to create common production networks and regional demand links. With W2, though, the effect of population with increasing geographic distance is smaller, and its statistical significance is not significant. This trend suggests that the population mechanism of long-term is spatially confined instead of being distance dispersed. In this way, they can adhere to the law of Tobler that says that nothing is connected to nothing; however, the things that are close are more closely connected than the ones far (Miller, 2004). In economic theory and literature, the negative value of ltpm is recognized, such as in the endogenous growth theory (Acemoglu & Zilibotti, 1997; Grossman & Helpman, 1991). Also, empirical findings are in line with Basile et al. (2018).
Conversely, the lnrr is not significant, which is consistent with Lashitew et al. (2021), who observed that small amounts of resource revenues provide a certain fiscal space to invest, but do not influence an export basket of a country significantly, and the relationship between resource rents and service exports is only marginally positive.
Export diversification decreases as lgdpc rises with W1 and W2. It is not a mere coincidence. Rich societies tend to focus on selected high-value commodities instead of exporting diversified commodities. This is because they possess bigger domestic markets and can enjoy economies of scale. That is, economically richer countries would specialize in what they are most efficient at instead of diversifying their activities across various industries, even considering the geographical distance (Basile et al., 2018). On the same note, ltrade is also negatively correlated to export diversification in both weight measures. More open economies specialize in their areas of strength as opposed to having different products. The NTT argues that market opening will make firms focus on a limited number of areas of strength, independent of neighbours. According to Melitz (2003), the most productive firms that sustain themselves in the export markets are the ones that stay, and the result of all this is a reduced number of varieties that are exported despite the increase in aggregate productivity.
After estimating the models, the following post-estimation analysis is conducted to assess their accuracy. First, to check DSDM stability, which shows strong dynamic stability across both weight metrics in W1 and W2. For W1, the temporal lag of the dependent variable (
Our spatial dynamic Durbin panel model estimates export diversification in countries, accounting for country-specific and time effects, global shocks and common trends. The model’s pseudo R² is high, indicating that it explains nearly all variation in export diversification once spatial and temporal effects are controlled for. The log-likelihood values are high and nearly identical under both weighting schemes, suggesting that W1 and W2 fit the data equally well. Reliable results, free from spurious trends, are ensured by conducting diagnostic tests. After estimating the models, the following estimation is used to verify the model’s accuracy, capture spatial and temporal effects, eliminate residual dependence and eliminate spatial autocorrelation. Residual diagnostics indicate that the Pesaran CD test yields p values well above 0.10, so we fail to reject the null hypothesis of no CD, implying that cross-sectional dependency is not present. The global Moran’s I test indicates no residual spatial clustering, confirming that the model has successfully accounted for spatial autocorrelation. A residual unit-root test strongly rejects the null of non-stationarity at the 1% level, confirming that residuals are stationary, excluding spurious trends, and hence our result properly grounds the models.
Now, let us break down the Wx term’s impact into direct and indirect effects, and then further categorize each effect into short-term and long-term impacts. This way, Table 7 will show the direct, indirect and total impact of each variable.
Short- and Long-run Direct and Indirect Effects Under W1 and W2.
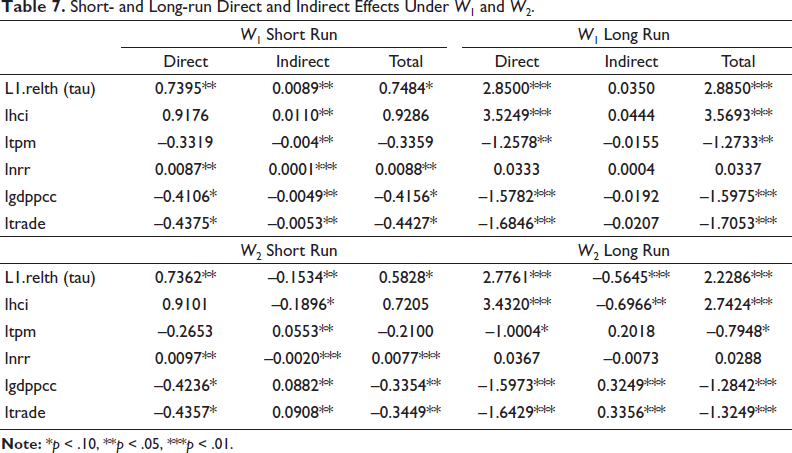
L1.relth (tau) shows a strong and significant direct effect in both the short and long run under W1 and W2, indicating persistent export diversification dynamics. The indirect effect is significant only under W2, suggesting that diversification spills over globally but not among nearest neighbours. Similarly, lhci exhibits a significant and strengthening direct effect over time in both weighting schemes, while its spillover effects remain small and mixed, implying mostly domestic benefits of human capital. lnrr has weak short-run effects with no meaningful long-term impact. ltpm shows no significant immediate effect, but displays mixed spillovers (negative under W1, positive under W2), resulting in a weak overall short-run influence; however, its long-run direct effect is consistently negative and significant. lgdppc and ltrade both exert strong negative direct effects under W1 and W2, reflecting a tendency towards specialization with development and openness, although W2 reveals positive and significant spillovers, indicating regional benefits. Overall, technology and manufacturing intensity also show persistent negative long-run effects with limited spillovers, highlighting structural constraints on diversification.
The Moran scatter plot in Figure 8 exhibits a significant positive slope which is not as steep as in W1. The blue (low-low) areas show the high diversification that is surrounded by highly diversified nations.
The SDDM (two weight metrics W1 and W2) using the QML is approximately equal to the results of the previous model. Export diversification is likely to take the same direction depending on how a country is diversified export-wise. The delayed dependent variable is very important, and its effect is very significant, which causes the countries to continue their existing courses. It is important because human capital emanates as the most viable domestic driver with a long run and considerable influence on diversification and the production of smaller and varied spillover effects on the same. Conversely, both GDP per capita and trade openness have a major negative impact both in the short and long-term, which is like the pressure to specialize as incomes and openness increase. At W2, the impact of GDP per capita and the indirect effects of openness to trade become positive and significant, yet not significant enough to compensate for the overall negative effect. From the perspective of the population, there exists no significant immediate direct effect, but there is a pronounced negative long-term effect. Nonetheless, its cumulative impact is not so significant, and the spillover effects are not positive, implying that the lack of a skilled population may be an obstacle to the diversification of exports. Resource rents give short-term benefits with small gains and no long-term impacts. The weights of the model give it spatial feedback depending on the weights applied. As an illustration, in W1 the spatial lag is weakly negative, whilst in W2 it is highly negative, as would be expected when there are competitive or dispersive forces. Such diagnostic tests include the dynamic stationarity test, the non-existence of CD in the residuals, the non-existence of spatial autocorrelation, and the stationarity of the residuals, and all these tests indicate that these patterns are statistically sound. The results point to the significance of human capital development and the necessity to balance trade-off between trade openness, income growth and export diversification with great caution, especially in economies with structural and skill limitations. To enhance the study in future, more research on sectoral level data, institutional quality indicators and non-linear spatial structure might bring more insight into changing dynamics of export diversification in countries.
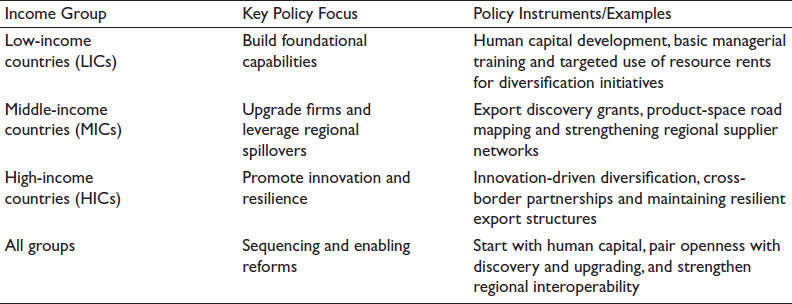
Policy Recommendation
Footnotes
Authors’ Contributions
IH: Conceptualization, Data collection, Writing – Original draft, Supervision, Revision, Proofreading, Analysis and Review. NK: Methodology, Analysis and Review. MR: Supervision, Data collection and Proofreading.
Consent for Publication
This original manuscript has not been submitted to or is not being considered for publication elsewhere.
Data Availability Statement
Data will be provided on request.
Declaration of Conflicting Interests
The authors declared no potential conflicts of interest with respect to the research, authorship and/or publication of this article.
Ethical Declaration
This study follows all ethical practices of the institution.
Funding
The authors received no financial support for the research, authorship and/or publication of this article.