
Abstract
In this study we examine the stock price reaction around earnings announcement for India. The data are used for 469 companies and the study period spans from December 2002 to December 2011 covering 37 quarterly periods. Significant pre-event abnormal returns are observed for 32 out of 37 quarters which may be an outcome of superior analysis coupled with information asymmetry. Significant post-event abnormal returns are observed for 35 out of 37 quarters implying strong rejection of semi strong efficiency with regards to earning announcements. There are strong continuation patterns in earnings suggesting that investors are able to anticipate the informational contents of earnings. Post-event abnormal returns are higher for financial vis-à-vis non-financial closing quarters. A large part of abnormal returns is observed over an elongated event window rather than very close to event date. Lower post-event abnormal returns are reported for periods of high aggregate earnings and vice versa. The findings shall be useful for market regulator, investment managers, companies as well as researchers. The study contributes to stock market efficiency and behavioural finance literature for an emerging market.
Keywords
Introduction
Large body of literature relating to informational content of earnings begins with Beaver (1968), who first examines the information content of earnings announcements in the US market. Beaver establishes that stock price volatility and trading volume increase significantly during the earnings announcement period. Both stock price volatility and trading volume measure the content of earnings announcements. The conventional wisdom has been that earnings announcements reduce information asymmetry by substituting a public announcement for private pre-announcement information. However, empirical evidence suggests that some earnings announcements generate newfound disagreement by generating additional private information gathering (Bamber et al., 1999; Kandel and Pearson, 1995). With increasing contents the average investors’ beliefs are likely to be revised, leading to higher volatility surrounding the earnings announcement period. In addition it likewise, the greater the content, the more likely investors interpret the content of earnings announcements differently, leading to an increase in trading activities surrounding the earnings announcement period. Several follow-up studies by Kiger (1972), Morse (1980, 1981), Bamber (1986, 1987) and Ziebart (1987, 1990) employ different samples and alternative methodologies and continue to confirm that earnings announcements are a vital source of information for equity investors. Beaver (1968) proposes that stock price changes reflect the average change in investors’ beliefs about an earnings announcement, whereas trading volume reflects individual investor’s interpretation of the announcement.
Prior literature examines the informational content of earnings by analyzing the relationship between: (1) earnings announcement (actual earnings) and stock behaviour and (2) earning surprise 1 and stock behaviour. Several dimensions have been researched, such as, the impact on stock volatility and liquidity (see Beaver, 1968; Landsman and Maydew, 2002; Truong, 2010, 2011); impact on stock returns (see Campbell, 1991; Cready and Gurun, 2008; Kothari et al., 2006); and pattern of earnings announcement, that is, early announcements have more surprise than the late announcements (see Chen et al., 2005). Others have evaluated the impact of large/small earnings announcement and/or positive/negative earnings surprises on stock characteristics and how these relationships differ for companies with different attributes, such as, firm size (see Chan et al., 2005), price to book ratio, trading liquidity, earnings volatility etc. (see Ahmed et al., 2009).
Rich body of literature on this subject is available for mature markets 2 and some emerging markets. 3 However, similar evidence for India, which is a fast growing emerging market, is limited. Present research attempts to fill this important gap in market efficiency literature for India.
In this study we specifically examine the stock return behaviour before and after the earnings announcement using a large cross sectional sample of 469 companies and a data period spans from December 2002 to December 2011 involving 37 quarterly announcement periods. The
The article is organized into six sections, including the present one. In the section ‘Review of Literature’ we provide a brief review of relevant literature to the research issue. Data and their sources are described in the section ‘Data’, while the section ‘Methodology’ contains methodology and estimation procedures. Empirical results are discussed in the section ‘Empirical Results’. The last section ‘Summary and Concluding Remarks’ provides summary, policy observation and concluding remarks.
Review of Literature
In this section we focus on past literature that deals with stock return behaviour in and around earnings announcement dates.
Forecasting the earnings of companies and testing the accuracy of forecast by matching the same with actual announcements of earnings have always been attraction as well as a challenge for analysts. The post-earnings announcement drift (PEAD), also referred to as the standardized unexpected earnings (SUE) effect, is one of the best-documented and most-resilient capital markets anomalies. The attempts to study the earnings surprise may be traced back to 1968 when Beaver examined the information content of earnings announcements in the US market. Beaver (1968) establishes that stock price volatility and trading volume increase significantly during the earnings announcement period. Both stock price volatility and trading volume reflect the impact of earnings announcements. The SUE effect was first discovered by Ball and Brown (1968) using a sample of Australian securities data extending back to the 1950s. Over the following decade, several papers using different samples and methods confirmed the drift (see Jones and Litzenberger, 1970; Joy et al., 1977; Latane et al., 1970; Latane and Jones, 1979). As these studies appeared, increased interest and scepticism led to large-scale studies by Rendelman et al. (1982), Foster et al. (1984) and Bernard and Thomas (1989). Brennan (1991, p. 70) calls it a ‘most severe challenge to financial theorists’, and Fama (1998, p. 286) refers to it as ‘the granddaddy of all under reaction events’. Even very recent research (e.g., Francis et al., 2004; Liang, 2003; Livnat, (2003a, b; Mendenhall, 2004; Narayanamoorthy, 2003) continues to document the apparent slow reaction to the information contained in earnings announcements. Bernard and Thomas (1990, p. 34) subject the drift to a diverse battery of robustness tests, such as, controlling for common risk factors used in tests of the Arbitrage-Pricing Theory (APT) and conclude that much of their ‘evidence cannot plausibly be reconciled with arguments built on risk mismeasurement but is consistent with a delayed price response’. The conclusion of Bernard and Thomas’s (1990) about the drift as a delayed response to the information in earnings announcements is the pre-dominant belief among researchers, it seems that too little thought has been given to how we actually measure the earnings surprise on which the drift is based. All drift studies share a basic form for estimating the earnings surprise: actual earnings minus a forecast of earnings divided by a deflator. Although the choice of forecast would seem to be a critical decision, the majority of studies use a single method, almost always a time-series model, to predict earnings. Even many recent studies—including Bartov et al. (2000), Collins and Hribar (2000) and Narayanamoorthy (2003)—use some form of time-series model to predict earnings. Only relatively recently have studies appeared that use analysts’ forecasts. These include Affleck-Graves and Mendenhall (1992) and Abarbanell and Bernard (1992). Past explanations have included methodological shortcomings (e.g., Jacob et al., 2000), risk mismeasurement (e.g., Ball et al., 1993) and slow reaction to the information content of earnings (e.g., Ball and Bartov, 1996; Bernard and Thomas, 1990; Livnat, 2003a, b; Livnat and Mendenhall, 2006; Mendenhall, 2004). None of these studies, however, compares the magnitude of the drift across expectation models while holding the sample constant.
Prior literature has mainly focused on mature markets while similar literature for emerging economies is limited. The present study attempts to fill this important research gap by addressing the issue for Indian equity market.
Data
The data comprise of dates of board meetings from December 2002 to December 2011. The board meetings date for each quarter is collected for all BSE 500 Companies for which information was available. We eventually work on 469 companies as negligible data were available for remaining firms. Quarterly earnings (in rupees) information for the sample companies was also obtained for the study period. We use daily share price data for the sample companies from December 2002 to December 2011. These share prices are adjusted for capitalization changes such as stock dividend, stock splits and right issues. Data source is Capitaline software. It may be noted that BSE 500 index companies account for more than 90 per cent of the market capitalization as well as trading volume for securities traded in India. Hence, the sample companies are fairly representative of market performance. The stock prices are converted into percentage returns for further estimation. BSE 500 is used as market proxy. It is broad based and value weighted (free float weighted) index of top 500 Indian companies and is constructed on line of Standard & Poor 500, USA.
Methodology
We adopt event study methodology for our analysis. The date of board meeting at end of each quarter is used as event date, hence for referred to as day 0. A total of 120 days prior and 20 days later to the event day are used to define 141 days event window. The initial estimation window stretches from −120 to −21 days on pre-event basis. Days −20 to −1 are termed as pre-event period, while day 0 to 20 are termed as post-event period. For the estimation period we regress stock returns on market returns using the familiar market model shown later:
The OLS procedure may provide us inefficient parameters in the presence of auto correlation. We check for serial dependence using Durbin–Watson test. If there is significant auto correlation we re-estimate equation1using GLS procedure. The parameters estimated in equation 1 are then used to calculate expected stock returns for the first day in the pre-event period (i.e., −20th day) using market return observation for that day. Rolling regression procedure is adopted whereby equation 1 is continuously re-estimated escaping one day at a time. Such a process shall provide dynamic estimates of alpha and beta and hence shall be useful in obtaining more precise values of expected stock returns. The expected stock returns are subtracted from realized returns each day to obtain daily abnormal return labelled as AR. For each event day we average the abnormal returns observe for each company to estimate average abnormal return termed as AAR. We cumulate the average abnormal returns for pre-event period (day −20 to −1) and label it as CAARi. Similarly cumulation of post-event (day 0 to +20) average abnormal returns generates CAARj. We standardize CAAR values by using standard deviation of portfolio of companies under the assumption that security returns are cross correlated owing to overlapping event windows. 4 This standardized CAAR is referred to as standardized CAAR (SCAAR). The SCAAR values tend to follow t distribution and hence are tested for statistical significance by comparing them with table value of t statistic (two tailed basis) at 5 per cent level of significance for appropriate degrees of freedom.
The CAARi and CAARj values have been estimated for each sample company for each earning announcement quarter from December 2002 to December 2011, that is, 37 quarters. To test if there is any continuation pattern in abnormal returns, we regress CAARjs on CAARis pooling data for all quarters in the form
where CAARj and CAARi are the post- and pre-event cumulative abnormal returns.
A significantly positive value for γ1 shall confirm continuation pattern, a significantly negative γ1 implies reversal pattern while an insignificant γ1 shall indicate an absence of relationship between post- and pre-event returns. Next we verify if CAARj–CAARi relationship has been impacted by global economic crisis witnessed in last few years of our study. We re-run the earlier said regression after adding an economic crisis dummy
Where D = 1 for all abnormal return combinations (i.e., CARj–CARi) observe September 2008 onward and D = 0 for abnormal return combination observe prior to September 2008.
A significant value of γ2 shall confirm that a relationship between post- and pre-event abnormal return has altered owing to change in investor behaviour in the economic crisis period. We also examine if CARi and CARj patterns have changed for pre- and post-economic crisis period by regressing these variables on economic crisis dummy as shown by equations 4 and 5.
Where D is dummy variable as already been defined.
Significant value of δ1 and λ1 shall confirm change in the patterns of pre- and post-event CARs owing to economic crisis.
Next, we examine if the post-event return patterns differ for financial and non-financial closing quarters. Prior literature suggests stronger price reaction after financial closing quarters owing to greater analyst coverage and availability of consolidated annual information (see Truong, 2011). We evaluate this hypothesis by checking if the mean CAAR values significantly differ for financial and non-financial closing quarters in the form
Where F represents Financial Closing and NF represents non-financial closing quarters.
Next we estimate CAAR values for short-term event windows to check if a large part of price reaction occurs very close to the event date. Three short-term event windows are used, namely, −1 to +1 (three days); −2 to +2 (five days) and −4 to 0 (five days). We estimate the contribution ratio CAARs/CAART, where CAARs is cumulative average abnormal returns for short-term event window and CAART is cumulative average abnormal returns for total event period (41 days). We estimate the aforementioned ratio for the total study period as well as separately for pre- and post-economic crisis periods.
Finally, we verify the relationship between aggregate corporate earnings and post-event CAAR patterns. We hypothesize that periods of low corporate earnings (bad news) shall report higher post-event CAARs, while period of high aggregate earnings (good news) shall result in low post-event CAARs. In other words, price reaction to bad news are expected to be more pronounced than to good news. To test this, we aggregate the earnings declared in each quarter for sample companies. We then regress the post-event CAAR on aggregate earnings using information for each quarter,
Where CAARjt is post-event cumulative average abnormal return for quarter t and AEt is aggregate earnings in quarter t.
A significantly negative value of θ1 shall confirm our hypothesis.
Empirical Results
The results of pre- and post-earnings announcement CAAR are shown in Table 1. Significant abnormal returns are observed for 32 out of 37 quarters in the pre-event period, 18 of which are positive while 14 are negative. Pre-event results imply that either investors are able to anticipate the informational content of earnings by observing other relevant financial variables or there is an information leakage in the market system leading to information asymmetries. Hence in the Indian context, the market regulator needs to monitor price reactions around earning announcements. Better surveillance shall help them in controlling possible price manipulation.
The Results of Pre- and Post-earnings Announcement Cumulative Average Abnormal Returns (CAARs)
In Table 1 we provide pre- and post-CAAR’s estimated for the sample companies for each earnings announcement quarters over the study period. CAARi and CAARj represent pre- and post-events figures while SCAARi and SCAARj are their standardized values. The CAARs are tested for statistical significance using t-test (two tailed basis) at 5 per cent level of significance.
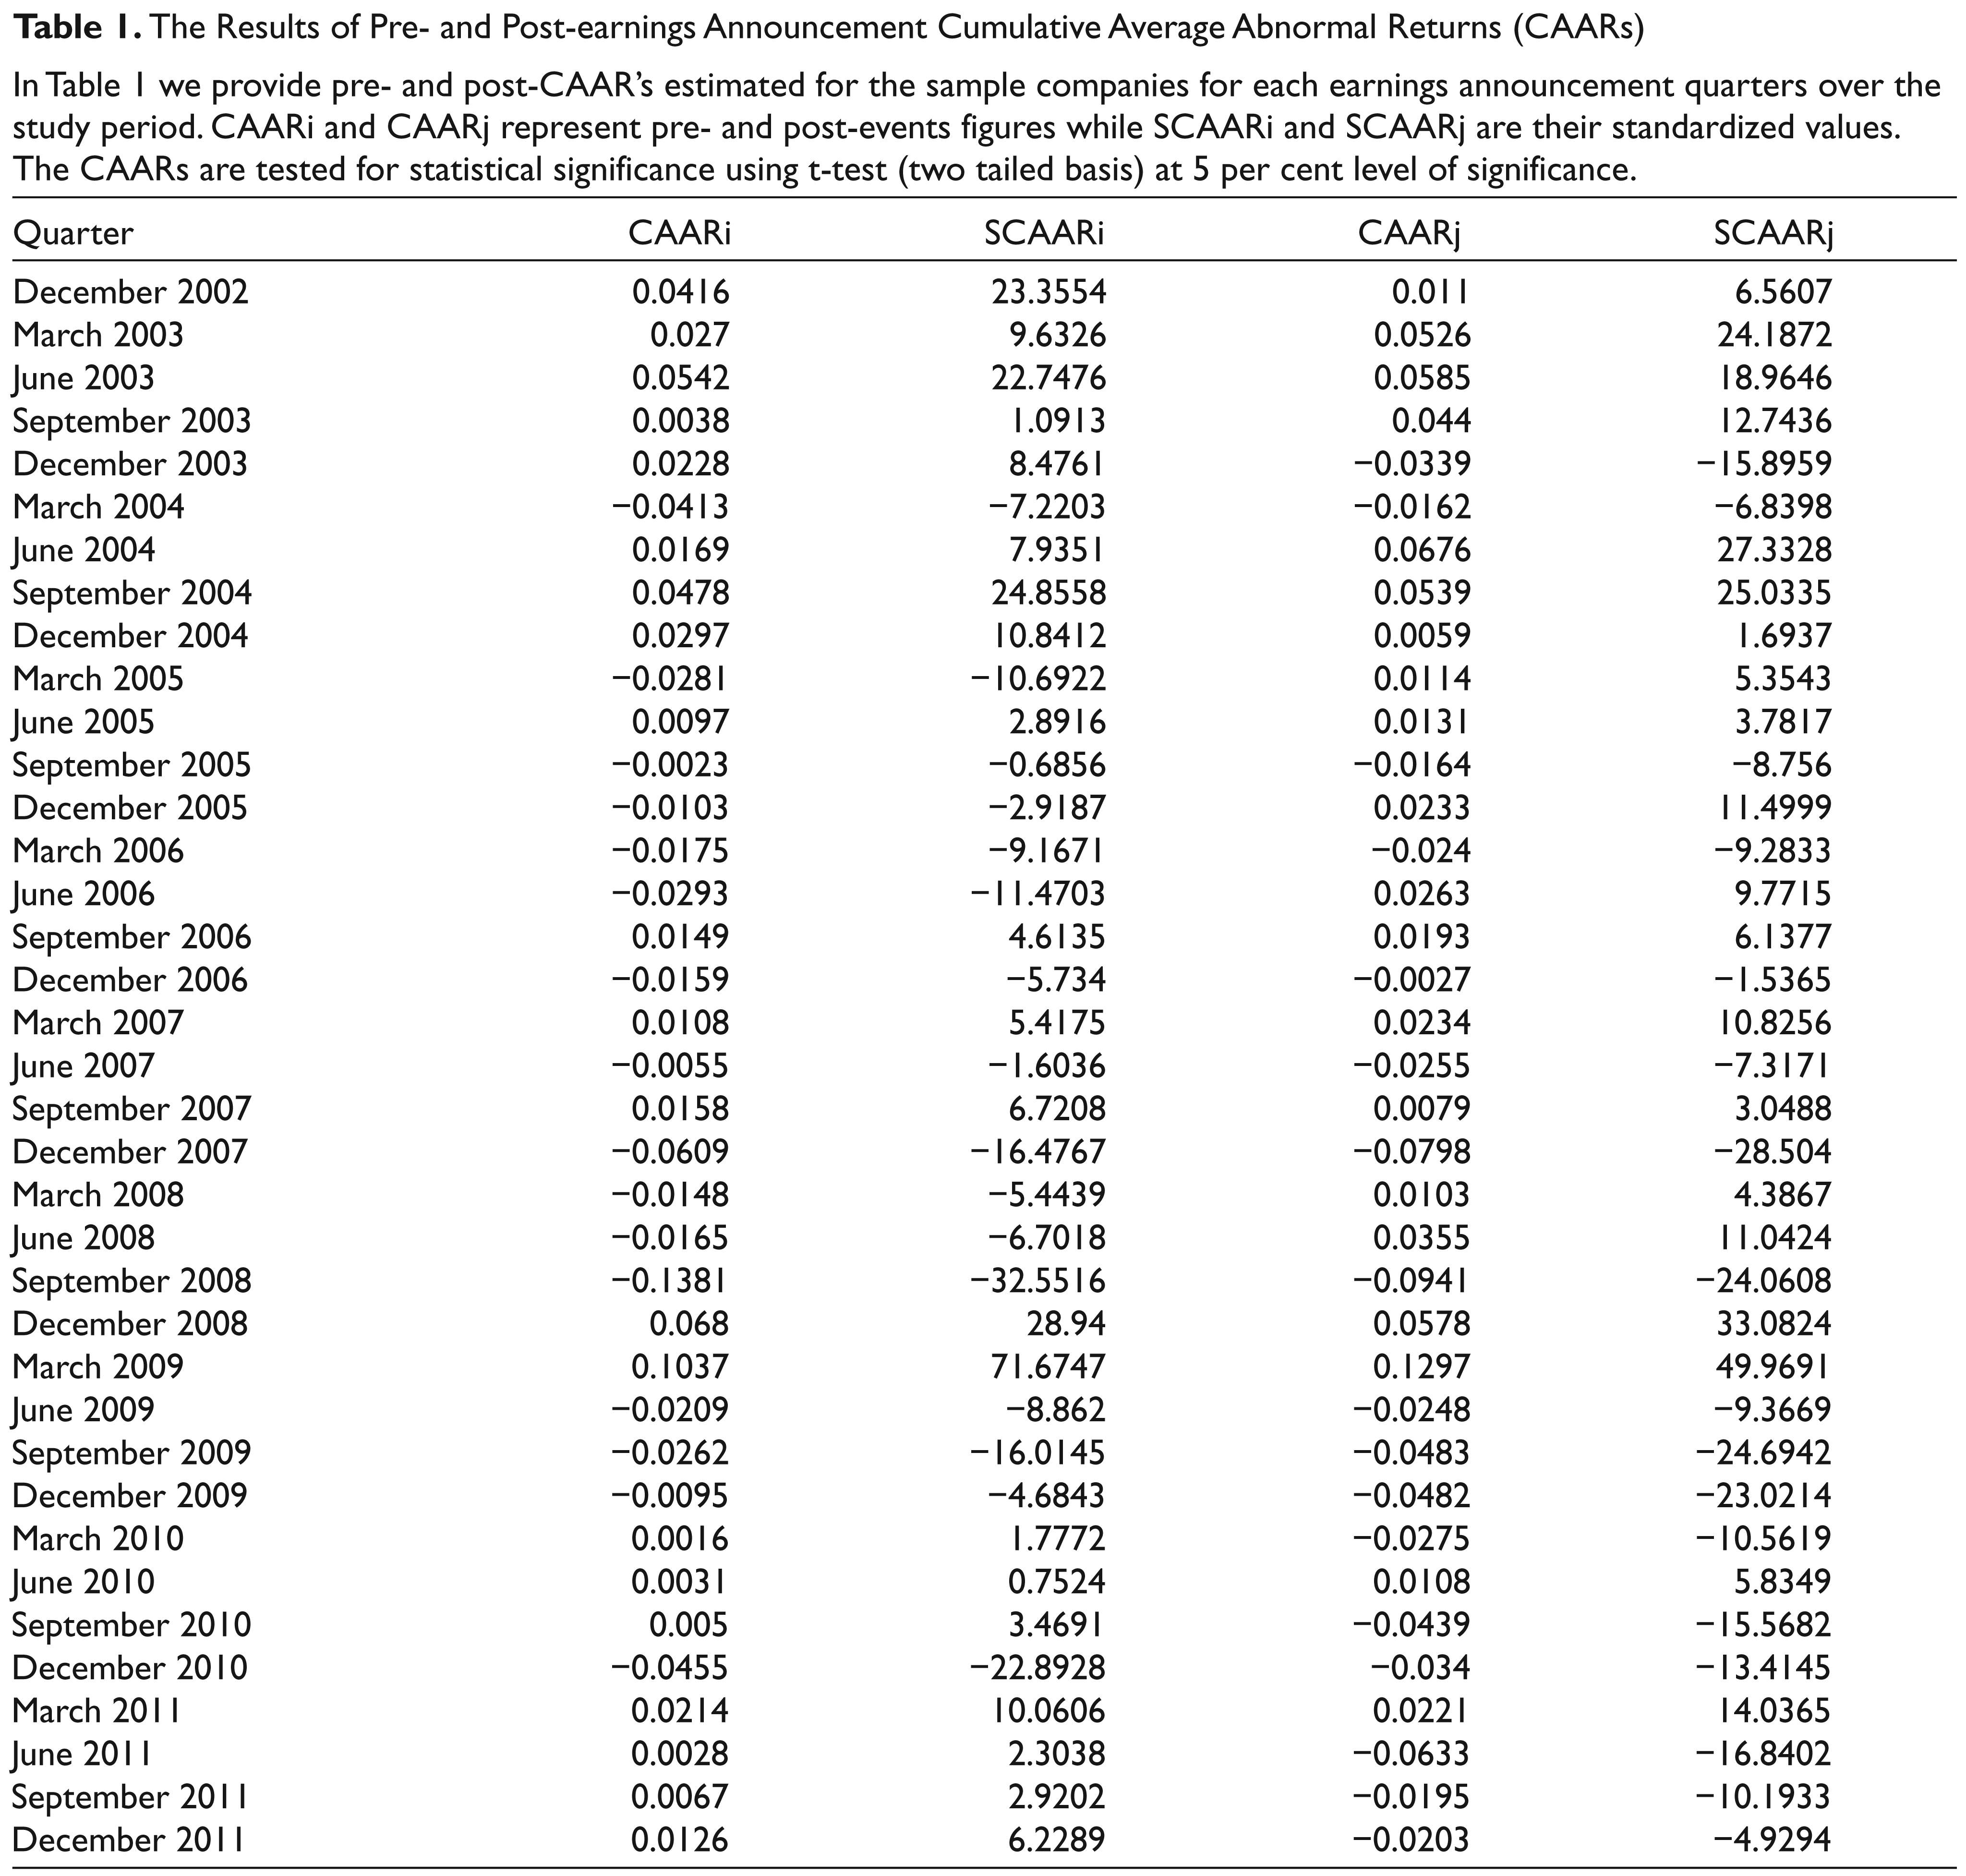
On post-earnings announcement basis, significant CAARs are reported for 35 out of 37 quarters, 19 of which are positive while the remaining 16 are negative. Thus, the Indian stock market is not semi strong form efficient with respect to earnings information. In other words, investment managers can take trading positions (buy/short sale) after earnings announcements and generate abnormal profits. The rejection of market efficiency in such a strong fashion is a little surprising given the fact that earnings announcement is a predictable event (as it occurs in each quarter) vis-à-vis other corporate events such as stock dividends, stock splits, merger announcement etc. which have a surprise element as they have a non-regular and less frequent occurrence in a firm’s life.
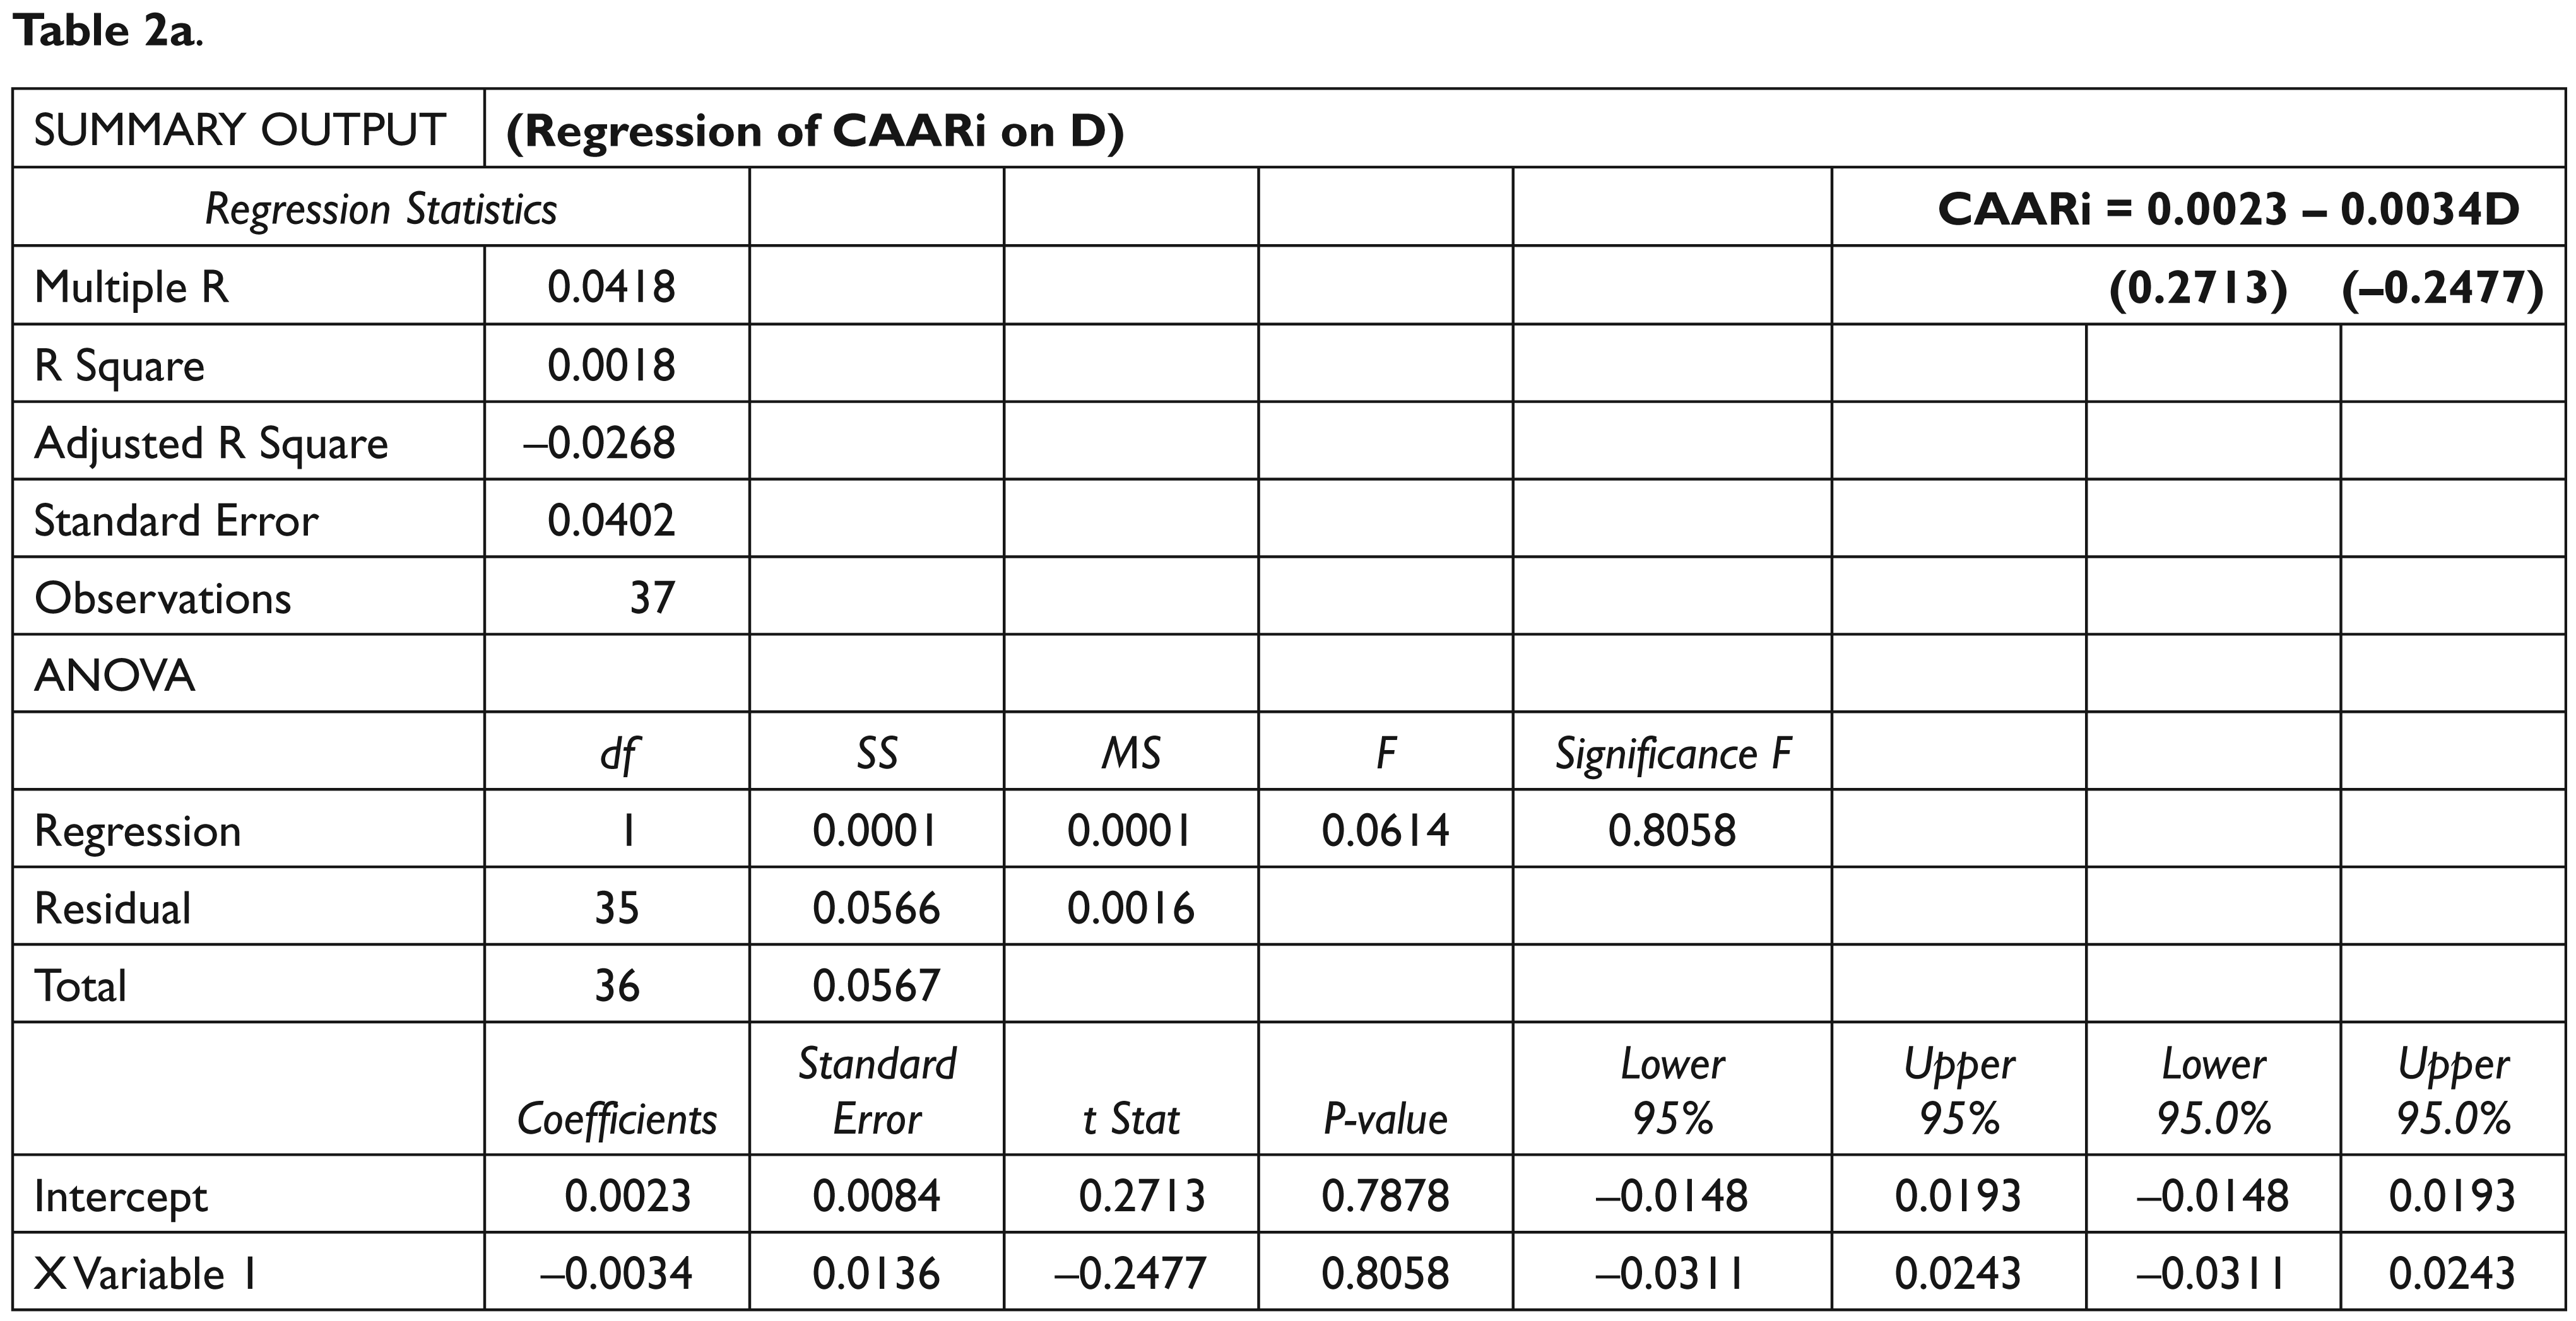
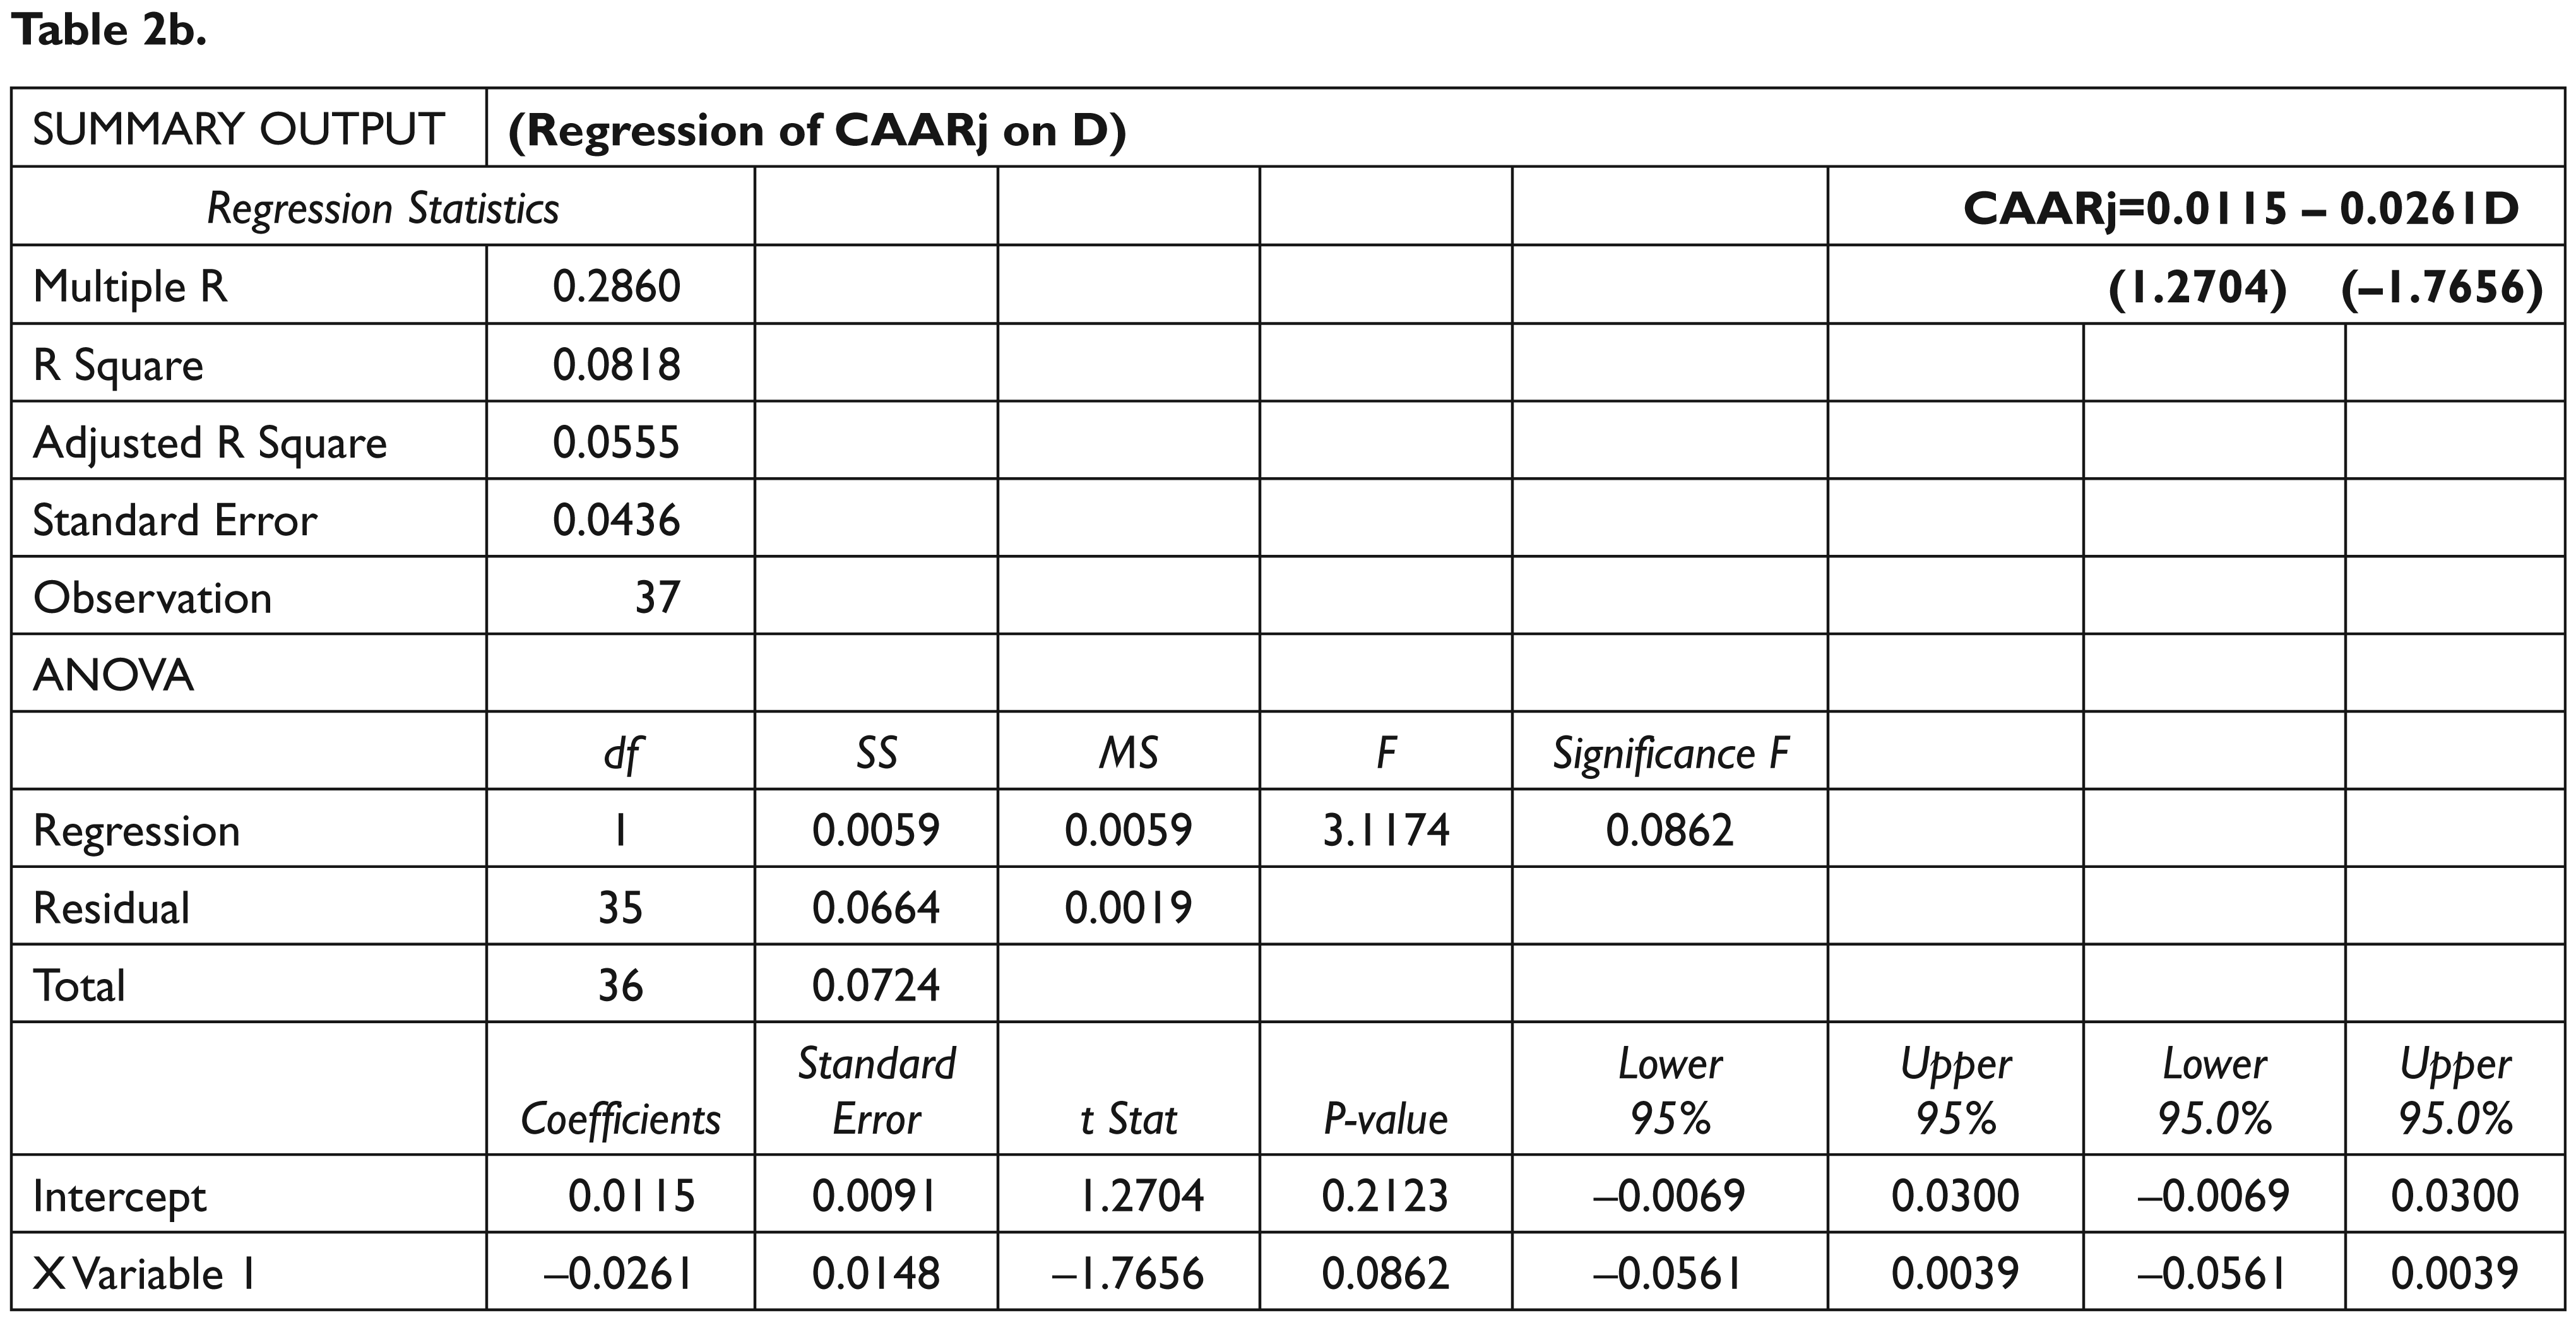
We regress CAARi as well as CAARj on economic crisis dummy the results of which are shown in Table 2a and b. It is confirmed that pre-event CAARs do not differ significantly for pre- and post-economic crisis periods. Similar patterns are also observed for post-event CAARs. The later suggests that the lack of market efficiency with regards to earnings announcements has not been impacted significantly by global economic crisis.
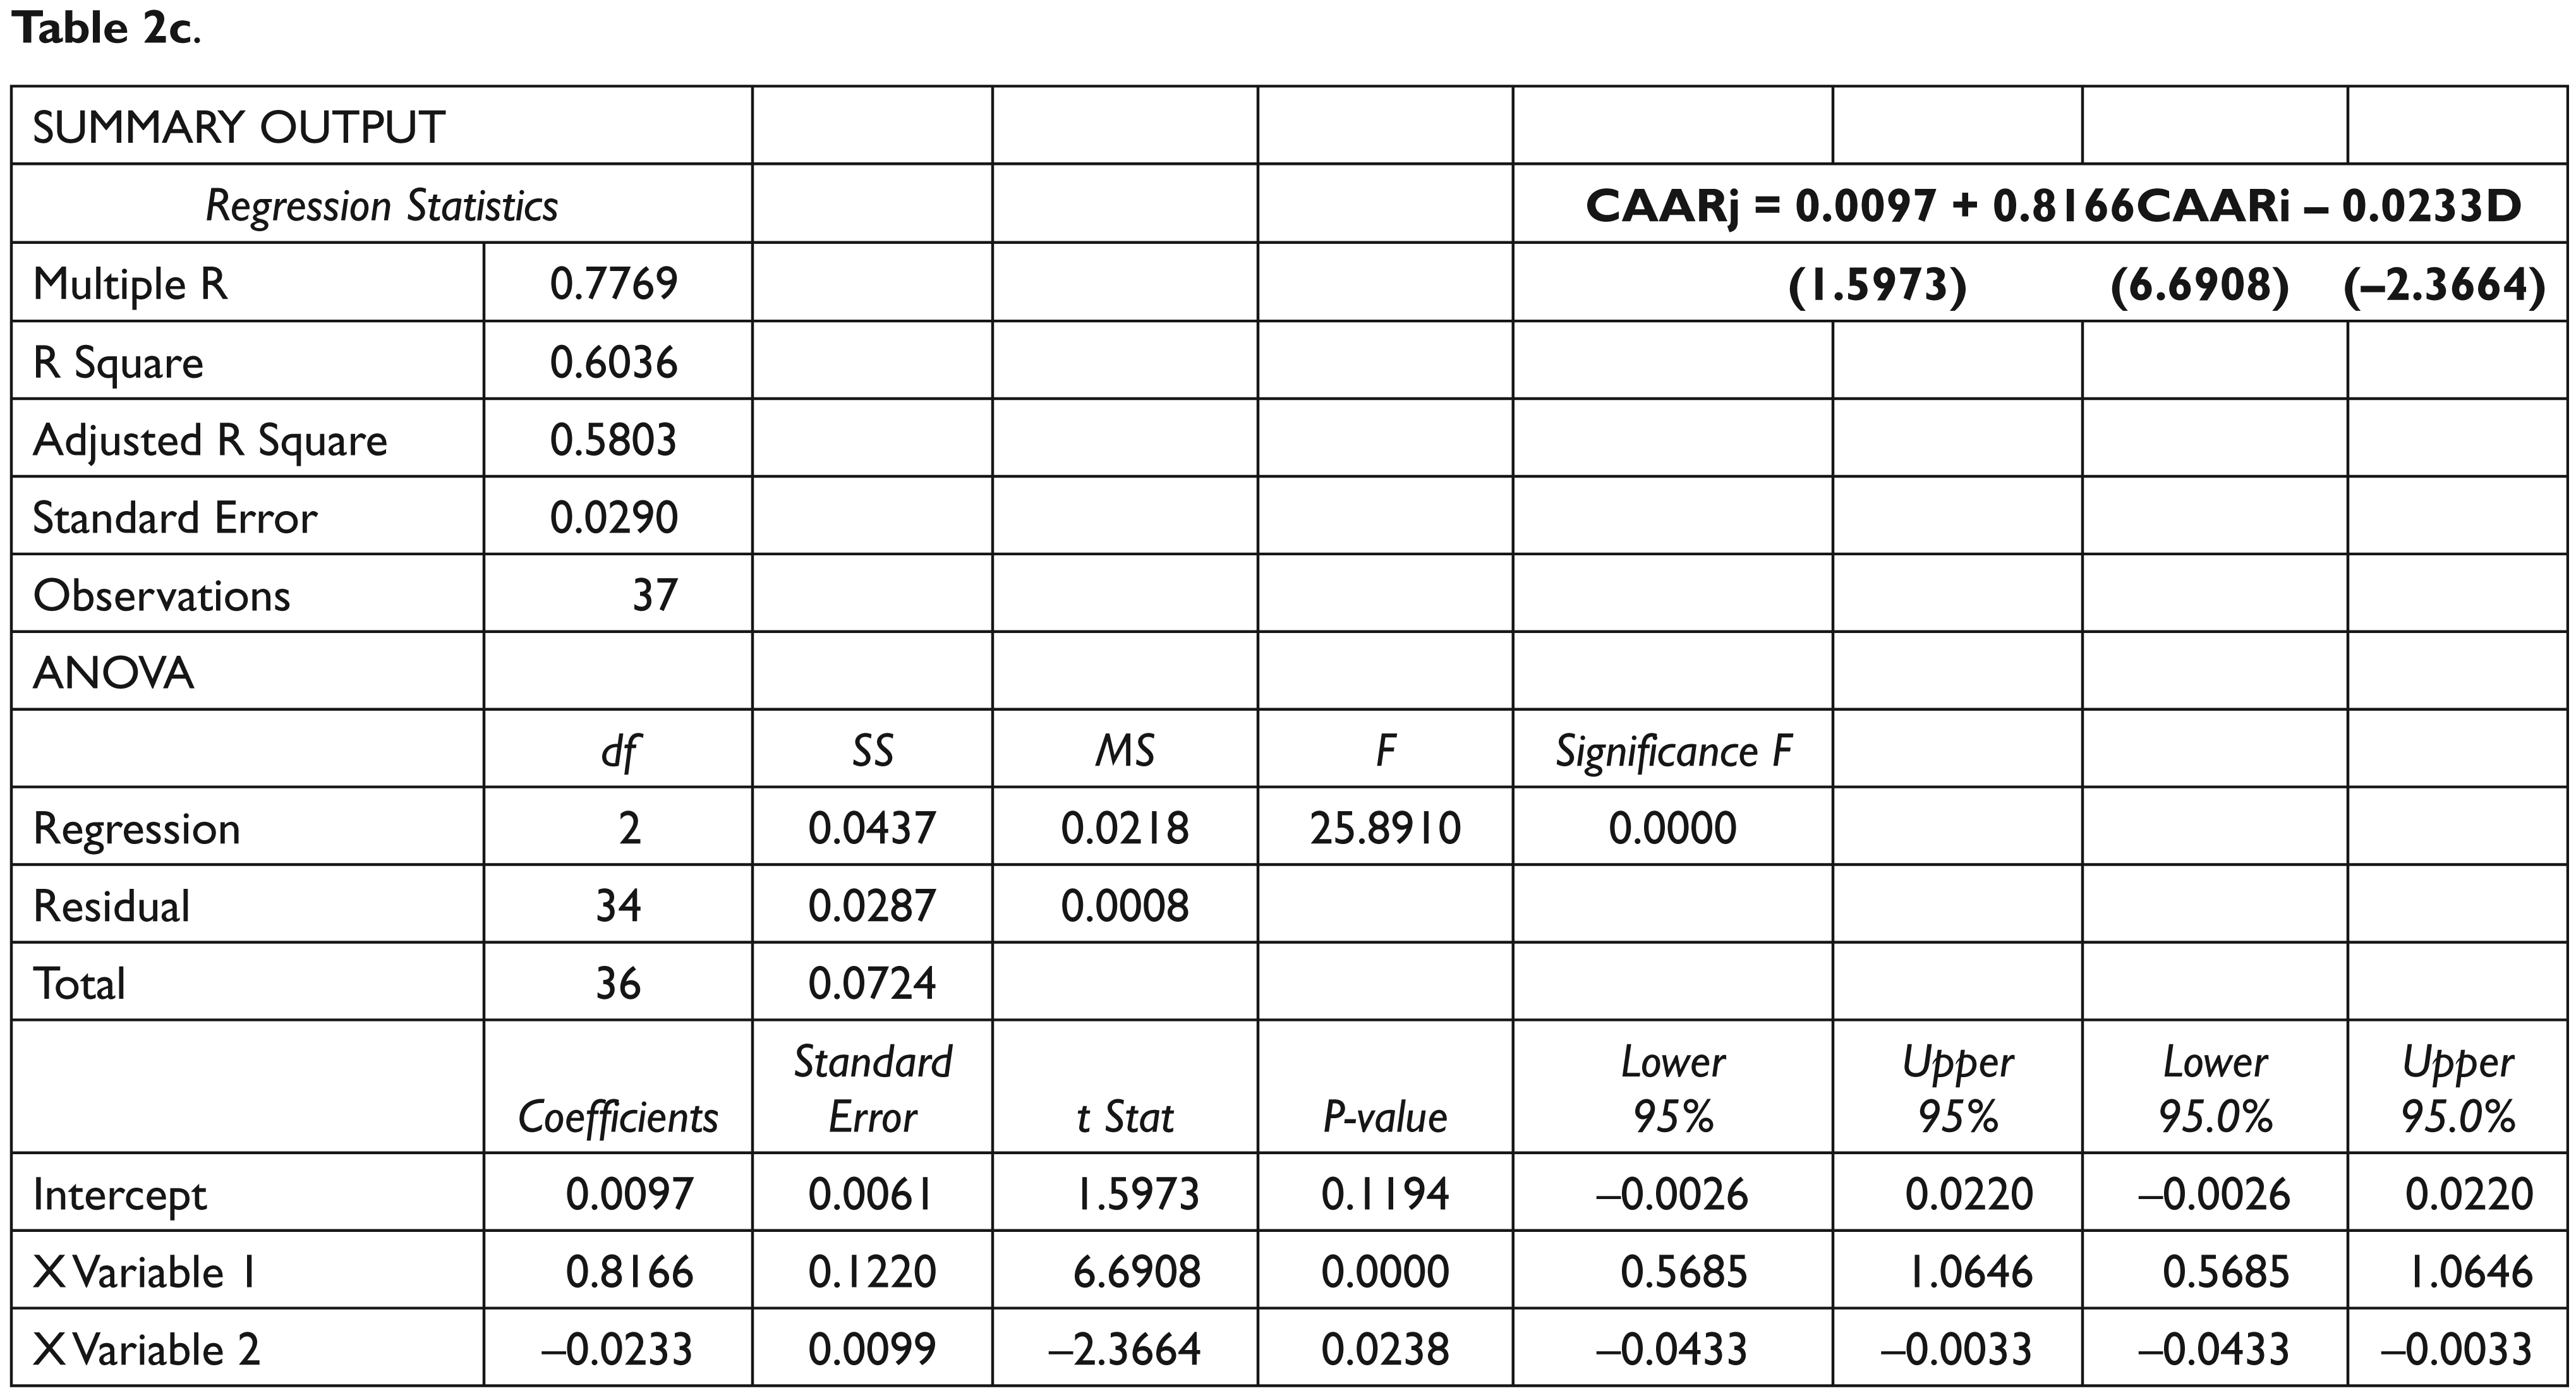
It is further interesting to note that the CAARs exhibit a continuation pattern for 26 out of 37 quarters. This implies that investors are able to anticipate the informational content of earnings prior to its public announcement and hence in general, there is little surprise element. We reconfirm our results by regressing post-event abnormal returns (CAARjs) on pre-event abnormal returns (CAARis) as shown in Table 2c. The slope of regression is 0.817 (t statistics = 6.69) with a corrected R square of 0.58. Thus the sign of abnormal returns matches for pre- and post-event period for about 2/3rd of sample quarters. There are 15 positive and 11 negative return continuations. Further the continuation pattern in post- and pre-event CAAR returns has weakened since September 2008 as confirmed by statistically significantly negative slope for economic crisis dummy in the aforementioned regression. The results suggest that abnormal return patterns have become less predictable in the economic crisis period compared to the normal period.
We analyze how CAARi and CAARj patterns differ for pre- and post-global economic crisis periods, the results of which are shown in panel A. The study period is divided into two parts December 2002 to June 2008 as quarters to normal period and September 2008 to December 2011 as quarters for crisis period. In panel B we show the relationship between CAARj and CAARi and how it is impacted by global economic crisis.
The impact of global economic crisis is incorporated in our regressions by introducing a crisis dummy D which takes a value 1 for the crisis period quarters and value 0 for normal period quarters. All regression slopes are tested for statistical significance of 5 per cent level.
Regression of CAARi on D and CAARj on D.
Following Truong (2011), we expect post-event CAAR to be higher for financial closing quarters compared to non-financial closing quarters as investors should react more strongly to year-end earnings information. In the Indian context, financial closing quarters are at the end of March as financial year in India is defined as April of year t − 1 to March of year t. The mean post-event CAAR values for financial and non-financial closing quarters are 0.0202 and −0.0042 respectively. The t-statistic of mean differentials is 1.40 (owing to large combined standard error) which is statistically significant only at 20 per cent level. We thus observe a difference between post-event CAARs for financial and non-financial closing quarters but relationship holds only for a lower level of significance. The price reactions after financial closing quarters are stronger than other quarters which are in conformity with prior literature.
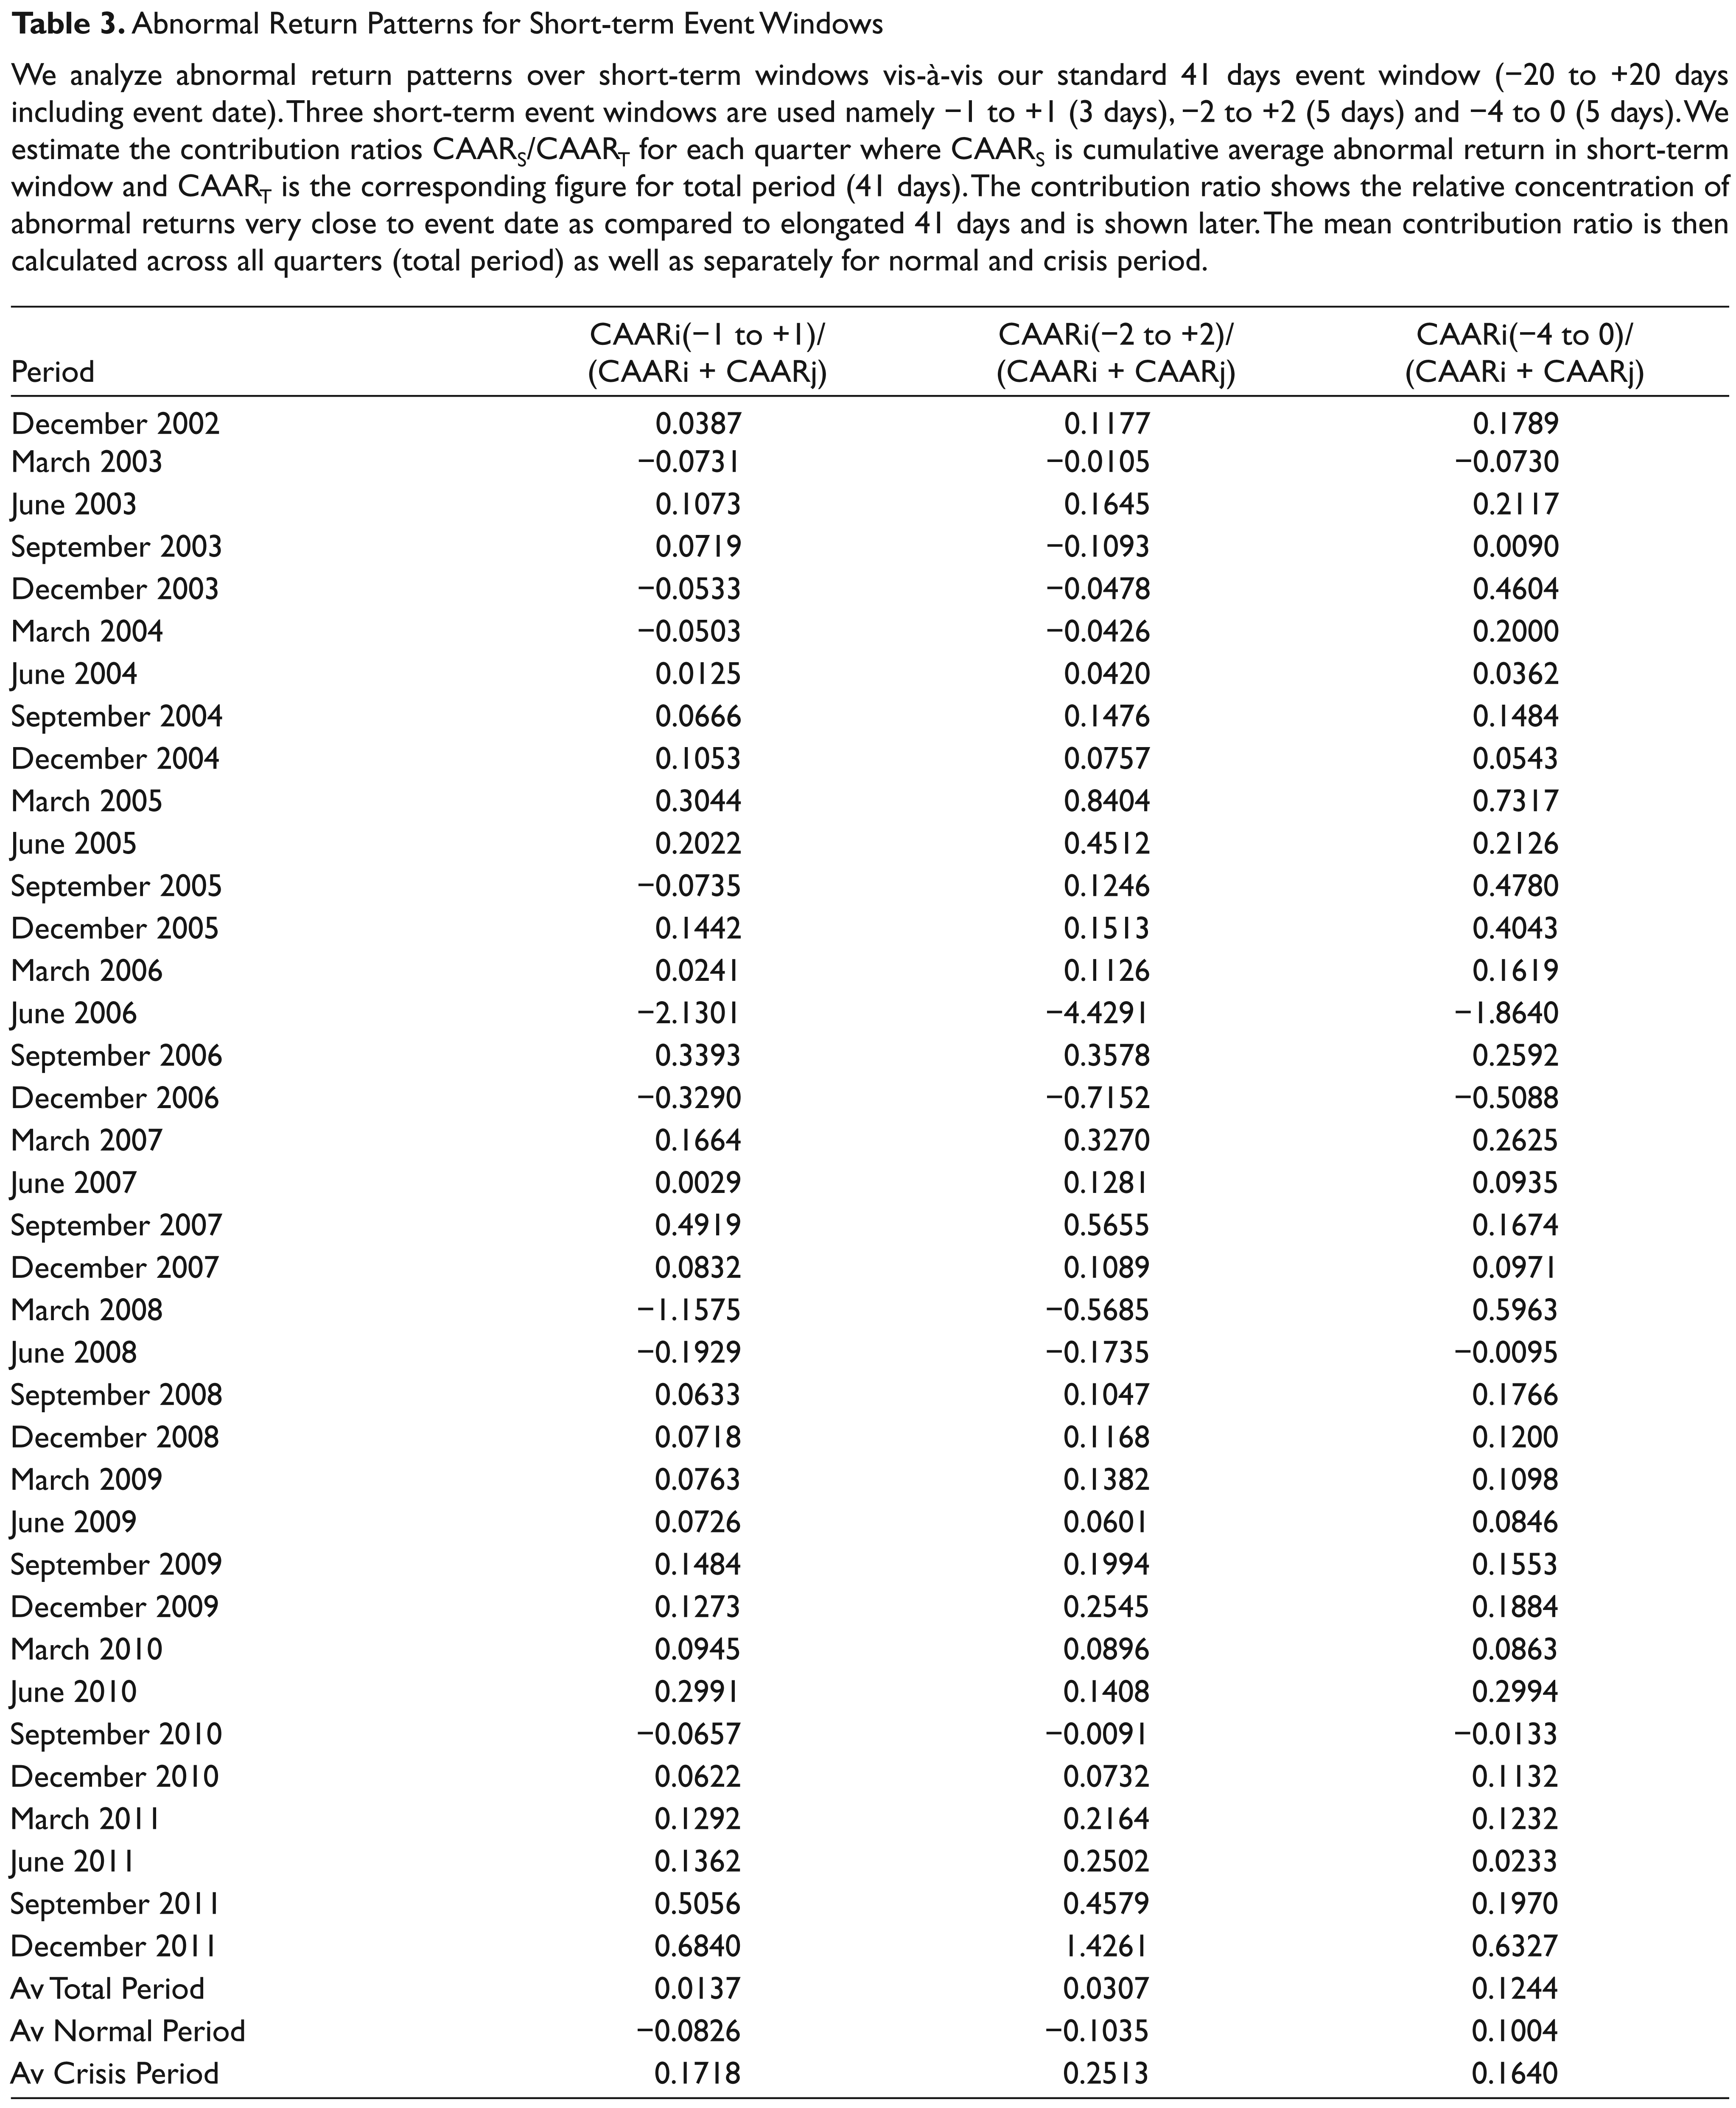
Finally, we estimate cumulative average abnormal returns over short-term event windows to ascertain if greater part of price reaction occurs in and around event date. Three event windows are used namely: −1 to +1; −2 to +2; and −4 to 0, the results for which are shown in Table 3. First event window is of three days involving 1 day prior, the event date and 1 day later to the event date. The second event window is 5 days involving 2 prior and 2 later days plus the event day. Next we employ another five days window involving 4 prior days and event date. The objective of last window is to gauge if the investors are able to pre-empt information a few days prior to event leading to a stock price reaction accordingly. We estimate the contribution ratio CAARS/CAART for all the short-term event windows for each quarter over the study period where CAARS is the cumulative average abnormal return over the short-term window and CAART is the cumulative average abnormal return for our total event window of 41 days, that is, CAARi + CAARj. We estimate mean of contribution ratio for the total period as well as for the pre- and post-economic crisis periods separately as shown in Table 3. It can be clearly seen that very small part of abnormal returns is realized in and around event date. Thus our analysis of elongated event window of −20 to +20 days to capture abnormal return is well justified. The abnormal returns observe in the short-term window are substantially higher in the post-economic crisis period compared to the normal period. A total of 25 per cent of abnormal returns are generated in 5 out of 41 days (see event window −2 to +2 days) after September 2008. Increased uncertainty owing to weaker global economic outlook may have impelled investors to respond immediately in and around event date leading to stronger price reactions.
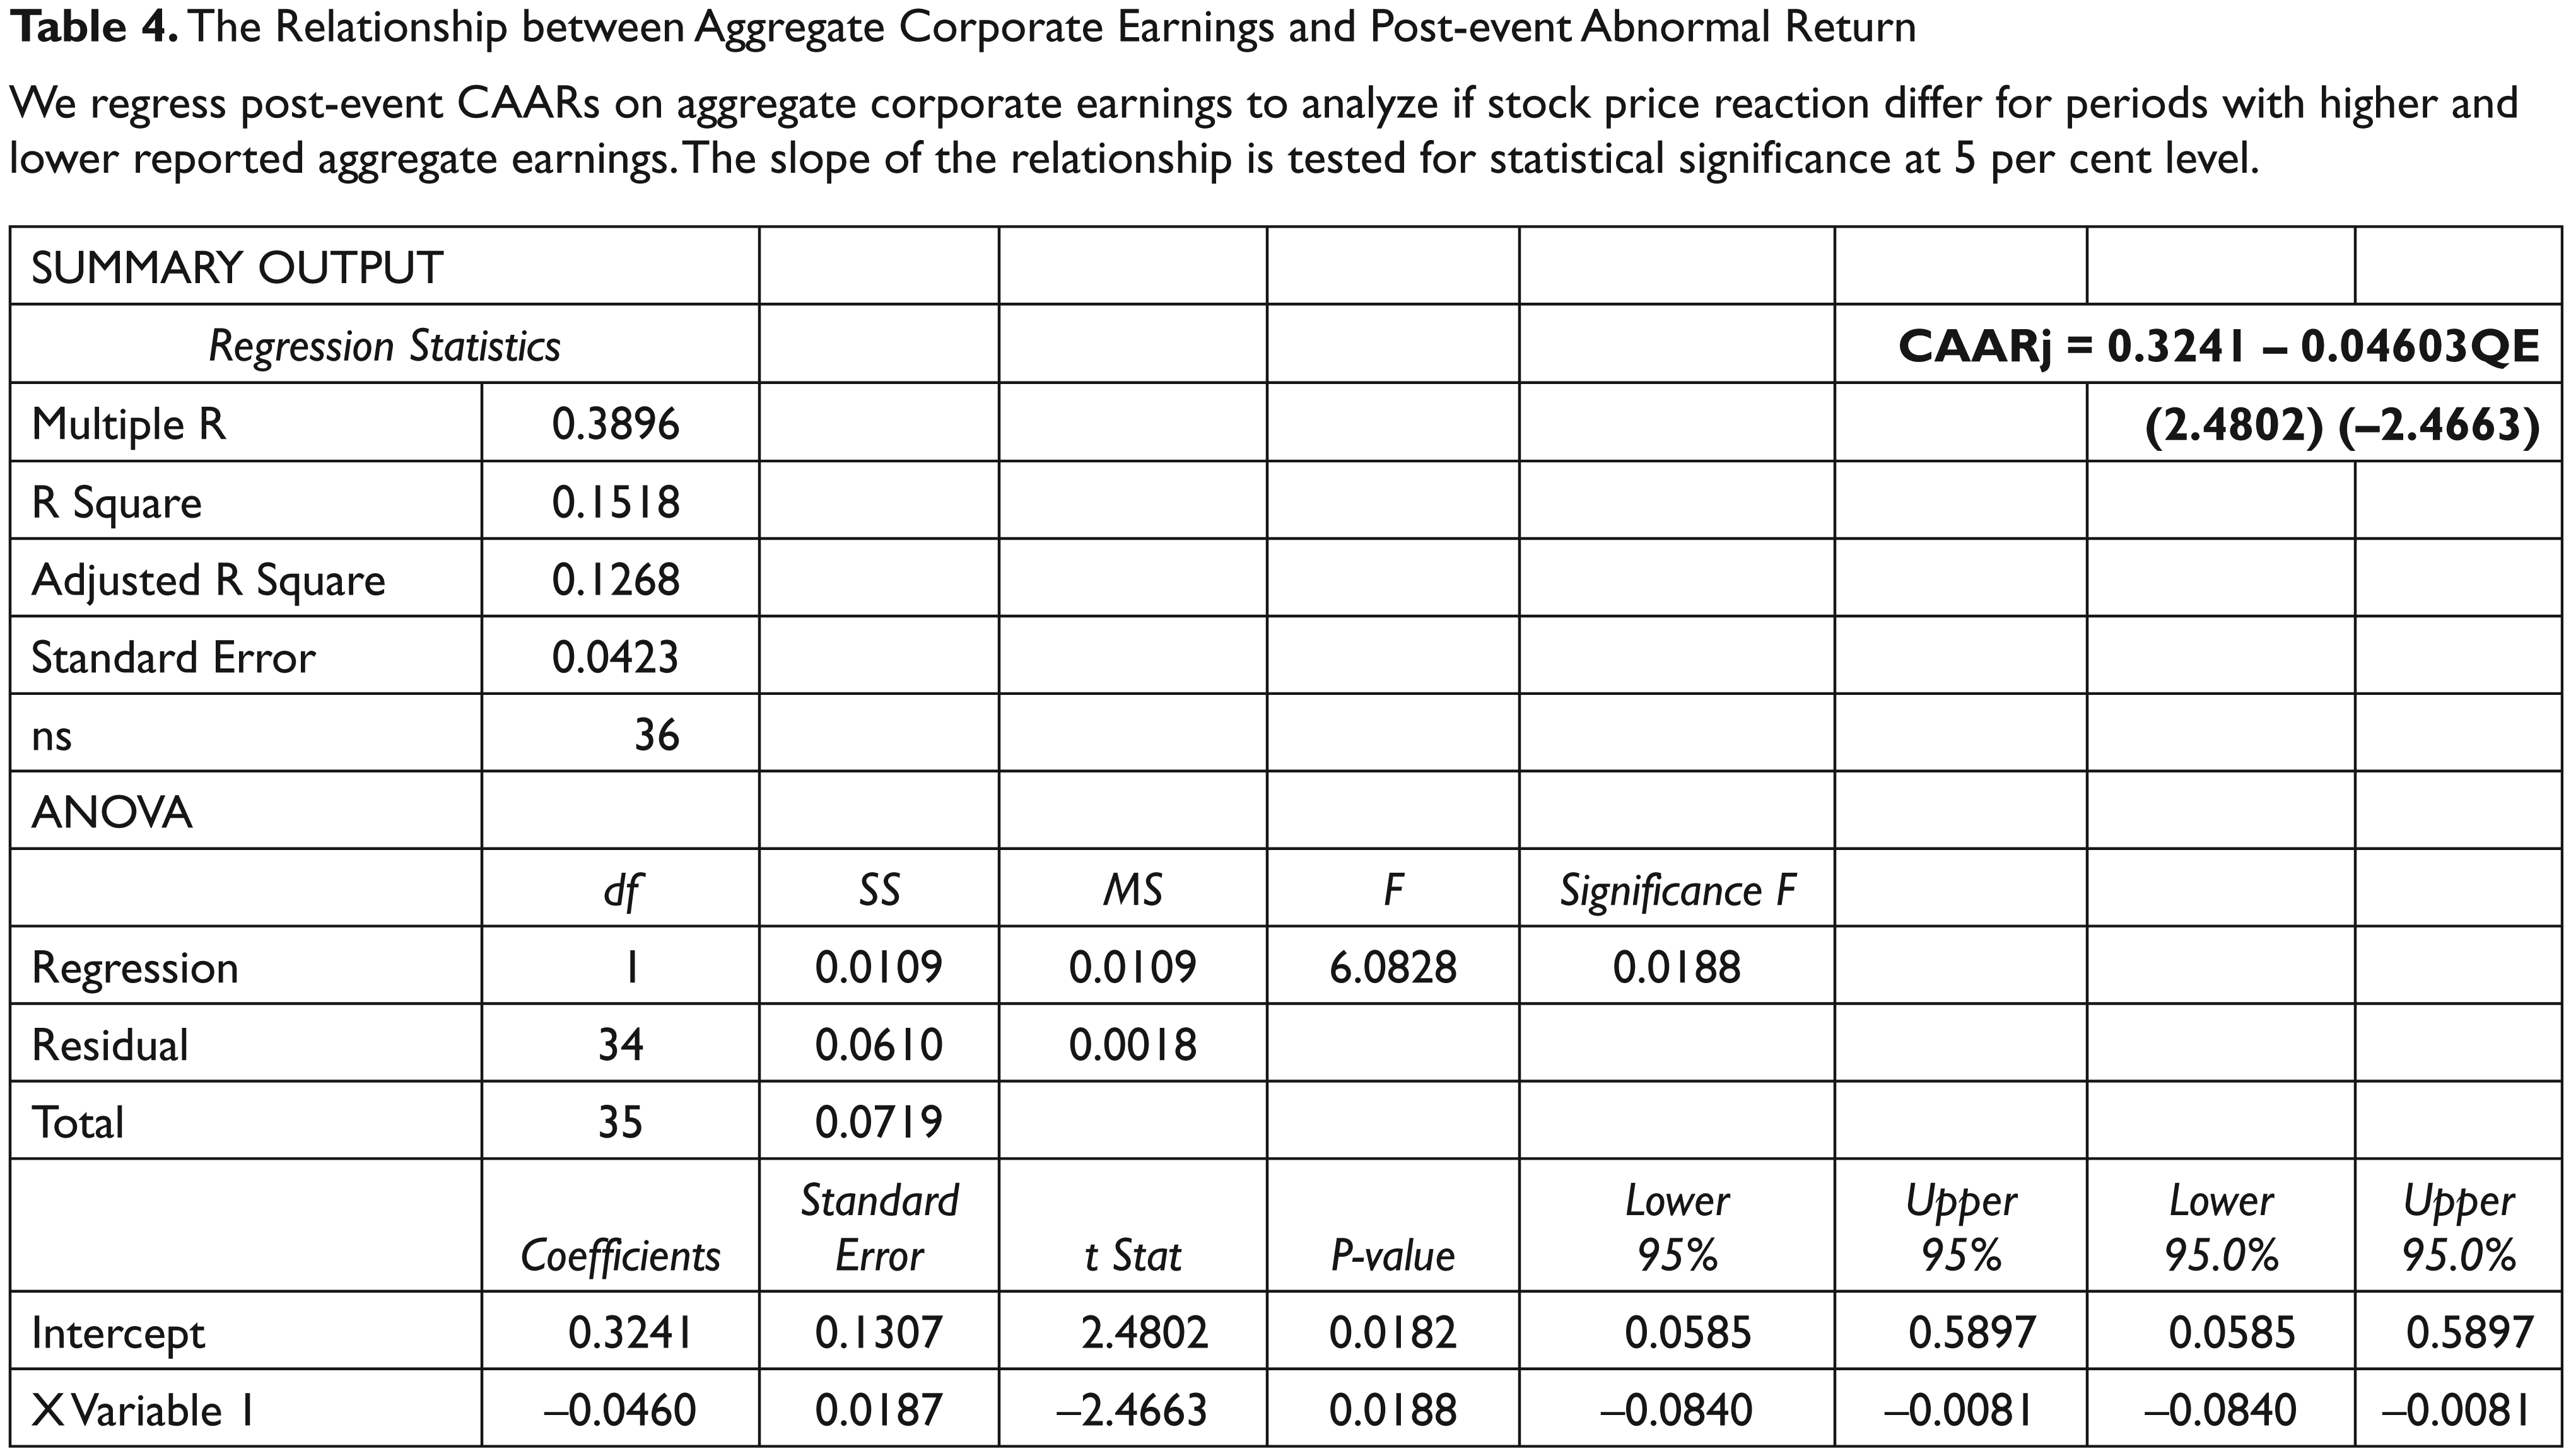
Livnat and Mendenhall (2006) evaluate the relationship between aggregate quarterly earnings and cumulative average abnormal returns. In this study, we confirm that for periods (quarters) with high aggregate earnings lower CAAR is reported on post-earnings announcement basis and vice versa. The slope of the regression of post-event CAAR on aggregate economic earnings (for each quarter) is significantly negative with a t-statistic of −2.46 as shown in Table 4. High aggregate earnings imply good news while low aggregate earnings are bad from investors’ perspective. Our findings indicate that perhaps investors react more strongly to bad news than good news thus exhibiting asymmetric price reaction on post-event basis. These results confirm our testable hypothesis.
Abnormal Return Patterns for Short-term Event Windows
We analyze abnormal return patterns over short-term windows vis-à-vis our standard 41 days event window (−20 to +20 days including event date). Three short-term event windows are used namely −1 to +1 (3 days), −2 to +2 (5 days) and −4 to 0 (5 days). We estimate the contribution ratios CAARS/CAART for each quarter where CAARS is cumulative average abnormal return in short-term window and CAART is the corresponding figure for total period (41 days). The contribution ratio shows the relative concentration of abnormal returns very close to event date as compared to elongated 41 days and is shown later. The mean contribution ratio is then calculated across all quarters (total period) as well as separately for normal and crisis period.
In sum, the abnormal return patterns around the earnings announcement dates helps us to evaluate stock market efficiency with regards to earnings announcements, explore possibilities of alpha generating trading strategies for portfolio managers and draw conclusions about investor behaviour in an emerging market setting.
The Relationship between Aggregate Corporate Earnings and Post-event Abnormal Return
We regress post-event CAARs on aggregate corporate earnings to analyze if stock price reaction differ for periods with higher and lower reported aggregate earnings. The slope of the relationship is tested for statistical significance at 5 per cent level.
Summary and Concluding Remarks
In this article we examine the relationship between earnings announcement and stock returns for the Indian equity market. The data are used for 469 securities which form part of BSE 500 index and the study period spans from December 2002 to December 2011 covering 37 quarterly earnings announcement periods.
Significant pre-event abnormal returns are reported for 32 out of 37 sample quarters implying that either investor are able to pre-empt information contained in earnings by observing other related financial variables or there are possible information leakages leading to information asymmetries. This may be a cause of concern for the market regulator and needs to be further investigated. Significant post-event abnormal returns are observed for 35 out of 37 quarters. The 19 post-events CAAR are significantly positive while 16 of them are negative. These results imply a rejection of semi strong form market efficiency in India which can be exploited by investment managers by developing appropriate trading strategies. It is further seen that pre- and post-event abnormal return patterns have not changed significantly for the pre- and post-global economic crisis period.
We find strong continuation pattern in abnormal returns for 26 out of 37 quarters suggesting that investors are generally able to anticipate the informational content of earnings. Post-event abnormal returns are higher for financial compared to non-financial closing quarters. It is further evident that only a small part of abnormal returns is observed in and around the earnings announcement date. In fact a large part of abnormal return is captured by elongating the event window around the earnings announcement date. Finally, it is observed that periods of higher aggregate corporate earnings result in lower post-event CAAR and vice versa. It seems that investors react more to bad news (lower aggregate earnings) than to good news (higher aggregate earnings).
Our findings shall be useful for market regulators, investment managers, companies as well as researchers. The market regulator needs to re look at its surveillance system for detecting any insider trading practices relating to earnings information. The investment managers must watch earnings news carefully and develop appropriate trading strategies around earning announcements to exploit observable market inefficiencies. From companies perspective the corporate finance managers will find it pertinent to understand how stock price reactions take place around earning announcements and how should they plan their earnings announcement date vis-à-vis their competitors. The researchers shall find it interesting to assess how investor interprets informational content of earnings which may have implications for behavioural finance research. The present study covers a large number of companies as well as a fairly long study period for India which is an emerging market and hence is closely followed by global fund managers. The research contributes both to stock market efficiency as well as behavioural finance literature for emerging markets.