
Abstract
Much debate has surrounded India’s lack of interest in plurilateral regional trade agreements (RTAs) and its decision to opt out of the regional comprehensive economic partnership (RCEP). Against this backdrop, the article attempt to analyse the competitiveness and potential of Indian export items in the RCEP region. The revealed comparative advantage (RCA) index has been employed to study India’s trade competitiveness among RCEP nations between 2010 and 2019 using the WITS (World Integrated Trade Solutions) 2021 database. The study found that India has a comparative advantage in more than 9 product categories out of 16 studied in the article. The article also revealed India’s competitiveness in intermediate goods with the majority of RCEP countries. The analysis found a trade complementarity between India and the RCEP countries and the possibility of increased economic cooperation. The problem lies in the utilization rate and weak export competitiveness of Indian industries. Before signing a new FTA, it is imperative to improve the export competitiveness of Indian enterprises. Given India’s current trade balance, tariff structure and export competitiveness of Indian commodities, we believe India had little option but to withdraw from the RCEP.
Keywords
Introduction
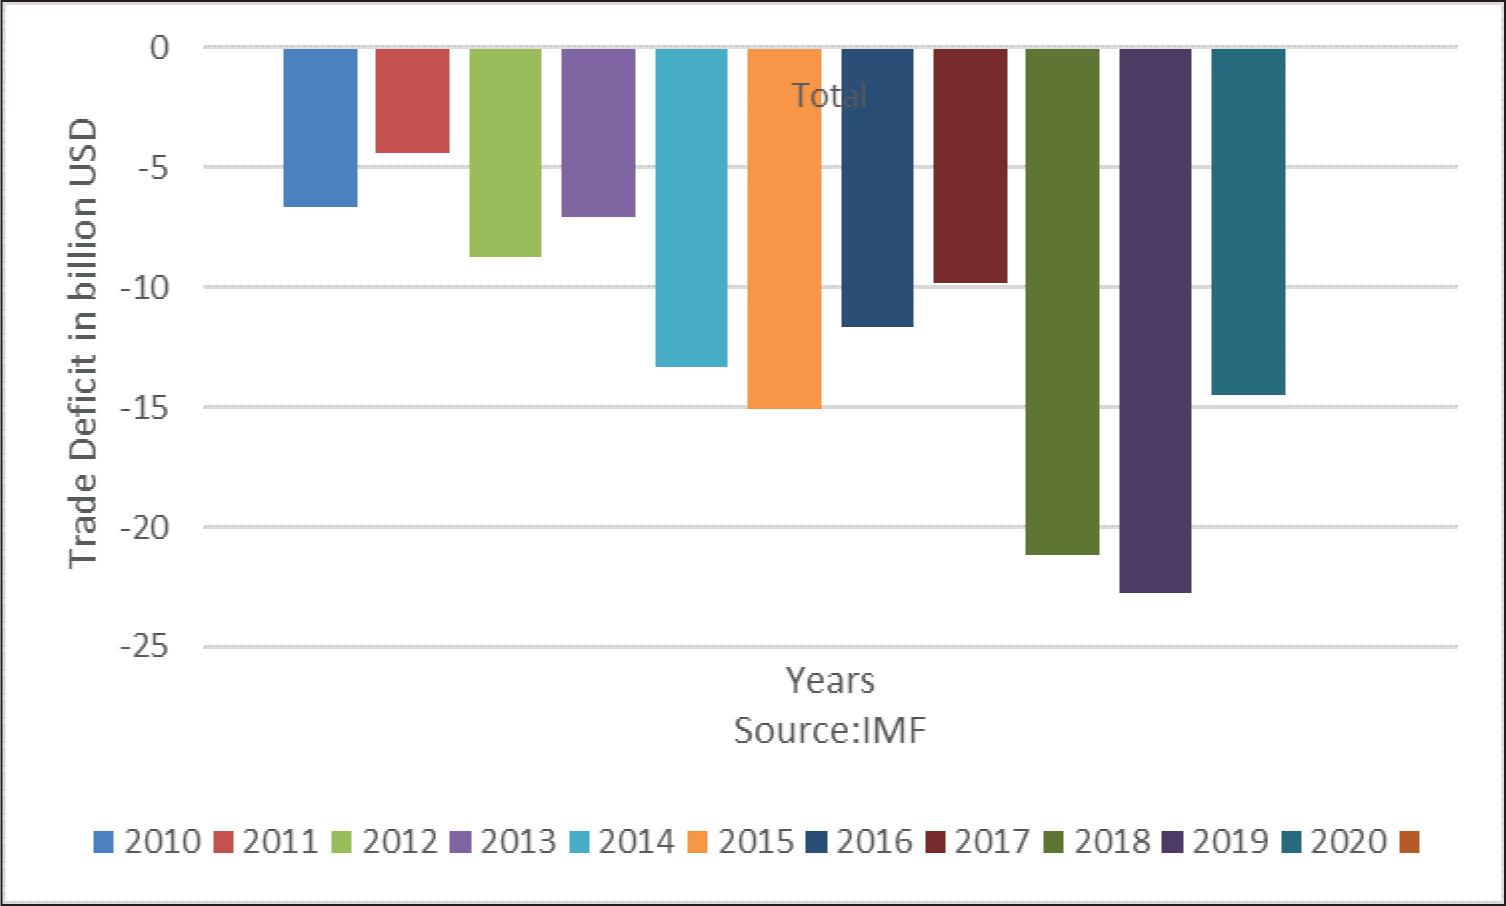
The world has witnessed a new protectionist wave leading to increased trade barriers, trade wars and economic powers backing out of regional mega-deals in the last couple of years. The withdrawal of the United States from the Trans-Pacific Partnership (TPP), the United Kingdom’s breaking away from the European Union, and India’s exit from the Regional Comprehensive Economic Partnership (RCEP) are a few examples. Much debate and discussion have centred around India’s decision to drop out of the RCEP in November 2019. RCEP was a proposed free trade agreement between ASEAN countries plus six nations (Australia, China, India, Japan, New Zealand and Korea). One of the primary reasons has been India’s experience with free trade agreements, which has not been encouraging. India signed a free trade agreement with the ASEAN countries for goods (2010) and services (2014). India’s trade with the ASEAN countries has since been growing by leaps & bounds, and so is the trade deficit, as evident from Figure 1. However, a decade after signing the AIFTA (ASEAN–India free trade agreement), India has yet to make progress (Jena & Saini, 2021; Saraswat et al., 2018). The growth rate of ASEAN imports has significantly outpaced India’s total global import growth. This increase in imports led to a widening of trade deficits with these nations to US$22 billion (2018–2019) from just US$8 billion (2009), leasing to jump from 7% to 13% in the share of ASEAN nations in India’s total trade deficit.
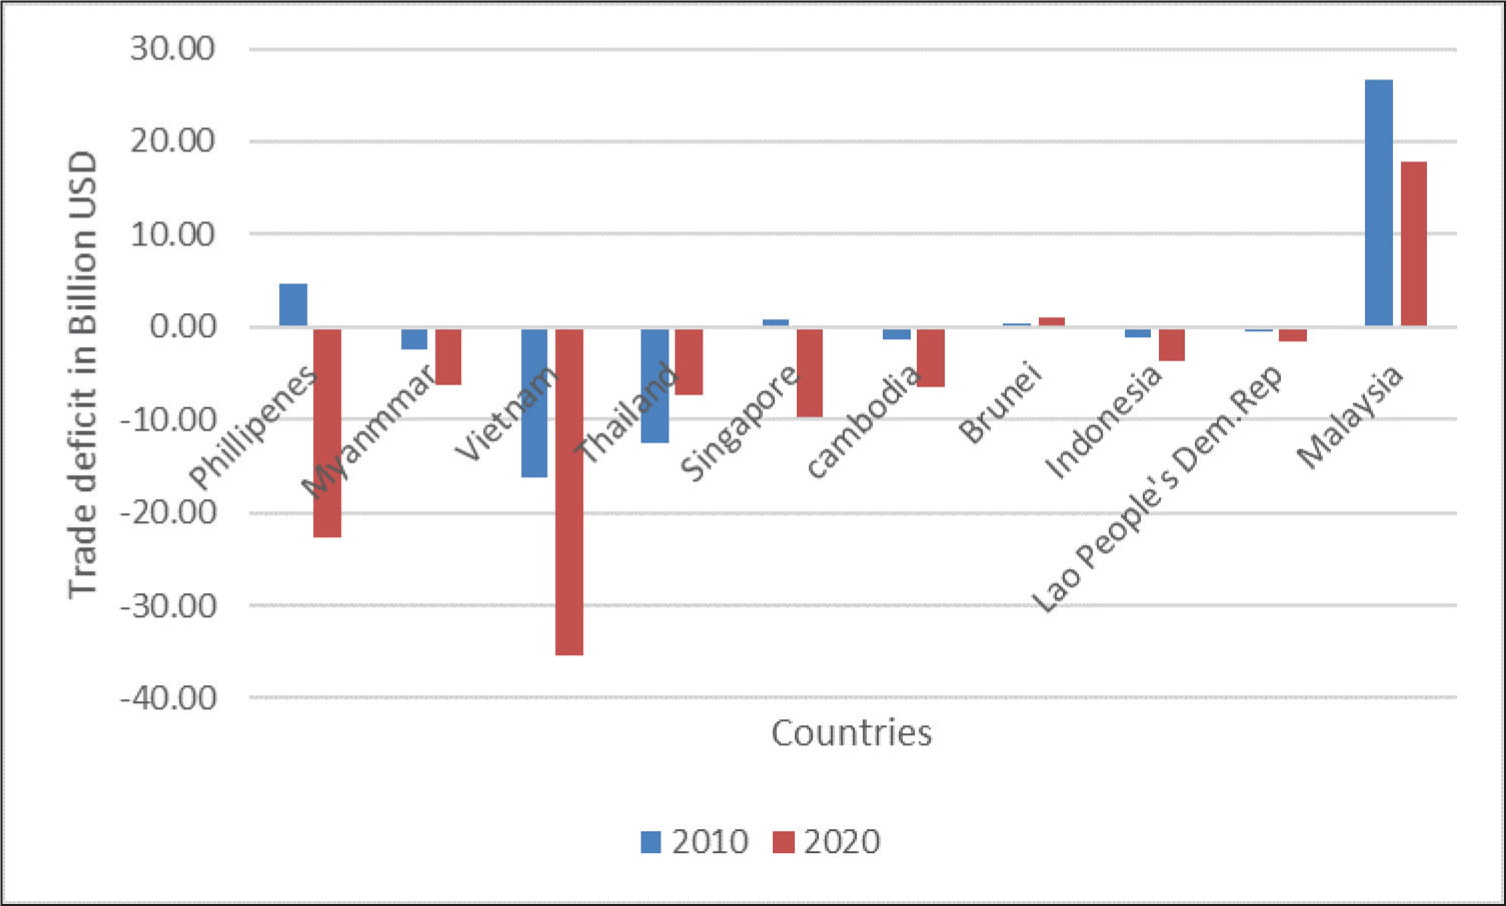
The same has been validated in ASEAN–China Free Trade Area (ACFTA), and the results have been discouraging (Alleyne et al., 2020; Chiang, 2018; Shuquan, 2019). The deficit of the ASEAN countries has grown from US$14.7 billion (2010) to US$92.87 billion (2018) ever since the signing of the ACFTA. Figure 2 below shows that except for one country (Singapore), all the other ASEAN countries are running substantial trade deficits with China post-ACFTA. Even the case of Singapore, which has been able to maintain the surplus, also witnessed a fall in trade surplus from US$2,829.88 million (2010) to US$952.78 million (2018).
India also entered into a comprehensive economic pact with South Korea and Japan. Ironically the fate of these agreements was similar to that of India’s experience with the ASEAN nations. However, trade has significantly increased to US$12 billion (2018) from US$21.5 billion (2010). Again India’s imports surged faster than its exports expanding its trade deficit from US$5 billion (2010) to US$12 billion (2019). During the same period, the overall trade imbalance with Korea climbed from 4.7% to 6.5%. After years of entering the CEPA, India’s total exports to Korea account for a tiny percentage of the country’s total exports (Seshadri, 2015). The India–Japan CEPA, which went into force on 1 August 2011, had a similar outcome. India’s trade deficit with Japan increased at a quicker rate than the country’s overall trade deficit. ‘As of present, India has 42 trade agreements (including preferential accords) either in effect or signed, under negotiation or proposed,’ according to the Asian Development Bank Institute (2019). Moreover, as pointed out by Cote and Jena (2015) and Saraswat et al. (2018), India’s experience in utilization of FTA has been relatively low at 5%–25%, except for SAFTA, where the trade with SAFTA countries increased from US$6.8 billion (2005–2006) to US$28.5 billion (2018–2019). As a result, the share of SAFTA countries in India’s total trade increased to 2.5% (2018–2019) from 1.6% (2005–2006). India’s trade surplus with SAFTA increased from US$4 billion (2005–2006) to US$21 billion (2018–2019). A study by Saraswat et al. (2018) for NITI Aayog also echoed similar sentiments in their study of India’s 15 major FTAs. The findings suggested that while there has been an increase in exports to these countries, the imports have far surpassed the exports, leading to huge trade deficits with the partner countries. One of the reasons for Indian exporters’ abysmally low use of FTAs is their preference for the traditional route over the RTA method (Saraswat et al., 2018). Another reason is the lack of competitiveness of its export industry in the international markets (Deb, 2020). Not only this, a study by Sen (2016) pointed out that more weightage was given to manufacturing over services in the majority of FTAs signed by India so far and undermining India’s potential in the sector. China and Korea’s contribution to ASEAN countries’ total trade is 15.2% and 5.4%, respectively, as against India’s contribution to ASEAN’s trade has been a minuscule 2.6% (Hsieh, 2017). As a result, the data indicates that India has yet to meet AIFTA’s expectations. India’s trade imbalance with the RCEP countries has nearly doubled in the last few years.
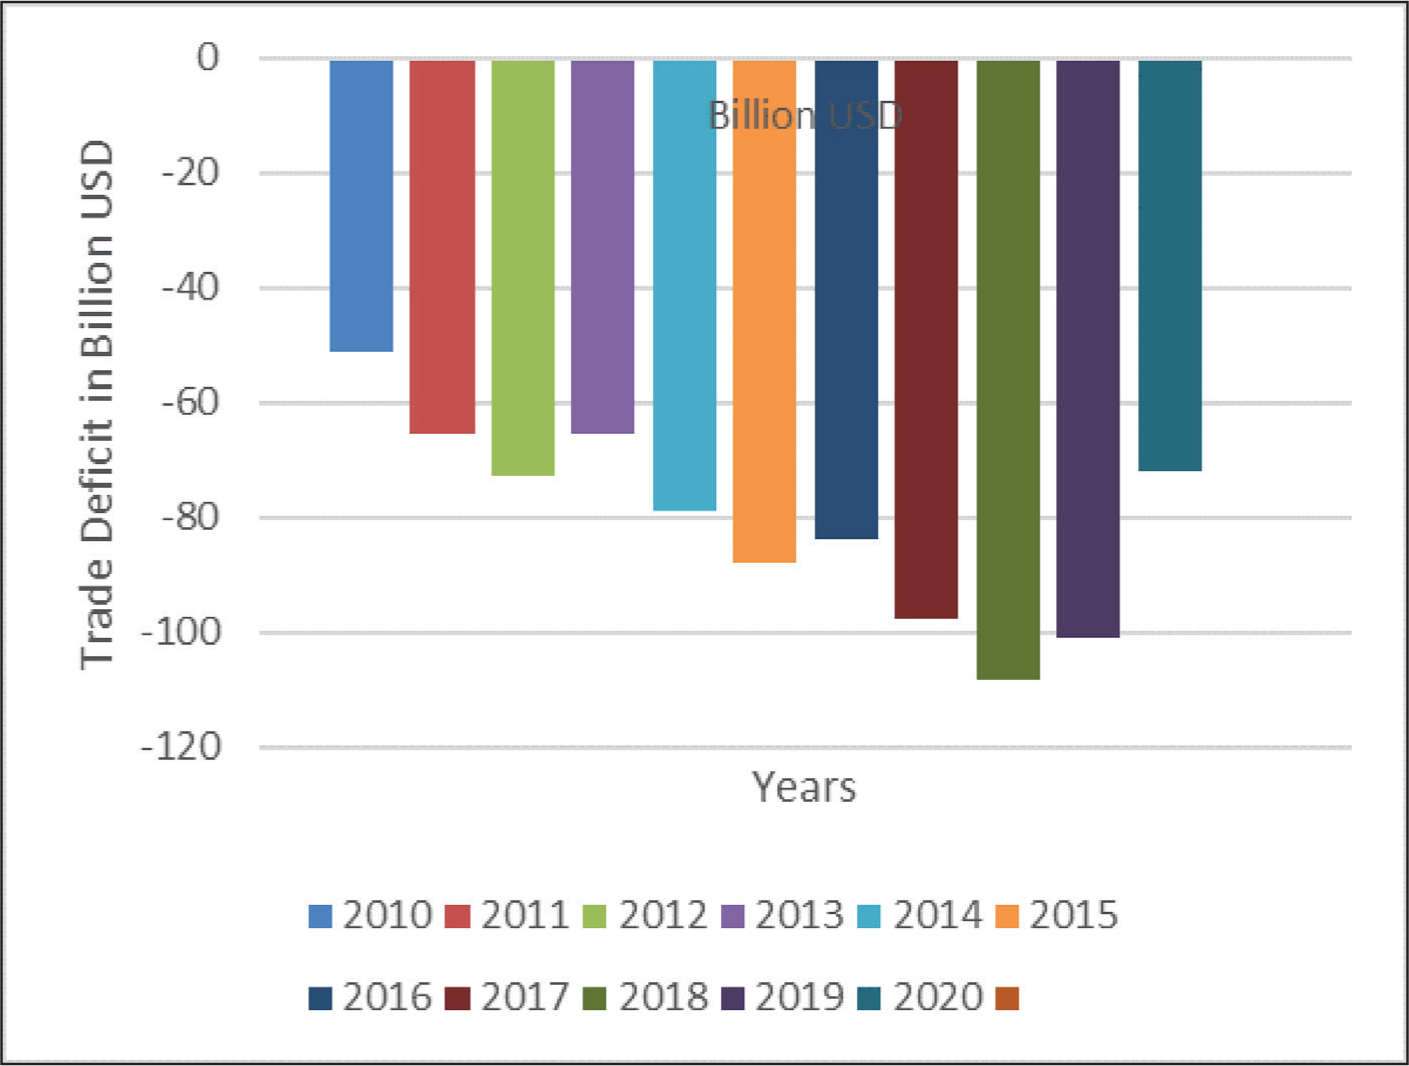
As evident in Figure 3, India’s exports to RCEP countries account for 24.47% of total exports and 34.4% of total imports. Furthermore, India faced significant trade deficits with nearly 15 RCEP nations in 2020 and an overall deficit with 11 of the 15 countries in the last decade (2010–2020). The trade imbalance with RCEP nations increased from US$51 billion in 2010 to US$101 billion in 2019, improving slightly to US$71 billion in 2020, not because of increased competitiveness but because of the impact of COVID-19 lockdowns. The trade deficit between India and Thailand has grown tremendously in the last few years. The trade deficit, which was US$1.8 billion in 2010, increased to US$3.3 billion in 2018. There was some relief in the COVID world, with the deficit falling to US$2.7 billion in 2019 and further to US$1.44 billion in 2020. Another cause of concern for India is that some countries’ trade surpluses have changed into trade deficits since the agreement was signed. India’s trade deficit with Thailand has significantly increased from US$1.8 billion (2010) to US$3.3 billion (2018). However, there was some respite in the COVID world, and the deficit was reduced to US$2.7 billion (2019) and US$1.44 billion (2020). Another source of worry for India has been that the trade surplus with some countries turned into a trade deficit with the signing of the agreement. The case of Singapore deserves special mention, where a trade surplus of US$1.82 billion (2010) turned into a deficit of US$4.05 billion (2020).
Similarly, a trade surplus of US$1.49 billion (2010) turned into a US$1.07 billion (2020) trade deficit with Vietnam. Ironically, the Philippines & Cambodia are the only two countries in India that have maintained a surplus. Even though India turned a trade deficit into a trade surplus (Myanmar and Lao), the trade surplus is substantially smaller than the trade deficit, as seen in Table 1.
India’s Trade Deficit with RCEP Nations in Billion Dollars 2010–2020.
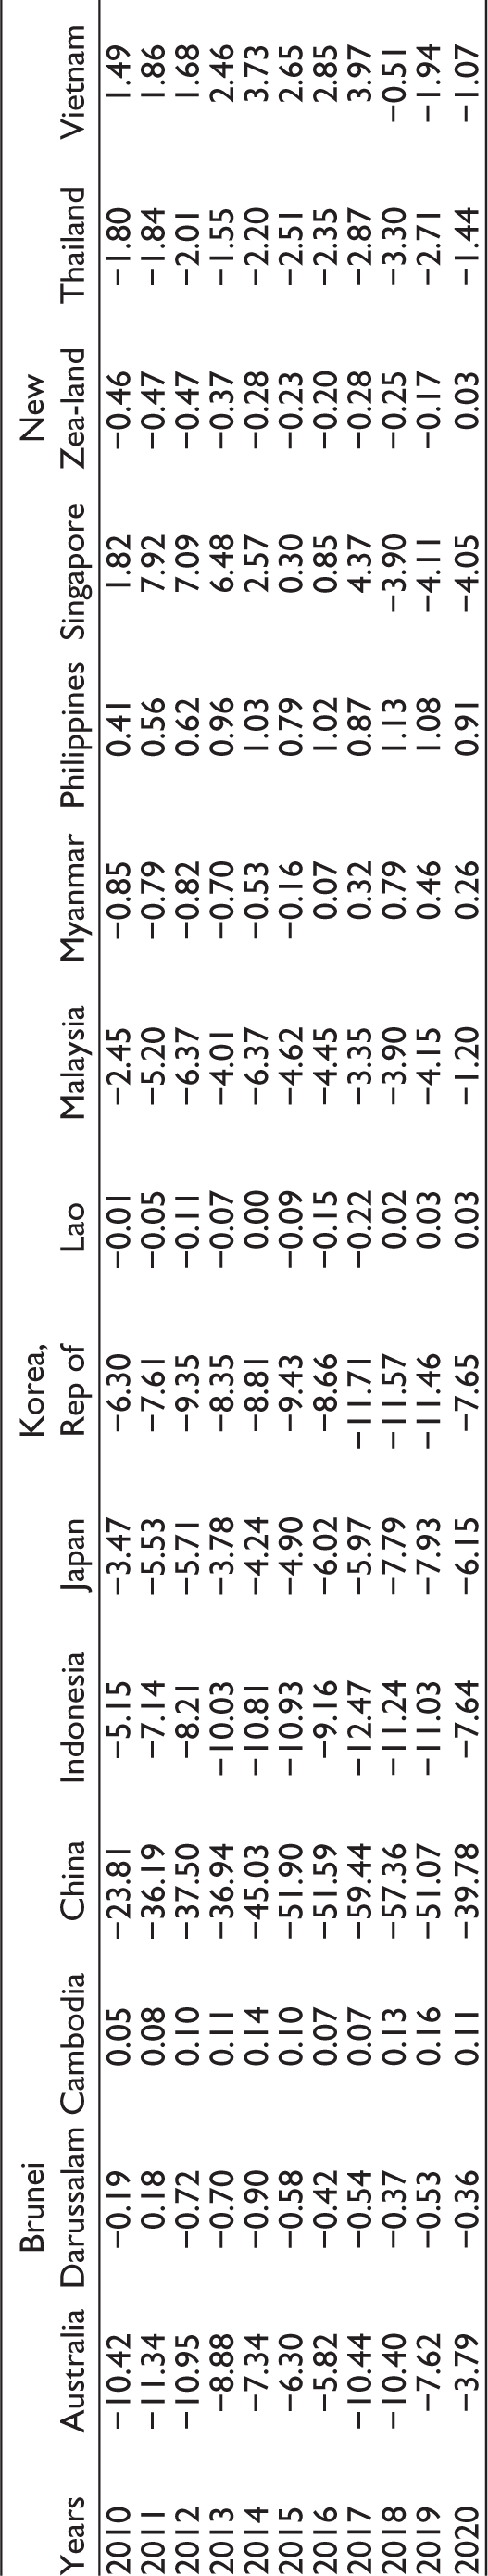
Surprisingly the share of one country, that is, China is almost 50% of India’s trade deficit. China’s share in this total deficit stands at US$51 billion out of the entire trade deficit of US$101 billion in the year 2019 & US$39 billion out of US$71 billion in 2020. Removal of tariff and non-tariff barriers with RCEP nations would have meant a massive influx of cheap goods, especially from China, crowding out the Indian market & thereby increasing the trade deficit. Ironically the year when India saw China’s trade surplus with India dwindling from US$59.3 billion to US$57.4 billion (2018), US$51billion (2019) & US$39.8 billion (2018) also saw Hong Kong’s trade surplus of 4 billion (2017) being converted to a deficit of 2 billion (2018), 5 billion in (2019) & to a deficit of US$4.9 billion (2020). India’s trade deficit with Hong Kong and China moved to US$60.1 billion (2018) from US$55.4 billion (2017). There was some respite in the covid years with a slight improvement in the trade deficit to US$56.4 billion (2019) & US$44.4 billion (2020).
Indian Government wanted to include an auto-trigger mechanism that would trigger duties automatically on imports on reaching a mutually agreed threshold in the RCEP trade negotiations to protect domestic industries from the massive influx of cheap goods, especially from China.
India wanted issues, such as the base year, the Ratchet Clause, the rules of origin, the tariff lines, data localization, safeguard mechanism and so on, to be addressed before joining RCEP. India wanted the base year to be 2019 instead of 2014, as proposed by other member countries. Under the Ratchet clause, India wanted to increase the tariff rates in contradiction to the reducing tariffs to zero by other countries. Though India agreed to phase out tariffs on 74% of goods from China, Australia and New Zealand and up to 86% for other RCEP members in 2017, the member countries made deeper concessions and a future commitment to bringing down tariffs on 92% of commodities for all the member countries. India wanted control over e-data flow on data localization, while most countries agreed on free data flow except for national security. Another of India’s concerns was relaxed rules of origin (ROO). India proposed differential tariff cuts with member countries. For example, a suggested tariff drop with ASEAN nations would reduce tariffs to zero for almost 90% of imports, and alternative tariff cuts for China were given. So, India was concerned that value additions could be changed to avail lower tariffs. India wanted maximum value addition from the country which exported the product. The dairy sector was another concern for India. The dairy sector has a trade surplus because of high tariffs on milk powder and butter goods. Hence the fear that farmers from this protected sector would suffer from the removal of trade barriers, especially from cheap imports of milk and milk products from Australia and New Zealand.
Investor-state dispute settlement (ISDS) was a legitimate issue for India. It would have allowed multinational corporations to challenge their domestic laws in offshore arbitral courts, giving them sole authority to bypass national legal systems. India’s proposed new BIT (bilateral investment treaty) model is far more restricted than the RCEP’s planned model. In 2017, India ended bilateral trade agreements with 58 countries. India insisted on Mode 1 (cross-border provision of services such as contact centres) and Mode 4 (human mobility, one of the four modes in which services can be provided worldwide). ‘Despite the dismal performance of India’s exports with countries having FTA’s, the RCA index gives a different picture. India does have a comparative advantage with RCEP countries and needs to make efforts in the right direction Jain (2020).
While there are differences in opinion on whether India would have gained or lost by joining RCEP, there is very limited literature evaluating India’s competitiveness to that of RCEP countries using competitiveness indicators from the most recent database. There is a need to close the research gap by doing methodical empirical and theoretical research to address the research concerns about the trade interactions between India and the other RCEP nations. The article provides insights into the economic integration and intraregional commerce of the RCEP countries. In this context, the article attempts to examine India’s position on the RCEP policy and conduct an empirical competitiveness analysis utilising RCA indicators. The article highlights the commodities in which partner countries will have advantages & disadvantages in trading. The article also throws some light on the lag between India’s potential with RCEP countries and turning it into a competitive advantage. In addition, the article analyses the current literature on India’s position on the RCEP.
The structure of this article is as follows. The first section highlights the modality, the significance of the issue, and India’s concern about not joining RCEP. The section also throws light on the research gaps. The following section reviews the literature available to identify research gaps and how the current research will address them. The third section describes the methodology and introduces the revealed comparative advantage (RCA) index. The fourth section analyzes India’s comparative advantage vis-à-vis RCEP countries both product-wise and sector-wise. The fifth section presents the policy and practical implications of the study. The last section contains some concluding remarks on the opportunities and challenges, followed by limitations and suggestions for future research.
Review of Literature and Hypothesis
The concept of competitiveness is inextricably linked to theories of international trade. Countries trade with one another based on their absolute advantages (Smith, 1776). Ricardo (2018) further built on this theory. He gave his comparative advantage theory, and according to him, it was a comparative advantage and not an absolute advantage that guides international trade. Countries often trade and specialize in those commodities in which they have a comparative advantage vis-à-vis partner countries (Boundi-Chraki & Perrotini-Hernández, 2021; Brondino, 2021; Machado & Trigg, 2021; Morrow, 2022; Samuelson, 2001)
Regionalism vs. Protectionism
Staunch supporters of free trade are following inward-looking strategies. The United States’ exit from the TPP, Brexit & India’s reluctance to join RCEP is some classic examples of the recent trend (Bobasu et al., 2021; Frost, 2021). Cappariello et al. (2020), in their study on rising protectionism and global value chains, spoke about how despite significant efforts towards global integration over the years, the expansion of international trade has been at a slower pace since the 2008 global recession. Many countries have resorted to ‘Buy National’ clauses in stimulus packages and have raised trade defence measures, tariff measures and export taxes, among other trade barriers (Bhagwati et al., 2017; Sheldon et al., 2018). Some recent studies shed light on the rise of nationalistic leaders globally and, to differing degrees, how each of these leaders embraced the ‘our country first’ mentality, mostly having a cynical outlook towards multilateral institutions and global trade (Evenett, 2019; Meyer, 2017).
Regional Blocks and Trade Balance
A global free trade system or a global treaty is an ideal international agreement. In practice, however, most agreements are regional or bilateral rather than multilateral (Jaffry, 2021; Moon, 2018; Rodrik, 2018). Multilateral trade agreements usually face political and economic barriers (Baccini, 2019; Milward, 2019). As a result, regional trade agreements (RTAs) are emerging as a viable alternative to having gains from trade (Nguyen, 2019; Wang, 2020). RTAs have both advantages and disadvantages. Limiting the number of participants in the negotiation can incorporate more facets of economic integration. Political support for RTAs appears stronger than unilateral liberalization because of reciprocity among other member countries. However, forming a regional trading block only sometimes transcends into a positive trade balance (Balistreri et al., 2018; Jain, 2020). RTAs distort resource allocation by de facto discriminating against non-members, promoting regional producers at the expense of local customers (Gharleghi & Shafighi, 2020). Recent studies have also highlighted the worldwide implications of various and overlapping RTAs in transaction costs (Gurunathan & Moorthy, 2021; Ravenhill, 2020). Many recent studies have focused on the relationship between the formation of regional blocks and their impact on the trade balance.
Few recent studies concluded that while trade liberalization improves economic growth in most nations, this growth hurts the trade balance (Gnangnon, 2018; Manwa et al., 2019; Mohaghegh & Valipour, 2021). Following trade liberalization, countries may experience high real exchange rates and a worsening savings-investment balance. This might eventually lead to a deteriorating current account and trade balance.
South Asia has a relatively low level of regional integration and comparatively higher trade barriers. However, the proportion of trade from South Asia has increased over the last decade, but it is far from the ASEAN levels. Despite the scepticism surrounding regional trade agreements, most empirical research demonstrates that trade creation has been far more than trade diversion (Mahadevan & Nugroho, 2019).
Gains from FTA’s are Directly Related to Trade Competitiveness
The revealed comparative advantage index has been used in numerous studies to assess comparative advantage and export competitiveness (Kaushal, 2021). An early study by Balassa and Noland (1989) used the RCA index to evaluate the export competitiveness between the United States and Japan for 15 years, from 1967 to 1983. Using the RCA index between 1994 and 1998, Abidin and Loke (2008). compared Malaysia’s export competitiveness to other ASEAN countries and found that Malaysia evaluated the factors that affected its export competitiveness. A review of the available literature on the ramifications of India remaining in or leaving the RCEP trading bloc suggests that a trade surplus with another country can offset a trade deficit with China. Low-cost imports are required to develop India’s manufacturing industry (Ahmad et al., 2017; Panagariya, 2018; Upendra Das et al., 2016). Despite China’s dominance, they thought there was a significant potential for Sino-Indian trade that could benefit both nations. However, some studies contradict this claim for reasons like stringent intellectual property controls (Bhutani, 2017) and controlled liberalization in the service sector crucial for India (Chakraborty et al., 2019).
Revealed Comparative Advantage
Many studies have used the Balassa index, popularly known as the Revealed comparative index, to evaluate its competitiveness vis-à-vis its partner countries. India’s export competitiveness with possible RCEP partners. Leu et al. (1998) employed the RCA index to measure a shift in comparative advantage in the US market for ten East Asian nations. Maqbool et al. (2020) used the RCA indices to assess the competitiveness of the top five cotton-exporting economies. The study’s findings show that Pakistan, India, China and the United States all had a comparative advantage between 2008 and 2017, but Vietnam had a comparative disadvantage between 2003 and 2007. A few studies looked at India’s competitive position in commodities trade with the RCEP countries, and those looked at the ramifications of India remaining in or leaving the RCEP trading bloc. Several previous studies used traditional indices, such as the trade complementarity index (TCI), trade intensity index (TII) and the RCA index to assess India’s competitiveness with ASEAN and BRICS countries (Chandran, 2011; Mbogela, 2018). For exports to numerous ASEAN countries, India’s advantage was evident in minerals, manufactured commodities, such as chemicals, iron and steel, and gems and jewellery (Chandran & Sudarsan, 2012). Garg (2016) looked at India’s RCA and EII with Sri Lanka, India’s first FTA partner, in 1998. The study calculated RCA for commodities with an HS 2-digit code, determining the likelihood and potential of Indian exports to Sri Lanka.
Batra (2007a) examined the pattern of trade flow between India and China using Balassa’s RCA index. The index was generated at the sector and commodity level based on a consistent classification system. According to Rahman et al. (2020), despite India’s relative abundance of trained labour and capital, its manufactured export items were heavily concentrated in low-technology items, with the share of low-technology items exceeding the share of high-technology things. In their study, Jain and Kannan (2021) used four variations of RCA indices to find a comparative advantage in India’s agro-processed products. They studied a total of 116 agriculturally processed items and broadly categorized them into three categories. They found that India was losing its RCA in processed animal and vegetable products.
The literature review reveals enough studies on regionalism vs. protectionism, regional blocks and trade balance, gains from FTA and trade competitiveness & revealed comparative advantage. However, there is a dearth of studies that have mapped it to RCEP countries. Though many studies have analysed India’s trade with ASEAN countries, they have yet to use the RCA index to examine the same. The current study fills this gap and critically analyses India’s competitiveness with the RCEP countries, highlighting the potential and comparative advantage of regional trade with RCEP countries.
Methodology
The RCA index, first suggested by Balassa, is used to gauge trade competitiveness between India and RCEP countries (1965). This index enables a comparative trade analysis between partner countries in a free trade agreement, regional economic integration, or preferential trade agreement. It highlights the commodities in which respective countries will have advantages & disadvantages in trading certain commodities. The RCA index is calculated by dividing a country’s total exports of a commodity to its total exports by its share of world exports of the same commodity in total world export and is defined as

where,
RCAab = Revealed comparative advantage index for country a of commodity b Rab is the ath country’s export of commodity b Ra is the total exports of a country a Rwb is world exports of commodity b Rw is the total world exports.
The value of this index ranges from greater than 1 to less than 1. A value greater than one indicates a significant competitive advantage, and an index value less than one indicates a competitive disadvantage. Based on the index, countries can promote the export of those commodities in which RCA has been observed and vice versa. Also, these values imply that no matter how a country is performing in absolute terms, it will undoubtedly have some sectors with higher RCA and some sectors with lower value as its measure of relative and not total strength. The study used RCA indicators for 16 countries and 20 commodity groups from the WITS database (2021) of the World Bank for the period between 2010 and 2019. The trade data is retrieved from IMF. Though areas, such as trade deficit, human mobility, intellectual property rights, investor-state dispute settlement and rules of origin have been important points of discussion in the RCEP negotiations, the high volume of goods exports from RCEP countries, estimated at 30% (WITS Database, n.d.), and tariff negotiations on trade in commodities make commodity analysis relevant. The study examines India’s trade competitiveness viz-a-viz RCEP countries on macro and commodity levels.
Analysis
Table 2 shows India’s RCA index in comparison to RCEP countries for 16 product categories between 2000 and 2019 (averaged) as defined by WITS (World Integrated Trade Solutions). The annual data (millions of US$) for this study has been retrieved from the WITS database 2021. A value greater than 1 shows that India has a strong comparative advantage.
Table 2 reveals that the product categories where India has a comparative advantage with most countries are Chemicals. India has a comparative advantage with 14 out of 15 RCEP countries.
RCA Index of India’s Exports with RCEP Countries.
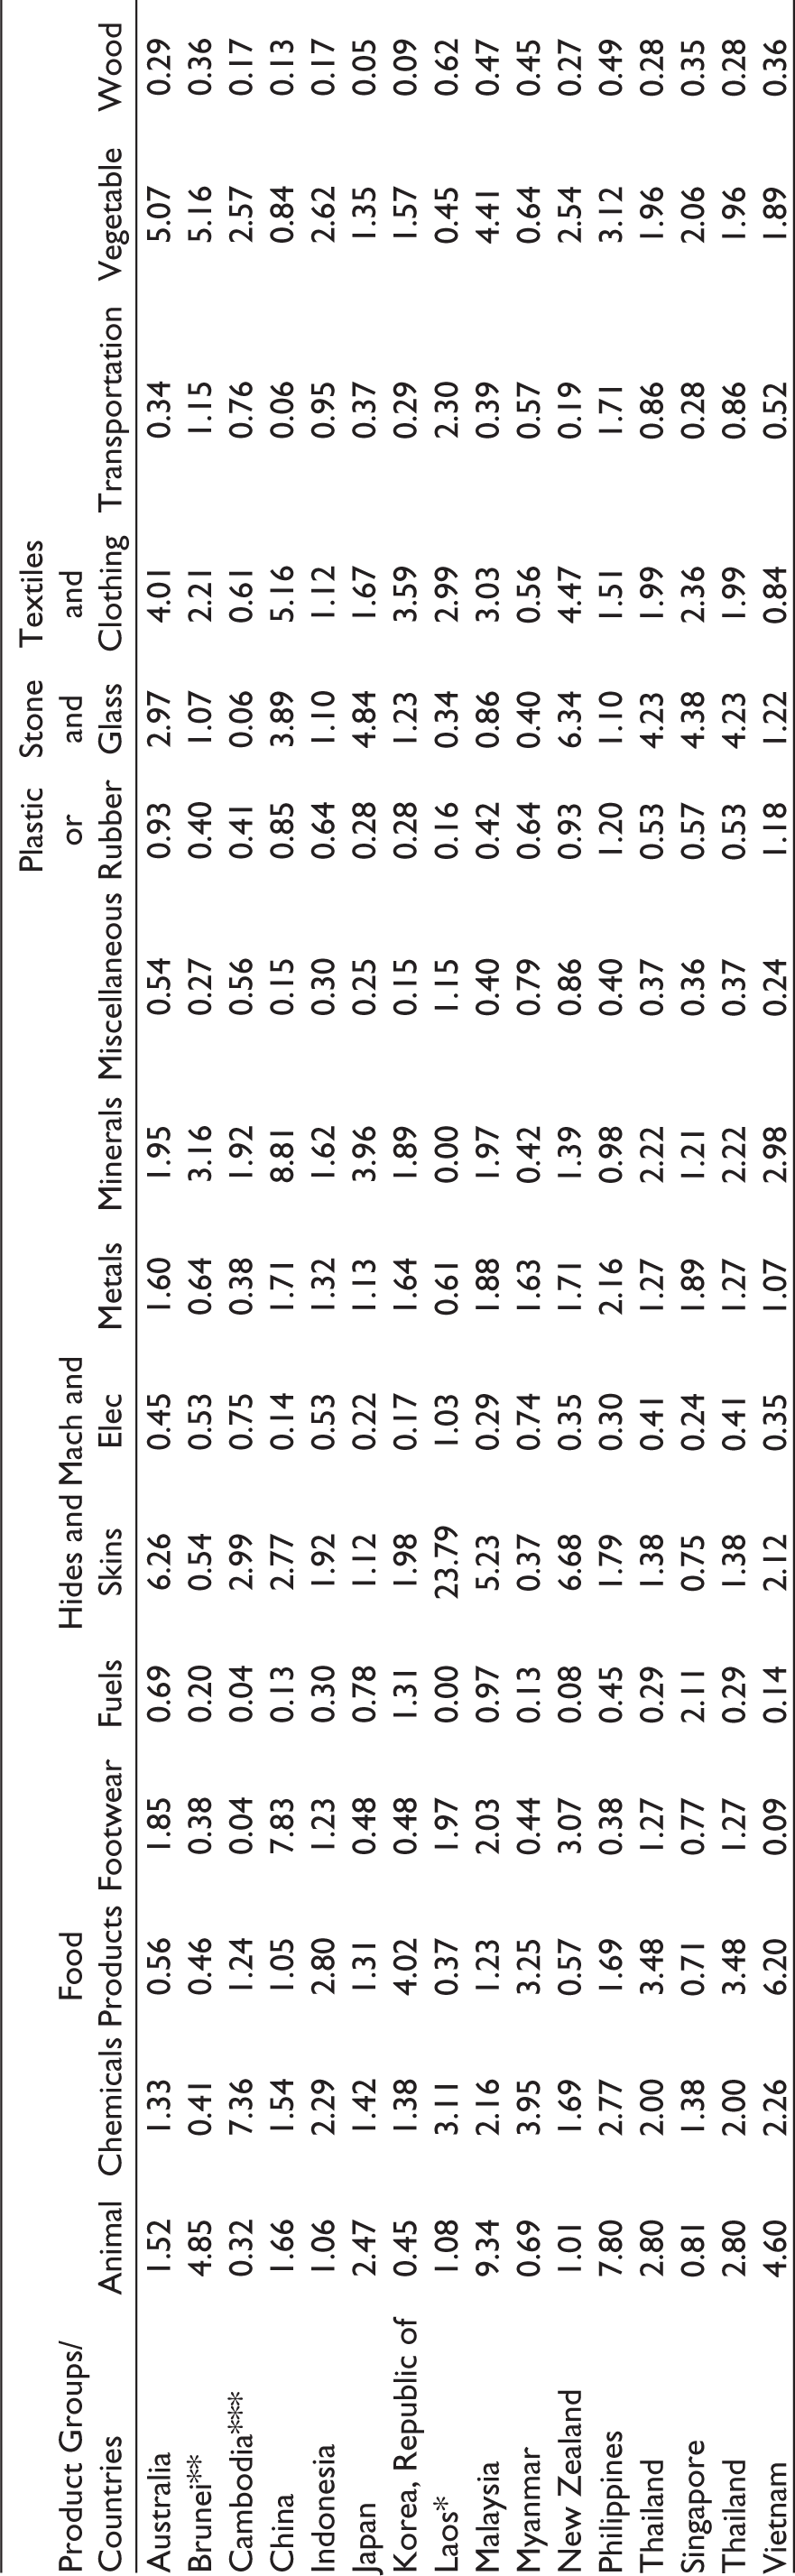
** There was no trade data for the years 2000 and 2005.
*** There was trade with Cambodia for some product lines. So the average was taken for the years trade happened in those product lines.
This advantage is further validated by India’s role in fighting the war against COVID-19. The mineral is also where India has enormous potential and has a comparative advantage, with 13 out of 15 RCEP countries in the category.
In Hides & Skins, Metals, Textiles & Clothing, India has a comparative advantage with 12 out of 15 RCEP countries. Stone & glass, Vegetables (11 out of 15 RCEP countries) & in Animals & Food product categories India’s advantage lies with 10 nations. On the other hand, when the index value is less than one, India has a comparative disadvantage in a particular commodity. As shown in the table, India’s weakness lies in the products, such as Fuels, Machinery & Electrical, Plastic, Rubber, Transportation, Wood & miscellaneous.
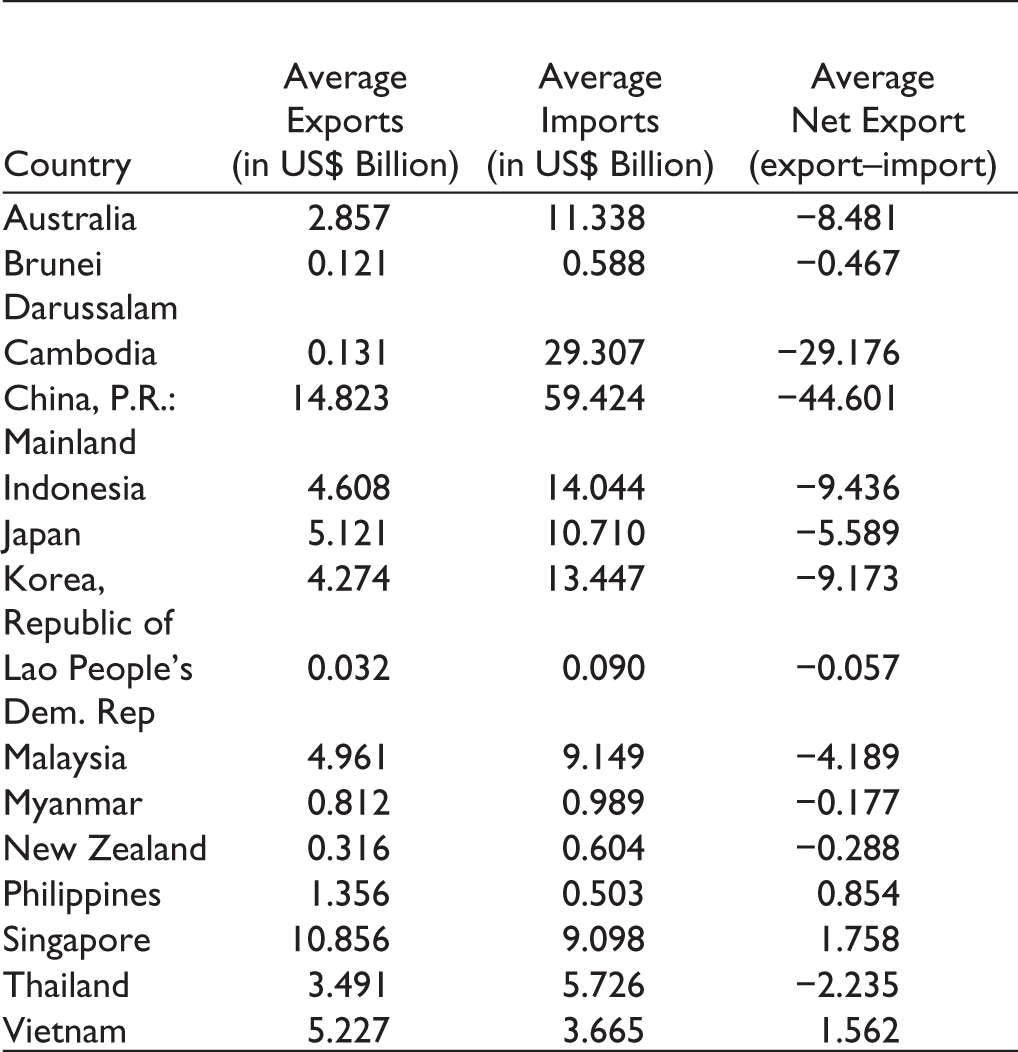
If we analyze the RCA index country-wise, we realize that India has a comparative advantage in more than 9 product categories out of 16 studied in the article with countries, such as the Philippines, Thailand, Australia, Japan, South Korea, Vietnam, China, Indonesia & Malaysia. Surprisingly, India’s trade deficit with China is US$44 billion. One of the primary reasons for India’s reluctance to join RCEP is that China has a comparative advantage in almost 9 product categories out of 16 studied. So, this is the case with countries, such as South Korea, Indonesia, Australia & Japan, where India’s average trade deficit for the years 2010–2020 stands at US$9.173 billion, 9.436 billion, 8.481 billion and 5.58 billion, respectively (Table 3).
Cambodia, Myanmar & Brunei are the only three countries where India’s advantage is in less than six product categories and probably one of the primary reasons why India’s trade deficit with Cambodia is the second highest amongst the RCEP countries, which stands at an average of 29.17 billion USD in the last decade (2010–2020).
If we look at the comparative advantage product-wise, which is relative, India’s RCA with Australia in the area of hides and skin is as high as 6.40 between 2010 and 2018. The value of India’s hides and skins exports to Australia in 2018 was only ₹11,228.82 thousand USD, accounting for only 2.35% of India’s total exports to Australia.
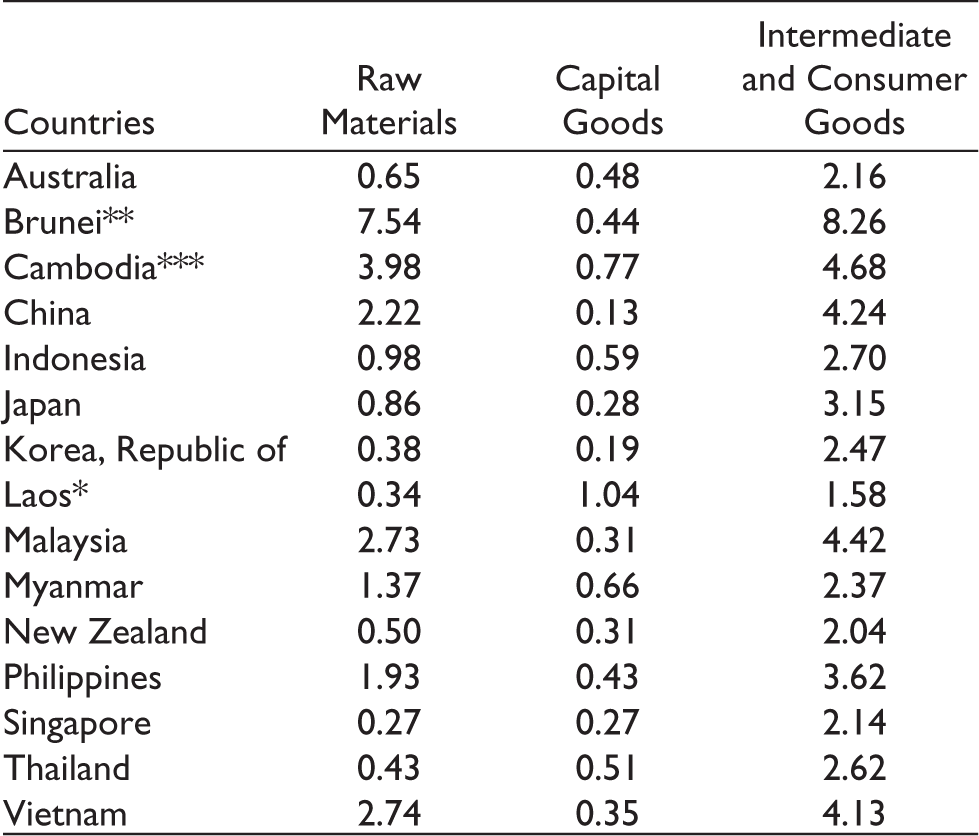
So, even if we have a competitive edge in some product categories, the absolute number of products we sell is substantially lower. The RCA index highlights India’s potential, but it must be turned into a competitive advantage. The sector-wise comparison showed that India does not a have comparative advantage in capital goods with any country in the RCEP region except Laos. India’s disadvantage lies in capital goods and at the same has not been able to realize its advantage in consumer and intermediate goods. Probably this explains India’s trade imbalance with 13 of the RCEP countries.
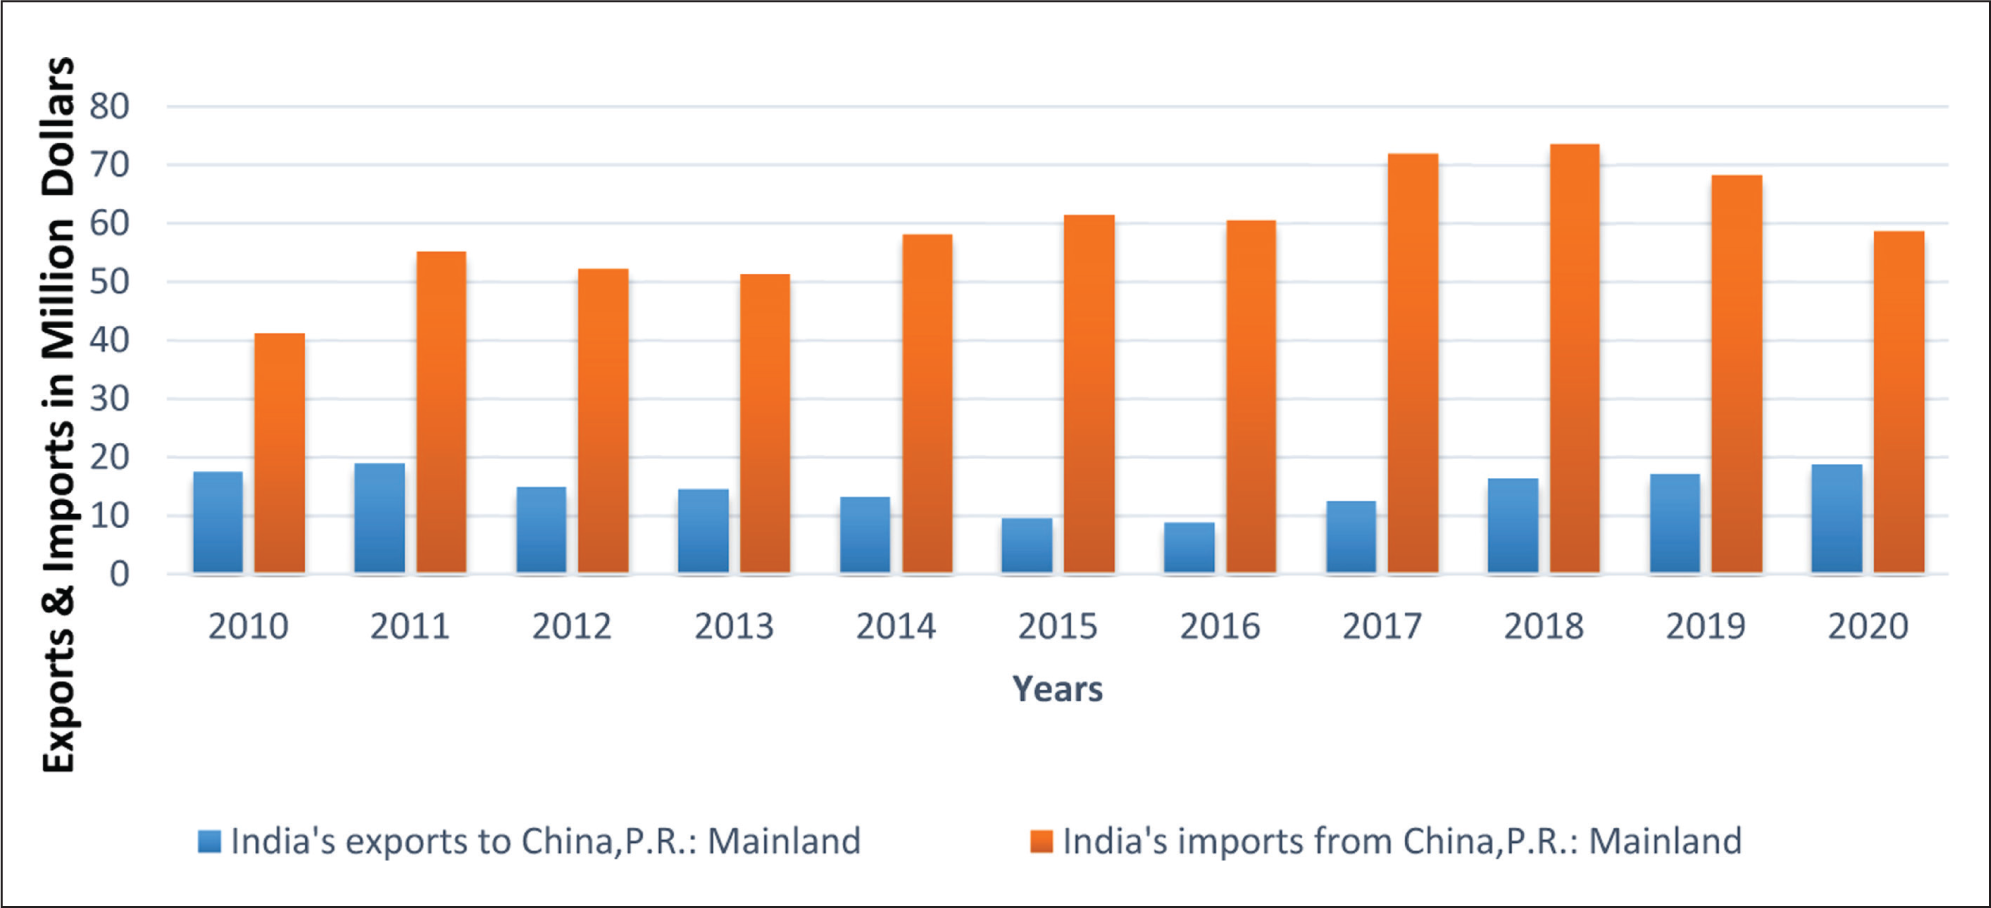
Table 4 helps us examine India’s presence in RCEP countries with exports and her dependence on these markets for Imports. Table 4 also highlights the role of China as India’s major trading partner, with almost 5% of its exports going to Chinese markets and 13.66% of imports from China finding their way to India. Compared to India’s exports to China, her imports from China are almost three times her exports.
RCA Index of India’s Exports with RCEP Countries.
** There was no trade data for the years 2000 and 2005.
*** There was trade with Cambodia for some product lines. So the average was taken for the years trade happened in those product lines.
India’s Percentage Share of Exports and Imports in RCEP Countries as Percentage of Total Exports and Imports of India.
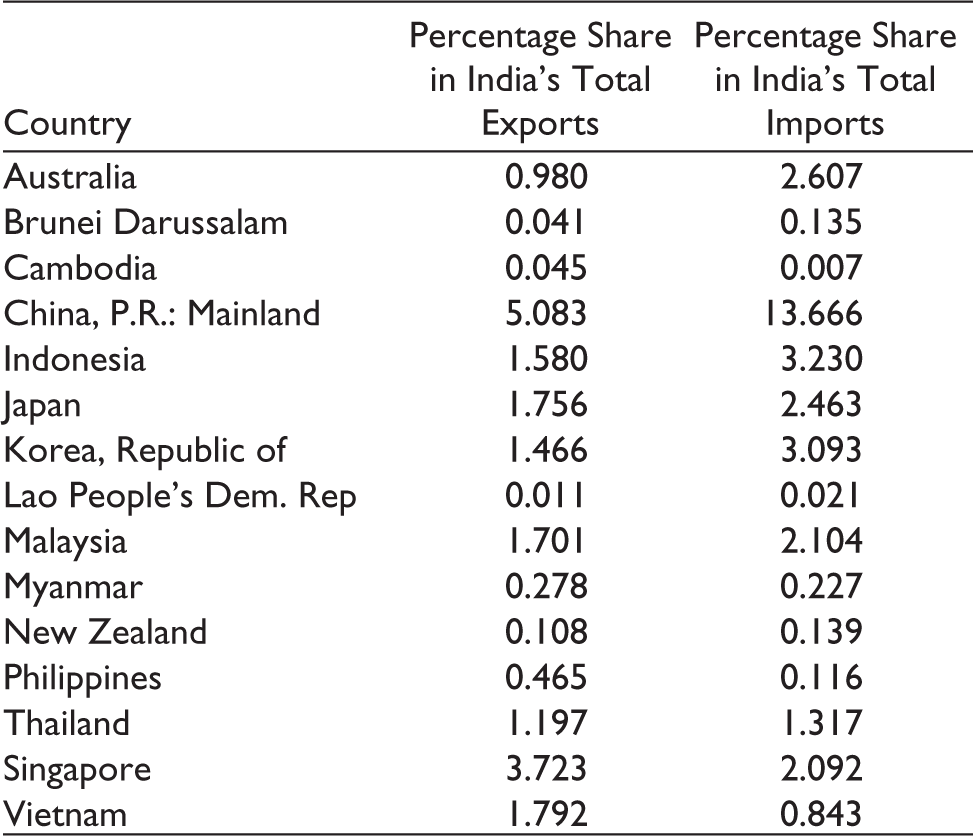
Interestingly, despite the massive trade deficit, China is still our largest export destination amongst the RCEP countries. Hence there is no denying the importance of China as India’s trading partner. Singapore is the only ASEAN country with a significant market for India’s exports having a share of 3.72% of India’s total exports. India’s other export destination includes Indonesia, Malaysia, Thailand, Vietnam, Japan and South Korea. Prominent RCEP countries with the lion’s share of India’s imports have China at the top position, followed by Indonesia, South Korea, Australia, Japan, Malaysia and Singapore. Ironically the difference between India’s leading two import destination countries in the RCEP region is almost ten percentage points, with China’s share being 13.67% and Indonesia’s share being 3.23%. RCEP countries together make up nearly 24.47% of India’s total exports & 34.42% of her total imports come from these countries. This indicates a substantial inflow & outflow of commodities from India to RCEP countries.
Table 5 shows on average net exports of India to RCEP countries shows India’s concern about trade deficit is not unfounded and that India runs a trade deficit with 12 out of 15 countries, with high deficits with China (US$44.6 billion), followed by Cambodia (US$29.17 billion), Indonesia (US$9.4 billion), South Korea (US$9.17 billion), Australia (US$8.48 billion), Japan (US$5.58 billion). India has a small surplus with only three countries, namely Singapore, Thailand & Vietnam.
Net Exports of India to RCEP Countries.
Discussion
The early 1990s witnessed a proliferation of RTA’s globally and the first decade of the formation of WTO saw snowballing of RTA’s, with their number shooting up from 58 to 188. Currently, there are 350 RTA’s in effect globally. In tandem with the global shift, India’s trade policy also has drifted significantly toward regionalism over the last decade. Currently, 14 RTAs are in effect in India, with a dozen more in the pipeline. Overlapping RTAs are a result of their augmentation. For example, India has separate RTAs from Malaysia and Singapore, India’s ASEAN CECA members. Another intriguing example is Sri Lanka, where an Indian person can trade via any of the four RTAs. With this background, many came as a surprise when India backed out of RCEP in November 2019 after negotiations failed to address India’s outstanding issues and concerns. Multilateral trade agreements provide greater market access, reduced tariffs/zero tariffs, preferential treatment against the escalating trade tensions and protectionist policies prevalent globally (Gnangnon, 2018; Hannah et al., 2018).
The RCEP members account for 25% of the global GDP, 30% of international trade, 26% of global FDI and 45% of the global population. The RCEP countries’ aggregate trade with India was anticipated to be US$2.7 trillion. With India’s decision to opt-out, the country may miss out on enhanced trade opportunities with RCEP nations. It could have been India’s ticket to exponential economic growth. A High-Level Advisory Group (HLAG) report led by economist Surjit S. Bhalla suggested the same. The report emphasized ‘the importance of global value chains in a country’s economic development, the importance of technology and investments in a developing economy, and the necessity of seeking market access by negotiating multi-layered regulatory environments in partner countries,’ according to the report. ‘Because of the deadlock in the multilateral trading system,’ the article states, ‘the role of FTAs has become vital in foreign trade policy.’ Looking at a different perspective, an economic slowdown is all the more reason for greater market access to counterbalance diminishing domestic demand. Also, India’s main service sector issue was Mode 4 (person movement), which would have allowed unrestricted movement of experts across the group, but Mode 3 (commercial presence), which Indian investors would have been interested in, should have been given equal weightage.
Agreed, the unorganized dairy industry would not have been able to withstand the barrage of New Zealand dairy goods competition. Still, the benefit of this trade deal to consumers would have outweighed the cost to dairy farmers. Pharmaceuticals, cotton yarn and service industries believed that being a part of the RCEP would have given the country preferential market access. The trade deficit should be one of many criteria used to evaluate FTAs. More importantly, consumers would have benefited from more open markets and lower tariffs.
Being part of RCEP would have presented India with its own set of problems, but not joining has resulted in the loss of opportunities, preferential access and export competitiveness. Though domestic industries would have suffered in the short term, India could have profited from global supply networks and increased market access in the long run. A decrease in the price of dairy products would also be beneficial. Also, the trade deal could have served as the bridge integrating the Indian economy with that of Asia Pacific countries (Seymour & Wilson, 2019). Reduced trade barriers generally positively impact the business environment by increasing economic activity levels within the group because of changes in the production technique and altering the composition of economic activities (Grossman et al., 1995; Ray et al., 2021; Wicaksono, 2021). Furthermore, reducing trade barriers would have resulted in low-cost intermediate goods. Hence, no part of this mega trade partnership would harm India’s future exports and investments, as well as what India would gain by being part of RCEP in terms of preferential treatment from 15 RCEP countries.
Other studies have found that India may not gain much from the RCEP due to strict intellectual property protections (Bhutani, 2017) and the agreement’s absence of service trade liberalization, which is critical for India (Chakraborty et al., 2019). Jain (2021) also believes India made the right move by withdrawing from the mega-deal. The need for domestic industry competitiveness helps India fully utilize the FTAs. This competitiveness issue must be overcome before India can reap the benefits.
India got a raw deal from its existing bilateral trade agreements with its partner countries, such as Japan, South Korea, or ASEAN, with a trade deficit moving from US$41.4 billion (2008) to US$145.7 billion (2018). The importance of India in the RCEP should be considered from a macroeconomic standpoint, including trade in commodities.
It is commonly accepted that increased trade spurred on by greater economic integration may boost regional and global economic growth (Abendin & Duan, 2021; Banik & Yoonus, 2012; Thomas, 2018). However, it may also lead to more trade diversion than creation, and policymakers should keep this in mind while signing FTAs (De Soyres et al., 2019; Heo & Doanh, 2020; Singh, 2021). As the study shows, not all regional integration can lead to economic growth, and on the contrary may lead to increased job losses, trade deficits and vulnerability of domestic industries (Burfisher et al., 2019; Choi et al., 2021; Flores-Macías & Sánchez-Talanquer, 2019; Khan, 2020). Economic integration can be converted to growth and increased exports if countries can exploit their comparative advantage and should focus on structural reforms; before letting the guard down (Ali, 2017; Balassa & Noland, 1989; Batra, 2007b; French, 2017; Gnidchenko & Salnikov, 2021).
Conclusion
The debate surrounding India’s exit from RCEP has diverse and contradictory views. The poor Utilization rate of India’s past FTAs, bulging trade deficits with member countries, lack of export competitiveness and the threat from China has been some of India’s primary concerns. RCEP might have become the largest mega-regional trading bloc with India and could have been India’s ticket to the global value chain. This study shows India’s comparative advantage in many product categories vis-à-vis RCEP countries. However, the same is not reflected in numbers, and there are widening trade deficits with ASEAN countries (Jain, 2020). According to SBI Ecowrap 2019, the utilization rate of India’s FTAs is under 25%. The study reveals that India’s current FTAs with ASEAN, Japan and Korea are underutilized, resulting in a large trade deficit with most RCEP countries. India’s untapped export potential is estimated to be around US$201.4 billion, and its import potential of US$181.8 billion, according to the International Trade Centre (ITC). It is only prudent for India to stay away from the RCEP until it can demonstrate its trade competitiveness in specific commodities and services and focus on more successful bilateral trade pacts to address the shortcomings of FTAs with partner nations.
‘Purchases of Indian exports have been more tied to changes in income in other countries than to changes in the prices of commodities themselves arising from trade concessions’ (Saraswat et al., 2018). As a result, the tariff reductions would not have affected our exports but could have increased imports, adding to our growing trade deficit with these countries. ‘If India fails to build capacities, the RCEP could hurt indigenous producers’ (SBI Ecowrap 2019). ‘India should see this as a chance to make structural reforms so that our industries become more competitive in the long run, so that current FTAs, as well as agreements like the RCEP, are fully leveraged and realize the intended benefits.’
However, Protectionism, on the other hand, never works in the long run. As shown in the study, India must improve its competitiveness in the products where it has a comparative advantage. India might benefit from market access in commodities, such as textiles and garments, consumer products, vegetables and skin due to the RCEP’s lower tariffs. India has significant RCA in chemicals and stone and glass. Still, advantages from the RCEP would have been limited because the partner countries already have low tariffs, as India already has FTAs with most RCEP nations.
Limitations and Suggestions for Future Research
The limitations of this study provide much room for future research to expand. The study focused on India’s trade competitiveness vis-à-vis RCEP countries only. Later studies can replicate comparative investigations for other countries and different products. A conceptual model and framework can also be added to make the analysis more relevant. Therefore, future studies can be conducted to incorporate some of these factors. Moreover, it will be interesting to test this paradigm on actual export data in future. The link between comparative advantage and actual exports could be explored further. This topic provides enormous potential for future study as countries try to increase their exports. The findings will also have crucial implications for understanding India’s trade competitiveness post-COVID crisis, where countries are staring at a possible global recession. Hence, policymakers wanting to stimulate their exports, thereby hoping to improve their trade and current account balances, may look closer at the revealed comparative advantage index and utilize the advantage, the country has a vis-à-vis partner country to boost their exports. The policymakers can use this analysis to replicate other FTAs for their better utilization rate.
Footnotes
Availability of Data and Materials
The study conception and design. Material preparation, data collection and analysis were performed by Dr Monika Jain.
Ethical Approval and Consent for Publication
The author gave consent to publish. The author agrees to be accountable for all aspects of the work in ensuring that questions related to the accuracy or integrity of any part of the work are appropriately investigated and resolved.
Declaration of Conflicting Interests
The author declared no potential conflicts of interest with respect to the research, authorship and/or publication of this article.
Funding
The author received no financial support for the research, authorship and/or publication of this article.