
Abstract
The purpose of this study is to address the enduring multi-dimensional poverty faced by nearly 65 million Scheduled Tribes (STs) in India, with one prominent cause being their limited investments in productive financial assets. Financial literacy has been identified as a crucial factor in enhancing personal financial management skills. The focus is specifically on investigating the relationship between financial literacy, sociodemographic factors and stock market participation among STs in Himachal Pradesh, India. Using a structured questionnaire, data was collected from 300 ST households. The study employed multinomial logistic regression to analyze the impact of financial literacy and sociodemographic variables on stock market participation. The findings indicate that a significant majority of STs (over 80%) lack financial awareness and do not participate in the stock market. Notably, financial illiteracy, risk tolerance, age, education and income were identified as significant factors influencing SMP. The insights derived from this research offer valuable guidance for policymakers, financial institutions and educators, urging the development of targeted interventions. These interventions should empower tribal individuals to make informed financial decisions and encourage their engagement in stock market activities.
Introduction
In India, a total of 129 million people live in multidimensional poverty, and a whopping 65 million of them belong to the scheduled tribes (STs) (Vollmer & Alkire, 2022). The government of India has recognized some of these communities as ‘Particularly Vulnerable Tribal Groups’ (PVTGs) who usually live in small clusters near forest areas. Due to their geographical isolation, PVTG groups are facing challenges such as high levels of poverty, low literacy rates and limited access to agricultural technology and land (Eswarappa, 2022; Malik, 2022). Furthermore, they face social and legal discrimination, linguistic barriers and a lack of productive assets, which has made them extremely marginalized. As a result, they struggle to meet their basic consumption needs, and their vulnerability to life shocks has led them into a vicious cycle of poverty (Muniraju & Sirisha, 2023). The occupants of the remote and backward areas have to struggle more due to their limited accessibility to resources and opportunities (Datta & Sahu, 2021a). Tribal households have low and unstable incomes due to their dependence on rain-fed agriculture, which is subject to weather-related risks (Sharma & Kumar, 2023). Their limited access to formal credit further impedes their ability to invest in productive assets or start small businesses, thus affecting their participation in financial assets, that is, stocks, bonds and mutual funds (Sahu et al., 2020). These challenges contribute to a distinct wealth gap between SC/Schedule Tribe (ST) households and their non-SC/ST counterparts (Sarma et al., 2017), while income inequality remains a crucial factor in perpetuating social, racial and ethnic wealth disparities, it is uniformly essential to recognize the pivotal role of investment ownership in productive financial assets (Barsky et al., 2002; Smith, 1995). The participation of these groups in stocks and mutual funds remains comparatively low compared to other groups (Bennett & Chien, 2022). The majority of the STs population tends to have lower levels of investment in high-yielding assets compared to other demographic groups (Singh & Singh, 2023). Their lesser stock participation could potentially limit the opportunities for wealth accumulation, especially considering that the average annual stock return in India for the last 30 years is higher by more than 8% points compared to government securities (Oswal, 2022).
Therefore, understanding and rectifying these disparities in stock market participation (SMP) are critical steps towards fostering wealth equality, ensuring financial security, promoting income diversification, facilitating economic mobility and enhancing retirement savings. By delving into the dynamics of investment decisions across various demographics, we can identify opportunities for intervention and policy initiatives aimed at bridging the wealth gap (Hanna et al., 2010).
Financial literacy enables people to understand financial concepts, make informed financial decisions and manage their money effectively, when people are financially literate, they are more likely to have access to financial services, such as savings accounts, credit and insurance, and can avoid costly financial mistakes (Lusardi et al., 2011b; Mitchell & Lusardi, 2022; Singh & Singh, 2023; Van Rooij et al., 2012). Datta and Sahu (2022) advocated that financial illiteracy, poor education and dominance of local money lenders are still prevalent in backward areas. Whereas, People with higher levels of financial literacy are more likely to borrow from formal financial institutions, invest in the stock market and hold diversified portfolios (Chen & Volpe, 1998; Hassan Al-Tamimi & Anood Bin Kalli, 2009; Gaurav & Singh, 2012).
STs of hilly areas face unique issues such as inaccessibility and remoteness from mainstream society (Verma et al., 2019), and discrimination and neglect from the state, with a lack of representation in decision-making processes (Choudhury & Kumar, 2022) these issues are unique to this region, and thus, there is a knowledge gap that needs to be addressed. Despite several studies conducted worldwide on financial literacy, only a few have been exclusively focused on STs (Braunstein & Welch, 2002; Huston, 2010; Loke, 2015; Singh & Singh, 2023). Moreover, very little attention has been given to how financial literacy can improve the investment behaviour of STs. Hence, the present study makes a significant contribution to the extant literature on the SMP of tribal people. It highlights how financial literacy and socio-demographic variables significantly influence the tribal’s investment in the stock market. The study can be very useful for financial service providers and regulators in framing policies and strategies for bringing the tribes into the mainstream of society.
Review of Literature
The review is structured into four main sections, which encompass different aspects of the topic. The first section focuses on the relationship between financial literacy and SMP. The second section explores the role of demographic variables in influencing individuals’ decisions to participate in the stock market. The third and fourth sections examine the impacts of socioeconomic factors and risk tolerance on SMP.
Financial Literacy and SMP
Empirically it has been established that financial literacy is one of the significant impacts on investors’ investment decisions (Agarwala et al., 2022; Bire et al., 2019; Joseph, 2014; Singh & Singh, 2023). Financially literate investors tend to invest their funds in more lucrative investment avenues (Lusardi & Mitchell, 2014; Schoenbachler et al., 2004). The success of most investment plans depends upon the financial knowledge of the investors (Choi et al., 2010) and financial illiteracy leads to meagre financial planning (Singh & Singh, 2023; Lusardi et al., 2010, 2011, 2017; Lusardi & Mitchell, 2007, 2008, 2014; Mitchell & Lusardi, 2022). However, financially literate investors are more likely to invest in stock market-related financial assets (Lusardi & Mitchell, 2007; Van Rooij et al., 2012). Both subjective and objective financial literacy play crucial roles in influencing intention, whereas only objective financial literacy was identified as a factor affecting behaviour (Sivaramakrishnan et al., 2017). Aroni et al. (2014) provide evidence that the financial knowledge of respondents has a significant influence on their stock holding. Thomas and Spataro (2018) also found that higher financial literacy has significant effects on SMP. People with a higher level of financial literacy tend to allocate at least some part of their savings to mutual funds and have a higher chance of getting a positive financial return (Chu et al., 2017). Financially literate individuals are more likely to engage in positive financial behaviours (Datta & Sahu, 2021b). More literate households take higher risks when expected returns are higher, as a result of which they get a 0.4% higher return in comparison to the least literate (Bianchi, 2017). Millions of rural households in the developing world face challenges in making well-informed financial decisions due to a lack of comprehension of financial products and an inability to effectively process financial information. Millions of rural households in the developing world face challenges in making well-informed financial decisions due to a lack of comprehension of financial products and an inability to effectively process financial information (Gaurav & Singh, 2012). Therefore, based on the above discussion the following hypothesis has been proposed;
H1: Financial literacy has a significant impact on stock market participation of scheduled tribes.
Demographic Variables and SMP
The relationship between the demographic profile of the investors such as age, gender and family size, and the SMP has been tested and studies such as (Ameriks et al., 2004; Goyal & Kumar, 2021; Mohammed Kamil et al., 2018; Morgan & Long, 2020), did not provide any significant evidence. However, Brooks et al. (2018) and Charles and Kasilingam (2013) advocated that as individuals age and take on more family responsibilities, their investment strategy evolves to prioritize prudent risk management for optimal returns. This change involves a steady reduction in high-risk equity investments, emphasizing the protection of accumulated wealth. Therefore, age is a significant factor in the investment choices of an investor and young investors are more likely to invest in the stock market than the elder (Alan et al., 2006; Bogan, 2008; Charles & Kasilingam, 2013; Mittal & Vyas, 2008). Besides this, the family size of the investor has a negative impact on equity investment (Gani & Adeoti, 2011; Niu et al., 2020). It can be reasoned that investors in large family sizes have liquidity constraints perhaps due to few income earners. Large families focus more on arranging resources to cater to the basic requirements of the family rather than investing in risky assets (Muktadir-Al-Mukit, 2022). Whereas in single households, the investor is more risk-tolerant attributable to the benefit of better savings and lesser responsibility (Mazzocco, 2004). Based on these observations, the study tried to test the relationship between demographic profile and investment behaviour and proposed the following hypothesis:
H2: The age of respondents has a significant impact on the stock market participation of scheduled tribes. H3: The family size of the investor has a significant impact on the stock market participation of scheduled tribes.
Socio-economic Factors and SMP
Socio-economic factors such as level of education, income, accessibility and type of family, can also have certain implications on one’s choice of investment alternative. Many studies conducted so far have tried to understand this relationship. The education level of the investors plays a significant and positive role in SMP and all the studies have consensus on it (Abideen et al., 2023; Gaurav & Singh, 2012; Goyal & Kumar, 2021; Morgan & Long, 2020; Vaarmets et al., 2019). All support the notion that the higher the levels of education better the chances of investment in market-related products.
Regarding income, several studies have found a positive and significant association with investment behaviour. SBI-NCAER (2000) surveyed Indian households in 2000 and revealed that higher-income groups tend to have a higher share of investments in mutual funds. Bogan (2008), Gao et al. (2019) and Geetha and Ramesh (2012) also found a positive significant relationship between income and investment behaviour among respondents. Access to the Internet also has a significant impact on stock participation (Fernández-López, Rey-Ares, & Vivel-Búa, 2018; Liang & Guo, 2015; Wang et al., 2023). Additionally, Choi et al. (2010) and Liang and Guo (2015) have observed that individuals who trade through online channels experience a remarkable 50% increase in trading activity. In India, the joint family system has been observed to exert a significant influence on investment decisions, as highlighted by Agarwalla et al. (2015), Singh and Bhandari (2012) and Singh and Singh (2023). Building upon this discussion, the following hypotheses have been formulated:
H4: Income significantly affects stock market participation. H5: Educational attainment has a significant impact on stock market participation. H6: Internet access significantly impacts stock market participation. H7: Family size has a significant impact on stock market participation.
Financial Risk Tolerance and SMP
Financial risk tolerance is an individual’s willingness and capacity to endure investment value fluctuations and potential losses for higher returns. It impacts their investment decisions based on financial goals, time horizon, income and attitude towards risk. People vary in risk tolerance, with some being conservative, seeking stability and others being aggressive, pursuing higher rewards (Barber & Odean, 2001; Grable, 2017).
According to the discussion by Bianchi (2017), Hong et al. (2004), Mishra (2018) and Nur Aini and Lutfi (2019) risk-averse individuals are generally less inclined to invest in equities and tend to have lower chances of holding stocks. Conversely, those with higher risk tolerance are more likely to invest in high-risk, potentially higher-return assets (Grable, 2008; Snelbecker et al., 1990; Thanki & Baser, 2021). Therefore, the study formulates the following hypothesis:
H8: Financial Risk tolerance levels significantly impact stock market participation.
Research Methodology
The study is based on an exploratory research design and empirical. The primary data has been collected from the 300 ST households living in hilly areas of Himachal Pradesh, India, through a well-structured questionnaire. The questionnaire was developed based on empirical works (Akpene Akakpo et al., 2022; Atkinson & Messy, 2012; Grable & Lytton 2003; Singh & Singh, 2023; Van Rooij et al., 2011). The instrument was designed to capture the level of financial literacy, risk tolerance and SMP of the respondents. The validity and reliability of the questionnaire were tested before its finalization. To assess the reliability of the tool, Cronbach’s alpha coefficient was employed for the 12-item financial risk tolerance part, the only part of the instrument on a ratio scale. The analysis discovered a satisfactory alpha coefficient of 0.739. Furthermore, since the instrument’s section on saving and investment behaviour was designed on a categorical scale, the reliability of this component was measured using the Kuder–Richardson Formula 20. The obtained values fell within an acceptable range of above 0.8, indicating strong internal consistency among the items. For the validation process, appropriate modifications were made to the instrument based on insights derived from the pilot study and the suggestion of the expert. Participant responses and expert suggestions. The current study employed a multistage sampling technique due to geographical and resource constraints, focusing on ST Households in Himachal Pradesh. The multistage sampling process involved selecting two districts, Kangra and Chamba followed by the selection of two blocks from each district based on the highest ST population. Additionally, five villages with the highest number of ST households were chosen from each block, and households were randomly selected from each village. The final sample size, calculated using Solvin’s formula, comprised 300 ST households, with 180 respondents from Chamba and 120 from Kangra, reflecting the respective population proportions. A total of 360 households were contacted initially but only 300 agreed to respond that the head or the key person (who usually takes the family decision) of the family was the respondent for the study.
Analysis of Data
Given the categorical nature of the dependent variable, adopting a twofold analytical strategy, which incorporates both chi-square tests and multinomial logistic regression, facilitates a more comprehensive exploration of the relationships between variables. The chi-square test, as outlined by Agresti (2012) and Everitt and Skrondal (2010), serves as an initial exploration, allowing for the identification of significant associations between the dependent variable and individual independent variables. However, its limitations in providing detailed insights into the strength and direction of relationships and its inability to handle multiple variables simultaneously necessitate the application of multinomial logistic regression. As advocated by Long and Freese (2014) and Menard (2002), multinomial logistic regression enables a more sophisticated analysis by considering multiple independent variables simultaneously. This approach not only extends the analysis beyond bivariate associations but also allows for controlling the effects of confounding variables. The integration of both methods enhances the analytical rigour, providing a nuanced understanding of the intricate relationships within categorical dependent variables (Allison, 2002; Heinze & Schemper, 2002).
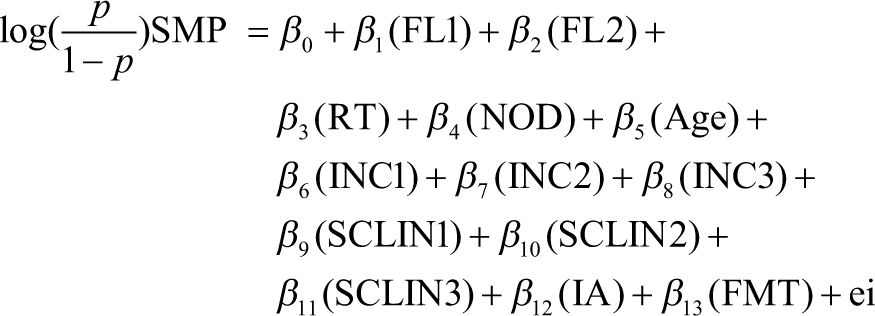
The given equation represents a multinomial logistic regression model where the dependent variable, SMP, the model makes a comparison between respondents who invest in the stock market with those who do not invest. The dependent variable SMP is modelled using a logarithmic transformation of the odds ratio (p/(1 – p)), where p represents the probability of investing in the stock market.
The coefficients β0, β1, β2, …, β13 are associated with each independent variable in the model. These beta coefficients measure the probable change in the dependent variable for a unit change in the related independent variable, while all other variables are held constant.
The independent variables, FL1 and FL2), stand for financial literacy. RT represents risk tolerance, NOD represents the number of dependents, Age represents the age of the individual, INC1, INC2 and INC3 represent different income levels, SCLIN1, SCLIN2 and SCLIN3 represent the number of years of schooling, IA represents Internet accessibility, and FMT represents a family type. The term e in the model stands for the error term or residual.
Result and Discussion
Financial Literacy of the ST
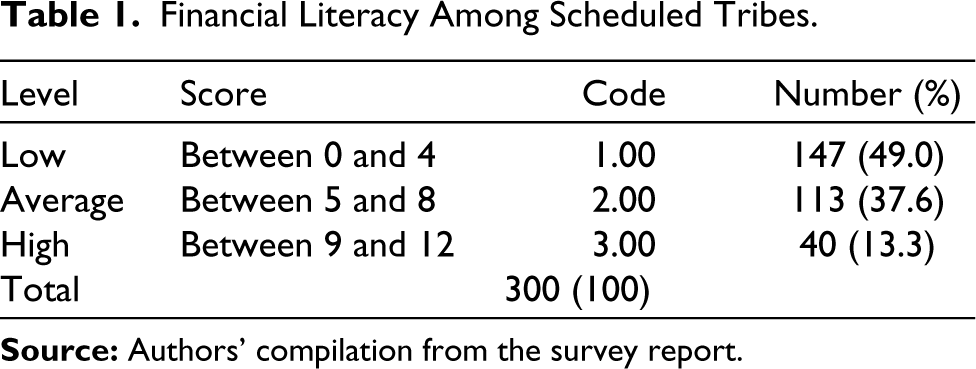
The initial section of this study focuses on evaluating the level of financial literacy among STs. The financial literacy of the respondents has been measured based on 16 statements given by Atkinson and Messy (2012). Based on the responses from the select households, the respondents have been classified into three categories: low level (those who correctly answered four or fewer than four), average level (those who correctly answered five or more but less than eight) and high level (those who correctly answered more than eight questions). It has been observed from the summarized results of the financial literacy level of the respondents (Table 1) that the financial literacy among these households is very low, as almost 50% of respondents could not answer more than four questions correctly. Overall, 37% can answer up to eight questions correctly. Only 40 respondents (13%) out of 300 households have scored above 8 and fall into the category of high-level financial literacy. Based on these results, it has been concluded that the majority of the STs are not financially well-aware, as almost 90% of the sample respondents have average or below-average financial literacy levels. These results support the empirical studies (Agarwal et al., 2015) who have also observed that the level of financial literacy is very low among marginalized people.
Financial Literacy Among Scheduled Tribes.
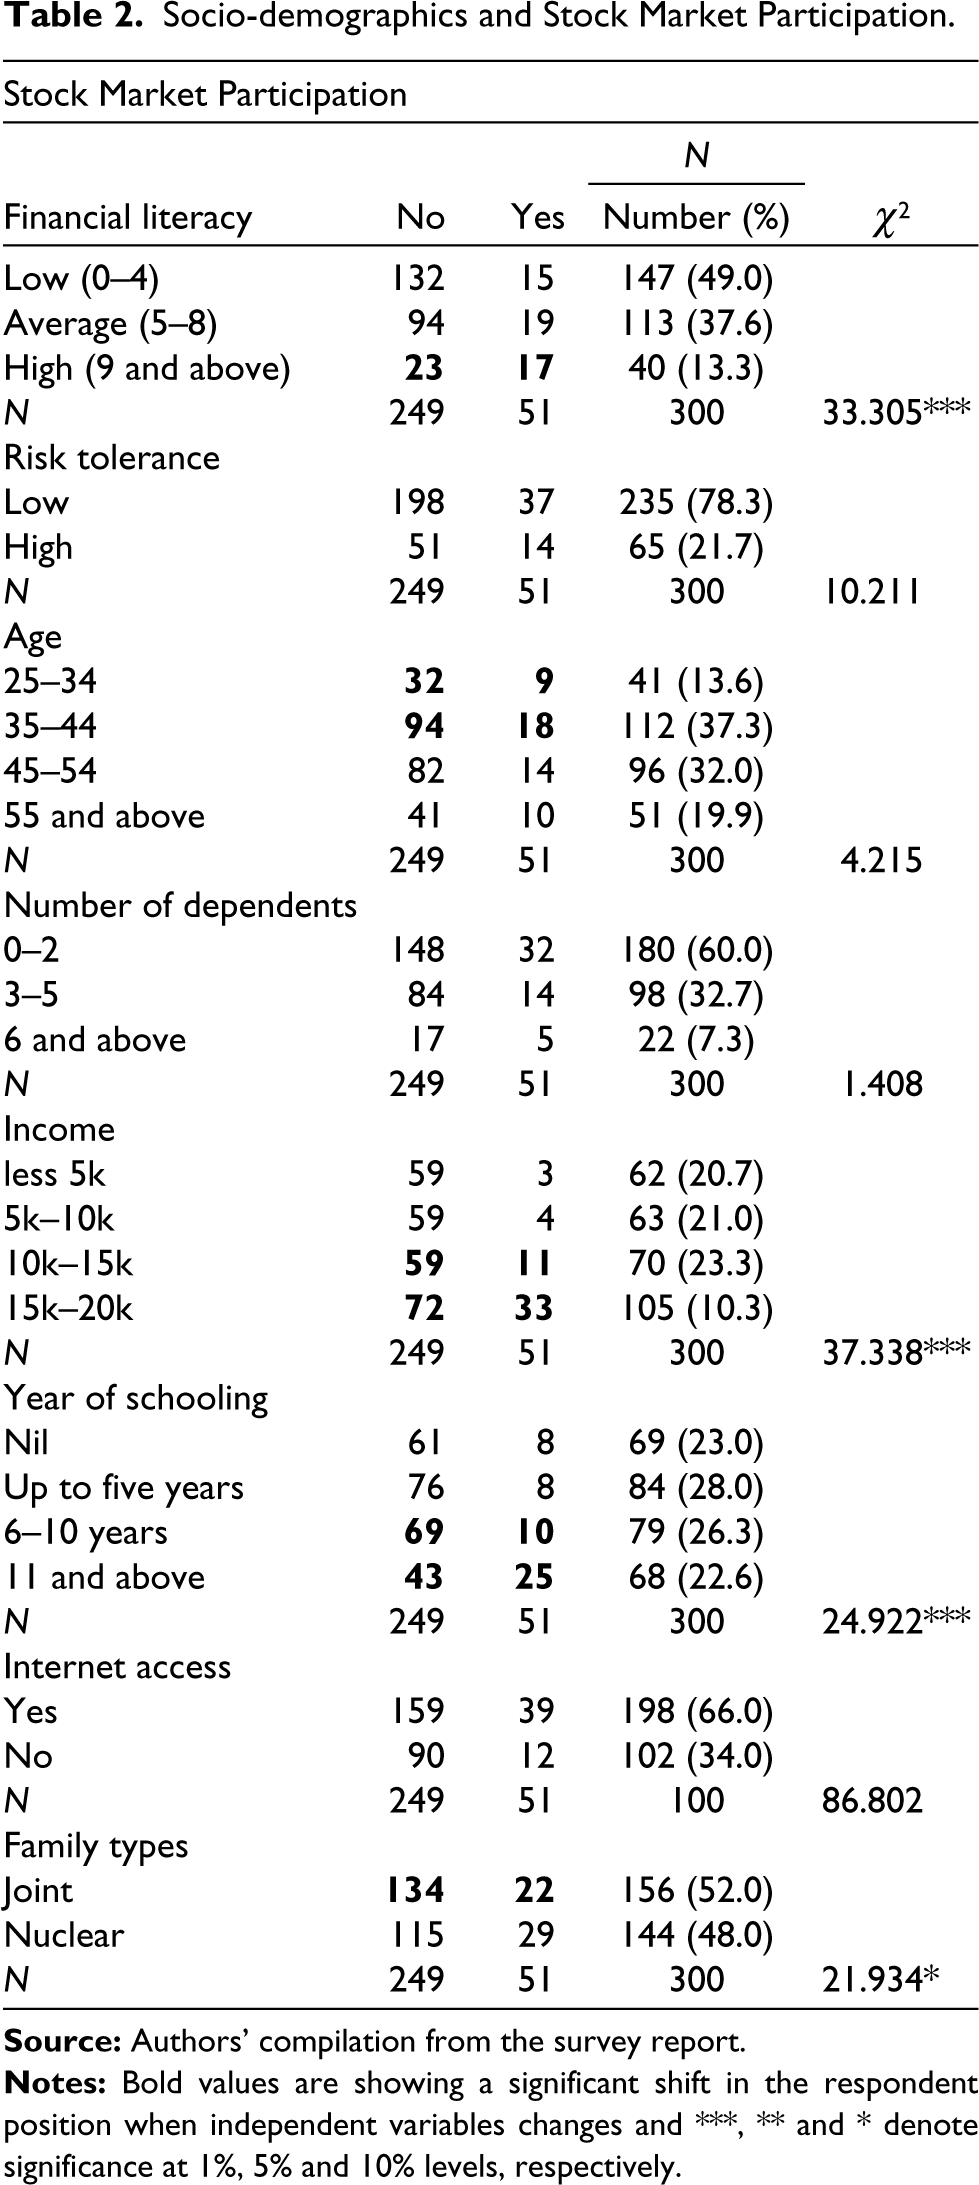
Socio-demographics and Stock Market Participation.
It was also noticed that financial literacy differs depending on socio-economic factors, as the younger population is more literate than the older. Similarly, income, education, risk tolerance and access to the Internet and social media are positively associated with financial literacy.
Stock Market Participation
To assess SMP, respondents’ investment profiles were classified into three categories: low-risk assets, such as bank deposits, post office deposits and Kisan Vikas Patra; moderate-risk assets, including debentures, systematic investment plans (SIP) and mutual funds; and high-risk assets, represented by direct equity holdings in firms. In the final stage, respondents holding stocks directly or indirectly through SIP, mutual funds, equity and options were considered as the investors who participated in the stock market (Akpene Akakpo et al., 2022; Van Rooij et al., 2011).
The SMP of the selected sample is very low (Table 2), as only 51 respondents (approximately 17%) out of 300 have invested their funds in the stock market, and the majority of them have followed a conservative investment approach, favouring low and moderate-risk assets over higher-risk equity investments (Bucciol et al., 2019). Although the results are slightly better than the Indian SMP rate reported in 2019 (Bhargava, 2020), this level of SMP is still very low compared to developed countries, such as the USA, where the participation rate is 45% (Bhargava, 2020). Previous research extensively explored factors impacting individuals’ stock holdings, highlighting financial literacy, risk tolerance and socio-demographic variables like age, gender, income, education, dependents, Internet access and family structure. Building on this, the next section investigates how these variables influence SMP specifically among STs.
Socio-economic Factors and SMP
The study examines the relationship between different socioeconomic factors and SMP, through the chi-square test (Table 2) and the impact of these factors on their SMP (Table 3).
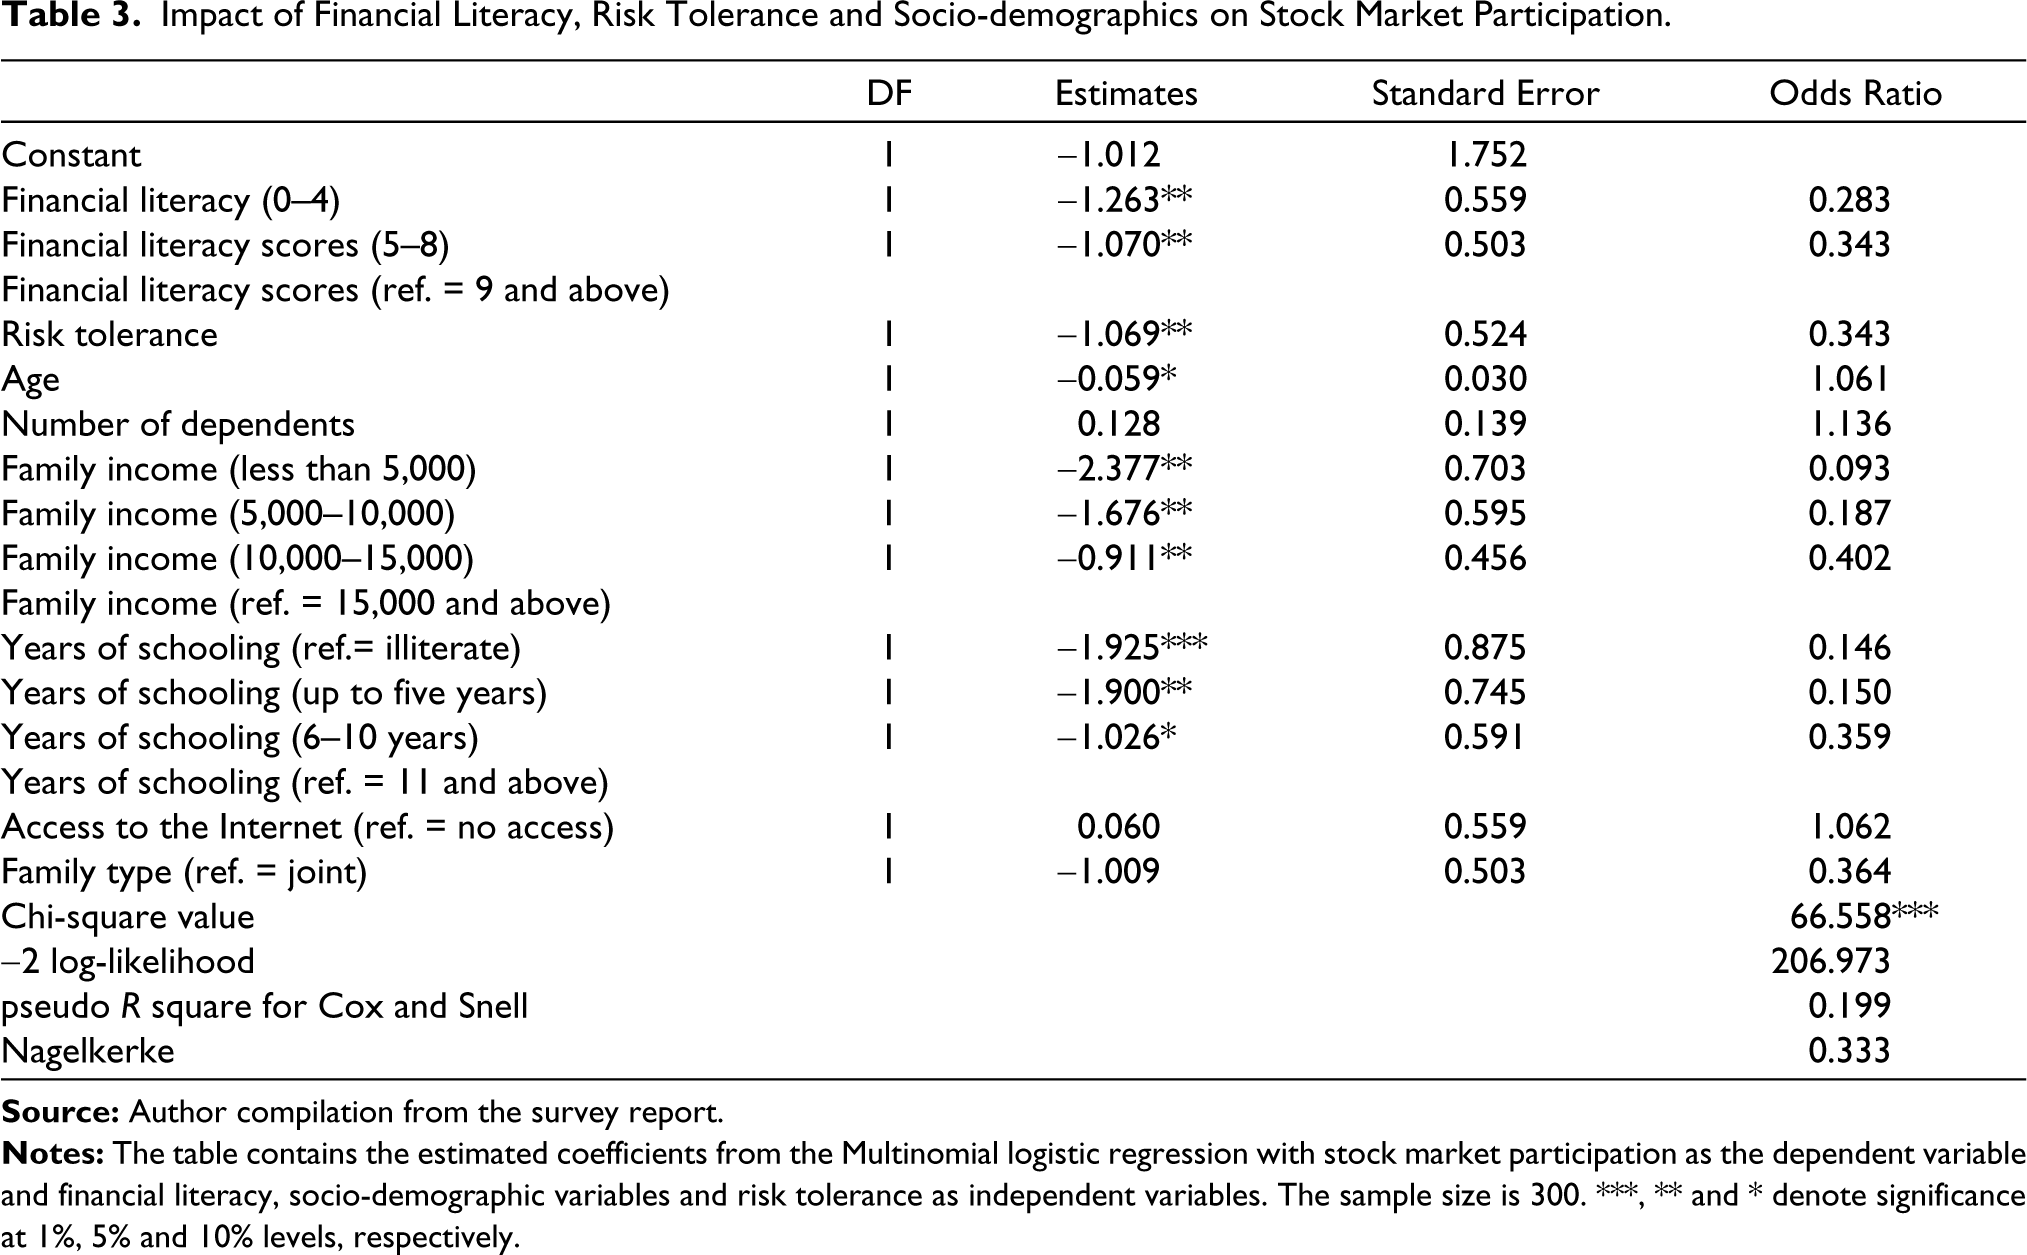
Impact of Financial Literacy, Risk Tolerance and Socio-demographics on Stock Market Participation.
Financial Literacy and SMP
The study observed a significant difference in the SMP rate among respondents with different levels of financial literacy. Respondents with high financial literacy scores have a greater likelihood of participating in stock market activities, while those with low financial literacy significantly decrease the likelihood of investing in stocks. Respondents with low and moderate financial literacy have 28% and 34% lower chances of investment through the stock market, respectively, compared to respondents who are highly financially literate. Empirical works also support this argument (Nyakurukwa & Seetharam, 2022; Soekarno & Pranoto, 2020, Yamori & Ueyama, 2022) and conclude that an increase in financial literacy will also increase the odds of SMP. Thus, financial awareness is an important factor that may dispel misconceptions about the market and attract investors to the stock market.
Risk Tolerance and SMP
This study observed that, although respondents with high-risk tolerance have shown more interest in market-related products, there is an insignificant difference in SMP among investors with different levels of risk tolerance (chi-square = 10.211). However, the test results of the logistic regression model provided evidence of the significant effect of the risk tolerance level on investors’ stockholdings. Individuals with low-risk tolerance are 34% less likely to participate in stocks compared to those with a high tolerance for risk. Similar observations have been found in previous studies (Bianchi, 2017; Hong et al., 2004; Mishra, 2018; Nur Aini & Lutfi, 2019) and conclude that risk averseness has a negative impact on SMP. Market friction or asymmetric information is a common fear factor among investors that can be offset by creating more awareness about the benefits of market-related investment. Thus, it is necessary to make tribal people familiar with stock market operations and investment strategies so that their self-confidence can be enhanced, and consequently, they can become active investors in the stock market.
Age and SMP
The age of the respondents appears to be an insignificant factor, as the study did not observe any significant differences in stock market investment across different age groups. This observation is supported by existing studies (Alan et al., 2006; Bogan, 2008; Charles & Kasilingam, 2013; Mittal & Vyas, 2008). However, when applying regression analysis, the study found some evidence (at a 10% level of significance only) that increasing age has a negative impact on SMP. With an odds ratio of 1.061, there is a lesser possibility of older people’s participation in the stock market compared to young investors. This may be due to a lack of awareness about the stock market among older individuals (Fong et al., 2021). Additionally, they may restrain themselves from risky investments in the later stages of their lives and prefer avenues that offer fixed returns over equities. Nonetheless, providing customized financial education about mutual funds or securities offering regular but higher returns than traditional fixed deposits for older people can help attract them to the market.
Number of Dependents and SMP
The present study did not find any significant difference in stock market investment among individuals based on their number of dependents. Neither the chi-square test nor the regression model provided evidence of a valid association between the number of dependent and SMP.
Income and SMP
The study found strong evidence of the impact of income on SMP, indicating that respondents with higher incomes have more chances to participate. A significant difference has been noticed in market participation among respondents in different income groups (χ2 = 37.338***). The logistic regression results also support this argument, showing a significant decrease in the market participation rate among respondents in lower-income groups. Even respondents with a monthly income between 10 and 15,000 have 40% lower odds of investing in the stock market compared to those with a monthly income above 15,000. Our results also have empirical evidence that supports this argument, finding income as an important factor, and indicating that investors with higher incomes are more prone to market investment (Bogan, 2008; Gao et al., 2019; Geetha & Ramesh, 2012).
Education and SMP
The level of education of the respondents has been identified as an important determinant of SMP, as the study observed a significant difference (χ2 = 24.922***) in SMP behaviour among respondents belonging to different levels of education. The higher the level of education, the better the market participation, with only 11.6% of individuals without any formal education investing in the stock market, while this percentage significantly increases to 36% for individuals with 11 or more years of education. The regression outcomes further validate this observation, revealing a noteworthy decrease in the probability of engaging in the stock market by 14.6% for individuals with no education and by 15.0% for respondents with up to five years of education, in comparison to those with 11 or more years of formal education.
The findings indicate the need to focus primarily on the education sector in tribal areas, as education is a prerequisite for economic and social development (Dong et al., 2023, Nyakurukwa & Seetharam, 2022; Raut, 2020). Therefore, a considerable proportion of government spending should be allocated to the education of tribes, providing quality and free education to them. Subsequently, this will improve their chances to invest their funds in the market.
Family Structure and SMP
The results highlight a significant contrast in SMP rates between respondents in joint and nuclear families (χ2 = 21.934*). Surprisingly, nearly 86% of those living in joint family systems choose not to invest in stocks, aligning with prior research by Agarwal et al. (2015). Additionally, the regression model consistently shows that individuals within joint families are 36% less likely to take part in the stock market, although this difference isn’t statistically significant compared to those in non-joint family arrangements. These findings emphasize the need for a specialized financial education program tailored to tribal communities living in joint family setups.
Internet Access and SMP
The advent of mobile banking and Internet access has simplified and democratized information availability, driving greater involvement in the stock market. These tools swiftly grant access to financial data and market trends, a privilege once challenging for the general public to access (Thulani et al., 2014; Van Rooij et al., 2011).
Respondents with access to Internet facilities are more participative in the market than those who don’t. There is a significant link that significantly increases the likelihood of individuals including stocks in their financial portfolio (Choi et al., 2010; Liang & Guo, 2015). Consistent with these findings, we also examined the impact of Internet access as an independent variable in our study. Our analysis using the chi-square test revealed an insignificant increase in SMP among individuals with Internet access. Specifically, only 11.7% of individuals without Internet access participated in the stock market, while this percentage rose to 19.7% for those with Internet access. However, when we regressed this variable with other variables in our model, it did not show any significant association. This suggests that while Internet access may have a notable impact on SMP when analysed independently, its significance diminishes when considering other factors. Considering the results, Internet accessibility needs substantial improvement in tribal areas.
Conclusion
Sound financial decision-making is desirable at each phase of life, particularly in an advanced and dynamic financial system. Therefore, having an adequate level of financial awareness becomes inevitable to comprehend this new financial environment, comprising complex financial products. Many investors hesitate to invest in stock markets due to ignorance or unawareness about the benefits of market investment. SMP differs depending on financial literacy status, risk tolerance level and socio-demographic characteristics. The present study aims to assess the relationship between financial literacy, socio-demographic factors, and the SMP of tribal people. The study used a sample of 300 respondents residing in the hilly areas of Himachal Pradesh.
The results revealed that as the level of financial literacy increased among the respondents, the likelihood of their participation in the stock market also increased. Financial literacy significantly heightened the odds of investment in the stock market by tribes. Another significant factor contributing to lower market participation was the low risk-tolerance level of tribal investors. Asymmetric information is a common fear factor among investors that can be offset by creating more awareness about the benefits of market-related investment. Thus, it is necessary to make tribal people familiar with stock market operations and investment strategies so that their self-confidence can be enhanced, and consequently, they can become active investors in the stock market.
Similarly, among the socio-demographic variables, education and income showed a significant positive correlation with stock market investment. However, age demonstrated a negative association with SMP, indicating that market participation among younger respondents was higher compared to those in their old age. Family structure, the number of dependents, and Internet accessibility had an insignificant impact on SMP.
It is confirmed that financial literacy plays a crucial role in attracting more investors to stock market activities. However, the level of financial literacy among STs in India is notably low, resulting in reduced participation in stock market instruments. Therefore, it is imperative to enhance financial awareness among STs in general and, more specifically, regarding the stock market.
Implications and Recommendations
For practical implications, government bodies must understand the importance of financial literacy in empowering the STs by inculcating better financial decision-making skills among them and improving their participation in the stock market. Considering the empirical findings of this study, it can be realized that customized financial literacy programs, ranging from basic to advanced, for tribal people living in hilly areas, should be designed by government bodies at various levels. Banks, financial institutions, and regulators (SEBI) should organize stock market awareness programs specifically for tribal people, taking into consideration their living style, behaviour and language.
Apart from this, the degree of participation in the stock market varies according to education, age, income and risk tolerance. To be more effective, government interventions should be introduced targeting specific groups among tribes. Education reduces aversion to investment in stocks and facilitates good financial decisions, so focus should also be given to providing quality and free education in tribal areas of hills.
Limitations
Papers on this theme in the context of tribal communities are limited, making interstate or intercountry comparisons of the findings challenging. The present study focused on tribes from only one state, thus restricting the validity of the results. To enhance the robustness of the research, future studies could encompass tribes from other states with significant ST populations. Moreover, it is crucial to consider that risk attitudes and SMP of investors may undergo changes based on various factors, including economic, political and geographic conditions of the region Additionally, incorporating qualitative analyses, such as case studies and observations, can enhance our understanding and provide deeper insights into the dynamic nature of these changes.
Footnotes
Declaration of Conflicting Interests
The authors declared no potential conflicts of interest with respect to the research, authorship and/or publication of this article.
Funding
The authors received no financial support for the research, authorship and/or publication of this article.