
Abstract
This study aims to examine the association between green banking practices and the operational efficiency of banks. Green banking practices are measured through the green banking index, which is prepared by applying the content analysis technique. To measure the operational efficiency of banks, the two-stage network data envelopment analysis model is applied. Data are taken for 22 Indian banks for a period of 5 years ranging from 2021 to 2025. To achieve the objective of this study, panel data models and two-step system GMM are applied. The empirical findings of this study reveal that green banking practices positively influence banks’ operational efficiency. Green finance, green operations, green policy and green awareness are the subindices, and all these also positively affect the operational efficiency of banks. Based on the results, recommendations are provided to policymakers, bank managers and regulatory authorities. Green banking practices can facilitate sustainable development by ensuring the direction of funds towards eco-friendly projects.
Introduction
Increasing human population affects the surrounding ecosystem because the increase in population is associated with increased productive activities, such as industrialization, automobile use and construction sites (Bukhari et al., 2020). The banking sector is crucial to the development and growth of the economy as it channels funds for productive activities, making them accountable for adverse climate conditions. Although banks use fewer resources than other industries, they still have some direct and indirect negative impacts on the environment. Almost every large bank has numerous branches and ATMs, which consume a lot of energy; however, the direct impact is much less compared to the indirect impact, that is, the impact through their financing activities, called bank-financed emission (WRI & WBCSD, 2011). To tackle the menace of climate change, the banking sector has transformed to embrace a new environmentally friendly practice of green banking. Green banking practice ensures sustainable development by reducing ecological damage and promoting carbon-conscious activities to safeguard the planet (Gazi et al., 2025). Green banking practices build a sense of responsibility towards the environment among banks’ clients. Several central banks have adopted policies relating to green finance and practices, including the incorporation of climate risk into their operational and financial activities (Dikau & Volz, 2021). This awareness among banks resulted in the launch of initiatives such as NGFS (Central Banks Networks for Greening the Financial System), which specifies that central banks cannot ignore climate change (NGFS, 2019). India is also taking a step forward for climate mitigation through facilitating green finance. For this, the Reserve Bank of India (RBI) issued a green finance framework, that is, ‘Framework for acceptance of green deposit’, in 2023 (RBI, 2023), which provides regulatory guidelines for commercial banks on acceptance of green deposits and the priority sectors where they can invest these deposits. Green practices not only protect the quality of the environment but also affect the performance of the banking sector positively (Aslam & Jawaid, 2023; Gulzar et al., 2024; Hossain et al., 2020).
Green banking is at a nascent stage in emerging economies (Kumar et al., 2024). However, the interest in green banking is tremendously increasing. Despite a sizeable literature on banking operational efficiency, empirical studies on the association of green banking practices and operational efficiency are scarce for emerging economies like India. This study seeks to evaluate the impact of green banking practices on the operational efficiency of Indian banks. To achieve this objective, the data envelopment analysis (DEA) technique is used to measure the operational efficiency score for the period from 2021 to 2025. To measure the explanatory variable of this study (green banking practices), an index is prepared based on dichotomous scoring. Panel data models are applied to examine the relationship between variables. Further, for testing the endogeneity concern, a two-step system GMM is applied. The findings suggest that green banking positively affects the operational efficiency of banks by reducing their operational costs, enhancing energy efficiency and reducing the credit risk.
The remaining article is structured into four sections. The second section describes the literature review part. The third section highlights the methodology (preparation of green banking index, selection of input–output variables for measuring operational efficiency and model specification) and data-related information. The fourth section provides results and discussion, the fifth section consists of conclusions of this study and, finally, the sixth section includes implications and limitations of the study.
Literature Review
Green Banking Practices
Climate conditions are worsening day by day, which requires special attention and collective efforts worldwide. The banking sector is one of the responsible sectors towards environmental degradation because of its financing support. Nowadays, the banking sector is becoming attentive towards ecological safeguards and adopting green banking practices in its operations. Green banking is a practice in which banks conduct their operational activities in a way to reduce their carbon footprint and motivate their clients to adopt sustainable behaviour. Green banking practices are innovative methods that lead to energy efficiency, emission reduction, operational efficiency increment, operational cost reduction and image building (Thapliyal et al., 2025). Several studies measure green banking practices in India and abroad. Some of these are based on primary data (Sharma & Choubey, 2022; Tyagi et al., 2024), and some prepare an index to measure it by compiling data from annual reports (Bose et al., 2021). Green banking practices help in reducing the negative environmental impact of various business activities, as banks provide green finance to enterprises that can be used only for eco-friendly practices. Existing literature supports the fact that green finance can help in attaining sustainable development goals. Green finance promotes energy efficiency and reduces carbon emissions, thus enhancing green total factor productivity (Li et al., 2023). Li et al. (2017) highlight the importance of green initiatives in the improvement of the green performance of enterprises in the United States. Further, Xu et al. (2020) also point out that green finance is positively associated with the green performance of enterprises; however, this association can vary in the context of the type and region of enterprises. Similar evidence is also found in Sub-Saharan Africa by Bonsu et al. (2025) that green finance and fintech enhance the sustainability performance of banks. Hasan et al. (2025) found that green finance and CSR have a positive impact on the performance of banks in Bangladesh.
Operational Efficiency
It is pertinent to the banking sector to assess the outcome of its operational activities. This outcome provides information to various stakeholders about their performance. A well-established measure for bank performance is operational efficiency. Operational efficiency implies the ability of firms to minimize their costs or maximize their outputs by using limited resources in their operations (Wang et al., 2025). Existing studies have applied different approaches to measure the operational efficiency of financial and non-financial firms. Some studies use a ratio approach, where operational efficiency is measured through the ratio of operating expenses to net interest income (Elmahdy et al., 2025; Khan & Shireen, 2020). However, in the recent literature, DEA is mostly used to measure the operational efficiency of Vietnamese banks (Anh, 2025), the banking sector of Iran (Mahmoudabadi & Emrouznejad, 2019), banks of West Balkan countries (Milenković et al., 2022), Chinese banks (An et al., 2015) and Japanese banks (Fukuyama & Weber, 2015). Similarly, the operational efficiency of Indian banks is measured by several researchers through applying the DEA. Hafsal et al. (2020) calculated operational efficiency by using a two-stage network DEA technique and made an efficiency profile of Indian banks. Dar et al. (2021) measured the technical efficiency of public and private banks of India by applying DEA and SFA analysis. Further, Kumar and Kar (2023) applied a two-stage network DEA to measure the efficiency of Indian banks. Kumar and Gulati (2009) investigated the extent of divergence and convergence levels of efficiency among public banks during the post-reform time; for this purpose, efficiency scores are calculated by using the DEA technique. Gulati and Kumar (2017) evaluated the overall efficiency and segregated it into intermediation and operational efficiency in the context of Indian banks by using a two-stage network DEA.
GBP and Operational Efficiency
Green banking is crucial to improve the operational and environmental performance of firms as it reduces the carbon footprints of banks as well as their clients. Bukhari et al. (2022) reported the view of bank managers, which specifies that green banking enhances the operational efficiency of banks. Aslam and Jawaid (2023) found that green banking adoption positively influences banks’ performance, including operational efficiency. Jain and Sharma (2023) investigated the influence of green practices on the profitability and environmental outcome of banks and concluded that green banking practices improve banks’ financing towards green projects, improve operational efficiency and enhance profitability and ecological performance of Indian private sector banks. Al-Qudah et al. (2023) examined how green lending affects the credit risk of banks in the UAE and found that green lending reduces the credit risk of banks. Green banking practices improve sustainability performance, and green finance influences the association of green banking and banks’ performance (Kumar et al., 2024). It was found through a thorough literature review that the linkage between green banking practices and operational efficiency is less discussed, thus seeking the attention of researchers. A lot of studies evaluate the impact of green banking on financial performance (Azzahra et al., n.d.; Bressan, 2024; Hossain et al., 2020; Li et al., 2017) and environmental performance (Aslam & Jawaid, 2023; Gulzar et al., 2024) of banks. However, only a few studies examine the linkage between green banking and the operational efficiency of banks (Aslam & Jawaid, 2023). Hence, there is a need to study the association between green banking and OE (operational efficiency) in emerging economies like India. Wang et al. (2025) investigated the impact of ESG (environment, social and governance) on the OE of firms by computing the efficiency scores through DEA and found that ESG promotes firms’ OE more effectively in non-manufacturing and privately owned firms as compared to others. Nasim et al. (2023) measured the investment and OE of 48 banks from seven emerging economies by using DEA and investigated the impact of energy shocks on banks’ efficiencies. Saroy et al. (2023) calculated the OE score through the DEA technique and examined the linkage between digital payment technologies and OE of Indian banks. The authors found that digital payment technologies enhance the OE of Indian banks.
Methodology
This study aims to examine the impact of green banking practices on the OE of Indian banks. For this purpose, a sample of 22 banks is taken, which is selected from top 500 Bombay stock exchange-listed corporations. Data are extracted from annual reports and prowess databases for the period 2021–2025. The reason behind the selection of this period is to get the latest data set and the important guidelines/actions of regulatory authorities. For example, the RBI joined the Network for Greening of Financial Systems in 2021, a group of central banks of various countries to ensure a greener/sustainable financial system. In addition, the Ministry of Finance announced the formation of a task force on sustainable finance in 2021, and Securities and Exchange Board of India issued new ‘Business Responsibility and Sustainability Reporting’ guidelines in 2021. The RBI issued the ‘Framework for Acceptance of Green Deposit’ for banks in 2023 (RBI, 2023). Figure 1 describes the conceptual model of this study.
Conceptual Framework.
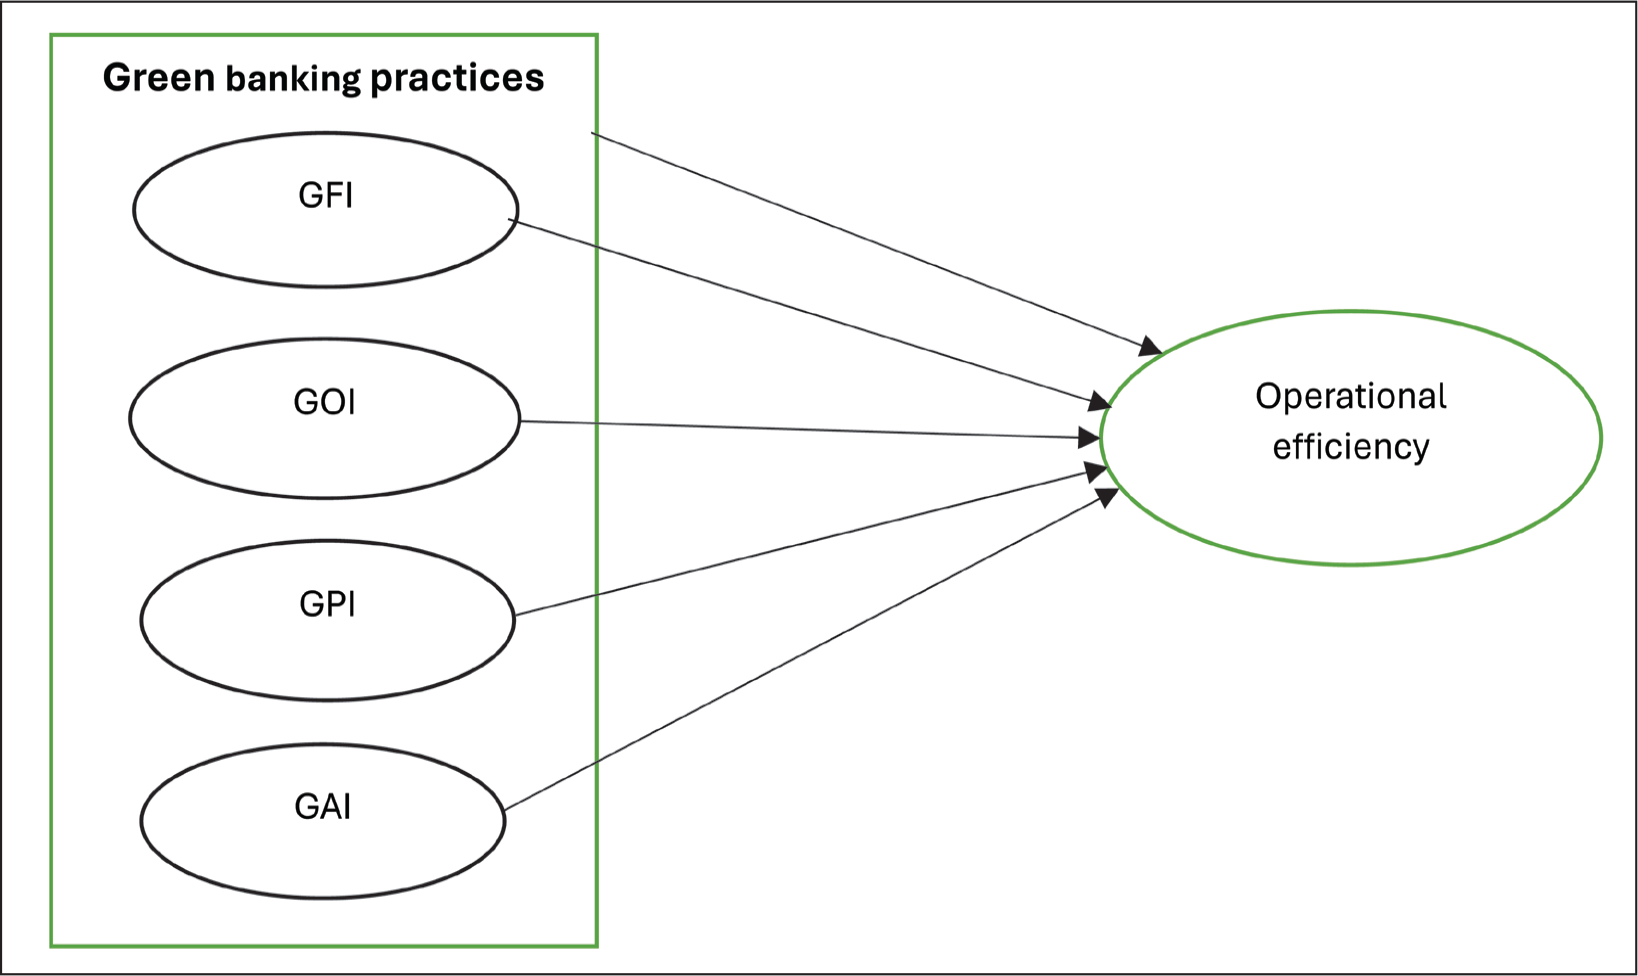
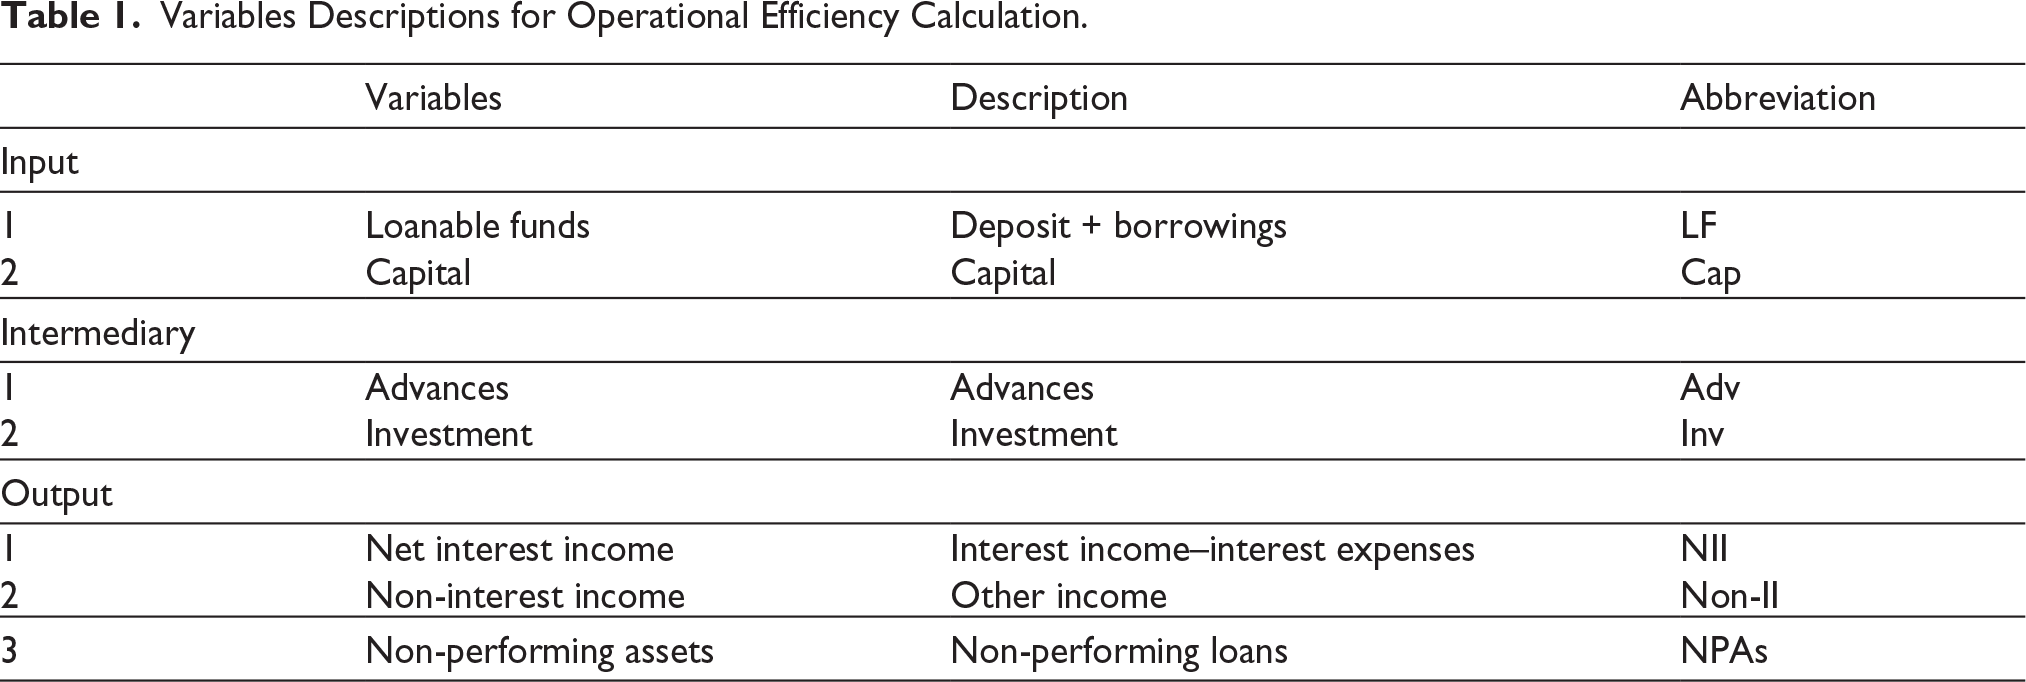
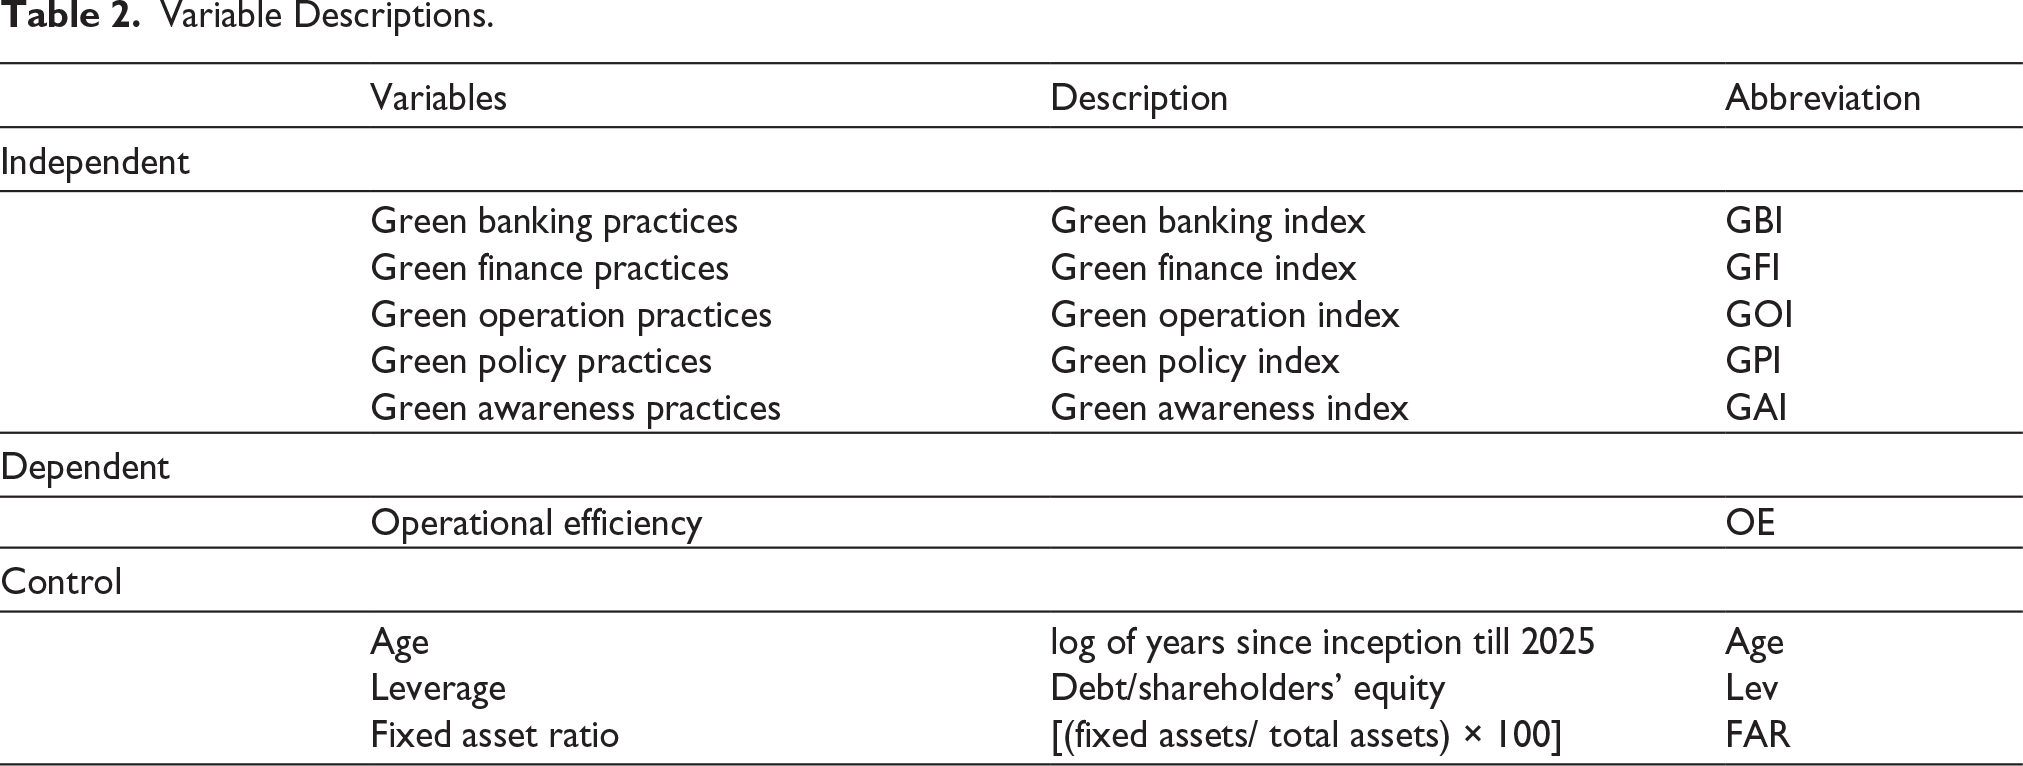
Tables 1 and 2 contain variable descriptions. Table 1 describes input and output variables used for DEA test to measure OE. Table 2 describes the independent, dependent and control variables used for regression analysis. Independent variables are green banking practices (GBI) and their subindices (green finance, green operation, green policy, green awareness). Whereas OE is considered as a dependent variable, age, leverage and fixed asset ratio are taken as control variables (Cheng et al., 2018; Li et al., 2025). Panel data models and GMM techniques are used to analyse the association between variables.
Variables Descriptions for Operational Efficiency Calculation.
Variable Descriptions.
Preparation of Green Banking Index
To measure the value of explanatory variables (green banking practices), an index is prepared by following Srivastava et al. (2019). Dichotomous scoring is used to quantify the content given in reports. If the information is disclosed in the annual report or business responsibility and sustainability report, a value of 1 is assigned, and if no disclosure is found in the reports, a value of 0 is given. The green banking index is based on four subindices, which contain 27 indicators; the value of each sub-index is measured by taking a proportion of the obtained value to the maximum attainable value. Then, the final index is prepared by taking the meaning of sub-index scores. The index value lies between 0 and 1, which is used for analysis purposes.
Computation of Operational Efficiency Score
DEA, a non-parametric quantitative technique, is widely used for efficiency measurement in several fields (Liu & Sun, 2022). Some conditions to apply for DEA that must be met are as follows: First, the subject of efficiency measurement are various DMUs (decision-making units) with their input and output data (Kao, 2014). Second, DMUs should comprise the same type of institutions, for example, banks in our study. Last, the number of DMUs should be at least three times or more of all the input and output variables (Kumar & Kar, 2023). DEA-BCC model developed by (Banker et al., 1984), facilitates calculation of efficiency scores under variable returns to scale (VRS) which is more realistic than efficiency scores calculated under constant returns to scale (CRS) (Habib & Mourad, 2024). Hence, the two-stage network DEA-BCC model with input orientation is applied in this study. Input orientation aims that a DMU achieve the given level of output by using minimum inputs. The two-stage network DEA model is also called the centralized model, developed by Liang et al. (2008). Several studies applied the two-stage network DEA in the existing literature to measure efficiency scores (Bangarwa & Roy, 2023; Despotis et al., 2025; Fukuyama & Weber, 2015; Gulati & Kumar, 2017; Kumar & Kar, 2023; Li et al., 2022). This model is based on multiplicative efficiency decomposition, in which overall efficiency is defined as the multiplication of the efficiency of two sub-processes.
Selection of Input and Output Variables
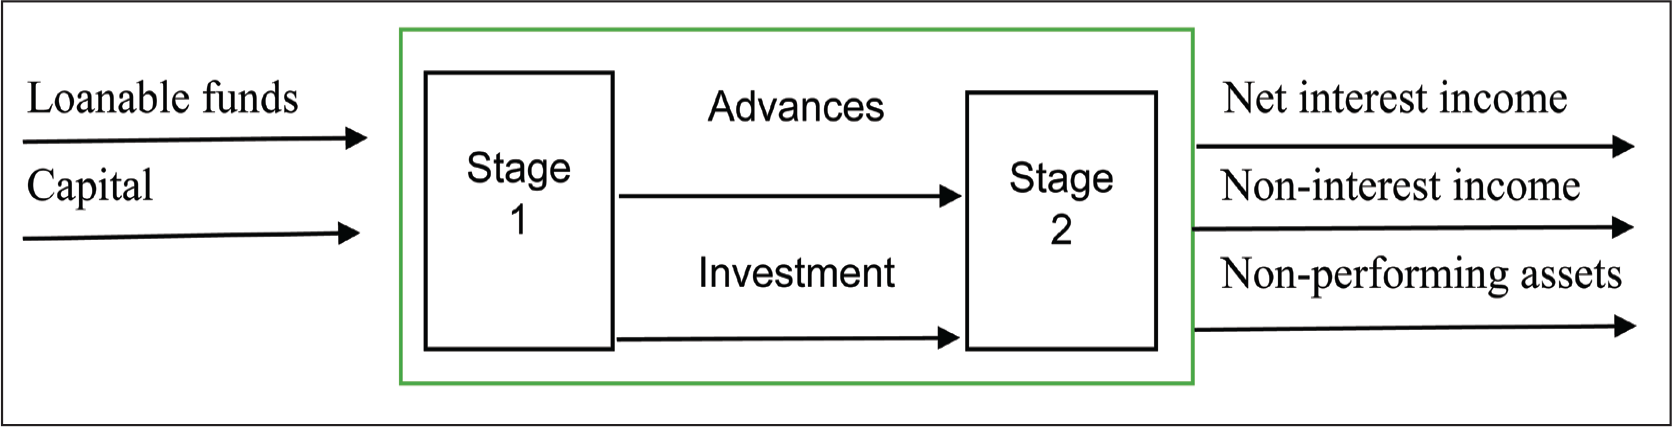
The intermediation approach is used to select input–output variables for this study as it is suitable for measuring bank-level efficiency (Berger & Humphrey, 1997; Saroy et al., 2023). To measure the overall efficiency of Indian banks, the two-stage production process methodology is adopted, in which the output of the first stage (intermediation stage) becomes the input of the second stage (operating stage). We assume that banks use loanable funds (deposits and borrowings) and capital as inputs for the first stage to produce the intermediate outputs that are investments and advances. Inputs of the first stage are selected in line with Hafsal et al. (2020), Milenković et al. (2022) and Saroy et al. (2023). In the intermediate process analysis, researchers use either fixed assets or capital as input. In this study, we use capital and are aligned with the opinion of Milenković et al. (2022) and Pasha (2024) that all fixed assets do not generate returns to banks and banks engage capital to maximize the return on it. The resultant scores of the first stage provide the intermediation efficiency, which represents the banks’ ability to minimize the wastage of loanable funds and capital. Our selection of input–output variables for the first stage is in line with the existing literature (Gulati & Kumar, 2017; Hafsal et al., 2020). In the second stage (operating stage), these investments and advances are applied to generate non-interest income, net interest income and undesirable output NPAs (non-performing assets). Inputs and outputs of the second stage are selected in line with Kumar and Kar (2023) and Li et al. (2022). NPAs are used as an undesirable output of the operating stage in line with Li et al. (2022). Resultant scores of the second stage reflect banks’ ability to fulfil their pre-determined goals of income maximization and NPA minimization. Figure 2 provides the flowchart of the two-stage network DEA.
Two-stage Network DEA.
Model Specification
This study examines the relationship between green banking and OE while considering age, leverage and fixed assets ratio as control variables by applying panel data models—ordinary least square (OLS), random effect model (REM) and fixed effect model (FEM). The Lagrange multiplier test was applied to select between OLS and REM and the Hausman test to select between REM and FEM. Further, two-step system GMM was applied to deal with endogeneity concerns, to justify the robustness of results. GMM is consistent and efficient, and adheres to normality since it uses the information of the moment condition and deals with the endogeneity problem (Dwibedi et al., 2024).
Endogeneity exists due to omitted variables, reverse causality, errors in variables and simultaneous causality, leading to biased results (Zaefarian et al., 2017). For a robust check, we applied a two-step system GMM, which is best suited for small sample bias (Kitulazzi et al., 2025).


Here, OE is operational efficiency, GBI stands for green banking index, Lev stands for leverage and FAR stands for fixed assets ratio. GFI, GOI, GPI and GAI are the subindices of GBI and imply ‘green finance index’, ‘green operation index’, ‘green policy index’ and ‘green awareness index’, respectively. α0 is the intercept item and α1, α2, α3 and α4 are the regression coefficients. εit is the error term. We applied the Hausman test to select between random and fixed tests. Null hypothesis (H0) of Hausman test is that REM is appropriate, and we fail to reject the H0 of Hausman if p > .05.
Results and Discussion
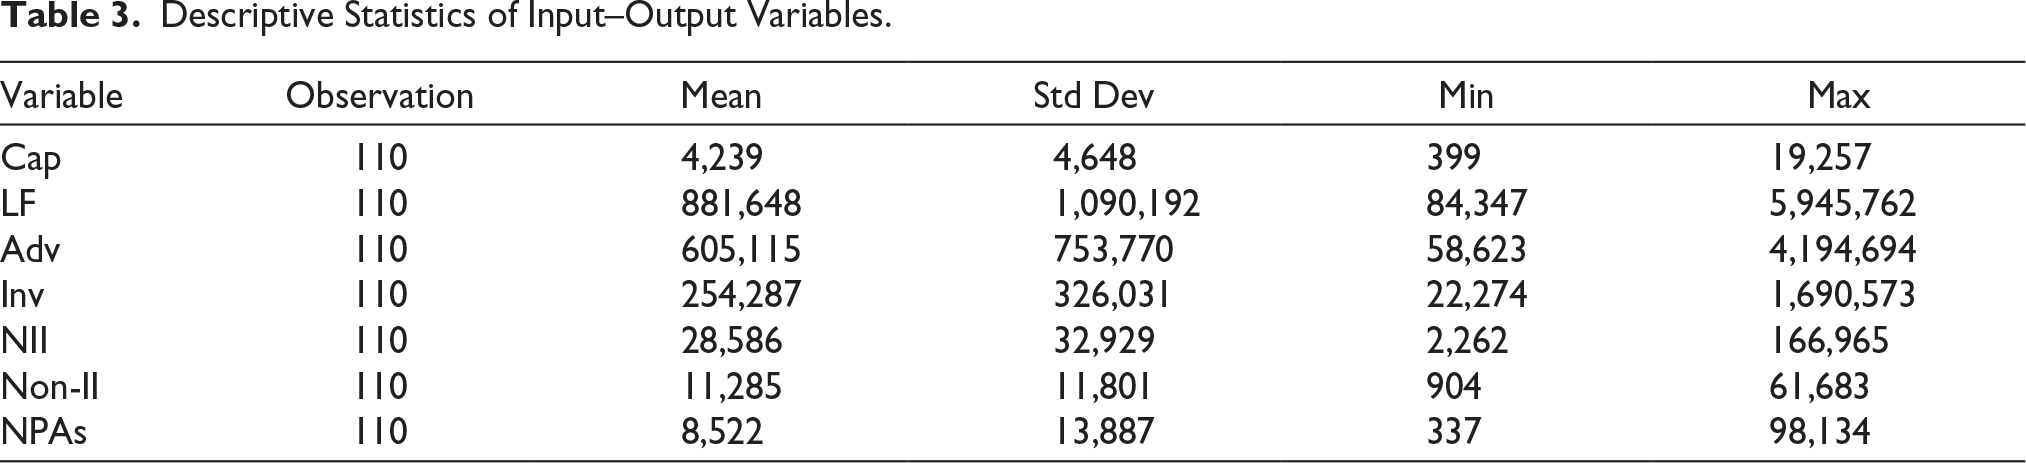
Tables 3 and 4 provide the descriptive statistics overview. Table 3 describes the mean, standard deviation, minimum and maximum values for input and output variables for OE calculation. Table 4 describes the mean, standard deviation, minimum and maximum values of all independent, dependent and control variables. The mean value of OE is 0.67, whereas 1 and 0.33 are maximum and minimum values, respectively, implying that the operational efficiency of banks is generally low, far enough from being an efficient unit. The mean value of GBI is 0.56, which indicates that only 56% of sample banks report green banking practices, which indicates the nascent stage of green practices in the Indian banking sector. The minimum value for GBI is 0.07, whereas 0.94 is the maximum value. This represents that prior to the issuance of RBI’s guidelines for banks regarding the acceptance of green deposit, banks were not focusing on green initiatives but after its implementation, most of the banks have started these practices. Few banks have still not accepted any fund in the form of green deposit as per RBI’s ‘green deposit acceptance framework’, such as ICICI bank, IndusInd bank, IDBI, Federal and Bandhan Bank (Bandhan Bank, 2025; Federal Bank, 2025; ICICI Bank, 2025; IDBI, 2025; IndusInd Bank, 2025). GF has a mean value of 0.33, with 0 as the minimum and 0.85 as the maximum, which indicates that green finance practices vary widely in commercial banks. Similarly, green policies and awareness practices have also scattered as GP and GA have minimum value of 0 and maximum value of 1 for each. Green operation has a mean value of 0.87, with 0.29 as the minimum and 1 as the maximum value, which implies that all banks are steadily implementing green practices in their operations followed by green awareness (mean = 0.57). The average age is 72.64, with 7 as the minimum and 130 as the maximum, reflecting a sample having both newer and older banks. Leverage has a mean value of 11.67, with 1.1 as the minimum and 206.53 as the maximum value, reflecting a highly scattered data of leverage. FAR has a mean value of 0.84.
Descriptive Statistics of Input–Output Variables.
Descriptive Statistics.
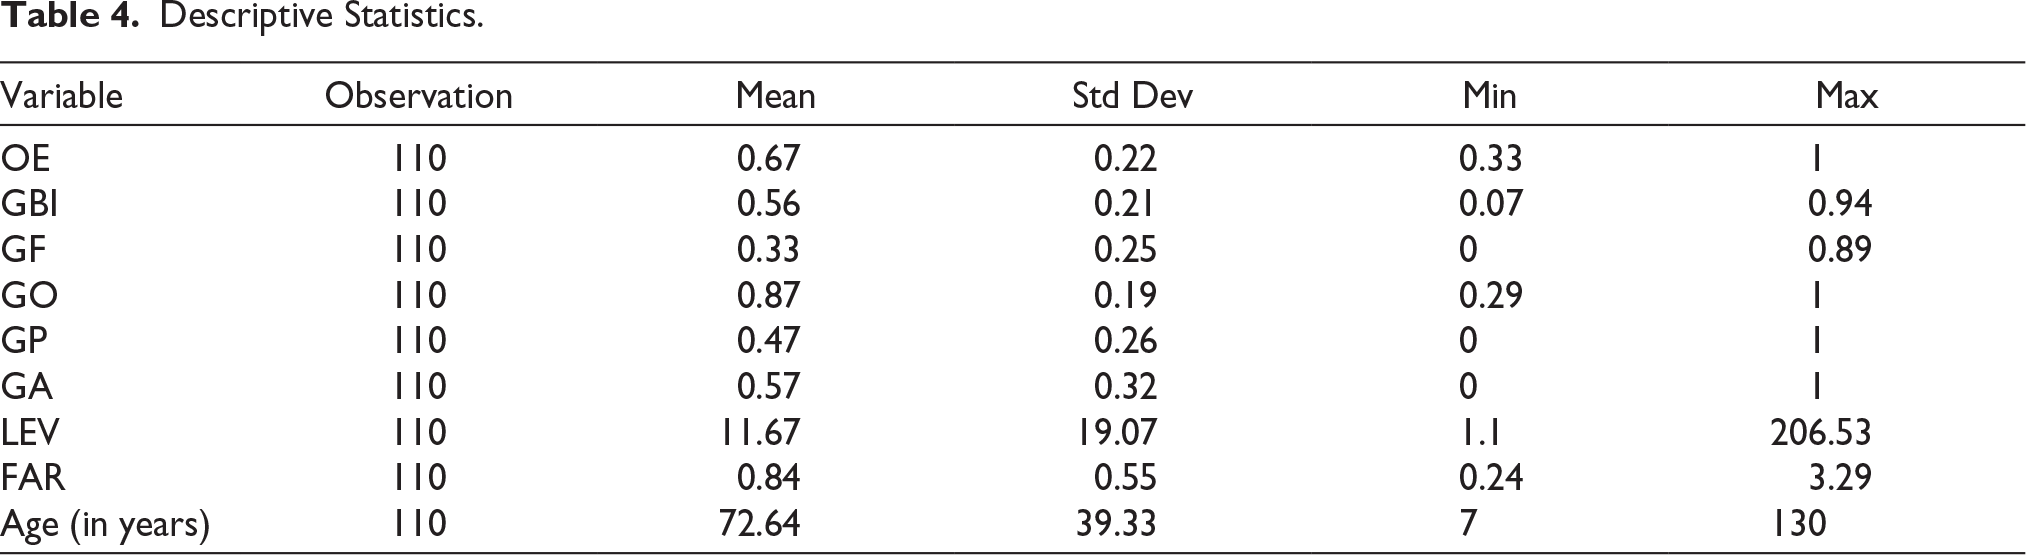
Table 5 describes the correlation analysis between each variable at 1%, 5% and 10% levels of significance. GBI is positively and significantly correlated with OE at 1% level of significance. GF, GO, GP and GA are positively correlated with OE. However, this correlation is not significant in the case of GO and GA. Age, leverage and FAR are negatively and significantly correlated with the OE of banks. GBI is significantly and highly correlated with its subindices (GF, GO, GP and GA) as the values of correlation coefficients are greater than 0.7; however, it does not invite multicollinearity issue as it is not included into a single model for regression. The mean values of variance inflation factor (VIF) test are 1.15 for Model 2 and 1.57 for the rest of the models, which implies that there is no multicollinearity issue in the data. As mentioned by Hair et al. (2010), there is no multicollinearity in the data if the mean VIF value is less than 10 (O’Brien, 2007).
Correlation Analysis.
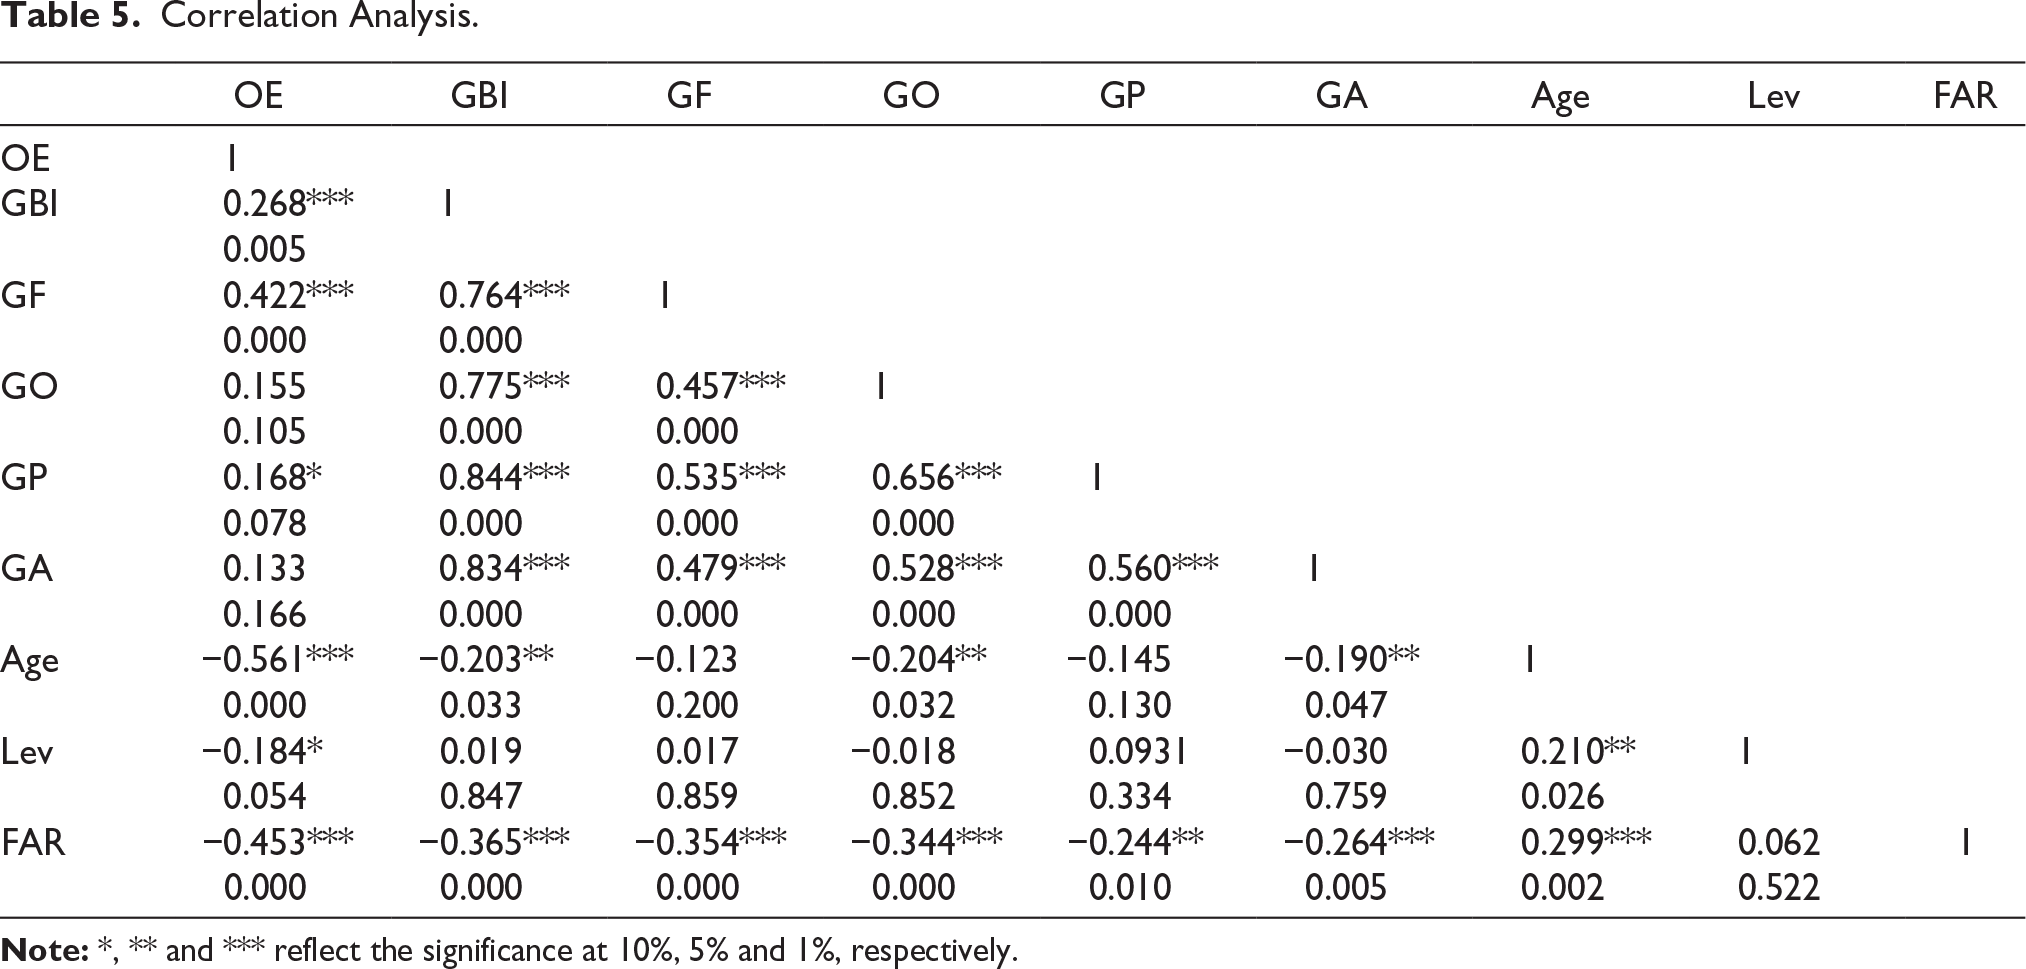
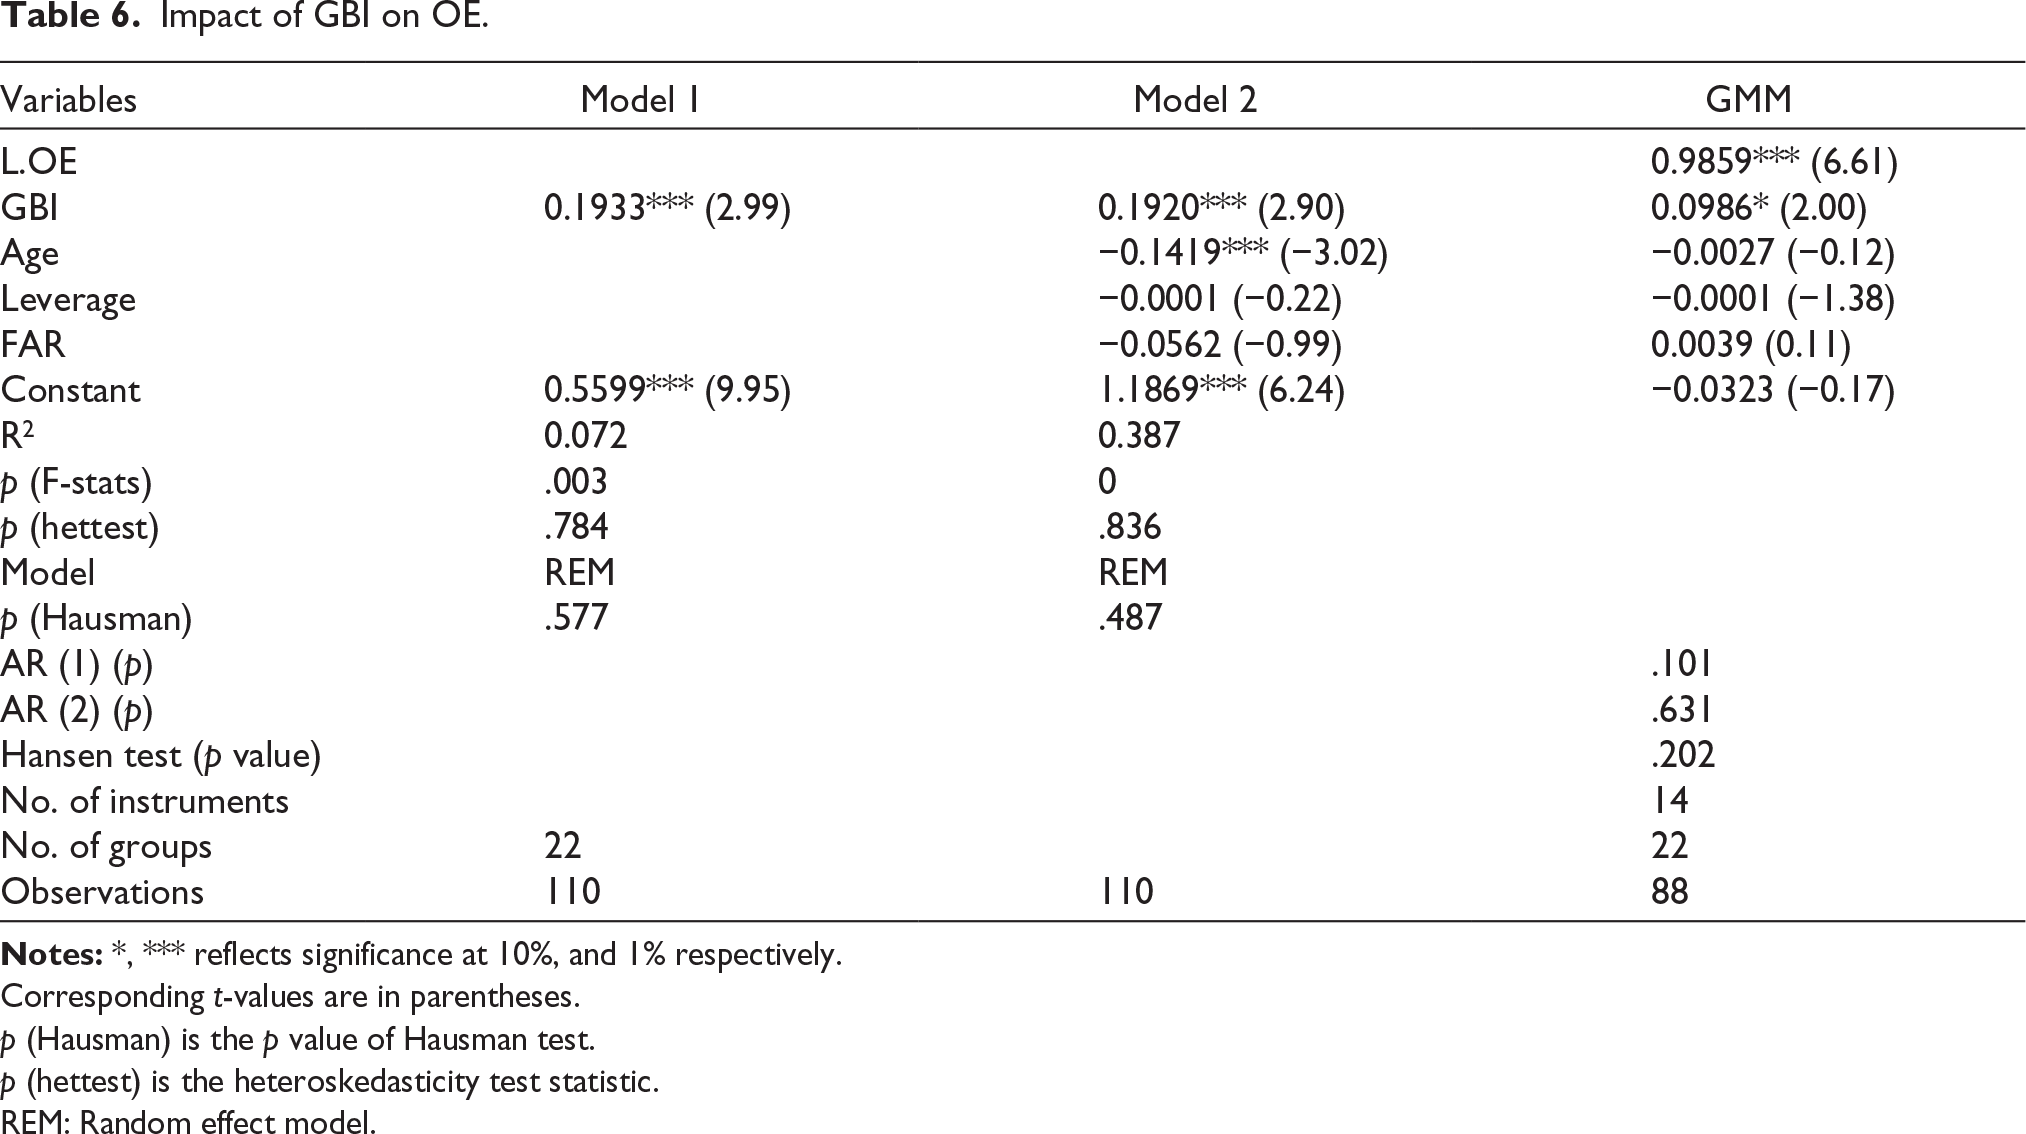
Table 6 demonstrates the results of panel data models. Three different methods (random effect, fixed effect and pooled OLS) were used to conduct the analysis. At first, we applied for the pooled OLS to get the results. However, OLS assumes homogeneity among samples and in the presence of unobserved heterogeneity, pooled OLS does not provide accurate results (Hong & Shin, 2025). To overcome these limitations of pooled OLS, we applied panel data models that are FEM and REM. Then, Hausman test was applied to select between random and fixed effect models. Table 6 reflects the p value of Hausman test for Models 1 and 2, which is greater than 0.05, thus reflecting the appropriateness of the random effect model. To test for heteroskedasticity concern, the Breusch–Pagan test is applied and we got a p value greater than .05 in both the models, which indicates no heteroskedasticity issue exists. Model 1 examines the impact of GBI on OE without considering control variables. GBI has a statistically significant positive coefficient (0.1933) at p < .01. Similarly, Model 2 demonstrates the influence of GBI on OE of banks taking control variables into consideration. Model 2 shows green banking has a highly significant positive influence on banks’ OE with a coefficient value 0.1920. It reflects that a 1% increase in green banking practices enhances banks’ OE by 19.2%. These results are consistent with those of Aslam and Jawaid (2023). Wang et al. (2025) found that ESG performance positively influences firms’ OE in the case of Chinese-listed companies. Age is negatively associated with banks’ OE. However, leverage and fixed assets ratio have no impact on banks’ OE.
Impact of GBI on OE.
Corresponding t-values are in parentheses.
p (Hausman) is the p value of Hausman test.
p (hettest) is the heteroskedasticity test statistic.
REM: Random effect model.
To make the results more robust, we have applied the two-step system GMM developed by Blundell and Bond (1998). The GMM model facilitates exogenous instruments within the data set, hence taking into consideration the dynamic property of panel data by taking the lagged value of dependent variables (Alam & Tariq, 2023). GMM better controls autocorrelation within individuals, heteroskedasticity and endogeneity issues (Blundell & Bond, 1998; Roodman, 2009). In the third column of Table 6, two-step system GMM results are given. The lagged value of dependent variable (L.OE) shows a coefficient value of 0.9859, which is highly significant at the 1% significance level. Through this, it can be concluded that the current year’s OE of banks is highly affected by the previous years’ efficiency level. GBI has a positive and significant coefficient; thus, like the results of panel data models, this makes our result more authentic. The rationale behind this finding is that green banking practices reduce operational costs through enhancing energy efficiency and reducing credit risk (Al-Qudah et al., 2023), which results in OE increment. The serial autocorrelation in the model is tested through AR (1) and AR (2) values. Serial autocorrelation exists if p < .05 for AR (1) and AR (2) at first and second order, respectively. In our results, the p > .05 for both AR (1) and AR (2); hence, there is no serial autocorrelation in the model at both first and second orders. The Hansen test indicates instrument validity or overidentifying restrictions. This test verifies the exogeneity of instruments selected in our model. In Table 6, the Hansen test value is greater than 0.05, which does not reject the null hypothesis of valid overidentifying restrictions and exogeneity of instruments. Hence, in our model, selected instruments are exogenous (not correlated with the error term).
Table 7 shows the results of Models 3, 4, 5 and 6, which reflect the impact of green finance, green operation, green policy and green awareness on the OE of Indian banks. As p > .05 of the Hausman test, the REM is appropriate to analyse Models 3–6. The Breusch–Pagan test is applied and gets p > .05 for all models, indicating that no heteroskedasticity issues exist. The green finance coefficient has a value of 0.2231, which is significantly positive at the 1% significance level. GO, GP and GA have positive coefficients of value 0.0315, 0.0982 and 0.1221, respectively. It can be concluded through coefficient values that green finance has a greater positive influence on OE, followed by green awareness and green policy. Since commercial banks’ focus is more on the financial function than the operational function, through green finance, banks direct funds towards environment-friendly projects, energy-efficient projects, and water and waste management initiatives, which reduces the credit risk for banks, on one hand, and ensures sustainable development, on the other hand (Jain & Sharma, 2023).
Impact of Subindices on OE.
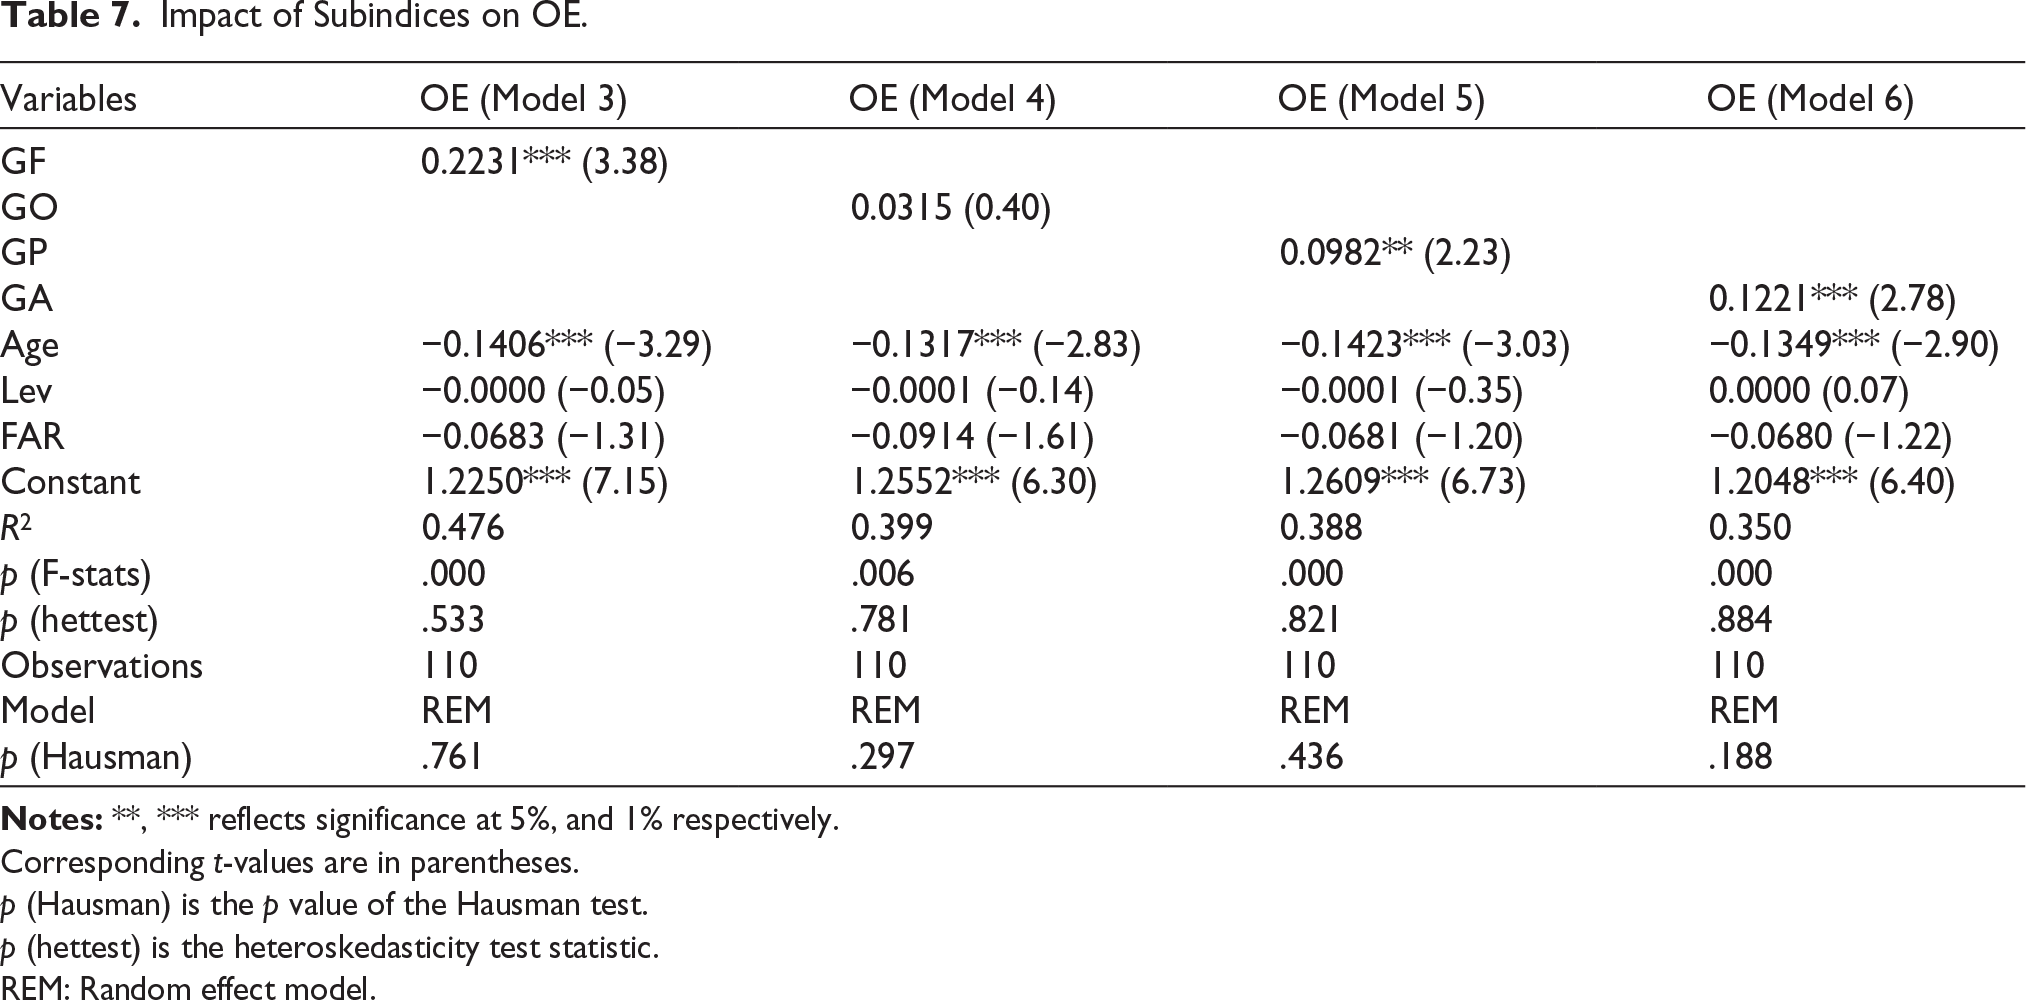
Corresponding t-values are in parentheses.
p (Hausman) is the p value of the Hausman test.
p (hettest) is the heteroskedasticity test statistic.
REM: Random effect model.
To deal with the endogeneity concern, a two-step system GMM is applied to verify the results shown in Table 8. The lagged value of the dependent variable shows a positive coefficient, significant at 1% significance level, ensuring dynamic panel data where the current year’s OE is highly and positively affected by the previous years’ efficiency level. For dynamic panel data, GMM is an appropriate technique to get authentic results. GF, GO, GP and GA show a positive impact on OE as per GMM results, which verifies panel data model results.
Two-step System GMM Results.
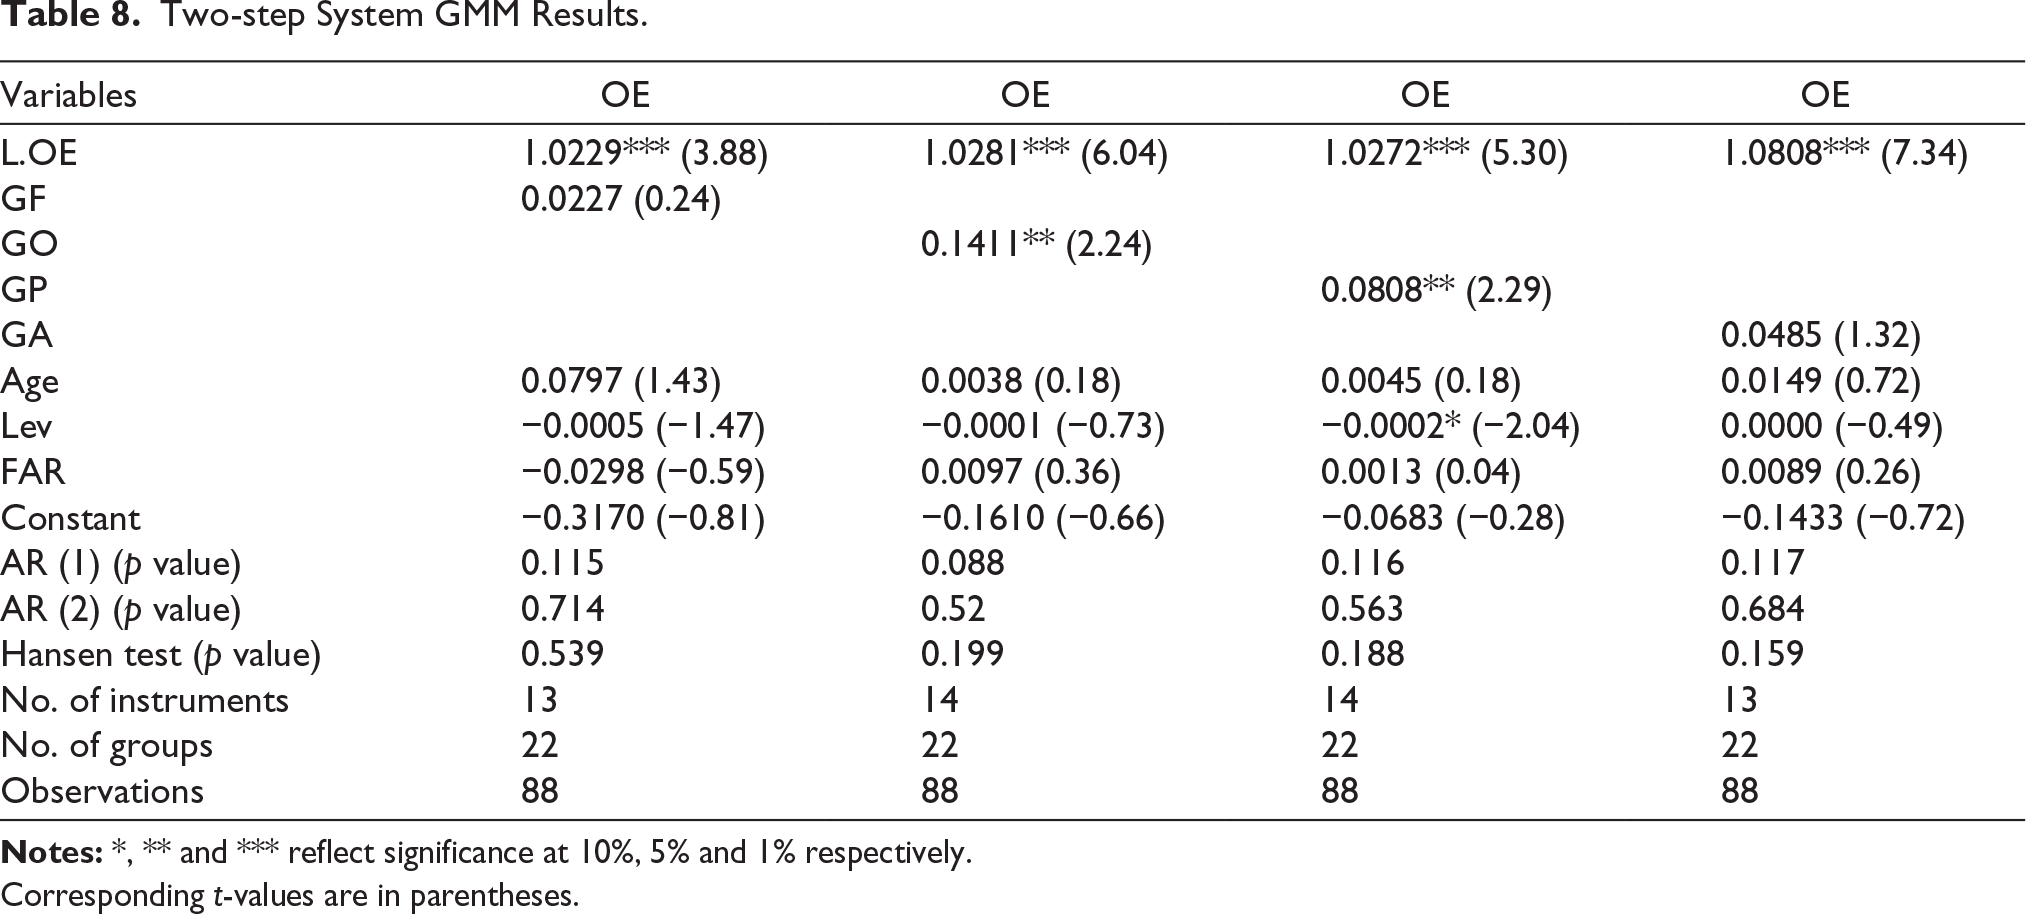
Corresponding t-values are in parentheses.
Conclusion
Green banking is considered an important pillar for a nation’s sustainable growth. These practices are at initial stages, and scholars are continuously exploring this area. Although ample literature is available on the disclosure practices of green banking; some researchers also found the linkage between green banking practices and the environmental and financial outcomes of banks. However, a considerable gap is found in the OE studies with the relation of green banking. To fill this gap, this study examines the nexus between green banking practices and OE of Indian banks by taking a 5-year sample data from 2021 to 2025. The empirical evidence specifies that green banking practices positively influence banks’ OE. Green banking practices reduce credit risk and operational cost, which leads to increased OE of banking institutions (Al-Qudah et al., 2023). In the present study, green banking practices are measured through four subindices, which are green finance, green operation, green policy and green awareness. Separate models are run to evaluate the individual effect of these subindices on banks’ OE. The results indicate that green finance, green operation, green policy and green awareness have a positive impact on banks’ OE. However, green finance has a major impact on OE as compared to others. The rationale behind these findings is that owing to the green deposit policy of the RBI, almost all banks are now emphasizing green finance. Banks provide finance for various eco-friendly projects including renewable energy projects, green buildings, waste and water management, energy-efficient projects and biodiversity conservation. These green finance initiatives enhance banks’ OE. Similarly, green operations increase banks’ OE through reducing operational cost as now banks became more conscious towards climate change and use renewable energy, recycled paper, energy-efficient equipment and digital payment technology in their daily operational activities. Saroy et al. (2023) highlighted that digital payment adoption positively influences banks’ OE in the banking sector of India. Green policy is equally important for better green banking practices and banks’ OE. Green awareness also affects OE of banks positively. Banks organize several awareness programmes for their employees as well as for customers to make them aware of their green products. Various cleanliness and tree plantation drives are organized by banks which show a sense of eco-friendliness and social responsibility that helps them to connect with customers having environment-conscious behaviour and take green initiatives into consideration while connecting with any institutions.
Implications and Limitations
Empirical results of this study provide several insights for policymakers, bank managers and regulatory authorities. This study contributes to the existing green banking literature. It is suggested to implement green practices in the banks as they are beneficial for banks, environment and society at large. It is recommended to bank managers to ensure adequate training for the staff so that better green practice implementation can be ensured. Further this study recommends that each bank should improve technology-driven practices such as mobile banking, digital transactions, e-documentation and sensor-based equipment so that operational costs could be reduced to the minimum level. Banks should evaluate every project in terms of their negative environmental impact and try to finance only eco-friendly projects such as renewable energy, energy-efficient projects, electric vehicles and biodiversity conservation. It is suggested to the regulatory authorities to make a robust policy mechanism, including risk management committees, which ensure minimum credit risk and need to improve these policies as per the regulatory and climate change requirements. International collaboration is needed to enhance green practices in the banking sector. Although Central Banks Networks for Greening the Financial System exist to motivate and integrate central banks of various countries, every country’s central bank needs to collaborate with others and encourage commercial banks of their respective country for better implementation of these policies to make a broad and greener financial system. Collaboration between government, central bank and financial institutions is needed to make a green financial system and achieve the country’s target of net zero emissions.
Findings of this study provide valuable insights. Despite these findings, there are some limitations that need to be recognized. First, this study uses a sample of 22 commercial banks (BSE-listed) only. However, in India there are other type of banks including regional rural banks, foreign banks and small payment banks which can be included in future research to get an overall picture of Indian green banking practices and their impact on OE of banking sector. Second, two-stage network DEA is applied in this study to measure OE. Other analysis methods, such as Malmquist Productivity Index or Stochastic Frontier Analysis (SFA) in DEA can be applied for future OE studies in banking sector. Third, results of this study can be applied to other lower-middle income nations having similar banking system, however, cannot be applied to the high income and upper-middle income nations having different characteristics. Final, future researchers can take banking units of different countries and make a comparison based on green banking and OE parameters.
Data Availability statement
Data will be available on request.
Footnotes
Declaration of Conflicting Interests
The authors declared no potential conflicts of interest with respect to the research, authorship and/or publication of this article.
Funding
The authors received no financial support for the research, authorship and/or publication of this article.