
Abstract
The present study investigates the socioeconomic inequality and determinants of healthy ageing in different regions of India using the Longitudinal Ageing Study in India (LASI), Wave 1 (2017–2018). This study developed an individual-level healthy ageing score (HAS) by incorporating 53 variables suggested by the expert committee of the WHO on healthy ageing. Income, wealth and education inequality are measured using the indirectly adjusted concentration index (CI). The multiple linear regression estimates the socioeconomic, demographic and behavioural determinants. It has been found that the mean HAS in India is 72.57; it is highest in the North-east and lowest in South India. The CI indicated socioeconomic inequality in healthy ageing in India, favouring high-income, wealthy and educated elders across the region. The regression shows that older adults who are relatively young, male, rich and living in urban areas are more likely to be healthy than their counterparts. It is also found that the habit of smoking, physical inactivity and prevalence of chronic diseases are significantly associated with a low HAS in India.
Introduction
Population ageing is one of the most relevant public health issues as people worldwide live longer than their previous generation. The world population aged 60 years and above was 962 million in 2017, which is more than twice as large as in 1980, and it is expected to be nearly 2.1 billion in 2050 (WHO, 2015). Over the past few decades, India’s share of the elderly has increased due to a continuous decline in death rates and a corresponding rise in life expectancy (Bharati & Singh, 2013). The elderly population in India is projected to escalate from 8% in 2015 to 19% in 2050 (UNPF, 2017). Given the growing number of older adults and rising life expectancy, the critical question is whether there is any concurrent postponement of functional limitations and disability among them (Christensen et al., 2009), because the elderly are one of the most vulnerable groups with a high risk of poor health. They have a high chance of fracture from falling (Coutinho et al., 2008), the burden of frailty (Buckinx et al., 2015) and the risk of depression and chronic diseases (Huang et al., 2010). The adverse effect of loneliness also worsens with ageing (Berg-Weger & Morley, 2020). In India, around 26% to 37% of older people experience falls due to age-related limitations (Joseph et al., 2019), and 55% of the older people rate their health as ‘poor’ (Kumar & Pradhan, 2019). The elderly in India report low cognitive scores, which harm their quality of life (Singh et al., 2017). Consequently, it is vital to evaluate how much well-being can be maintained by an older adult with these given risks.
Researchers have devised several concepts to quantify the health and well-being of the elderly population, such as productive ageing (Kaye et al., 2003), successful ageing (Rowe & Kahn, 1997) and active ageing (Walker, 2002). The most recent advancement in this area is ‘healthy ageing’. WHO defines healthy ageing as ‘the process of developing and maintaining the functional ability that enables well-being in older age’ (World Health Organization, 2020). Functional ability combines a person’s intrinsic capacity, environment and interactions with that environment. The United Nations General Assembly (2020) designated 2020–2030 as the ‘decade of healthy ageing’ to promote healthy ageing in its member nations.
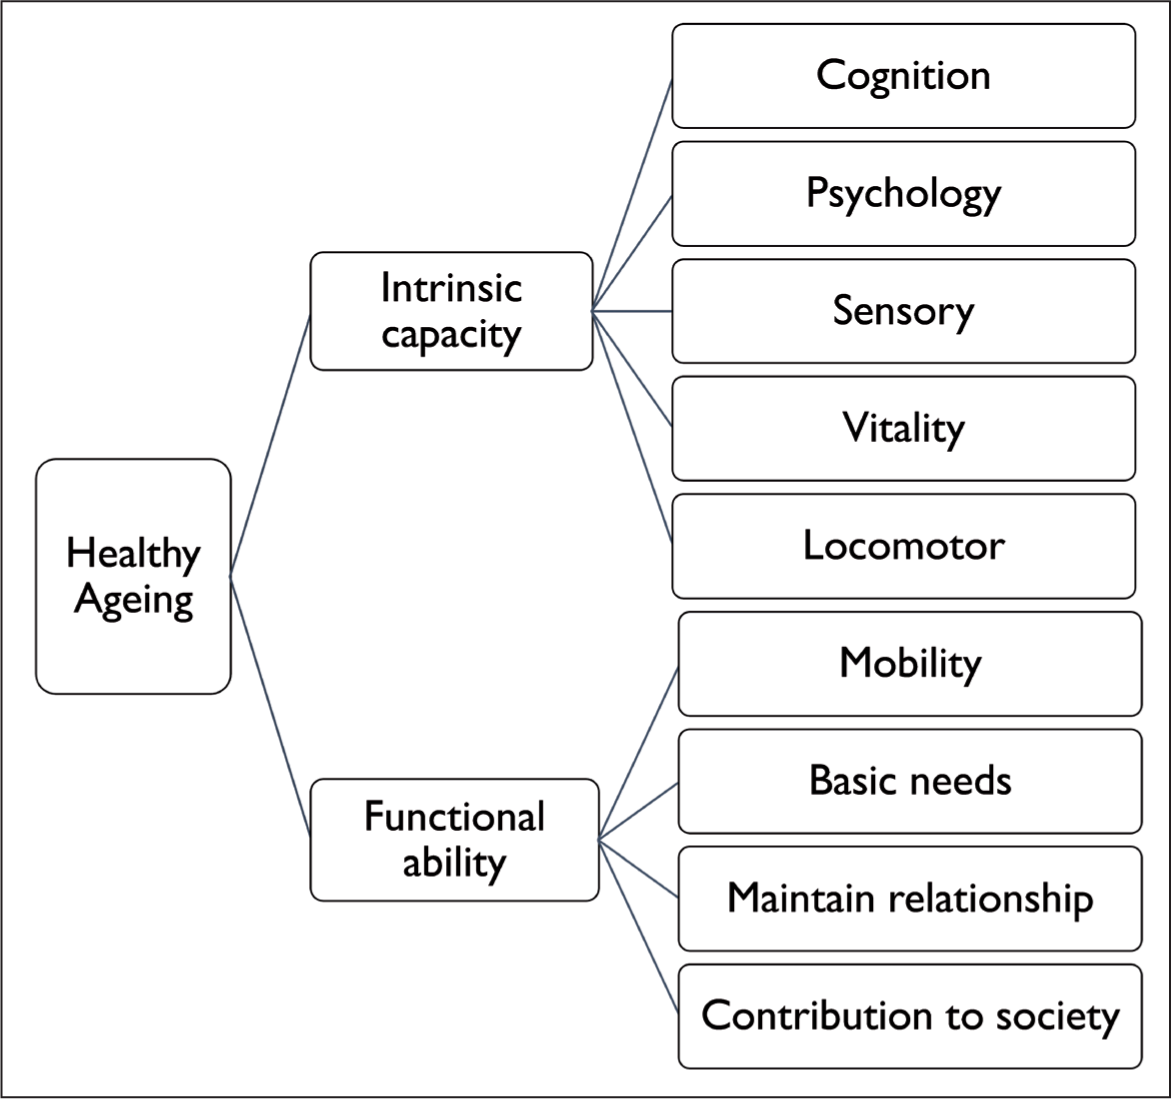
Despite numerous academic efforts, there is no universally accepted way to measure healthy ageing as defined by the WHO (Jaspers et al., 2017; Michel et al., 2019). The domains and formulas differ from study to study. The primary distinction in measuring healthy ageing is in the domains that different scholars adopt. Scholars like Gonçalves et al. (2017) used domains of the biopsychosocial assessment model, and Lu et al. (2021) used dimensions such as physical capabilities, cognitive functions, psychological health, social participation and prevalence of chronic diseases. Sanchez-Niubo et al. (2021) supplied a standard scale for all longitudinal ageing surveys to measure healthy ageing and introduced the sensory domain and omitted variables like the incidence of non-communicable diseases (NCDs). In the current study, we used the framework suggested by the WHO expert committee on healthy ageing (Figure 1) (World Health Organization, 2020).
Healthy ageing for all is the motto of the decade of healthy ageing (2020–2030); hence, reducing inequity/inequality in healthy ageing across socioeconomic and demographic groups is one of WHO’s critical priorities (WHO, 2020). Inequality in health is defined as systematic, unfair and avoidable disparities in health outcomes observed within and between socioeconomic ally stratified populations (McCartney et al., 2019). Unequal access to socioeconomic and cultural resources is the leading cause of health inequality (Frohlich et al., 2006). Disadvantaged groups will be more vulnerable to inequality; unfortunately, the elderly are one of society’s most disadvantaged groups (Shaw et al., 2014).
Many studies have proved that socioeconomic status significantly impacts health in later life (Alam, 2009; Pandey & Ladusingh, 2015; Saeed et al., 2015; Wang et al., 2018). Despite the impressive performance in economic growth after 1990, there is significant inequality in health status and accessibility to healthcare services in India—across states, between urban and rural areas and between communities (Baru et al., 2010). Even though many studies have been conducted on socioeconomic inequality in elderly health in India, the majority focus on specific aspects of elderly health, such as self-rated health (Kumar & Pradhan, 2019), comorbidity (Tyagi & Paltasingh, 2017), cognitive impairment (Singh et al., 2017), chronic diseases (Singh et al., 2019) and grip strength (Arokiasamy & Selvamani, 2018). Besides this, Ladusingh & Ngangbam (2016) analysed socioeconomic inequality in each of the five domains of physio-psychosocial health, and Alam et al. (2015) developed a composite health and well-being index with seven domains. But these studies do not claim the measurement of healthy ageing. Researchers, such as Dey et al. (2012) and Cramm and Lee (2014), used the word ‘healthy ageing’ in their study to refer to maintaining good health in older age, which is not in line with the WHO’s guidelines. Notably, Irshad and Dash (2021) contributed to quantifying healthy ageing in accordance with WHO definition in the Indian context. However, none of these studies covered all the dimensions of healthy ageing suggested by the WHO expert committee, but added domains such as chronic diseases, since disease-free living is not a prerequisite for healthy ageing (WHO, 2020). Therefore, our study will be more justified to the WHO framework on healthy ageing than earlier research. Additionally, the regional disparities in healthy ageing in India have not been explored, which makes our study more significant.
This study aims to analyse the prevalence, socioeconomic inequality and determinants of healthy ageing across regions of India. As a member of United Nations, India’s Ministry of Health also launched the decade of healthy ageing in October 2021. At the beginning of the decade, figuring out the status and disparity of healthy ageing in India across regions and socioeconomic groups will help policymakers take proper action.
Data and Methodology
Data
This study is based on the Longitudinal Ageing Study in India (LASI), Wave 1 (2017–2018), conducted jointly by the International Institute for Population Sciences, the Rand Corporation and Harvard School of Public Health. LASI is a large-scale nationwide survey of scientific exploration of the country’s social, economic and health determinants and implications of population ageing. This survey included 72,000 older adults aged 45 and above, covering all states and union territories of India. 1
This analysis includes 26,850 people aged 60 and above from all Indian states and union territories. This study focuses solely on individuals having biomarker data because biomarkers such as body mass index (BMI), grip strength and gait speed are critical in determining healthy ageing.
Healthy Ageing Score
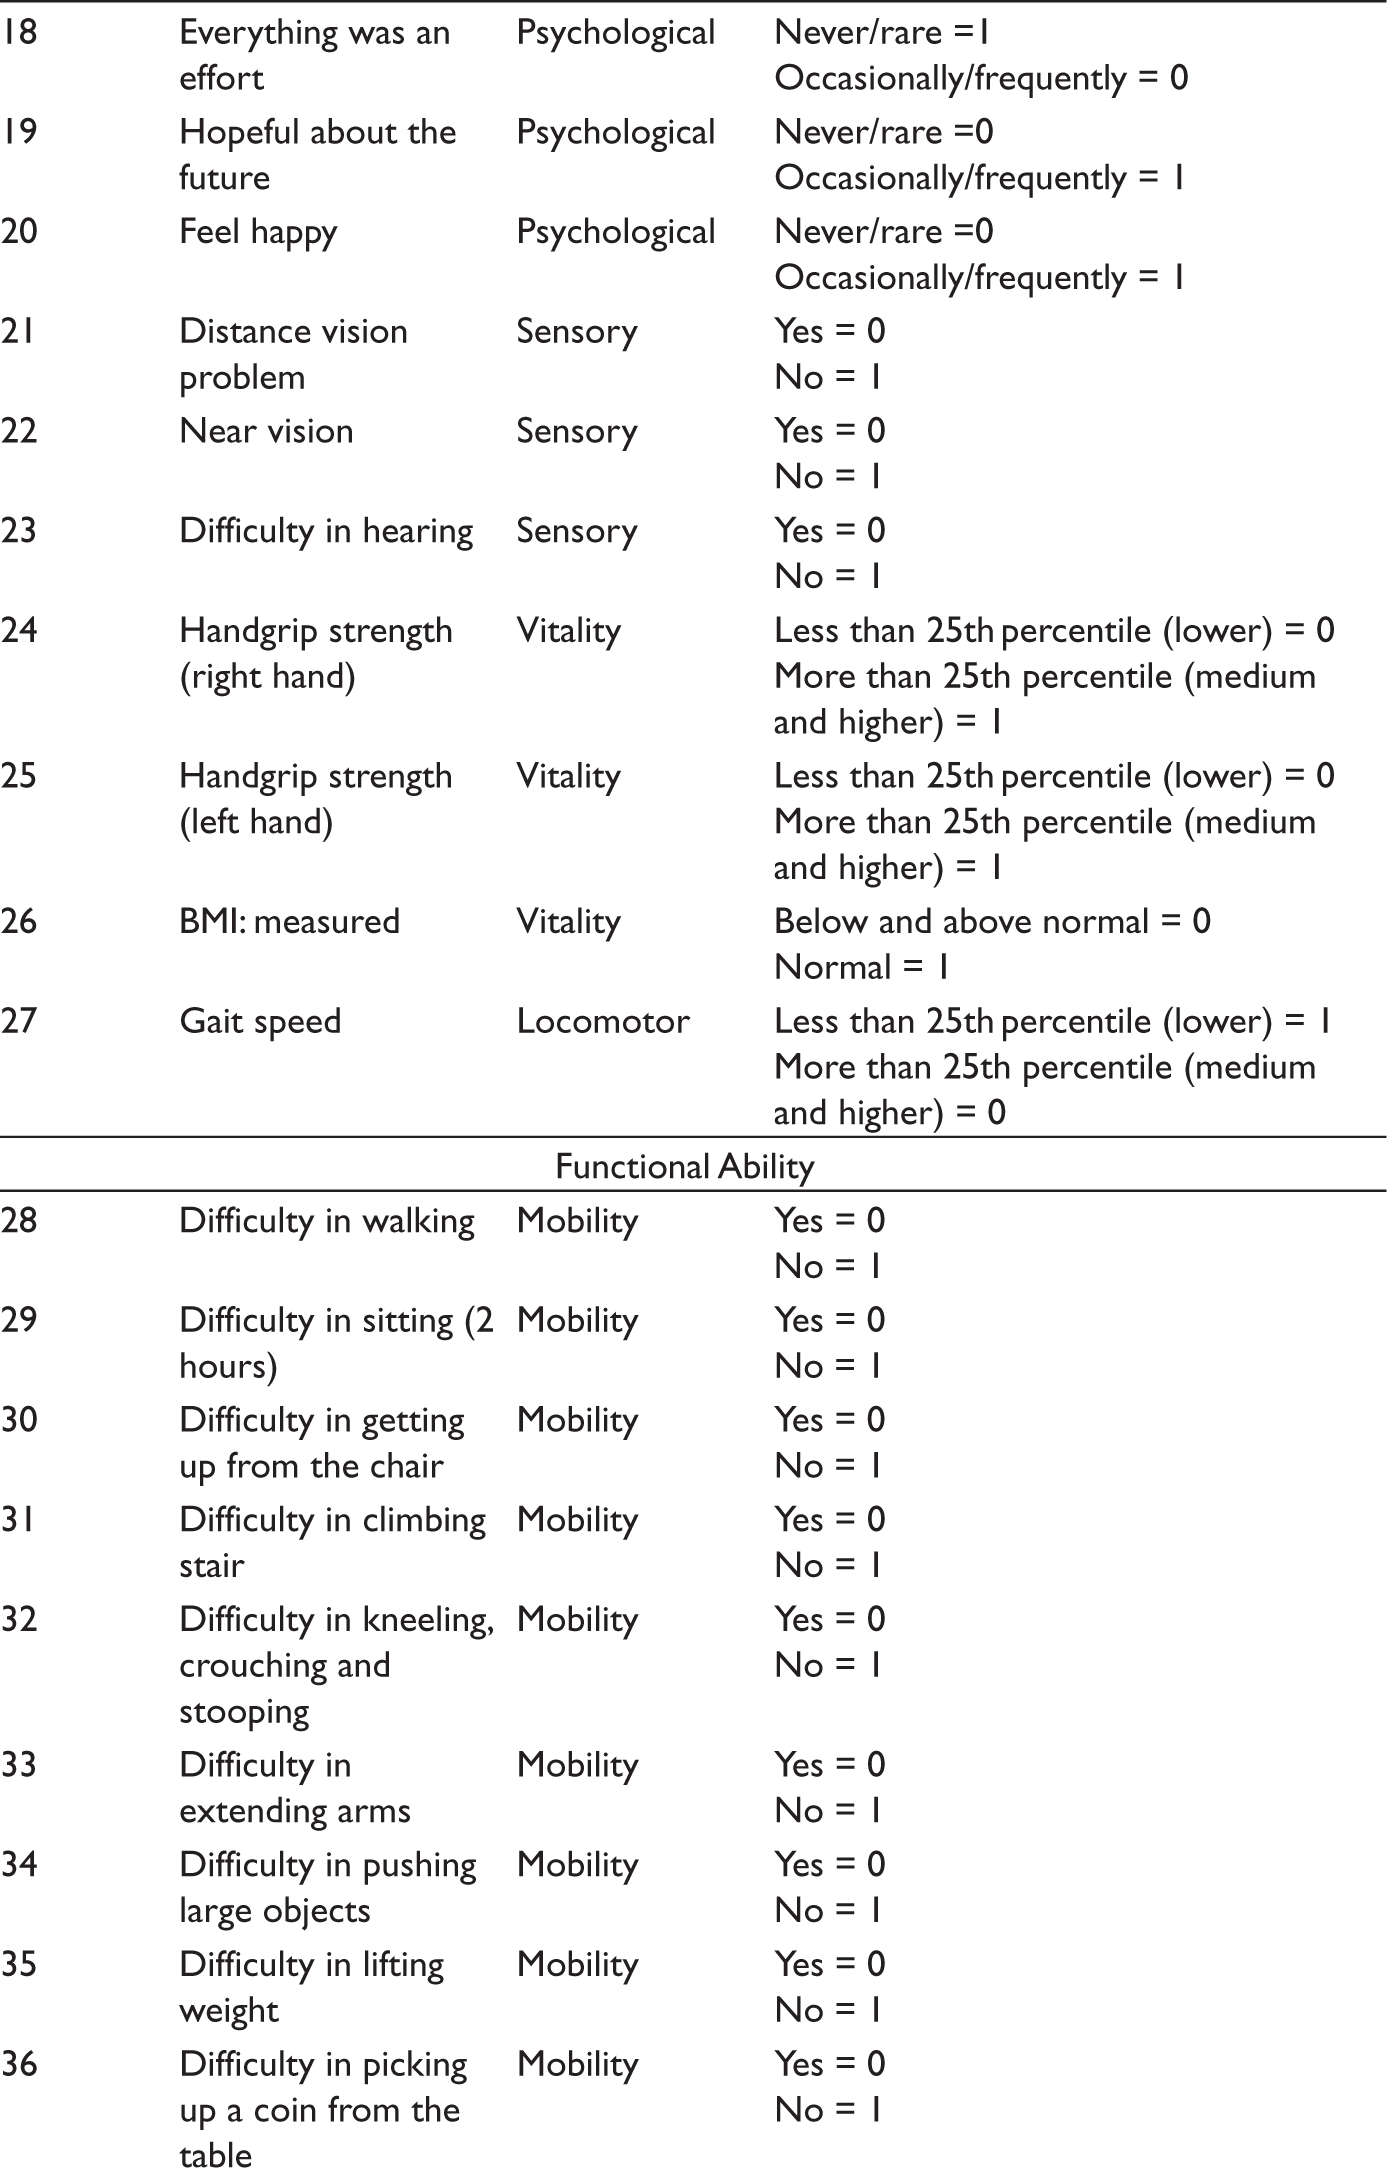
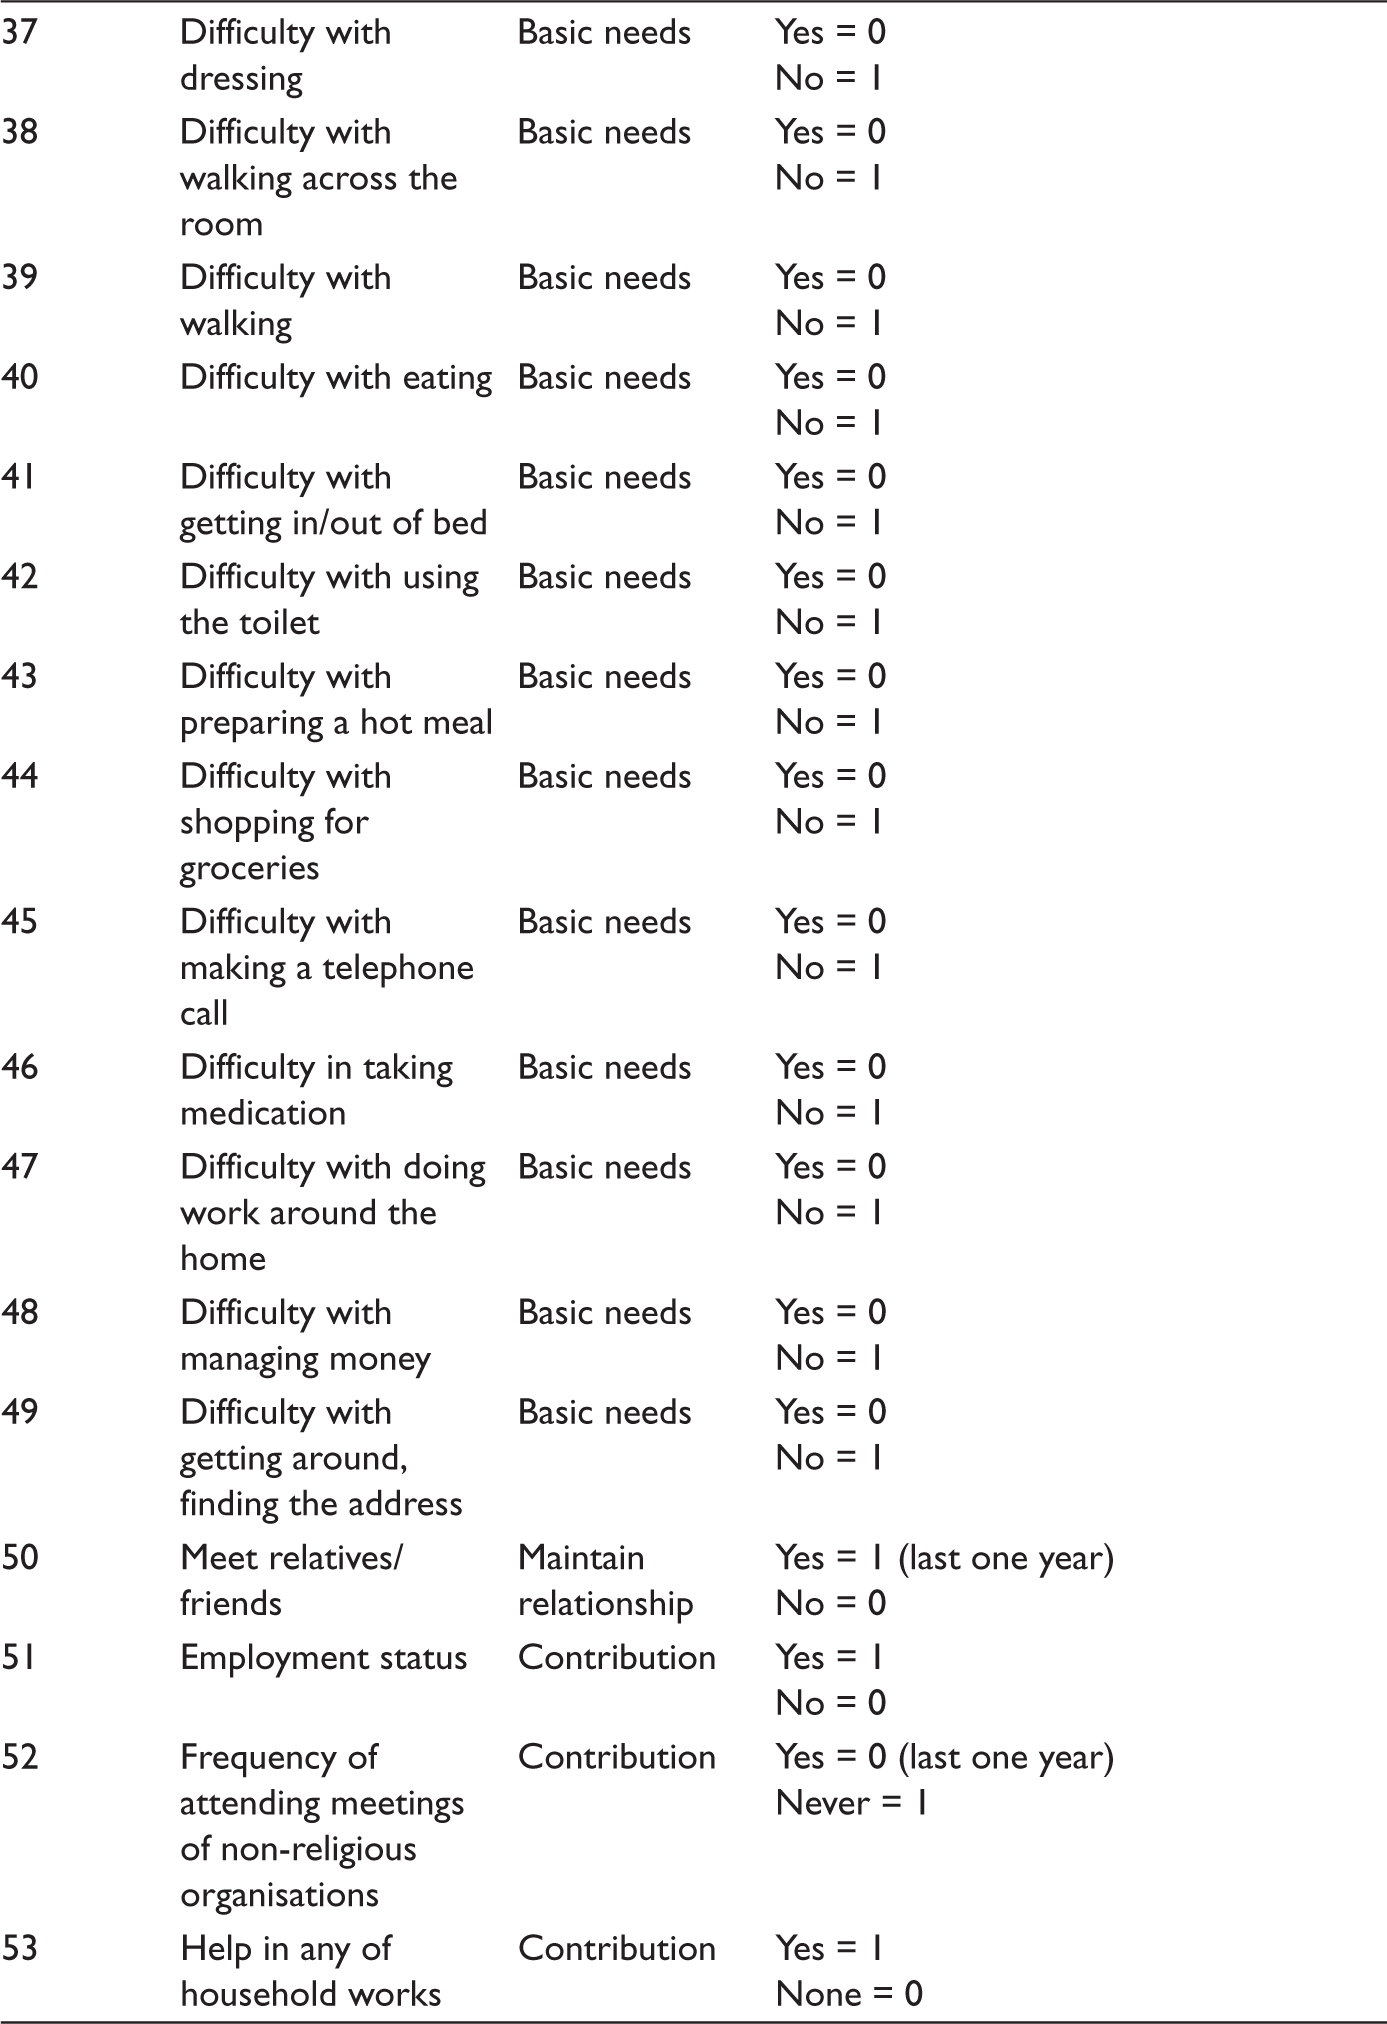
In this study, we created an individual-level healthy ageing score (HAS) with 53 variables that covered all domains proposed by the WHO expert committee on healthy ageing. All these variables come under the broad domains of functional ability and intrinsic capacity and subdomains of cognitive, psychological, physical, sensory, vitality, locomotive and mobility, maintaining the relationship and contribution to society (Appendix 1). The variables were assigned binary values of 0 for the presence of difficulty/disability and 1 for absence. Depending on the variable’s nature, the variables with continuous values were bifurcated as the first quartile representing the presence/absence of difficulties and above the first quartile representing the presence/absence of disability. Suppose the variable like gait speed (word recalling), the first quarter taken as one (zero) and above the first quarter as zero (one). Each individual’s score (sum of the values of variable) was rescaled to a value between 0 and 100 and used as the HAS. A higher score reflects better health. The index (HAS) reliability verified with Cronbach’s alpha that the internal consistency among variables is 0.8850, which is highly desirable (Tavakol & Dennick, 2011).
Socioeconomic Inequality
This study examined inequality in healthy ageing across three socioeconomic variables: income, wealth and education. Studies suggest that income, wealth and education are the best predictors for analysing the regional inequality in healthy ageing (Lu et al., 2021; Wu et al., 2020).
Most surveys in India do not provide household income, and studies use monthly per capita expenditure (MPCE) as an alternative for income (Prinja et al., 2012). Fortunately, LASI provides household total annual income, so this study used per capita income to measure income inequality in healthy ageing.
Studies have shown wealth predicts living standards more accurately than income (Hoffmann, 2011). So we created a composite wealth index by principal compound analysis, which considers household amenities and financial and non-financial assets (Howe, 2009). Finally, ‘years of schooling’ were taken to analyse education inequality in healthy ageing.
To address the regional inequality in healthy in India, we classified Indian states into four regions:
South Indian states Bihar, Madhya Pradesh, Rajasthan and Uttar Pradesh (BIMARU) North-east states Rest of the Indian states and union territories
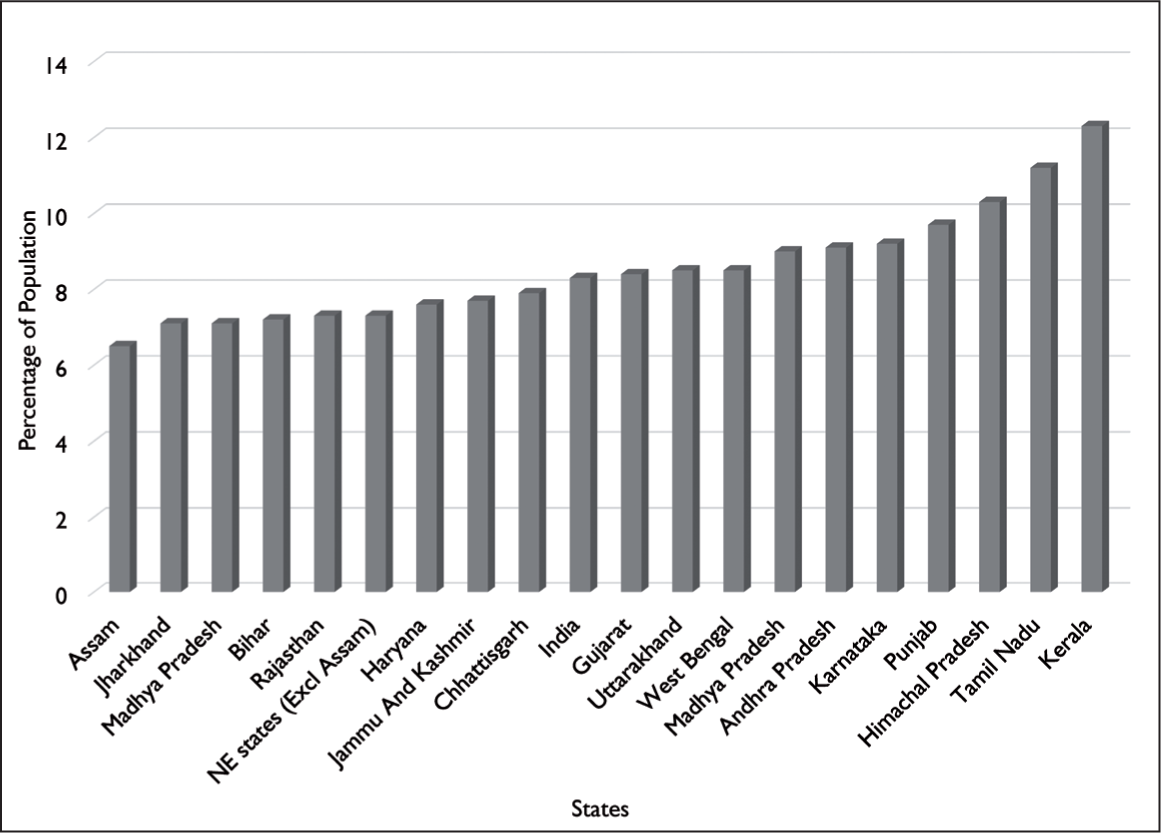
South Indian states consist of Kerala, Tamil Nadu, Karnataka, Telangana and Andhra Pradesh. BIMARU stands for Bihar, Madhya Pradesh, Rajasthan and Uttar Pradesh, and North-east states are Arunachal Pradesh, Assam, Manipur, Meghalaya, Mizoram, Nagaland and Tripura. The rationale behind this classification is the proportion of population ageing. The ratio of the elderly population is highest in South Indian states and least in BIMARU states, and except for Assam, North-east states fall between these two groups (Figure 2). Furthermore, each region has nearly identical socioeconomic development and geo-cultural similarities.
The indirectly adjusted concentration index (CI) was used to determine income, wealth and education inequality (O’Donnell et al., 2007). Since healthy ageing is highly sensitive to demographic factors, particularly age and sex, indirectly adjusted CI enables demographic standardisation of CI. The CI is ‘twice the area between the concentration curve and the equality line of equality’. The range of the CI is -1 to +1, and if there is no inequality, the CI will be zero. A positive value represents the concentration of the health variable among the better off (in socioeconomic positions). If the health variable is a ‘good’, such as the ‘healthy ageing score’ used in the present study, a positive CI value means healthy ageing is higher among the higher income, wealth or educated groups. The CI is calculated with the following regression equation:
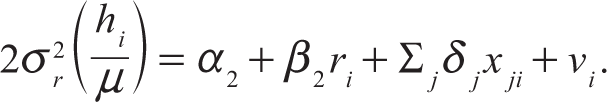
The left side of the equation is the CI, which can be calculated as the beta coefficient of the regression function. The vector xj stands for the confounding variables, that is, age and sex. The ordinary least squares estimate β 2 is an estimate of the indirectly standardised CI. The dependent variable of the present analysis is the HAS, and independent variables are the fractional rank of individuals derived separately from their respective position in income, wealth and education for each inequality gradient. All statistical analyses are performed with Stata version 16, and Stata commands given by O’Donnell et al. (2007) are used to measure the CI.
Determinants of Healthy Ageing
The health and well-being of an elder are attributed to his whole life experiences and socioeconomic and demographic background (Ladusingh & Ngangbam, 2016). In the light of previous studies, the socioeconomic and demographic factors considered in the current study are age, sex, place of residence, education, social group (cast), marital status and MPCE (Arpino & Solé-Auró, 2019; Caballero et al., 2017; Irshad & Dash, 2021; Nie et al., 2021). The behavioural factors that impact older adult health, including drinking, smoking and physical exercise, are considered (Byles et al., 2006; Cramm & Lee, 2014; Foscolou et al., 2018). Additionally, the prevalence of chronic diseases and working status were added in this study as many studies used it as a domain or determinant of healthy ageing (Lu et al., 2021). Moderate energetic activities, such as cleaning the house, gardening, bicycling, dancing and stretching exercises, are considered physical exercises. People who worked for at least three months in their entire lifespan are taken as ‘ever worked’. Multiple linear regression was used to identify the relevant factors influencing healthy ageing. The log e-transformed HAS was employed due to the left-skewed distribution of the HAS.
Results and Discussion
HAS of Different Regions of India
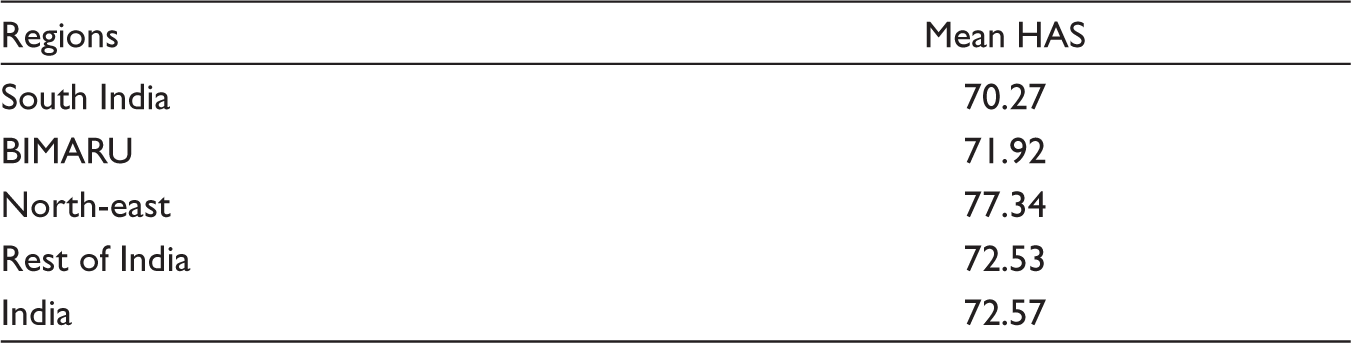
The present study has found that India has a mean HAS of 72.57 (Table 1), indicating that most elderly have fair health. The North-east region has the highest HAS (77.34), and South India has the least score (70.27). The South Indian states and BIMARU are below the national average. The HAS of the rest of India is almost similar to the national average. Previous research on other household surveys has shown that South Indians have reported the worst health status in India regarding their self-reported health status and morbidity (Akhtar et al., 2020; Srinivasan et al., 2017). The prevalence of chronic disease burden is also highest in South India (Dandona et al., 2017; Singh et al., 2019), which may contribute to a low HAS. Since tribes often report better health in later life due to their lifestyle (Irimia et al., 2021; Irshad et al., 2022), the high proportion of tribal populations in the North-east states (Mohindra & Labonté, 2010) may be the reason for the region’s higher mean HAS. Differences in sociocultural factors could be another reason for the difference in healthy ageing, such as family size and attitude towards caring for the elderly (Ahmed, 2020; Samanta et al., 2015), which are different across regions.
Mean HAS of Different Regions of India.
Inequality of Healthy Ageing in Different Regions of India
The indirectly adjusted CI is created to determine the inequality in healthy ageing in socioeconomic positions: income, wealth and education. The severity of inequality in each gradient across regions is depicted in Table 2 and Figure 3. The positive values of the CI show that the distribution of healthy ageing in India favours those who are better off in terms of income (CI = 0.0078), wealth (CI = 0.0148) and education (CI = 0.0387).
CI of Income, Wealth and Education Inequality in Different Regions of India.
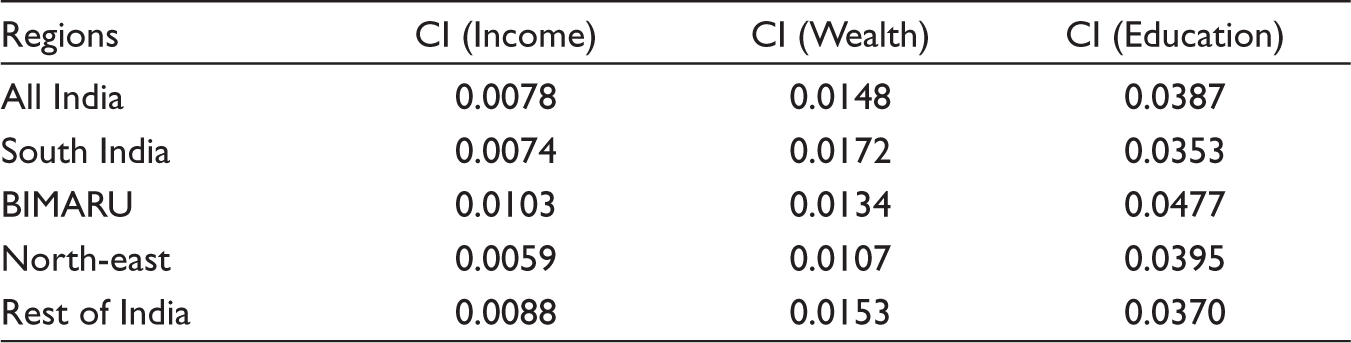
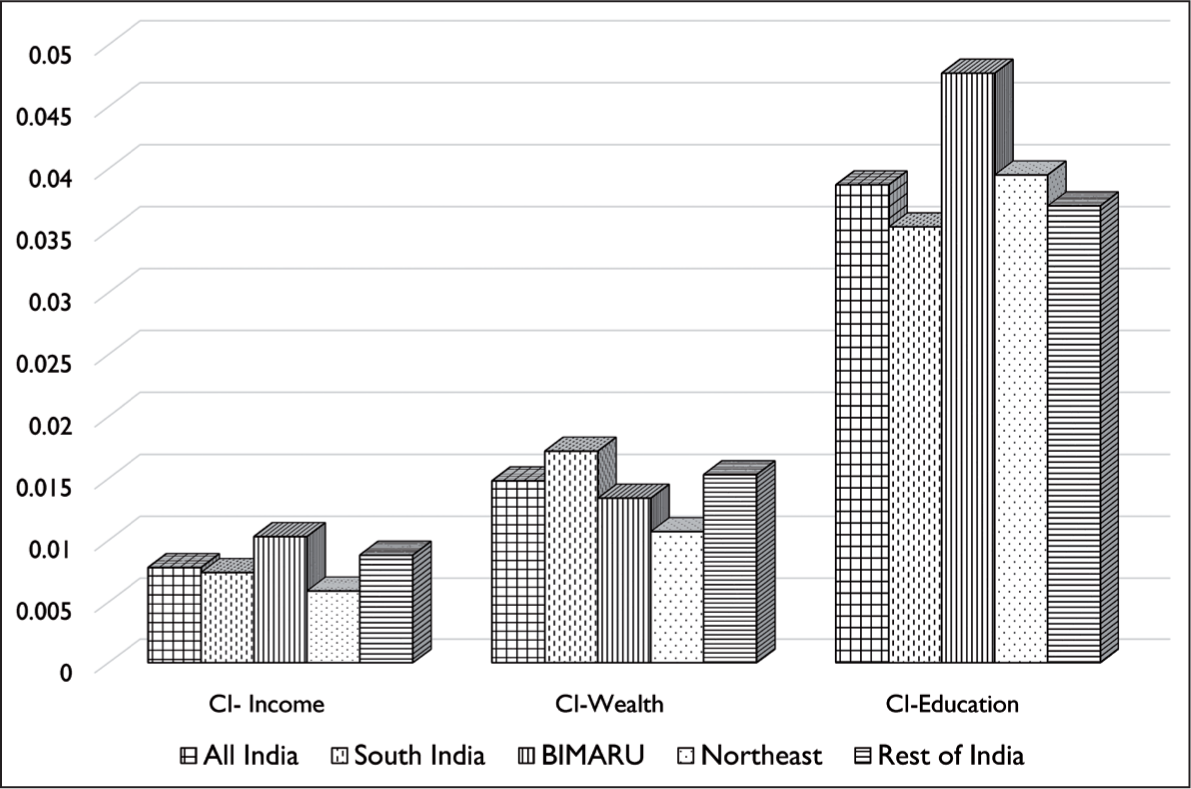
Several studies have found that income and wealth play a significant role in health disparity in later life (Chiavegatto Filho et al., 2012; Feng et al., 2012; Lai et al., 2020). According to a study in China and India, older people from the three wealthiest quintiles were less likely to have physical impairments, functional limitations and disabilities than seniors from the lowest quintile (Kumar et al., 2016). Our findings are consistent with other studies that mainly address income and inequality in healthy ageing (Lu et al., 2021; Wu et al., 2020). In comparison with South Indian states (CI = 0.0074) and North-east states (CI = 0.0059), BIMARU states (CI = 0.0103) have the highest level of income inequality in healthy ageing. Alam et al. (2015) also found that Kerala and Tamil Nadu in South India have the lowest income disparity levels regarding senior citizens’ well-being. Concerning wealth, South Indian states have the highest levels of disparity, while the North-east region has the lowest levels.
Education inequality in healthy ageing in India is the highest among the three strata of inequality. Tsimbos (2010) found a similar result that disparity in education dominates the income and wealth in contributing to inequality in health status among the elderly. Indian elderly who are illiterate are more likely to have multiple health issues (Tyagi & Paltasingh, 2017). Regarding educational inequality in healthy ageing in India, it is highest in BIMARU (0.0477) and least in South India (0.0353). The lower illiteracy rate (Shah, 2013) and higher literacy gap in the BIMARU states may cause higher educational inequality in healthy ageing, because South Indian states, which have higher literacy rates than other regions, have less educational inequality. It is observed that although there is a pro-rich (better off) inequality in HASs across all regions, there is only a slight variation between them.
Determinants of Healthy Ageing in Different Regions of India
The present study used multiple linear regression to analyse the association between HAS and its determinants (Table 3). It is found that as age grows, the HAS significantly decreases in all regions. Inverse relationships between biological age and health status have been established in research beyond dispute (Nie et al., 2021; Sanchez-Niubo et al., 2021. Wu et al. (2020) demonstrated that physical age would dominate the socioeconomic factors in health disparity in later life.
Socioeconomic, Demographic and Behavioural Determinants of Healthy Ageing in Different Regions of India.
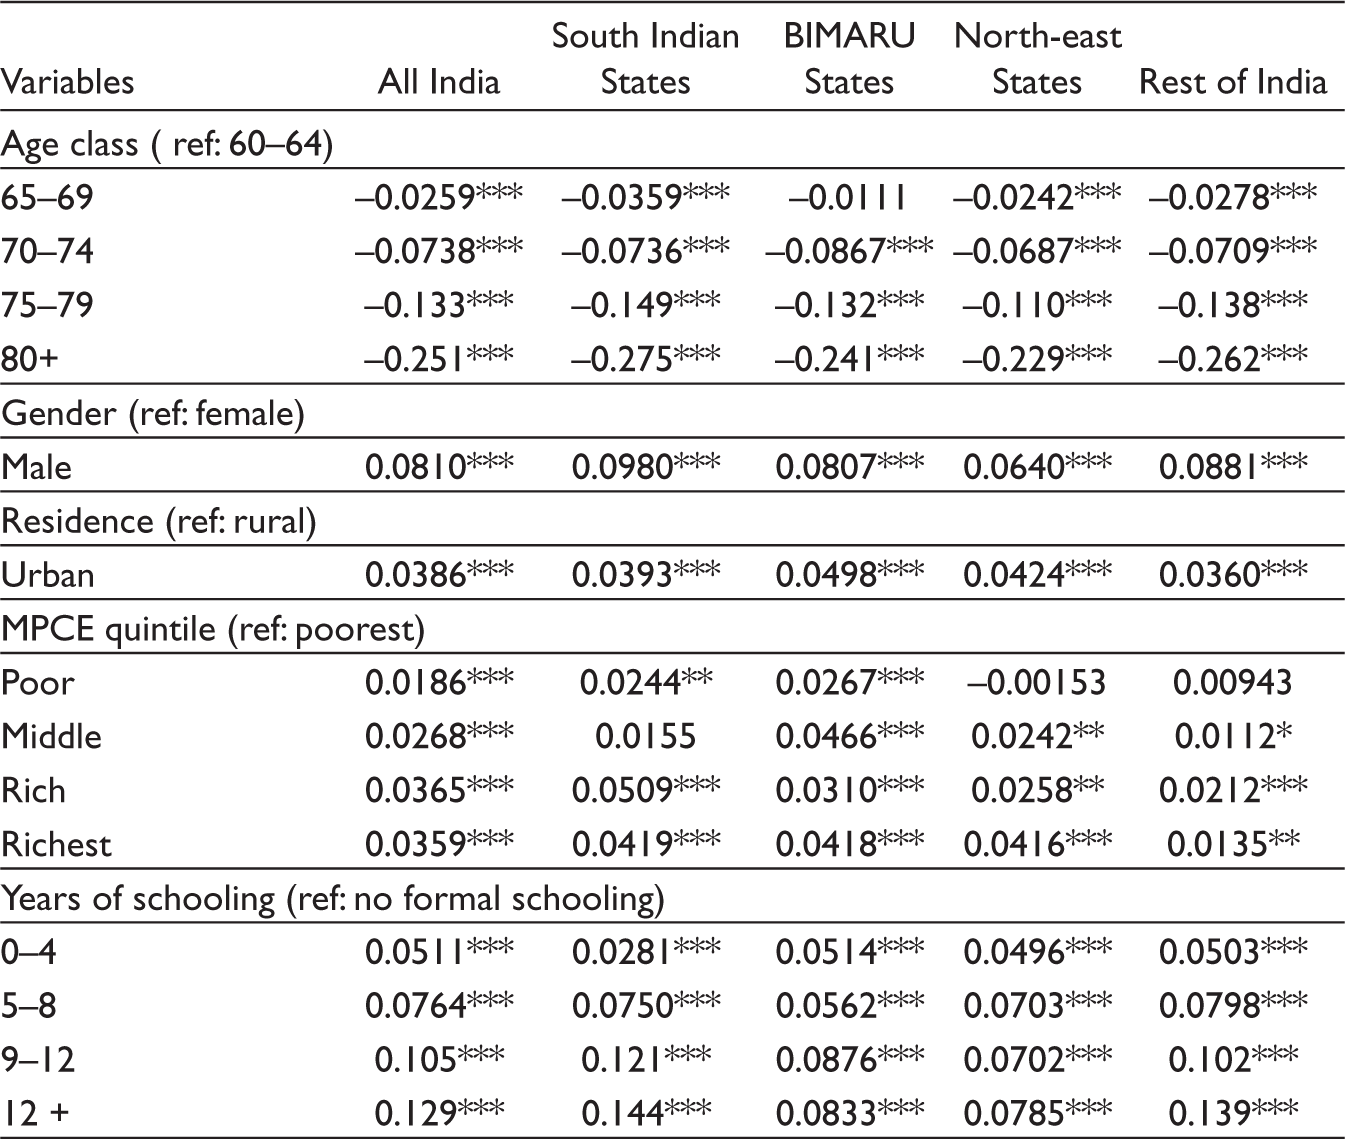
*** P < 0.01, ** P < 0.05, * P < 0.1
We have found that men in India had significantly greater HAS than women. This finding is consistent with other studies (Irshad & Dash, 2021; Schmitz & Lazarevič, 2020). Differences in health status across genders are caused mainly by socioeconomic inequality (Huisman et al., 2003). In India, women are disproportionately disadvantaged in terms of nutrition and health (Tiwari, 2013). Lower health condition among women in India is partly a result of women’s favouring sex ratio and widowhood (Rajan, 2008; Rajan & Sreerupa, 2009). In most societies, women live longer than men despite having higher levels of distress, depression and illnesses (McDonough & Walters, 2001), which could be another reason for the low HAS.
The association between the place of residence and healthy ageing shows that the elderly residing in urban areas have significantly better health than their rural counterpart. A similar result can be found in the study by Mudey et al. (2011). Rural communities are more susceptible to illness and bad health because of inadequate housing conditions, a lack of clean drinking water, traditional cooking techniques, etc. Lack of health infrastructure, low economic status and education are the barriers to healthcare utilisation and lower health status among rural people in India (Banerjee, 2021).
Regarding the MPCE, India’s richest quintile (top 20%) has significantly better health than the lowest quintile (bottom 20%). Earlier studies examining older people’s multidimensional health status (Alam et al., 2015; Caballero et al., 2017) demonstrate a positive relationship between health status and MPCE. But studies that assessed health status using self-reported health or the prevalence of illness (morbidity) (Akhtar et al., 2020; Prinja et al., 2012) show an inverse relation between MPCE and health. Sen (2002) addressed this paradox by stating that individuals with better socioeconomic status are more likely to report illnesses due to improved health consciousness.
Years of schooling and the HAS show a significantly progressive trend from those without formal education to more than 12 years of schooling. Tyagi and Paltasingh (2017) observed that a lack of health awareness results in low healthcare utilisation and health status among senior citizens in India. The education level is inversely related to the reduction in cognitive function in older age (Cabello et al., 2014), which might contribute to the low HAS.
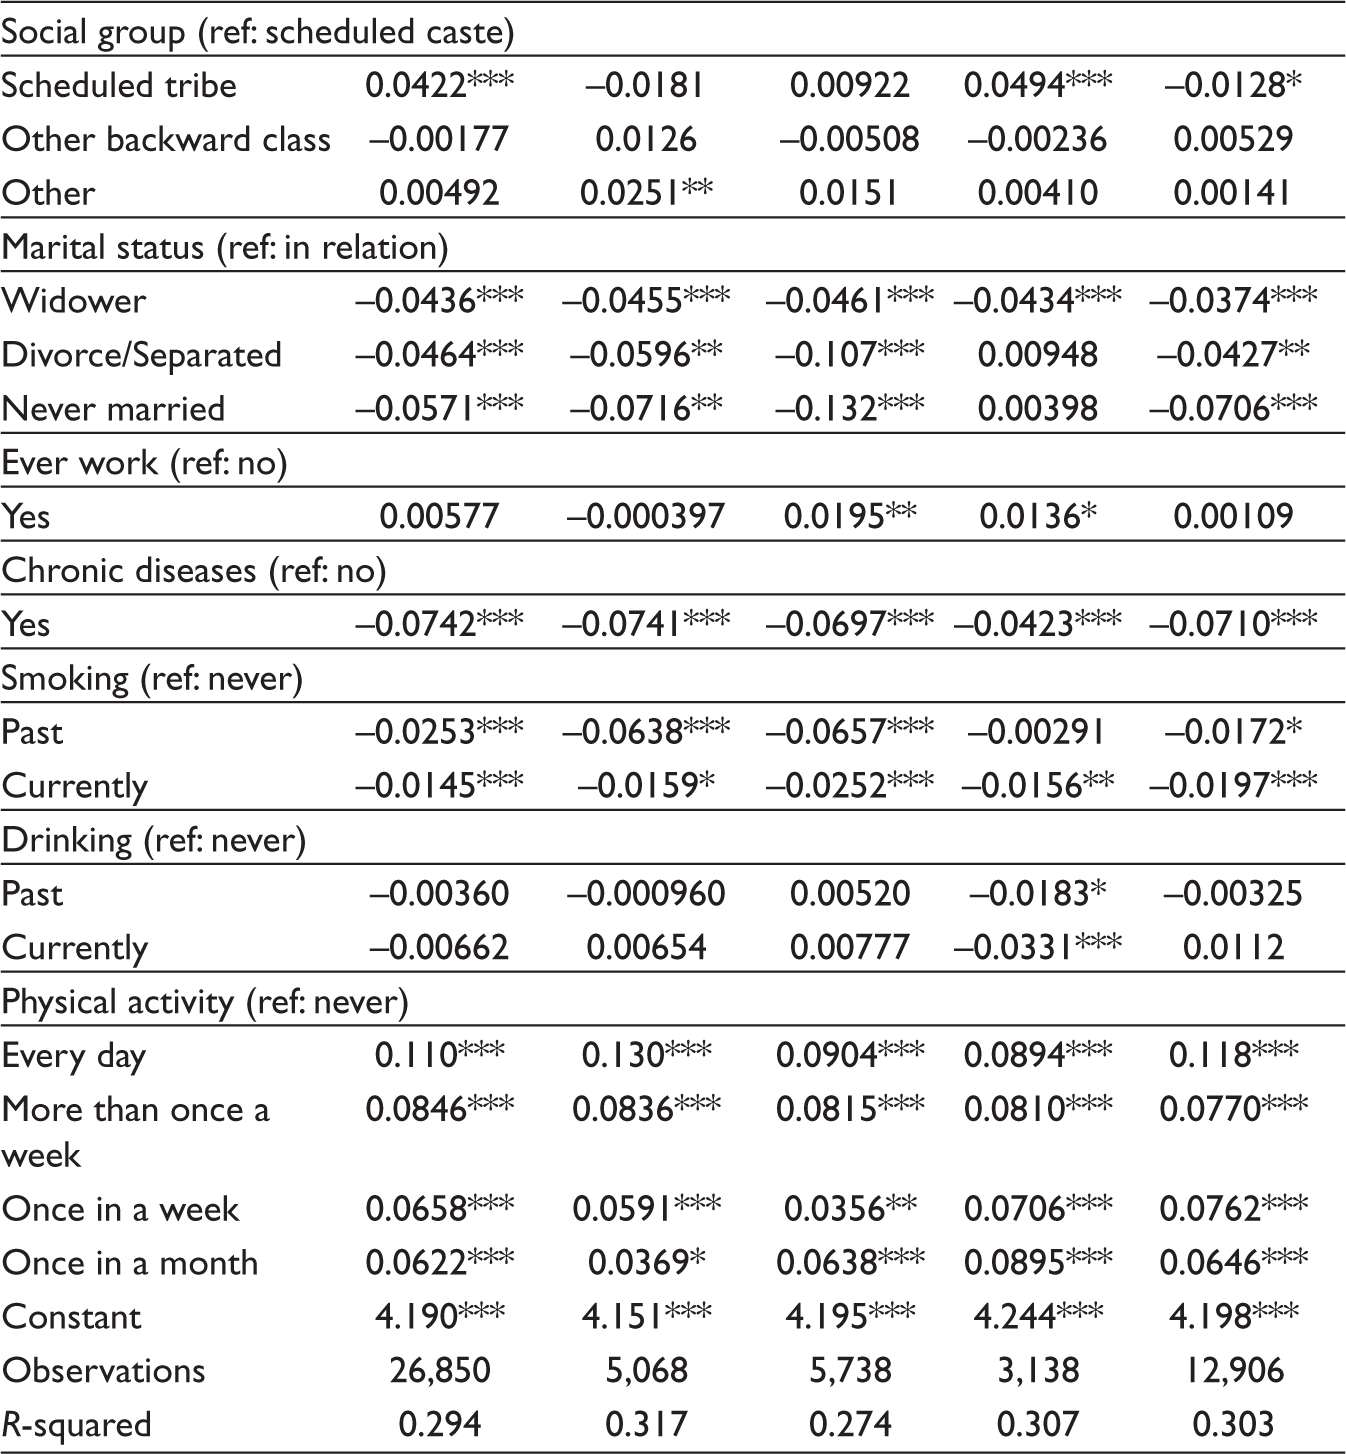
In South India and the BIMARU area, healthy ageing does not exhibit a significant relationship with the social group. But at the national level and in the North-east, scheduled tribes show a considerably higher HAS than other social groups. This surprising result is consistent with Irshad et al. (2022). A study in Latin America showed that compared to Europeans and Americans, the Tsimane tribe of Bolivia had better health at a later age, especially in terms of cognitive ability (Irimia et al., 2021). Tribes’ reliance on physical labour for survival, such as farming, hunting and fishing, may explain why they have relatively better health as they age.
Those currently in a relationship (married or living together) live more healthily than widowed or divorced people in India. Married people are less likely than divorced or separated people to experience mental health problems like depression (Cakar et al., 2011; Pandey, 2009), which could play a role in determining health status. It is also found that the elderly who worked at least three months in their entire lifespan have better health than those who never worked (Sarker, 2021).
In addition to socioeconomic determinants, the current study examined the role of behavioural factors on healthy ageing. Smoking is one of the behavioural factors that have a negative correlation with healthy ageing and is statistically significant in the states of South India and BIMARU. It is also consistent with other studies (Cramm & Lee, 2014; Södergren, 2013). Only the North-east region exhibits a statistically significant association between drinking behaviour and healthy ageing. It also demonstrates that those without chronic illnesses live more healthily than those who do. In India, the frequency of physical activity has been linked to healthy ageing, with older adults who engage in physical activity more regularly having better health than those who do so less frequently or not. The positive impact of physical activity on healthy ageing is well established in the literature (Hamer et al., 2014; Moreno-Agostino et al., 2020). The study based on the LASI pilot survey revealed a similar finding: smoking and physical inactivity harmed the health status of the elderly in India (Cramm & Lee, 2014).
The present study has some data limitations. First, this study is based on a single phase of India’s longitudinal study because only the first wave of LASI has been published. As biological age is the most significant determinant of health, comparing healthy ageing between individuals of different ages will not give the exact figure as comparing people with the same baseline age. Second, though this study incorporated all the domains of healthy ageing shortlisted by the WHO expert committee, some variables are not included because they are not in LASI, and some seem irrelevant to India.
Conclusions and Policy Suggestions
The current study assessed healthy ageing within the WHO framework and investigated inequalities and determinants across socioeconomic and demographic groups in different regions of India. The results confirmed that those with higher socioeconomic status have a significant advantage in healthy ageing. We also discovered that harmful health habits and chronic disease prevalence contribute to poor health ageing.
From a policy standpoint, the decade of healthy ageing is an ideal time to intervene to reduce socioeconomic disparities in health status and promote the well-being of India’s elderly population. To address this issue, the government should intervene in various ways. The priority should be to ensure financial security. The National Social Assistance Scheme offers specific social security programmes that support the elderly such as Indira Gandhi National Old-Age Pension Scheme, Indira Gandhi National Widow Pension Scheme and Annapurna. But a timely revision of the magnitude of these schemes is necessary as the central government’s share has been stagnant for years, while state governments’ shares are uneven. In addition, Atal Pension Yojana can also play a greater role in this area. The role of education in achieving healthy ageing has been established in this study. So lifelong education can be ensured by extending the National Literacy Mission to older adults. Kerala State Literacy Mission can be a model for the country. Promoting a healthy lifestyle and the early detection of NCDs will be crucial to healthy ageing. The NCD cells and clinics built to tackle the NCD burden can do more in this regard. Future policies and measures should focus on the poor, women, illiterates and rural residents, who are less likely to achieve healthy ageing in India.
Additionally, steps must be taken to make our nation more age-friendly, such as building age-friendly cities, retirement parks and other facilities. In 2012, Kolkata became the first age-friendly city in South East Asia, but there are no other models in the country.
Footnotes
Declaration of Conflicting Interests
The authors declared no potential conflicts of interest with respect to the research, authorship and/or publication of this article.
Funding
The authors received no financial support for the research, authorship and/or publication of this article.
Appendix
Variables and Domains Used to Create HAS.
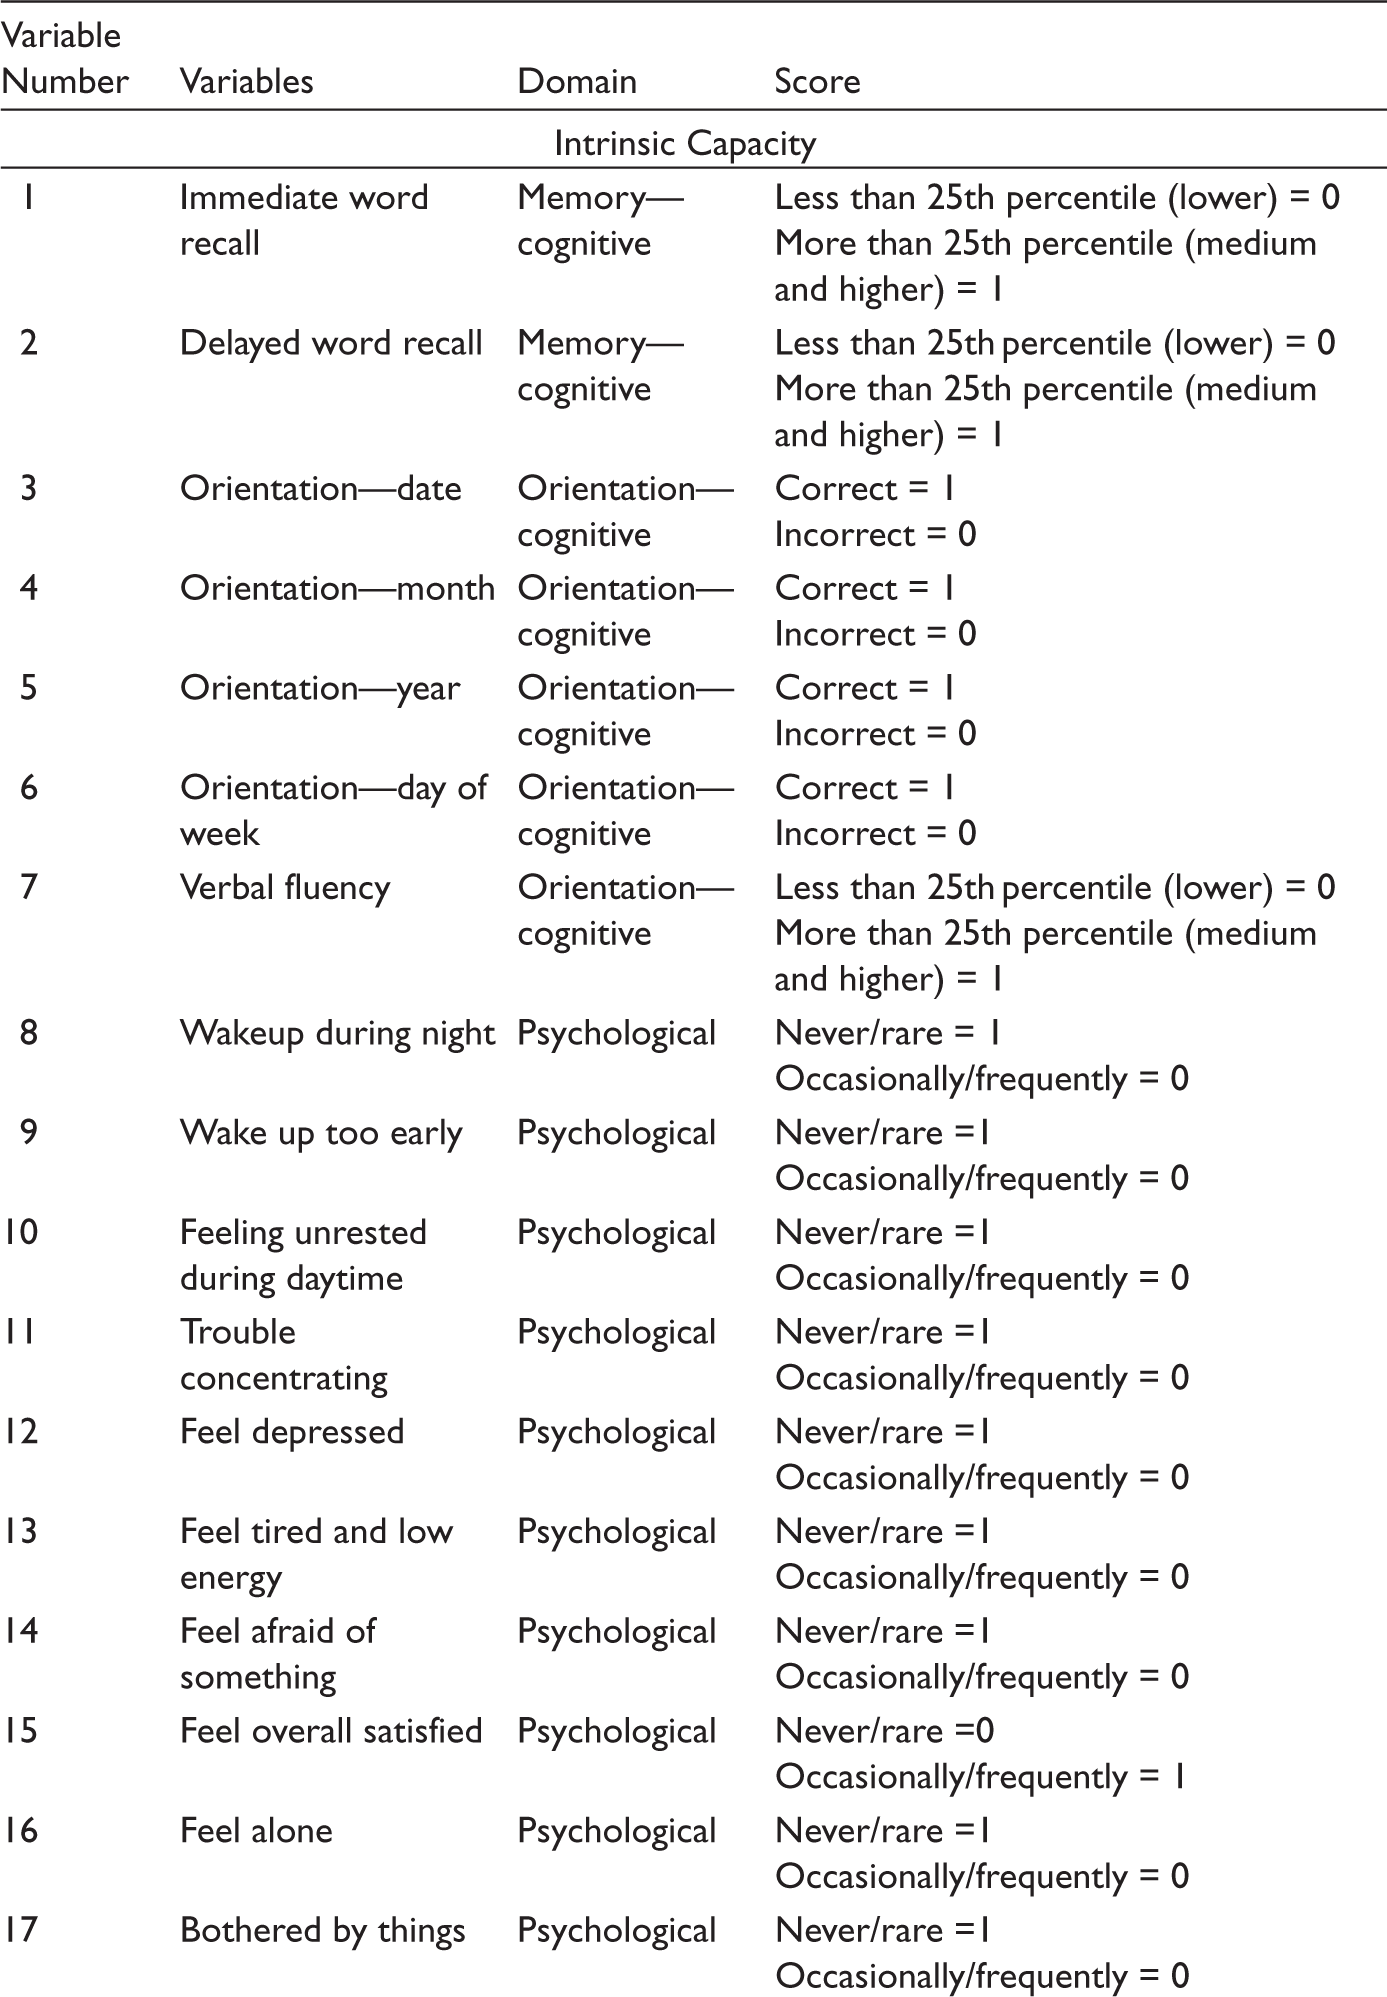
| Variable Number | Variables | Domain | Score |
| Intrinsic Capacity | |||
| 1 | Immediate word recall | Memory—cognitive | Less than 25th percentile (lower) = 0 More than 25th percentile (medium and higher) = 1 |
| 2 | Delayed word recall | Memory—cognitive | Less than 25th percentile (lower) = 0 More than 25th percentile (medium and higher) = 1 |
| 3 | Orientation—date | Orientation—cognitive | Correct = 1 Incorrect = 0 |
| 4 | Orientation—month | Orientation—cognitive | Correct = 1 Incorrect = 0 |
| 5 | Orientation—year | Orientation—cognitive | Correct = 1 Incorrect = 0 |
| 6 | Orientation—day of week | Orientation—cognitive | Correct = 1 Incorrect = 0 |
| 7 | Verbal fluency | Orientation—cognitive | Less than 25th percentile (lower) = 0 More than 25th percentile (medium and higher) = 1 |
| 8 | Wakeup during night | Psychological | Never/rare = 1 Occasionally/frequently = 0 |
| 9 | Wake up too early | Psychological | Never/rare =1 Occasionally/frequently = 0 |
| 10 | Feeling unrested during daytime | Psychological | Never/rare =1 Occasionally/frequently = 0 |
| 11 | Trouble concentrating | Psychological | Never/rare =1 Occasionally/frequently = 0 |
| 12 | Feel depressed | Psychological | Never/rare =1 Occasionally/frequently = 0 |
| 13 | Feel tired and low energy | Psychological | Never/rare =1 Occasionally/frequently = 0 |
| 14 | Feel afraid of something | Psychological | Never/rare =1 Occasionally/frequently = 0 |
| 15 | Feel overall satisfied | Psychological | Never/rare =0 Occasionally/frequently = 1 |
| 16 | Feel alone | Psychological | Never/rare =1 Occasionally/frequently = 0 |
| 17 | Bothered by things | Psychological | Never/rare =1 Occasionally/frequently = 0 |
| 18 | Everything was an effort | Psychological | Never/rare =1 Occasionally/frequently = 0 |
| 19 | Hopeful about the future | Psychological | Never/rare =0 Occasionally/frequently = 1 |
| 20 | Feel happy | Psychological | Never/rare =0 Occasionally/frequently = 1 |
| 21 | Distance vision problem | Sensory | Yes = 0 No = 1 |
| 22 | Near vision | Sensory | Yes = 0 No = 1 |
| 23 | Difficulty in hearing | Sensory | Yes = 0 No = 1 |
| 24 | Handgrip strength (right hand) | Vitality | Less than 25th percentile (lower) = 0 More than 25th percentile (medium and higher) = 1 |
| 25 | Handgrip strength (left hand) | Vitality | Less than 25th percentile (lower) = 0 More than 25th percentile (medium and higher) = 1 |
| 26 | BMI: measured | Vitality | Below and above normal = 0 Normal = 1 |
| 27 | Gait speed | Locomotor | Less than 25th percentile (lower) = 1 More than 25th percentile (medium and higher) = 0 |
| Functional Ability | |||
| 28 | Difficulty in walking | Mobility | Yes = 0 No = 1 |
| 29 | Difficulty in sitting (2 hours) | Mobility | Yes = 0 No = 1 |
| 30 | Difficulty in getting up from the chair | Mobility | Yes = 0 No = 1 |
| 31 | Difficulty in climbing stair | Mobility | Yes = 0 No = 1 |
| 32 | Difficulty in kneeling, crouching and stooping | Mobility | Yes = 0 No = 1 |
| 33 | Difficulty in extending arms | Mobility | Yes = 0 No = 1 |
| 34 | Difficulty in pushing large objects | Mobility | Yes = 0 No = 1 |
| 35 | Difficulty in lifting weight | Mobility | Yes = 0 No = 1 |
| 36 | Difficulty in picking up a coin from the table | Mobility | Yes = 0 No = 1 |
| 37 | Difficulty with dressing | Basic needs | Yes = 0 No = 1 |
| 38 | Difficulty with walking across the room | Basic needs | Yes = 0 No = 1 |
| 39 | Difficulty with walking | Basic needs | Yes = 0 No = 1 |
| 40 | Difficulty with eating | Basic needs | Yes = 0 No = 1 |
| 41 | Difficulty with getting in/out of bed | Basic needs | Yes = 0 No = 1 |
| 42 | Difficulty with using the toilet | Basic needs | Yes = 0 No = 1 |
| 43 | Difficulty with preparing a hot meal | Basic needs | Yes = 0 No = 1 |
| 44 | Difficulty with shopping for groceries | Basic needs | Yes = 0 No = 1 |
| 45 | Difficulty with making a telephone call | Basic needs | Yes = 0 No = 1 |
| 46 | Difficulty in taking medication | Basic needs | Yes = 0 No = 1 |
| 47 | Difficulty with doing work around the home | Basic needs | Yes = 0 No = 1 |
| 48 | Difficulty with managing money | Basic needs | Yes = 0 No = 1 |
| 49 | Difficulty with getting around, finding the address | Basic needs | Yes = 0 No = 1 |
| 50 | Meet relatives/friends | Maintain relationship | Yes = 1 (last one year) No = 0 |
| 51 | Employment status | Contribution | Yes = 1 No = 0 |
| 52 | Frequency of attending meetings of non-religious organisations | Contribution | Yes = 0 (last one year) Never = 1 |
| 53 | Help in any of household works | Contribution | Yes = 1 None = 0 |