
Abstract
This study examines the relationship between fatality risk (number of fatalities per 10,000 people), the level of motorization (number of vehicles per 10,000 people) and fatality rate (number of fatalities per 10,000 vehicles), and the real per capita GDP across Indian states and union territories. Two kinds of relationships—linear and log-linear—are examined. The study also aims to estimate the real per capita GDP after which the fatality risk shows a decreasing trend with further increase in per capita GDP. This inflection point is found out to be somewhere between ₹190,000 and ₹195,000 at 2011–2012 prices. We also found that, from 2015 to 2030, the number of road accidental deaths in India is expected to increase by 55%, whereas the vehicle stock in the country is likely to double.
Introduction
As economies proceed through the different phases of development, their death rates generally fall as with time, countries become better equipped to handle diseases and other life-claiming phenomena. However, the case with road traffic accidents (RTAs) is different. As low-income countries start developing, the incomes of their inhabitants start increasing and they can afford to buy vehicles to enable faster transportation.1,2,3 With increasing number of vehicles and inexperienced drivers on the roads in terms of education about traffic rules or drunken state of the driver as well as factors such as lenient traffic rules and penalties, it is seen that the rate of accidents and accidental deaths starts increasing. According to Akinyemi, 4 in the low and middle-income countries particularly, road traffic injuries are a major health concern globally. Over the years due to increased urbanization and motorization, unaccompanied by requisite infrastructure, safer vehicles, and road safety regulations enforcement, road traffic deaths in low-middle income countries has been rising. The African region has witnessed highest fatality risks over the years. The fatality risk was highest in this region at 24.1 and 20.6 per 100,000 population in 2010 and 2013, respectively. 4
On the other hand, the situation in industrialized countries is different. As these countries have more seasoned and experienced drivers and the authorities invest increasingly in road safety, the accident rate and hence the rate of deaths because of RTAs start decreasing after attaining a peak at a certain level of income.5,6,7 Hence, if we plot the fatality risk with real per capita income, we obtain an inverted U-shaped curve, analogous to the inverted U-shaped curve that we obtain for the environmental Kuznets curve in environmental economics. For example, Bishai et al. 5 in their study found that a 10% GDP increase in a lower-income country (GDP/Capita < $1,600) is likely to increase the number of road crashes by 7.9%, the number of traffic injuries by 4.7%, and the number of deaths by 3.1%; while in the case of developed countries they find that the negative relation between GDP and traffic deaths is due to lower injury severity and better ambulance service and medical care.
Basically, road safety is heavily determined by economic and social development levels: in developing nations, traffic-related death rates are generally higher than in developed nations. 8 “Precarious roads, old vehicles and low level of maintenance, inadequate legislation, incipient enforcement, extensive use of motorcycles and similar vehicles” are the economic factors contributing to higher road traffic deaths in developing nations, whereas, “stricter legislation and punishments, knowledge and respect for laws and traffic regulations on the part of the population, drivers, and pedestrians with better training, access to information on road crashes statistics” are the social factors contributing to higher standards of road safety in developed nations.9,10
Taking an example from India, 11 if we compare the road safety situation in a low-income state like Bihar (real per capita income of ₹27,000 in 2015) and a high-income state like Tamil Nadu (real per capita income of ₹129,000 in 2015), the quality of roads in Tamil Nadu is much better than that in Bihar. But, the fatality risk in Tamil Nadu (2.26 per 10,000 persons) is much higher than that in Bihar (0.53 per 10,000 persons). This points to the fact that as far as the Indian situation is concerned, higher-income states (which have better quality roads) have higher traffic fatality risk (because “speed causes death”). The situation in developed countries is different. In the advanced countries, with increasing income (better quality roads), fatality risk goes down. 12
Road traffic crashes worsen poverty in economies by causing loss of breadwinners for their respective families and inducing costs for treatment of persons injured in crashes. They reduce economic productivity and impede economic growth by removing a lot of people aged 15–44 years (the productive age group) from the workforce. For example, the World Health Organization (WHO) 8 had reported that there was a 3% loss in GDP in 2015 in Nigeria because of road traffic crashes. 4
The fatality risk in India has increased from 0.48 per 10,000 persons in 1992 to 1.18 per 10,000 persons in 2015. 11 The total number of road traffic fatalities (RTFs) has increased from 41,000 in 1992 to 148,000 in 2015, increasing 3.5 times in 23 years, thus growing at a compound annual growth rate (CAGR) of 5.7%, whereas the population has increased at a CAGR of just 1.7% over the same period. 11 Although, with economic development, the road safety status in some of the richer states and union territories is improving slightly (or worsening only slowly), the situation in the low-income states has been worsening alarmingly, leading to a deterioration in the overall status for India. 11 These statistics point towards the need to take immediate action as far as the road safety aspect is concerned or otherwise, we are likely to see even worse numbers in the future. Our study becomes important in the current Indian context where the road safety situation has been worsening steadily over the years.
In this study, we examine the relationship between traffic fatality risk, fatality rate, and vehicle motorization rate with that of economic development in the context of a developing country. Among several factors, most studies analysing traffic accidents and development, have considered development through economic factors, compared to social, demographic or vehicle-related factors.13,14 We have utilized public sector data of India at national level as well as state level to study the trends in traffic fatality risk, fatality rate, motorization rate, and GDP per capita over time, and understand the relation between economic development and traffic-related mortality and ascertain whether it shadows the expected inverted U-shaped relationship as per Kuznet’s curve.
For this study, a panel data from 1992 to 2015 are used for 32 states/union territories of India. Specifically, we deal with three important dependent variables: the fatality risk (F/P), the rate of motorization (V/P), and the fatality rate (F/V), where F stands for number of fatalities, V stands for total number of vehicles and P stands for the population of the state/union territory concerned. As far as the fatality risk is concerned, if we plot a graph of F/P versus real per capita GDP of states, we should expect to encounter an inverted U-shaped pattern. Fatality risk (F/P) can be expressed as the product of two quantities: the motorization (V/P) and the fatality rate (F/V). How F/P changes with time is dependent on how V/P and F/V evolve over time. In general, V/P increases with increasing income whereas F/V declines with increasing income. In developing countries, V/P increases more than F/V declines. Hence, the fatality risk, F/P, increases for lower levels of income. But at higher levels of income (i.e., in highly advanced countries), V/P increases less than F/V declines, thus leading to a reduction in fatality risk with income.
Literature Review
A logical framework for examining the above relationships can be found in the literature on Environmental Kuznets Curves, 15 according to which environmental quality decreases during early phase of economic development but increases in later stages. This phenomenon is usually shown as an inverted U curve between pollutants and per capita income, similar to what Simon Kuznets (1955) found to exist in the relationship of income inequality with per capita income.
Kopits and Cropper 1 in 2005, in their article titled “Traffic fatalities and economic growth”, have performed a road safety study using panel data for 88 countries during the years 1963–1999. They divided the entire dataset into 10 income groups and fitted a piecewise linear regression line to the data points. Using this curve, they found that the “inflection point for traffic fatality risk in these countries occurs at a real per capita income of $8,600 (measured at 1985 prices).” They performed this piecewise linear regression for fatality risk, motorization (vehicle ownership), and fatality rate using both linear and log-linear models and concluded that log-linear model fits the observed data points better. Next, using the log-linear model, the authors arrived at the predictions for the number of road accident deaths in different countries and geographic regions from the year 2000 to 2020. From these estimates, they concluded that if the “developing countries like India follow historical trends, it would take many years for them to achieve the low levels of fatality risks” that are being experienced currently in the developed countries, pointing towards the urgent need to take appropriate and immediate actions in the domain of road safety policies in developing countries for controlling the traffic fatalities.
Akinyemi 4 has examined the short-term as well as long-term relationship between the number of road traffic crashes, fatalities, injuries with that of GDP in Nigeria by applying autoregressive distributed lag (ARDL) method to co-integration considering data for a span of 26 years from 1991 to 2016. Results showed that in the short-run a significant effect of GDP was noticed only on fatalities and injuries, whereas, in the long run, it had significant effects on crashes, fatalities as well as injuries. “In the short-run, fatalities decline with GDP and there is a negative impact of GDP on injuries post-three-year time lag. In the long run, number of road traffic crashes and fatalities decrease with GDP whereas injuries increase with GDP.” From their study on short versus long-term relationships between traffic accidents, fuel consumption and GDP per capita over the period 1970–2013 for Algeria, Bougueroua and Carnis 12 concluded that per capita GDP had a significantly positive influence on number of traffic crashes in short as well as long term. He et al. 16 examined the relationship between gross regional product (GRP), RTFs, and crash fatality ratio (CFR) for Russia over the period 2001–2011. GRP increase was observed to have a negative effect on RTF and CFR. A study by Law 2 analysing panel data for 90 countries over 1963–2009 found out that there was an indication of “inverted U-curve relationship between number of road deaths and per capita income.”
He 17 analysed state-level panel data for the United States over the period 2003–2013 and found out that there was “a statistically significant negative relationship between fatality risk and unemployment rate.” After analysing reduction in traffic fatalities in the United States in the year 2008, Kweon 3 concluded that there was a strong correlation between annual changes in unemployment rate and consumer price index and those in number of road traffic crashes and fatalities. According to Al-Reesi et al., 18 there was a direct relationship between RTFs and motorization rate in Oman over the period 1985–2009. On the contrary, a study by Yannis et al. 19 discovered a negative relationship between fatality risk and motorization for the European Union countries over the period 1970–2002. Bishai et al. 5 examined the relationship between fatality risk and GDP per capita in both rich and low-income countries. The conclusion of their study was that fatalities increased with economic growth in the lower-income countries but decreased with economic growth in the higher income countries. Coming to the case of developing countries, Garg and Hyder 20 using linear regression found “an inverted U-shaped association between net domestic product and the injury and death rates in India.” Wiebe et al. 21 conducted a causal study for Botswana and Zambia and came to the conclusion that there was a positive relationship between GDP growth and traffic fatalities with a time lag of three years.
Parsekar et al., 22 in 2015, in their paper titled “Road safety in India: a public health concern”, have given an overview of road safety in India. They have elaborated upon trends of fatalities, factors responsible for RTAs, adverse effects of RTAs and discussed about prevention of RTAs. They stated in their study that RTAs are one of the major preventable public health problems in the country and that RTAs have been on the rise due to several factors like increasing number of vehicles, lifestyle changes and risky attitudes. According to them, the “fatality risk in South Asia was 10.2/100,000 persons in 2000, which was being expected to increase to 18.9/100,000 persons by 2020.” Deutsche Welle Report suggests that India reports the highest number of road accidents globally, and also the highest number of deaths resulting from road accidents. The number of deaths reported due to RTAs in India is almost 150,000 annually. This accounts for 6% of the global road accident fatalities, whereas India’s share in number of vehicles globally is only 1%. As far as the number of RTAs and number of fatalities due to RTAs are concerned, India has surpassed even China, world’s most populous country. Globally, every hour around 40 people aged below 25 die due to RTAs, out of which 14 are from India alone. Number of fatalities due to RTAs in India is twice that of the number of fatalities due to all deadly diseases, like cholera, malaria, HIV, etc., put together. As far as the factors responsible for RTAs are concerned, the authors have stated that there are three kinds of factors: human, vehicular, and environmental. The authors have finally concluded by saying that RTAs cause a number of adverse effects which can be classified broadly into four categories: economic, physical, psychological, and social.
In India, the road safety situation is bad, if not awful. But the advanced countries like the European Union countries, USA, Israel, etc., have much better road safety situations (for details, see, for example, Bester,
23
Lassarre,
6
Beenstock and Gafni,
24
and van Beek et al.
7
). Hence, it is important to understand the road safety policies of these advanced countries and to understand what they are doing right, so that we can learn from them and make attempts to improve the situation in India. In this context, we cite an article by Kaltenegger, Salamon and Furian,
25
published in 2018, titled “European road safety policy 2016–2020: a forecast on topics and activities.” The authors have mentioned that the number of RTFs in Europe was 25,671 in 2016. They have stressed that despite the road safety achievements of the past, there is still a need to reduce the number of fatalities and injuries due to road traffic. They have attempted to come out with the topics and activities of road safety policy that will dominate the European road safety agenda for the next few years. According to them, the following activities can be expected in the European Union for the next few years:
education and training of road users, increased enforcement of road rules, use of safer road infrastructure and safer vehicles, use of modern technologies to improve road safety (such as C-ITS, Cooperative Intelligent Transport Systems, which enable vehicles to communicate between themselves as well as with the road infrastructure), emergency and post-injury services, and protection of vulnerable road users.
The total surfaced road network of India has reached 49.971 lakh kilometres in 2017 (comprising 120,494 kilometres of national highways and 175,036 kilometres of state highways). Though, national and state highways constitute only about 2.4% and 3.5% of total road network respectively, but carry almost 40% and 25%–30% respectively, of the total road traffic. Further, India’s rank in comparison to peer economies (China, Malaysia, Russia, etc.) on almost all transport infrastructure indicators (both quality or quantity) remains dismal. Global Competitiveness Report released by World Economic Forum ranked India 63rd, 76th, and 51st out of 140 countries in terms of overall infrastructure, road connectivity index, and quality of roads, respectively. 26 While, the fatality risk and RTFs in India have increased over time, growing at a CAGR of 5.7%, whereas the population has increased by just 1.7%. Gradually, with economic development, the road safety status in some of the richer states and union territories is improving slightly (or worsening only slowly), however, the situation in the low-income states has been worsening, leading to an overall deterioration at national level. 11
Research Methodology
Statistical Models
A total of 738 data points were generated by pooling in all the data from 1992 to 2015 for all the states and union territories of India, barring the ones for which GDP data are not compiled. We have calculated data for Fatalities/10,000 Persons, Vehicles/10,000 Persons, and Fatalities/10,000 Vehicles; and divided this panel data into five income groups and used Stata to perform piecewise linear regression. We have allowed the slope to vary by income interval. We sorted the data according to the per capita real GDP and chose the first three income intervals by taking every 20th percentile point of the per capita real GDP from the dataset. The last two income intervals were chosen by fine-tuning the models and observing the farthest point from which the fatality risk starts to decrease. Hence, income intervals are chosen based on changes in trend in fatality risk. Accordingly, the income intervals for the linear models are ₹1–₹30,533, ₹30,533–₹40,850, ₹40,850–₹54,644, ₹54,644–₹190,008 and above ₹190,008. For the log-linear models, we have used the same income intervals except for the last two income intervals which are ₹54,644–₹194,993 and above ₹194,993.
Data Used in the Analysis
The number of fatalities and population for each state/union territory were obtained from the reports of “Accidental Deaths and Suicides in India” published by the National Crime Records Bureau, Ministry of Home Affairs, Government of India, New Delhi. 27 The data related to the number of vehicles for each state/union territory were obtained from the “Road Transport Year Book (2015–2016)” published by the Ministry of Road Transport and Highways (MoRTH), Government of India. 28 Data related to real GDP of Indian states and union territories were obtained from the “Handbook of Statistics on Indian states” published by the Reserve Bank of India. 29
Findings
Scatter Plots of the Three Dependent Variables with Income
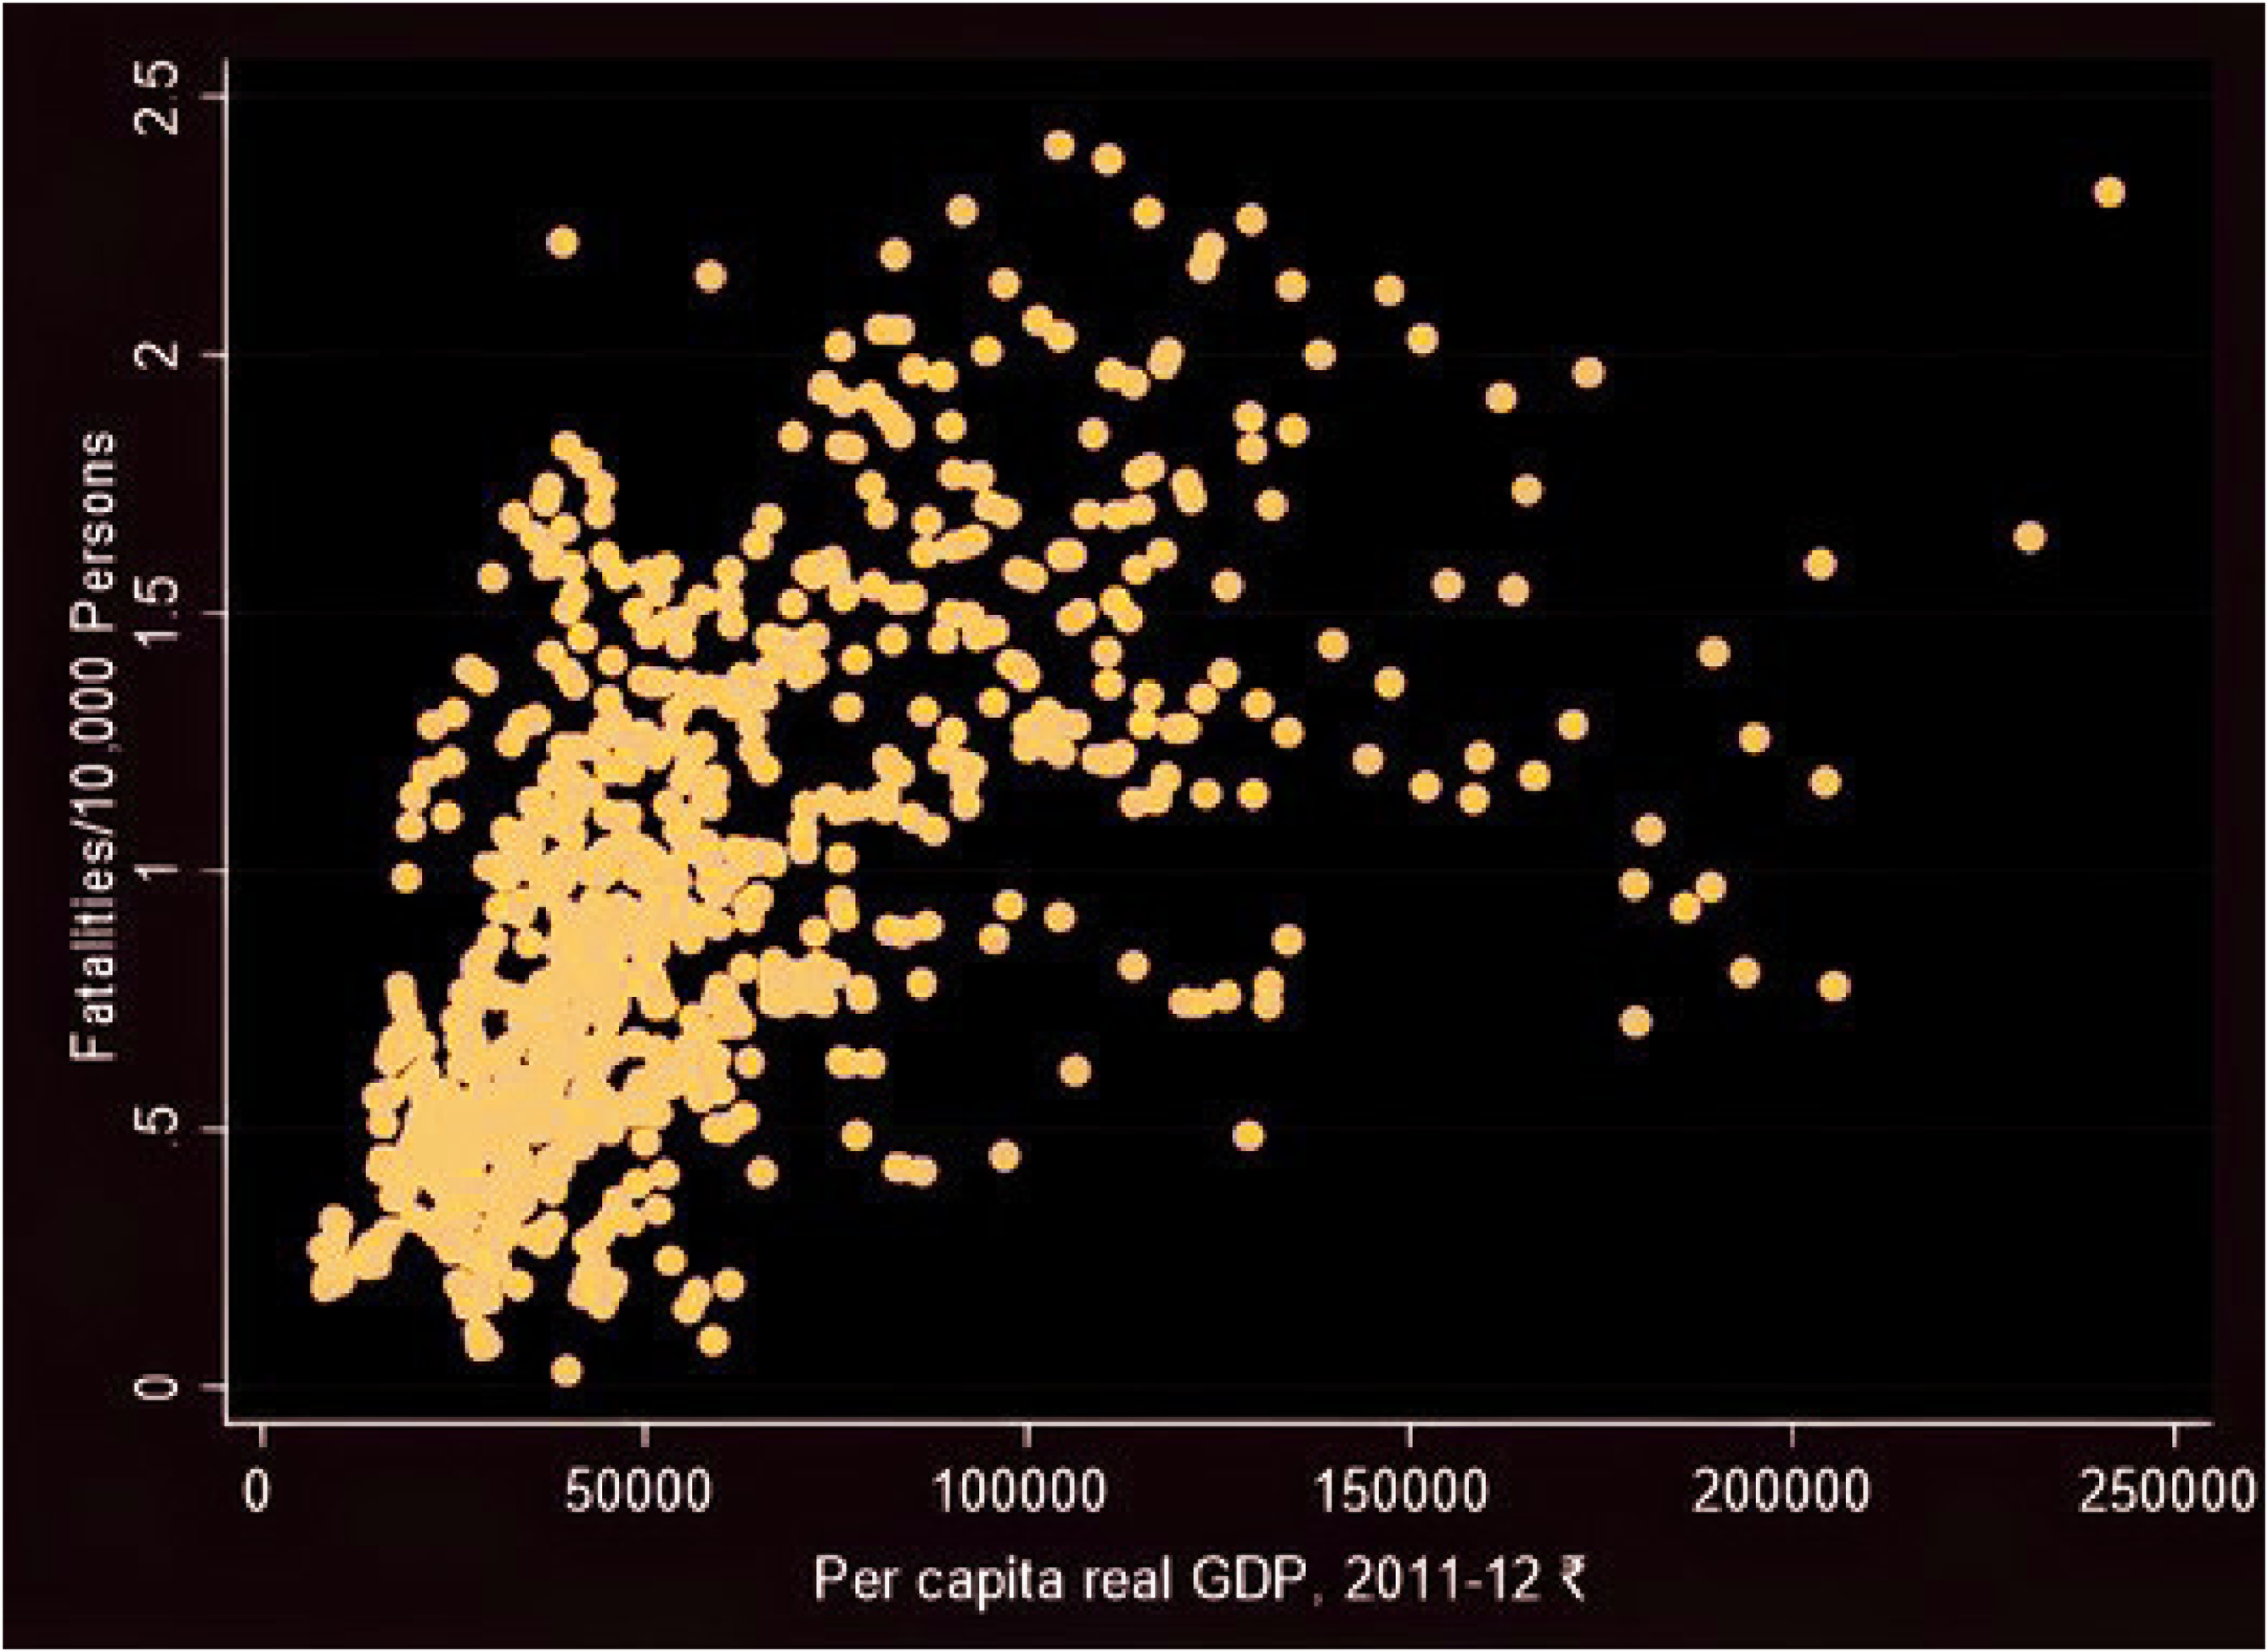
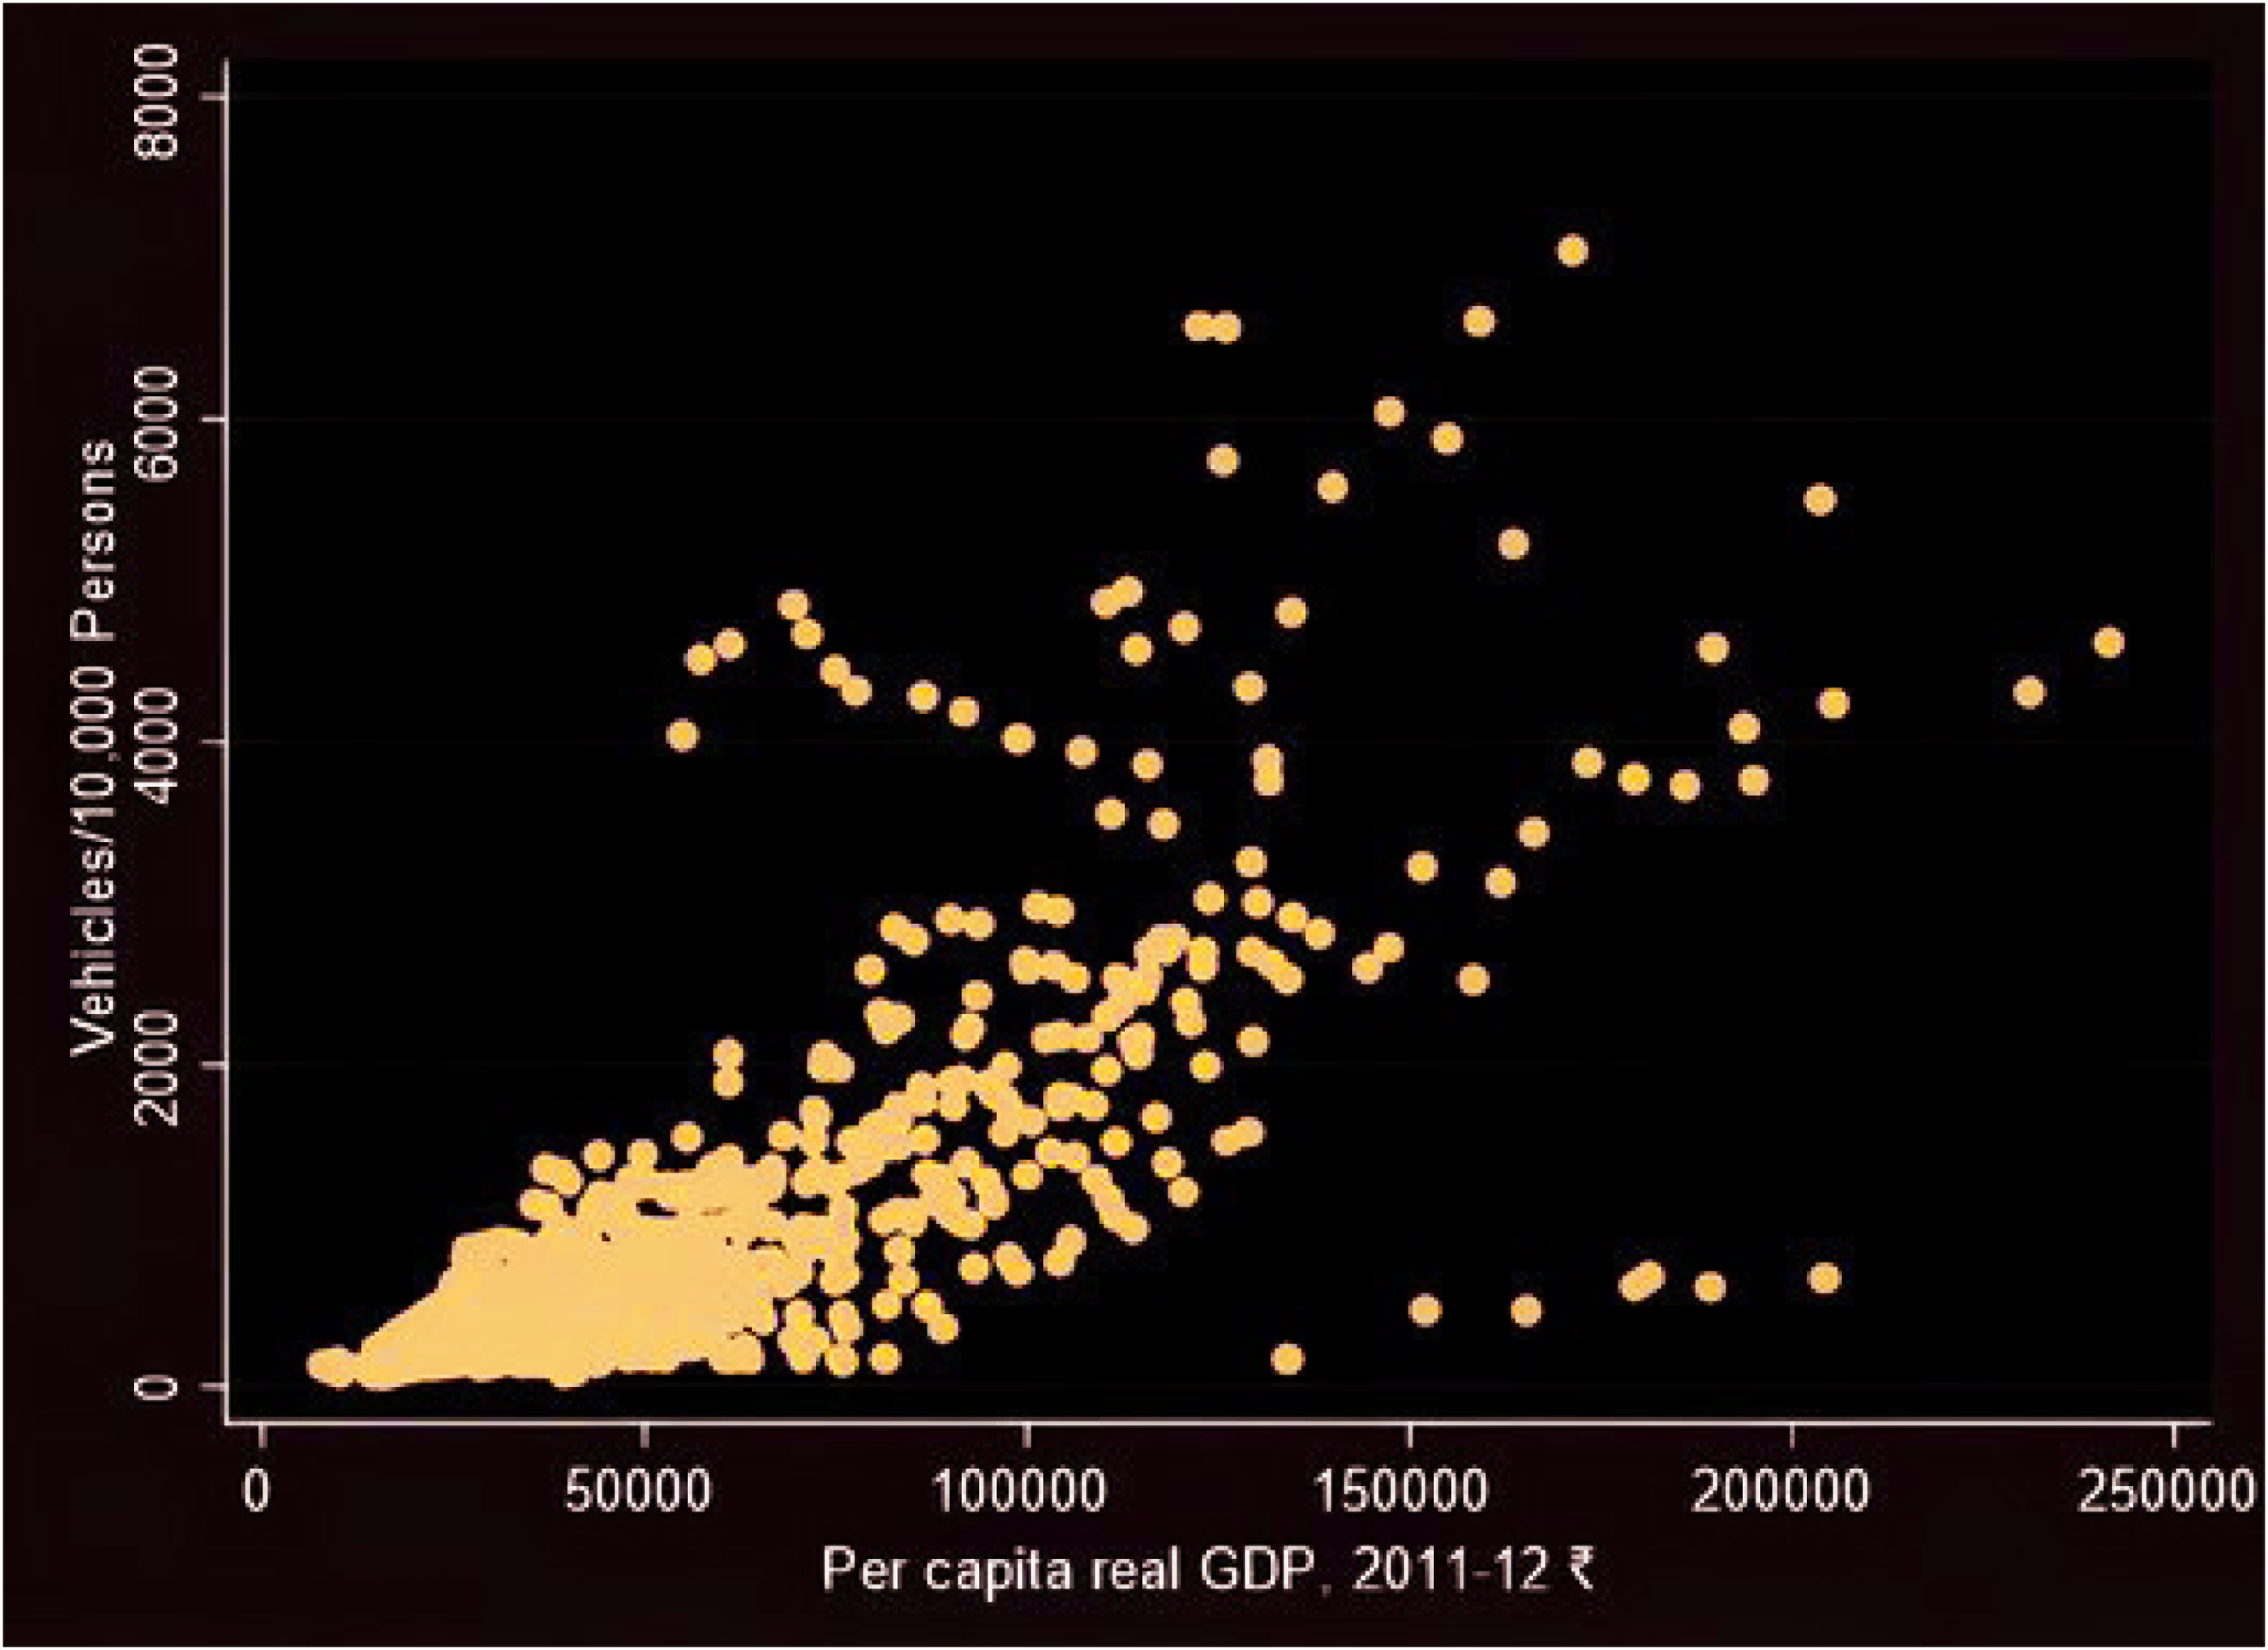
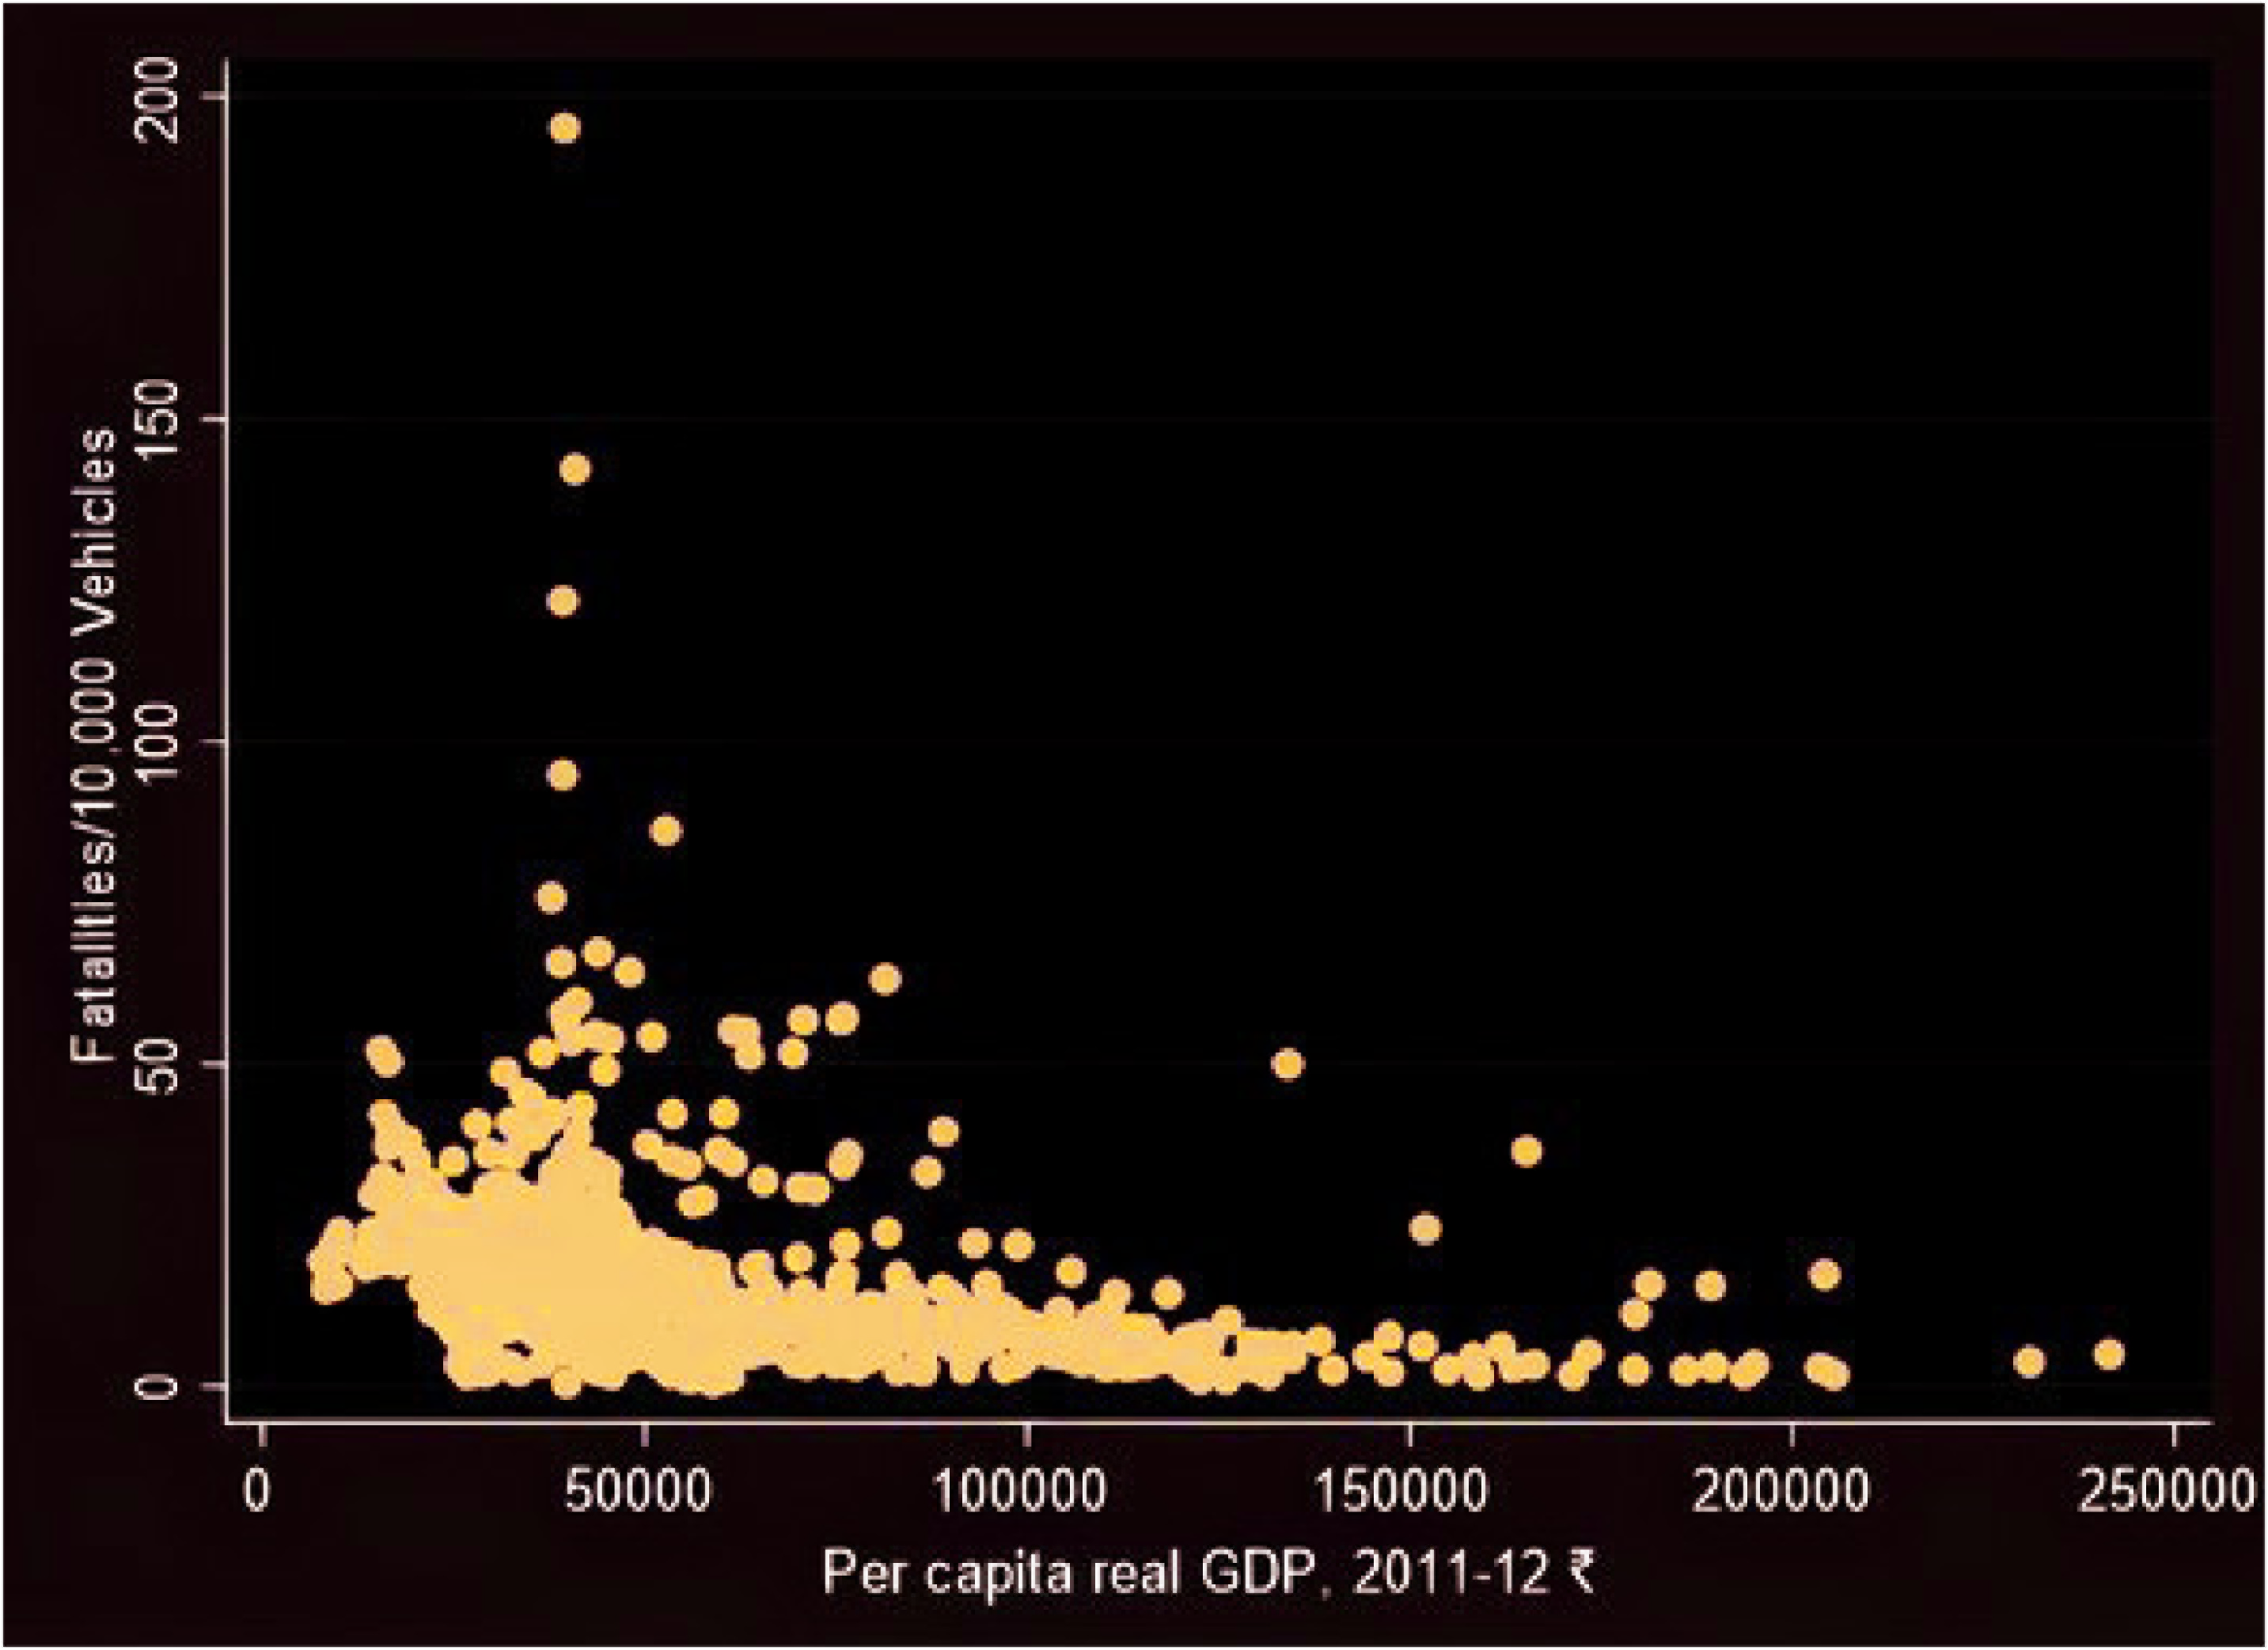
Figures 1, 2, and 3 display the scatter plot of the three dependent variables (F/P, V/P, and F/V) with real per capita GDP, pooling together the complete data for all the states/UTs and years in our dataset containing 738 data points.
Figure 1 shows that F/P or fatality risk follows an inverted U-Shaped curve with respect to per capita GDP across Indian states and union territories, where initially the fatalities steeply increase as the per capita income rises, however, it gradually starts declining after attaining a peak as income levels further increase.
As Figure 2 reveals, V/P is an increasing function of income. This happens because as the average income of people increases, a higher proportion of the population is able to purchase motor vehicles.
In Figure 3, we can observe that, in general, F/V declines monotonically with increase in per capita income. This happens because as regions develop, a higher proportion of on-road drivers are experienced and less likely to be involved in accidents and fatalities. Also, a higher proportion of travellers are less likely to die in an accident when they are vehicle drivers and passengers rather than pedestrians. Further, as economies develop, people shift to safer vehicles and safer roads, and governments invest more in road safety, thus bringing down the F/V variable with increasing rate. Since fatality rate depends on driving license policies, road safety rules, regulations and implementation, availability of public transport, etc., there are some significantly different F/V values for the same per capita GDP level as observed. However, in general, F/V declines monotonically with increase in per capita income.
F/P is a product of two components, V/P and F/V. Thus, a change in F/P reflects the changes in the two variables, V/P and F/V. As discussed earlier, we know that the first component, V/P, increases with income, though initially rapidly and then slowly, whereas the other component, F/V, decreases monotonically with income. As a result of these trends, we observe that F/P first increases with per capita income and then, after attaining a peak, starts declining with further increases in income. This inverted U-shaped pattern for F/P can be seen in Figure 1.
The Statistical Models Relating the Dependent Variables with Income
We need to perform a spline (piecewise linear) regression of the three dependent variables with the per capita income. When we expect the slope of a regression equation to shift up or down, or even change sign, at a particular value of the predictor, regression splines often give better results than polynomial regression. This is because, unlike polynomials, which must use a high degree polynomial to produce flexible fits, splines introduce flexibility by increasing the number of knots but keep the degree fixed. Hence, we used spline regression in this study. In Stata, we have the provision of a method for performing piecewise linear regression. We just need to specify the knots and Stata does the spline regression for us.
However, before performing the regression, we need to check for problems like heteroscedasticity and autocorrelation in our panel data. We checked for heteroscedasticity in the data by using the likelihood-ratio (LR) test and for autocorrelation using the xtserial program in Stata.
Checking for Heteroscedasticity
The LR test was used for checking the heteroscedasticity in the dataset. We found evidence of heteroscedasticity in all the three dependent variables, fatality risk, motorization, and fatality rate.
Checking for Autocorrelation
For testing the autocorrelation in the data, we used the Wooldridge test for first-order autocorrelation in panel data. We found no evidence of autocorrelation in any of the three dependent variables of our interest.
Hence, it is clear that in our panel dataset, we need to correct for heteroscedasticity but need not worry about autocorrelation. We got rid of heteroscedasticity using an appropriate suffix to the regression commands and obtained heteroscedasticity-corrected standard errors.
Performing Spline (Piecewise Linear) Regression Using Stata
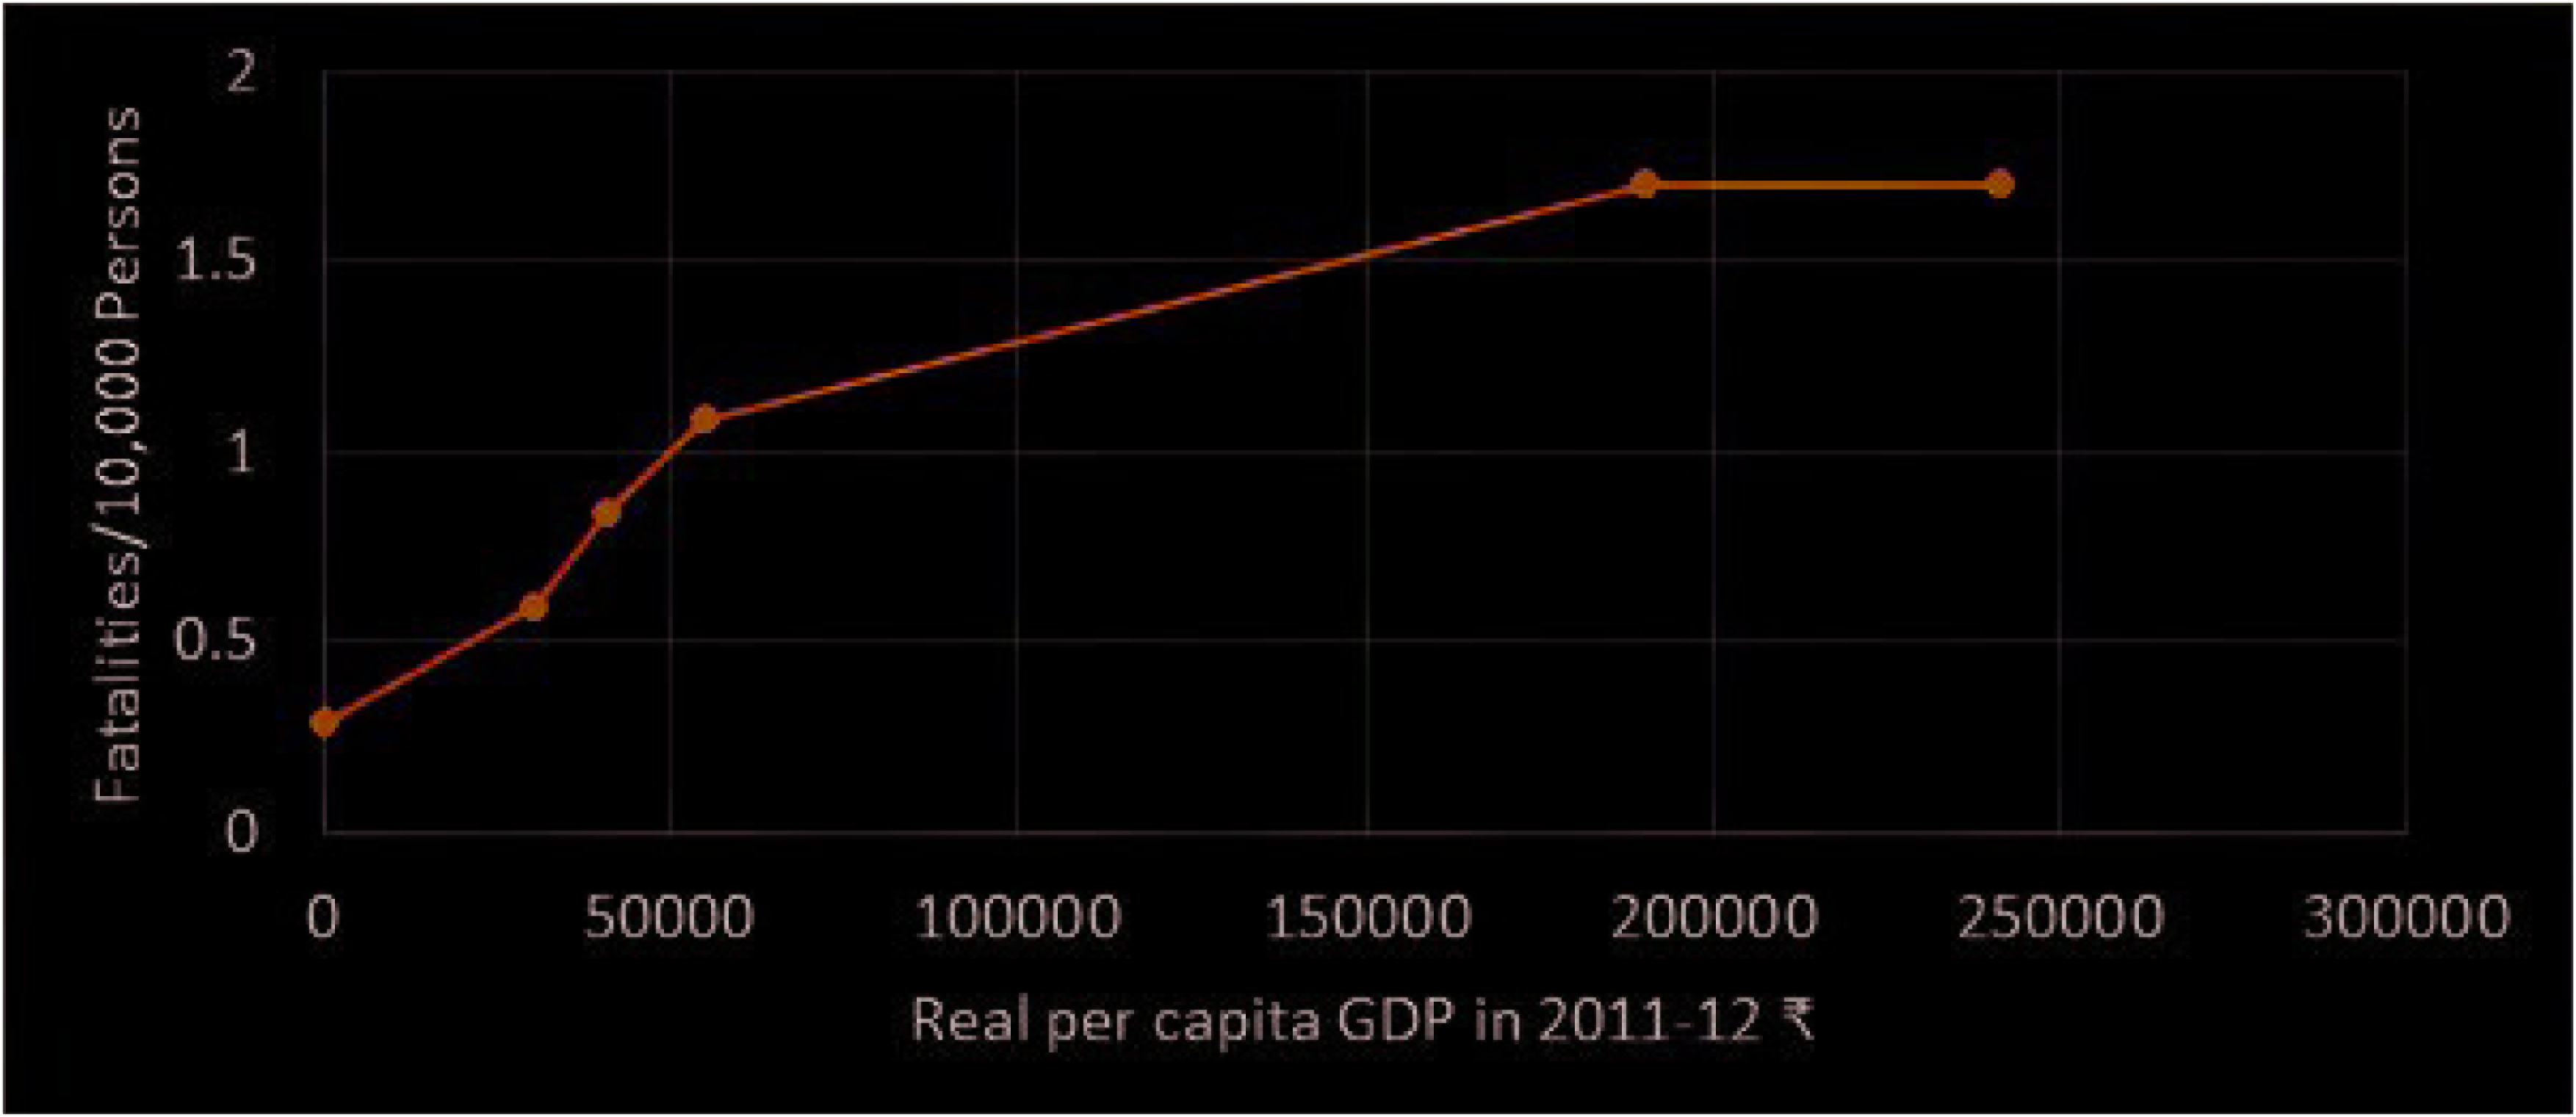
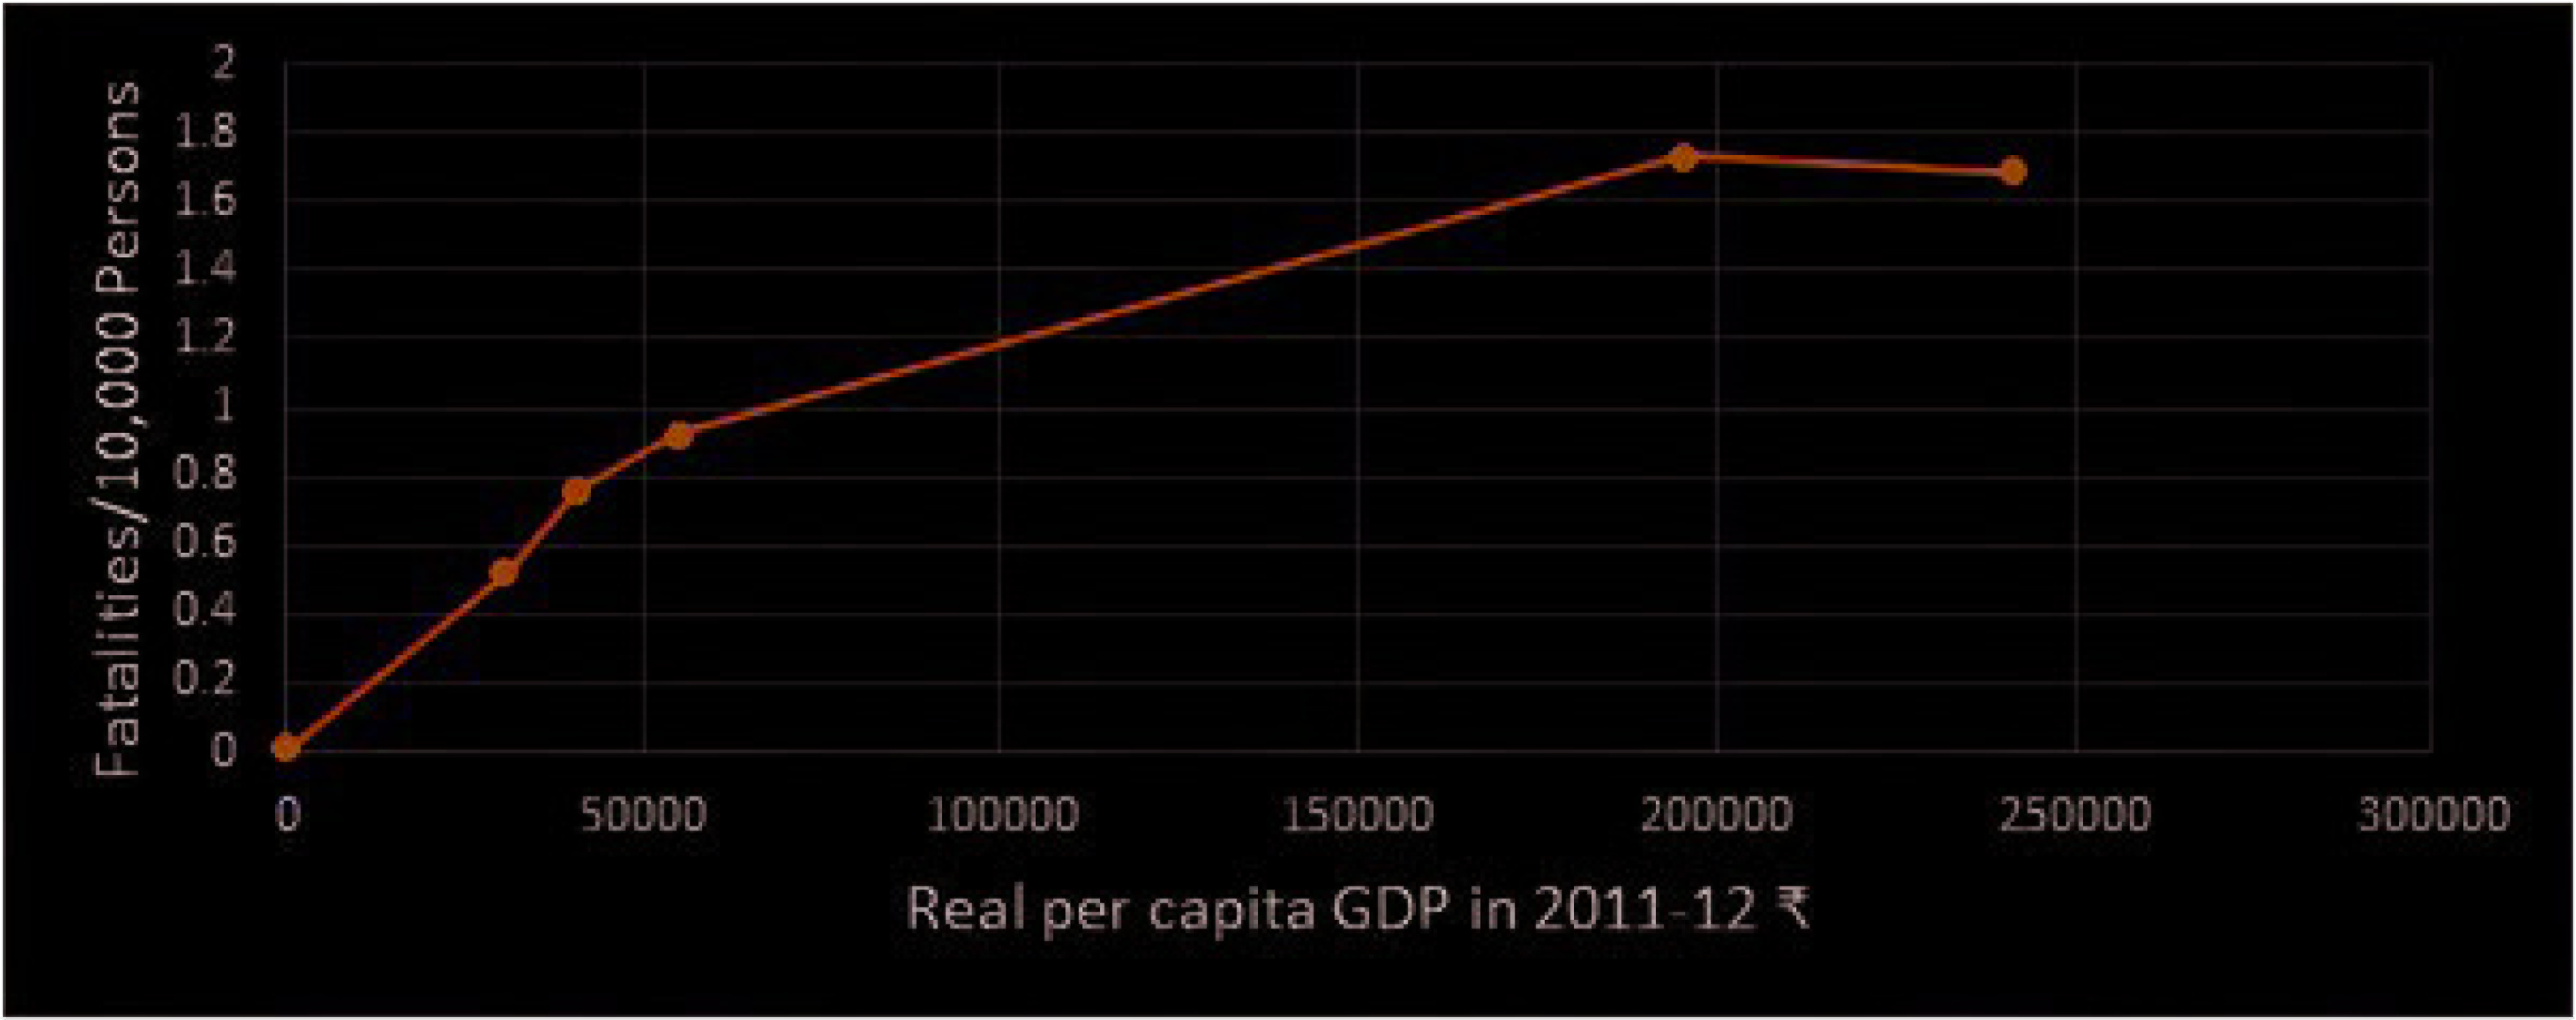
We performed piecewise linear regression after dividing the dataset into five income intervals. Tables 1 and 2 present the linear and log-linear regression results, respectively. There are three dependent variables—F/P, V/P, and F/V. Dependent variables are regressed on an independent variable, per capita GDP (at 2011–2012 prices). Tables 1 and 2 show the coefficients and heteroscedasticity-corrected standard errors for the three dependent variables. Results reveal that almost all the coefficients are statistically significant at 5% level of significance. Figures 4 and 5 present the fatality risk trend using linear and log-linear model, respectively. From Figures 4 and 5, it can easily be deciphered that the income level beyond which the fatality risk starts declining is ₹190,008 as per the linear model and ₹194,993 as per the log-linear model.
Linear Regression Results
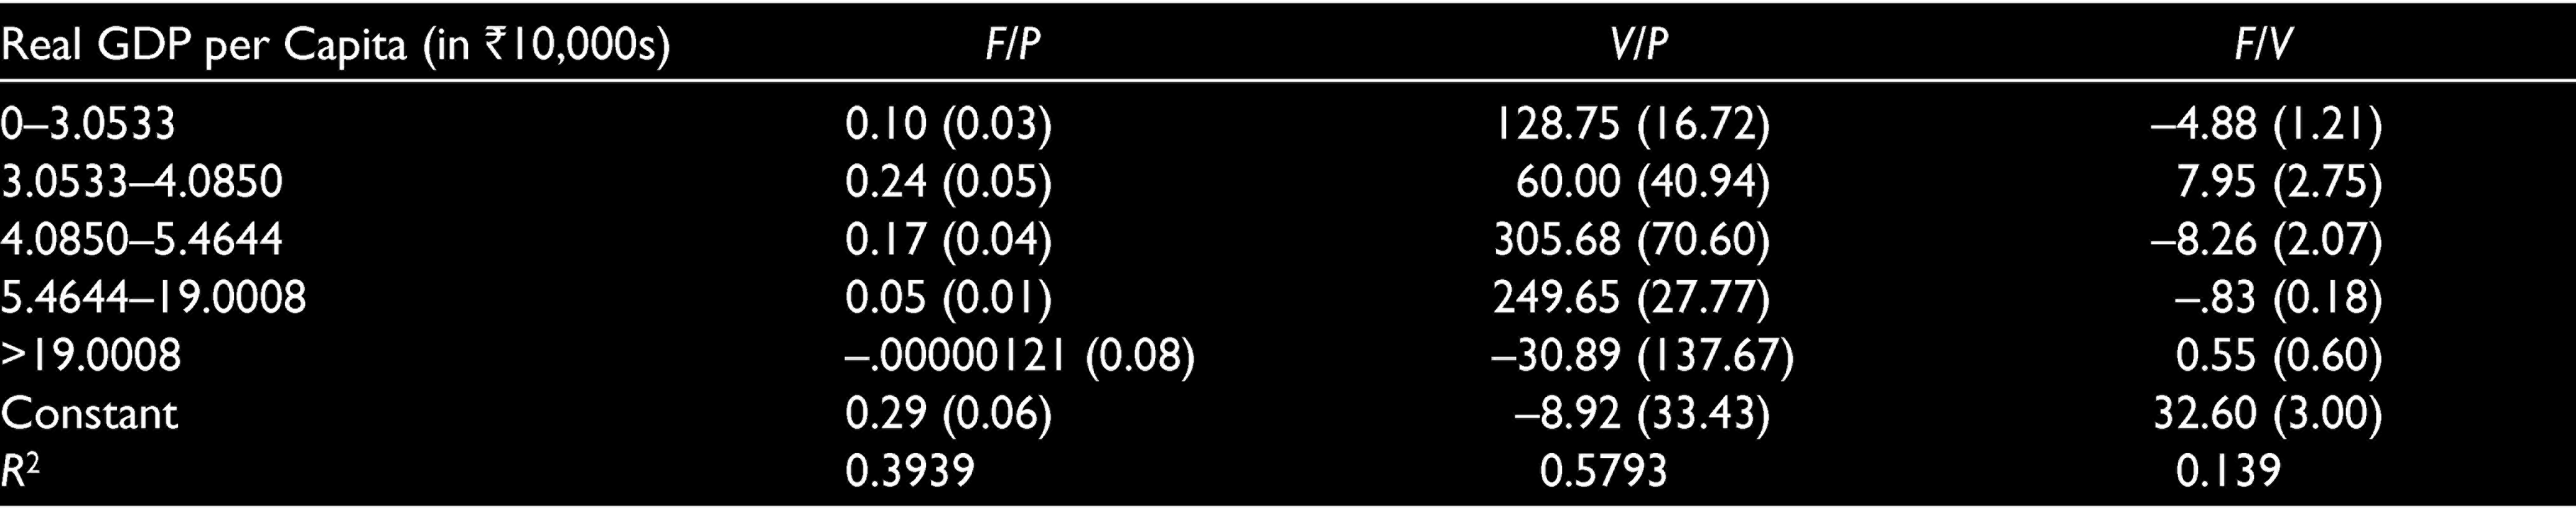
Independent variables: Per capita GDP.
Heteroscedasticity-corrected standard errors are reported in parentheses.
Log-linear Regression Results
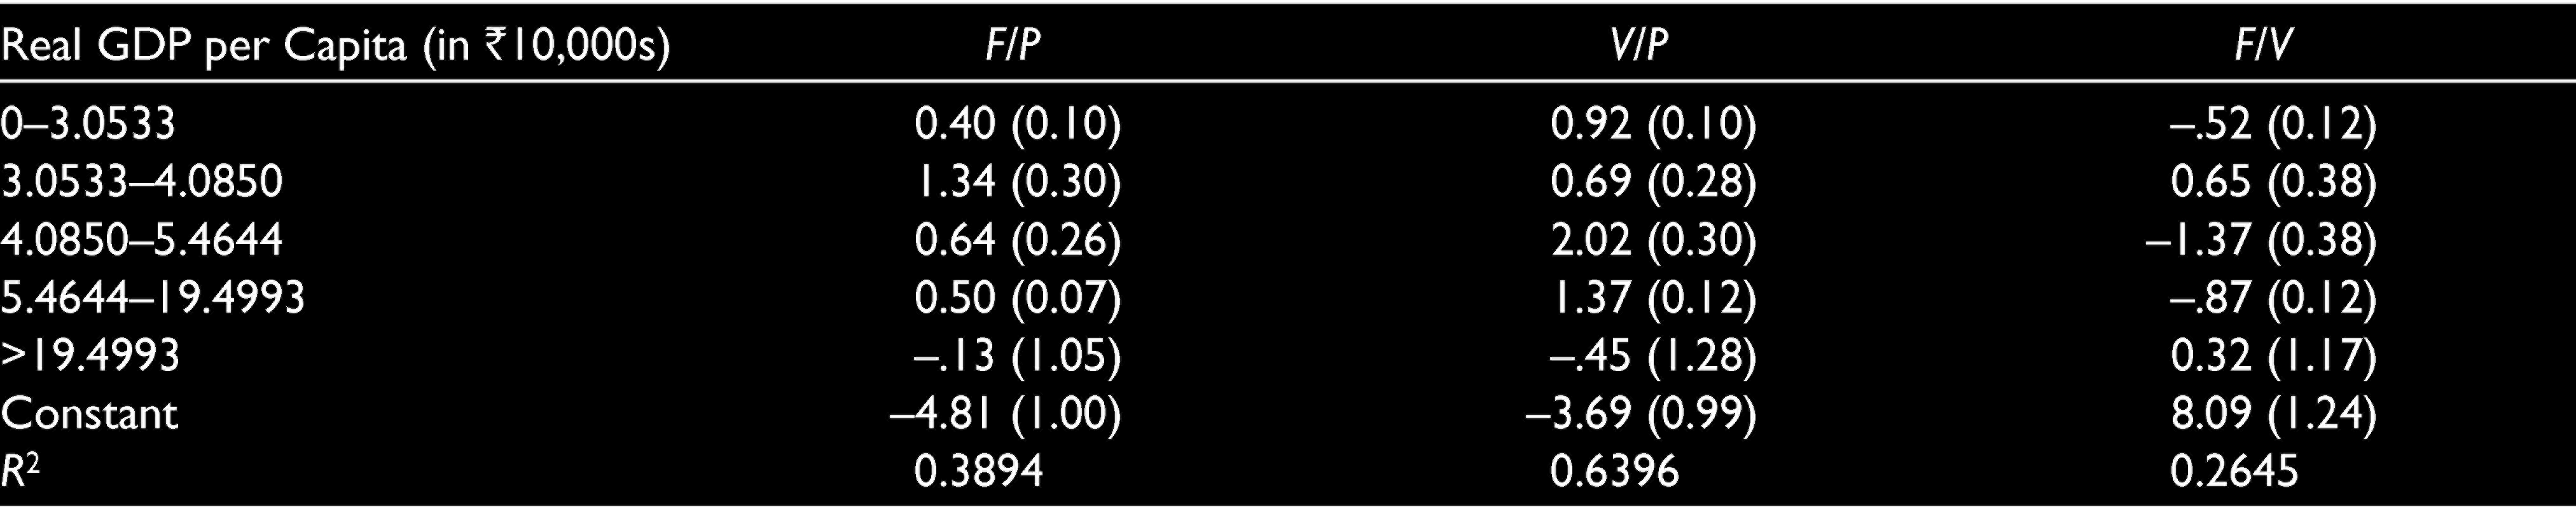
Independent variables: Per capita GDP.
Heteroscedasticity-corrected standard errors are reported in parentheses.
Projections of Future Traffic Fatalities
We have used the log-linear estimated model to project the number of traffic fatalities in forthcoming years. For this, we first forecasted the fatality risk for the future years, given the forecasts of the real per capita GDPs. Then, we multiply these F/P values with respective forecasts of population to get the future traffic fatalities for each state and UT in the country.
We found that the number of road deaths in India is expected to increase by 55% in a span of 15 years, if historical trends continue. One may note that the projection assumes that the income elasticity in the highest spline segment calculated from the regression also holds good for higher incomes. It is worth noting that although the traffic fatalities level for the whole of India rises by around 55% from 2015 to 2030, the trend varies considerably across different states and union territories. For example, the number of road deaths is expected to increase by as much as 144% over the said period in a low-income state like Bihar, whereas, it is expected to increase by just 17% in a comparatively richer state like Tamil Nadu. Among the poorer states, traffic fatalities are expected to increase by 144% in Bihar, 92% in Rajasthan, 87% in Madhya Pradesh, and 82% in Uttar Pradesh. Forecasted values are more or less same even when we use linear estimated model for the same.
Conclusion
We found that the level of per capita GDP beyond which fatality risk starts declining in Indian states and union territories is approximately ₹2 lakhs (at 2011–2012 prices). From the results, it is clear that if the states of a developing country like India follow historical trends, it will take a lot of time for most of the lower-income states to achieve the low levels of fatality risk that are currently being observed in a few high-income states of the country. This is because the per capita income level at which fatality risk (F/P) starts declining is ₹2 lakhs, whereas the present per capita incomes of the poorer states in India are much below that level (e.g., Bihar had a per capita income of only ₹27,000 in the year 2015). Also, ceteris paribus, traffic fatalities in India are likely to increase by 55% from 2015 to 2030. By 2030, around 225,000 people are likely to die annually due to road accidents in the country. Hence, there is an urgent need to look into the problem of RTAs and start pursuing active road safety policies to bring down the traffic fatality risk in India. The predictions in this article and the estimate of per capita GDP at which fatality risk is expected to start declining in the Indian states assume that the road safety policies that were in place from 1992 to 2015 will continue in the future. It was also assumed that poorer states would adopt road safety policies in the future at the same rate as that of high-income states, which may not be true. The fatality risk in poorer states may be reduced faster by employing futuristic policies whose effects have not yet been reflected in the data used for the present study. For example, in future policies may attempt to operationalize traffic-calming measures, differentiate between pedestrian traffic and vehicular traffic, comply with the rules made for driver and passenger safety, etc. Therefore, the recent measures taken in the field of road safety by the central as well as most of the state governments must be welcomed. These measures are likely to save many lives.
Footnotes
Declaration of Conflicting Interests
The authors declared no potential conflicts of interest with respect to the research, authorship, and/or publication of this article.
Funding
The authors received no financial support for the research, authorship, and/or publication of this article.