
Abstract
Financial markets, particularly in the developed markets, have started including non-quantitative disclosures as one of the important key performance indicators and valuation drivers. Notably, the quality of corporate governance, reflected in the board of directors and audit quality, serves as a key performance metric. This paper explores the relationship between market performance, corporate governance practices, and quality of disclosures (QOD) (measured through an index) in Indian financial firms (government-owned banks, private banks, and NBFCs). We assess market performance using price–book value and its dependence on qualitative variables such as corporate governance index (CGI) and QOD. Findings indicate that the market performance of financial firms is influenced by standard accounting ratios such as return on assets, capital adequacy ratio, and non-performing assets, as expected. CGI and QOD have improved over time across all financial firm categories. However, while CGI exhibits a positive relationship with firm performance, the link between market performance and QOD is less definitive. This study, limited to select banks based on market capitalization, explores the relationship between market and accounting performance over five years (2016–2020), with a focus on three consecutive years (2012, 2016, and 2020) to explore the correlation between their market performance and key qualitative factors such as CGI and QOD.
Keywords
Introduction and Background
Corporate governance (CG) has become a leading discussion in today’s corporate world and more recently in emerging markets like India. In the current scenario, when most companies are operating on international standards, it is essential to make the firm professionally strong (with excellent quality of board members in the board of directors) and to ensure that managers operate in the interest of the shareholder (investor). The global financial crisis in 2008, followed by a mini-crisis in India such as the ILFS fiasco, DHFL collapse, YES Bank collapse (followed by a bailout by the SBI), and the ICICI Bank–Videocon episode, has revealed too many inefficiencies and imperfection. These events have significantly diminished the confidence of shareholders, customers, and various stakeholders in financial institutions, including banks. As a result, they have highlighted the critical need for the adoption of robust CG practices within these large enterprises. These occurrences have abruptly cast a spotlight on the vulnerability of the Indian financial sector and reignited concerns regarding the enhancement of board quality within these prominent banks and financial institutions. Further, the poor quality of disclosure in the large banks has added to the confusion among investors in the markets. Cases like YES Bank’s non-performing asset (NPA) divergence and ILFS auditors questioning some of their disclosure practices have made it imperative to study the level of ethical practices, including the quality of reporting, disclosure, and CG practices, in these large institutions. These incidents underscore the pressing need to delve into the ethical dimensions of reporting, disclosure, and CG practices within these prominent financial institutions. The primary concern is to scrutinize whether these institutions are upholding ethical standards in their reporting procedures, given the potential implications for stakeholders and the overall financial sector. This research aims to shed light on the interconnectedness of ethical reporting and effective CG while evaluating the impact on stakeholders, including investors, regulators, and the broader financial landscape, and to assess the adequacy of existing regulatory mechanisms in addressing these critical issues.
The present paper is based on both qualitative and quantitative approaches, where it investigates the quality of CG and disclosure policies by considering two important governance measures, that is, corporate governance index (CGI) and quality of disclosure (QOD). It will be interesting to explore the relationship between CGI, disclosure practices of firms, and its valuation in the stock markets. Also, the study is extended to show the association of accounting performance indicators such as return on asset (ROA), Capital Adequacy Ratio (CAR), and NPA with the market valuation indicator as price-to-book value ratio (P/BV). However, very few studies have been done on CG in the context of banking and financial services industries, and that too in emerging economies like India. Subsequently, in the current work, the CGI and QOD have been constructed using some previous Indian studies, such as Balasubramanian et al., 12 Sarkar et al., 80 Haldar and Rao, 48 Arora et al., 10 Shrivastav and Kalsie, 87 Qizam, 78 and Mansour et al. 62 We have considered three CGI dimensions with seven proxies and QOD comprised of three indices.
Motivation of the Study
The primary motivation of the study is, therefore, the inclusion of qualitative factors (CGI and QOD) because there are very few studies done in developing countries like India to illustrate their association with the market measure. CGI is constructed by using three important proxies, namely, board characteristics, auditor quality, and risk management committee (RMC), that are sub-indexed as follows: board characteristics include board size, board gender, board independence, and CEO duality; auditor quality involves auditor fee, and the RMC comprises committee size and committee independence; and QOD comprised of three major parameters such as Management Discussion and Analysis (MDA), corporate social responsibility (CSR), and environment report (ER), which measure the association of quantitative (ROA, CAR, and NPA) as well as these qualitative variables (CGI and QOD) with the market performance (P/BV).
In this study, the firm performance is measured by analysing the relation of the market variable with two determinants, namely, accounting variables and qualitative variables, where the market performance variable (P/BV) is considered as the dependent variable and other variables such as the accounting performance variables (ROA, CAR, and NPA), and qualitative variables (CGI and QOD) are taken as independent variables. Since the accounting measures are not sufficient to elaborate the whole story and functioning of the firm, this study includes qualitative factors such as CGI and QOD to show its relationship with the market performance (P/BV).
Further, the variables selected in the study are the standard variables chosen from existing work such as Love and Rachinsky, 61 Haldar and Rao, 48 Arora et al., 10 Shrivastav et al., 87 Sarkar et al., 80 Gulati et al., 47 and Mansour et al. 62
An Overview of CG in Banks
CG is defined as a set of rules, procedures, and processes by which an organization is regulated and controlled. 73 According to Millstein, 66 the CG is determined in both narrow and broad versions. In narrow version, she defines CG as the relationship between managers, directors, and shareholders that encompasses the relationship of the corporation to stakeholders and society. Whereas in broader version, she elaborates CG as the combination of laws, regulations, listing rules, and voluntary private sector practices that enable the corporation to perform efficiently, attract capital, generate profit, and meet both legal obligations and expectations of the society. CG aims for integrity, transparency, and proper accountability in the system. It maintains healthy harmony between the shareholder and the manager, which develops confidence and removes conflicts between them.
As per Shleifer and Vishny, 86 CG is elucidated as the technique by which finance suppliers assure themselves of getting returns on their investment. Shareholders act as the pillar of any organization as they invest huge amounts of money by taking high risks. To manage shareholder’s money, managers (agents) are appointed in the firm. However, it has been observed that managers take high risks in order to get high returns as they are least worried about the loss since it will not cause any effect on their wealth which leads to conflict between shareholders and managers (agency cost). To resolve such agency costs, CG aims to appoint a board of directors who act as the invigilators for managers and work for shareholder wealth maximization. As stated by Jensen and Meckling, 53 the separation of ownership from control is the core of the agency problems faced by the firms. So, to direct and control the actions of managers (agents) and protect the interests of shareholders, the board of directors is appointed. The board of directors acts as an essential body for any firm as they play a key role to control and direct the activities of managers and protecting the interest of shareholders.
Good CG aims for improved economic growth and efficiency which enhances investors’ confidence. This leads to an increase in the external finances in the firm lowers the cost of capital and enhances the operational performance. As enumerated by Gregory and Simms, 45 the quality of CG is important since it has a direct impact on the corporation’s efficiency, attracts lower-cost capital, and improves overall firm performance.
The banking sector is the backbone of any economy. It acts as the lifeblood of any country which is responsible for the flow of credits and for maintaining the financial balances of the economy. According to Barth et al., 13 banks are heavily regulated and it is important that the objectives of regulators and the banking firm should not coincide. All over the world banks help in managing the money of the people and accumulating their funds to raise the economy. It is one of the important financial institutions that need to be controlled and regulated in the right way so that it can perform well in the market. In developing countries like India, 70%–80% of banks are public sector banks that are controlled and regulated by the government where it has been noticed that government ownership is a major challenge in the public sector banks that directly affect the CG quality. The role of CG becomes more critical in the banking sector because the general society always has faith in the banking system and finds it suitable for their investment. The people of society believe that banks are the best platform for their savings and that their money is secure. Looking to this, to maintain this trust and faith in the system there should be some set of rules, regulations, policies, and procedures that aim for good governance.
To ensure quality, the key pillars of CG, such as disclosure, transparency, fairness, and accountability, are considered to provide necessary information to stakeholders by looking to the shareholder’s interest. A study related to risk management was conducted by Permatasari and Novitasary, 77 and they concluded that a good CG implementation can minimize bad debts existing in the bank and enhance the risk management policies. CG works as an internal mechanism in the banking sector in order to build confidence, faith, and long-term relationships with its stakeholders. After using data on 573 US banks over the crisis period (1st July 2007 to 31st December 2008), Aebi et al. 2 investigated whether risk management-related CG mechanisms made banks perform better during the 2007 and 2008 financial crisis. According to Wickramanayake, 96 the mechanism of good CG through the application of the proportion of commissioners has a positive effect on the performance of the banks, where the preferred banks have high stability, Shleifer and Vishny 86 considered that agency theorists have long considered concentrated ownership as a governance mechanism that may reduce agency costs.
Literature Review
Existing empirical studies, focus on CGI, bank performance, QOD, accounting variables, and selected market ratio.
CG and Financial Performance
Berle and Means 19 were the first to suggest that CG works as a technique in which the board of directors are considered as the internal mechanism to reduce the conflict of interest between shareholders and managers. Further, Dewan 36 believes that CG is a crucial and indispensable idea of the connection between the capitalist and profit-creating corporation. Drobetz et al. 39 determine that a good CG assists in profitability, sales growth, higher valuations, and low cost of capital. Whereas, as per Aguilera et al., 5 CG acts as a mechanism to control the activities of management and work for the welfare of those who have a stake in the business. As per Belkhir, 16 there is a positive relationship between the board size and the market performance in the banking and financial institutions. The need for transparency and accountability in the areas of board monitoring, director’s contracts, and board structure is very important. 28 Love et al. 61 analysed the relationship between governance and performance based on the information on governance in the Russian and Ukrainian banks. Grove et al. 46 study multiple dimensions of CG practices of public commercial banks in the United States.
According to Segoviano and Goodhart, 81 banking stability is the strong and tenacious thing in the banking system that facilitates and enhances the economic process, manages the risk, and absorbs any sought of stress in the system. According to Levine 60 and Claessens, 31 CG in banks acts as an instrumental determinant for economic growth. The firm with independent boards has higher returns on equity, higher profit margins, larger dividend yields, and larger stock repurchases, suggesting that board independence is associated with other important measures of firm performance as found by Brown and Caylor, 26 Kirkpatrick 56 determines that the weak governance of banks is frequently identified as a major cause of the crisis. As enumerated by Johnson et al., 54 the controlling shareholders, conditional on the regulatory and legal environment, may exploit their private benefits of control by diverting assets and profits out of the firm. As pointed out by Adams and Mehran, 1 bank CEOs have lower ownership than CEOs of non-financial firms. Upadhyay and Sriram 93 state that a larger board has greater resources than a smaller board to monitor managerial performance.
CGI and Financial Performance (Accounting and Market Performance)
Many studies22,41 adopted survey methods to construct CGI for companies. Black et al. 21 constructed CGI for the Korean Stock Exchange-listed companies to demonstrate the correlation between CGI and the market value of a firm. They used different regression models such as the ordinary least squares method, 2-SLS and 3-SLS. The study shows a robust correlation between CGI and performance variables. Similarly, in order to demonstrate the relationship between CGI and market value, Braga et al. 24 constructed composite CGI prescribed by Bovespa (stock exchange of Brazil) by considering six proxies for main CG practices. They encapsulated the positive relation between CGI and market value. However, the study fails to find a significant relationship between CGI and operating performance. Peni and Vähämaa 76 considered the CGI to measure bank governance and assess the impact of these variables on the bank performance.
Similarly, some researchers encapsulate the impact of CG proxies, parameters, or variables on the firm performance. Belkhir 17 inspects the relationship between a single governance parameter (board size) and bank performance by using various statistical tools including panel data techniques and panel univariate analyses. It was found that CG variables are poorly significant in determining bank performance. Some studies34,51 have used multiple proxies, for example, board size, gender diversity, and board independence, to examine its impact on the bank performance. DeAngelo 35 demonstrates that audit quality is the market-probable probability that detects errors in accounting reports, balance sheets, and any financial statements. Also as pointed out by Daniel et al., 33 experienced auditors will most likely be able to detect the real activity of earning management. Further, Tandelilin et al. 90 conducted a study to determine the relationship between CG and risk management on one part of the study and, on the other hand, examined the correlation between CG and bank performance by considering a sample of 51 Indonesian Banks. Andrieș and Brown 8 examine to what level CG and risk management can mitigate the involvement of banks in bust cycles and credit rooms by using four proxies of risk management that represent values between 0 and 1, where 1 aims for strict risk management.
QOD and Financial Performance (Accounting and Market Performance)
Some previous studies32,88 explore the usefulness and benefits of disclosure. The studies that linked to the level of disclosure in the financial report of the firm were taken ahead by many researchers 30 who assessed the relationship between improved disclosure and capital market growth, whereas other researchers11,37,44,59,58 determined the impact of governed disclosure on the cost of capital or liquidity. On the other hand, some studies50,78,82 investigate the impact of increased disclosure on the performance of the firm.
According to Healy and Palepuiii, 49 disclosure comprises all forms of voluntary corporate communications, for example, management forecasts, analyst presentations, the annual general meetings, press releases, information placed on corporate websites, and other corporate reports, such as stand-alone environmental or social reports. Subsequently, Money and Schepers 69 postulate that events such as the Enron fiasco, the Worldcom breakdown, the Satyam Saga, and the Lehman Brothers have tarnished the image of corporates in the eye of an investor, a customer, an employee, or any other stakeholder, which has increased a society’s expectations in relation to companies’ environmental, social, and ethical responsibilities. In addition, Ghazali 68 suggests that companies in which the majority of shares are held by the CEOs disclose less CSR activities information in comparison to the firms in which the major shareholders are the government.
Researches on Financial Indicators (Accounting Performance and Market Performance)
The majority of studies comprehensively recorded the relationship between accounting variables and market indicators29,43,57,67,83,89 and some determined the impact of the stock markets on accounting information.14,38,52,65,70 According to Oskouel and Zadeh, 75 the accounting variables in the accounting report are not certain, they fluctuate at different stages of firm’s life cycle. Simultaneously some researchers show the relevance of market ratios. For example, Beaver and Ryan 15 exhibit that book-to-market ratios are related to future return on equity. However, Nezlobin et al. 71 examine that factors such as economic profitability and predicted future growth affect the price-to-book (P/BV) and the price-to-earnings ratios. Also, some studies74,84,91,94 examine the impact of book value on share price. It was found that book value has a positive relation with market price.
Research Gap
From the above literature, it has been observed that there are very few studies done to examine the relation of CGI and QOD with the market performance indicator, and little research show the relationship between accounting information parameters and market performance variables in the context of the banking industry and non-bank financial companies (NBFCs) in the developing economies like India. Also, very few studies have been done to understand the relevance of qualitative factors (CGI and QOD) in Indian banking and non-banking institutes.
To fill this research gap, the present study aims to investigate the association between CG and firm performance by considering quantitative and qualitative factors such as accounting variables comprised of ROA, capital adequacy rate (CAR, and NPA, and qualitative factors such as CGI, QOD, and considering P/BV as the market variable. There are many works done to show the relation between accounting variables and market variables, but very few show the association of CGI and QOD with market performance.
Research Objective and Hypothesis Building
Firm performance encompasses two essential dimensions: quantitative and qualitative. While the former can be readily measured and extensively studied, it is the latter that has recently taken centre stage in financial markets. High-profile accounting scandals worldwide have shed light on firms’ vulnerabilities, particularly concerning the unfair and incomplete disclosure of sensitive information to shareholders and the broader markets. In some instances, it has become evident that corporate boards were kept uninformed, and even if they suspected wrongdoing, they remained silent. These developments have spurred our interest in conducting a study on firms’ qualitative disclosures and examining the stock market’s response to such disclosures.
The research objectives of the study are as follows:
To determine the association of market performance with accounting performance of select banks To construct the CGI by using important proxies of CG To construct the QOD by considering select banks’ annual reports. To determine the relationship between CGI and QOD with market performance indicators of select Indian banks.
Based on research objectives, the hypotheses of the study are categorized as follows:
Hypothesis 1: The market performance variable P/BV is directly proportional to ROA. Hypothesis 2: The market performance variable P/BV is directly proportional to CAR. Hypothesis 3: The market performance variable P/BV is inversely proportional to NPA. Hypothesis 4: The quality of the CGI has improved over the years in all sectors of banks. Hypothesis 5: The QOD has improved over the years in all sectors of banks. Hypothesis 6: The market performance variable P/BV is directly proportional to the CGI. Hypothesis 7: The market performance variable P/BV is directly proportional to the QOD.
The CGI data and financial performance (accounting and market performance) data are collected by using the Prowess CMIE Database, whereas QOD is obtained from the annual reports of selected banks and NBFCs.
Data and Research Methodology
To get a good representation of the banking industry, two banks are selected from each of the three broad categories of banking institutions in India based on their market capitalization. The study comprised two public sector banks (SBI and BOB), two private sector banks (HDFC and Axis Bank), and two NBFCs (Bajaj Finserv and Muthoot Finance). The choice of these three categories of banks/FIs was primarily guided by the fundamental differences among the various players in the Indian banking structure. In this section, we briefly highlight the structural and fundamental differences between public sector banks, private sector banks, and NBFCs by considering some critical parameters such as ownership structure and regulation.
Ownership
The public sector banks are banks where the major shareholder is the government (approximately 60%–70%), and the remaining are with other financial institutions or the public at large, so these banks are controlled and managed by the government. The private sector banks are privately owned corporations where the majority shareholders are the foreign institutional investors, private asset management companies, and private individuals. The NBFCs are the institutes set up by cooperative societies, privately owned corporations, and government-owned entities. This basic difference in the ownership pattern may create different kinds of pressure on the board of directors resulting in possible different CG practices.
Regulations
Regulations have been one of the crucial parts of any financial system, to control and manage players, it is necessary to implement rules and regulations. Since the public sector banks are largely government-owned and are the custodian of public deposits, they are highly regulated and monitored by the government and operate as per the policies and norms of RBI. The objective of a public bank is not only commercial but they also operate for society’s welfare (schemes such as Mudra and Jan Dhan Yojna), which relax certain norms. On the other hand, private banks are more profit-driven and purely commercial and are controlled and regulated by the management and shareholders. However, NBFCs have weak regulations as they operate for untapped markets in the rural and semi-urban areas where other banks cannot serve. The guidelines for them are comparatively relaxed by RBI, and the policies designed are less strict, basically to give them the flexibility to operate in underserved markets.
To determine the relationship between accounting variables (ROA, CAR, and NPA) and market performance variables (P/BV), the data for the institutions are collected from 2016 to 2020. On the other hand, to determine the relation between CGI and QOD with P/BV, three consecutive years are selected such as 2012, 2016, and 2020.

where P/BV is the dependent variable and other variables (ROA, CAR, NPA, CGI, QOD) are the independent variables.
The data considered for the study involve variables, which have been elaborated in Exhibit 1.
Results and Discussion
ROA and P/BV from 2016 to 2020 (Exhibit 2)
Results Analysis
From Exhibit 2, Figures 2.1 and 2.2 show the relationship between ROA and P/BV of two public sector banks (SBI and BOB). We can see that in the case of SBI, ROA has moved between -0.12 and 0.47, and P/BV has fluctuated from 0.77 to 1.28. They are largely moving together but are not the same for all years. Also, for some years ROA has improved, the P/BV has declined, and vice versa.
Almost similar trend is observed for BOB where most of the time both ROA and P/BV are moving together except for a few years. Consequently, the same trends can be observed in the case of private banks (Figures 2.3 and 2.4) and NBFCs (Figures 2.5 and 2.6).
Hypothesis 1: The market performance variable P/BV is directly proportional to ROA.
Hypothesis 1: The result is accepted.
CAR and P/BV of SBI from 2016 to 2020 (Exhibit 3)
Results Analysis
Figures 3.1 and 3.2 signify the relationship between CAR and P/BV of selected two public sector banks (SBI and BOB). For SBI, CAR ranges from 12.6 to 13.12 while P/BV has fluctuated between 0.77 and 1.28. The variation in CAR is directly linked to the variation in P/BV, except for one or two cases.
Hence, we observe mixed results for public sector banks.
Almost similar trends can be seen in the case of private banks (Figures 2.3 and 2.4) and NBFCs (Figures 3.5 and 3.6).
Hypothesis 2: The market performance variable P/BV is directly proportional to CAR.
Hypothesis 2: Concluded with mixed results.
NPA and P/BV of SBI from 2016 to 2020 (Exhibit 4)
Results Analysis
Figures 3.1 and 3.2 show the relationship between NPA and P/BV of the SBI and BOB from the years 2016 to 2020. As observed in SBI, NPA ranges from 2.23 to 5.73, and P/BV has fluctuated between 0.77 and 1.28. The above analysis shows that NPA and P/BV of SBI are inversely related to each other in maximum years. An almost similar trend is observed for BOB where the variation in P/BV and NPA is not in a sink in maximum years.
An almost similar negative relation between NPA and P/BV is observed for private sector banks (Figures 3.3 and 3.4) and NBFCs (Figures 3.5 and 3.6).
Hypothesis 3: The market performance variable (P/BV) is inversely proportional to NPA.
Hypothesis 3: The result is accepted.
Construction of CGI
Table 1 shows the construction of CGI for three consecutive years 2012, 2016, and 2020 of Selected Banks and NBFCs. The CGI is constructor by considering three important parameters assigned with a total of 35 marks as follows:
CGI Construction for Three Consecutive Years 2012, 2016, and 2020 of Selected Banks and NBFCs by Using CMIE Prowess Database (Secondary Data Collection Tool), and from Their Annual Reports.
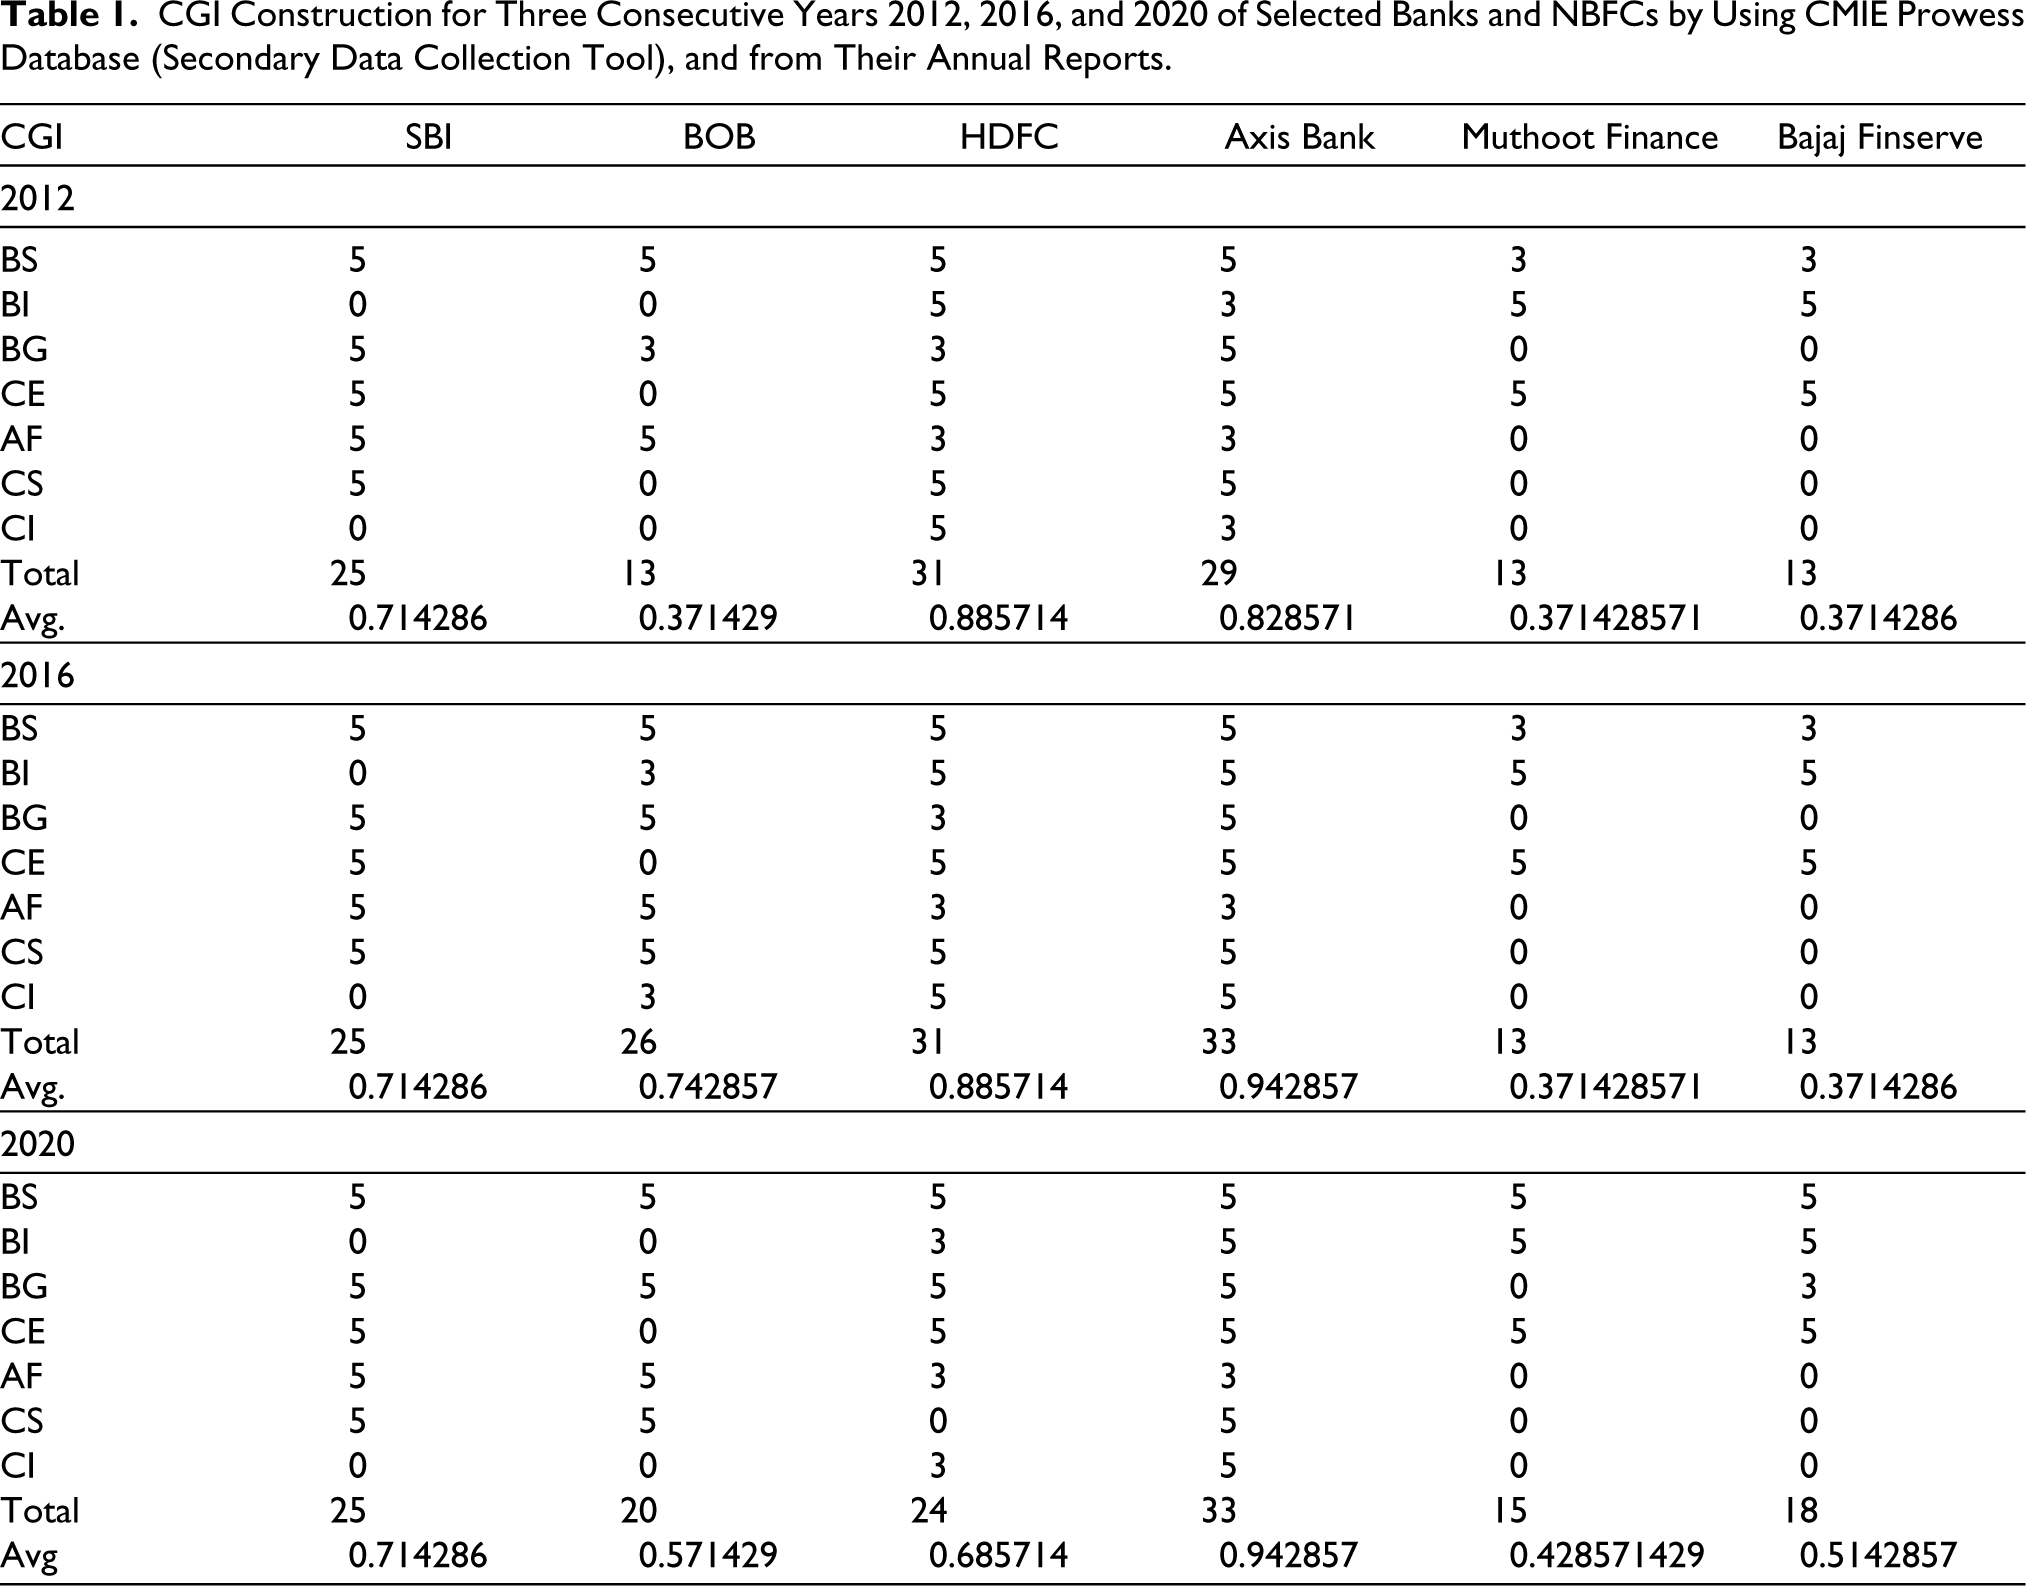
Board characteristics (BC: 20M)
Auditor quality (AQ: 5M)
Risk management committee (RMC: 10M)
The board characteristic is segregated into four parts such as:
Board size (BS) = 5M
When the board size is more than 10 = 5M When the board size is less than 10 but more than 5 = 3M Less than 5 = 0M Board gender (BG) = 5M
When there are two females on the board = 5M One female on the board = 3M No female = 0 CEO duality = 5M
Yes = 5M No CEO duality = 0 Board independence = 5M
More than 50% independent directors = 5M Less than 50% but more than 30 % = 3M Less than 30% = 0
Auditor quality (AQ: 5M)
Auditor fee (AF) = 5M
Risk management committee (RMC: 10M)
Committee size (CS) = 5M
When the size is more than 10 = 5M When the size is less than 10 but more than 5 = 5M Less than 5 = 0 Committee independence (RCI) = 5M
More than 50% independent directors = 5M Less than 50% but more than 30 % = 3M Less than 30% = 0
Data for CGI and P/BV for Three Consecutive Years (2012, 2016, and 2020): (Exhibit 5)
Result Analysis
From Exhibit 5 (Table 5.1, 5.2, and 5.3; Figure 5.1, 5.2, and 5.3) and Exhibit 6 (Table 6.1, 6.2, and 6.3; Figure 6.1, 6.2, and 6.3) show the comparative analysis of all banks for three selected years 2012, 2016, and 2020.
In the case of SBI, CGI is the same for all three years, whereas P/BV increased in 2016 but again declined in 2020. In BOB, CGI increased in 2016 but declined in 2020 whereas P/BV is continuously decreasing.
As observed for two private sector banks (HDFC and Axis bank), the value of CGI for HDFC is the same but declined in 2020, whereas P/BV decreased in all years. Consequently, as observed for Axis Bank, CGI is increasing in all years, but P/BV is decreasing in all three considered years.
For the two considered NBFCs, we can evaluate that in Muthoot Finance, CGI is the same but increased in 2020, whereas P/BV is increasing in all cases. Similarly, in Bajaj Finserv, CGI is the same but increased in 2020, whereas P/BV declined in 2016 but increased in 2020.
From the above, we can conclude that the quality of CGI has been improved in all three sectors, but private sector banks have more improved quality in comparison to public and NBFC sector banks.
The above relation also proves that CGI in most situations is directly proportional to P/BV. Therefore, the hypothesis is accepted.
Hypothesis 4: The quality of the CGI has improved over the years in all sectors of banks.
Hypothesis 4: Accepted.
Hypothesis 6: The market performance variable (P/BV) is directly proportional to the CGI.
Hypothesis 6:
Construction of QOD
The QOD is divided into three buckets assigned with 15M that is shown in Table 2 as followed:
The Construction of QOD for Three Consecutive Years 2012, 2016, and 2020 of Selected Banks and NBFCs from Their Annual Reports.
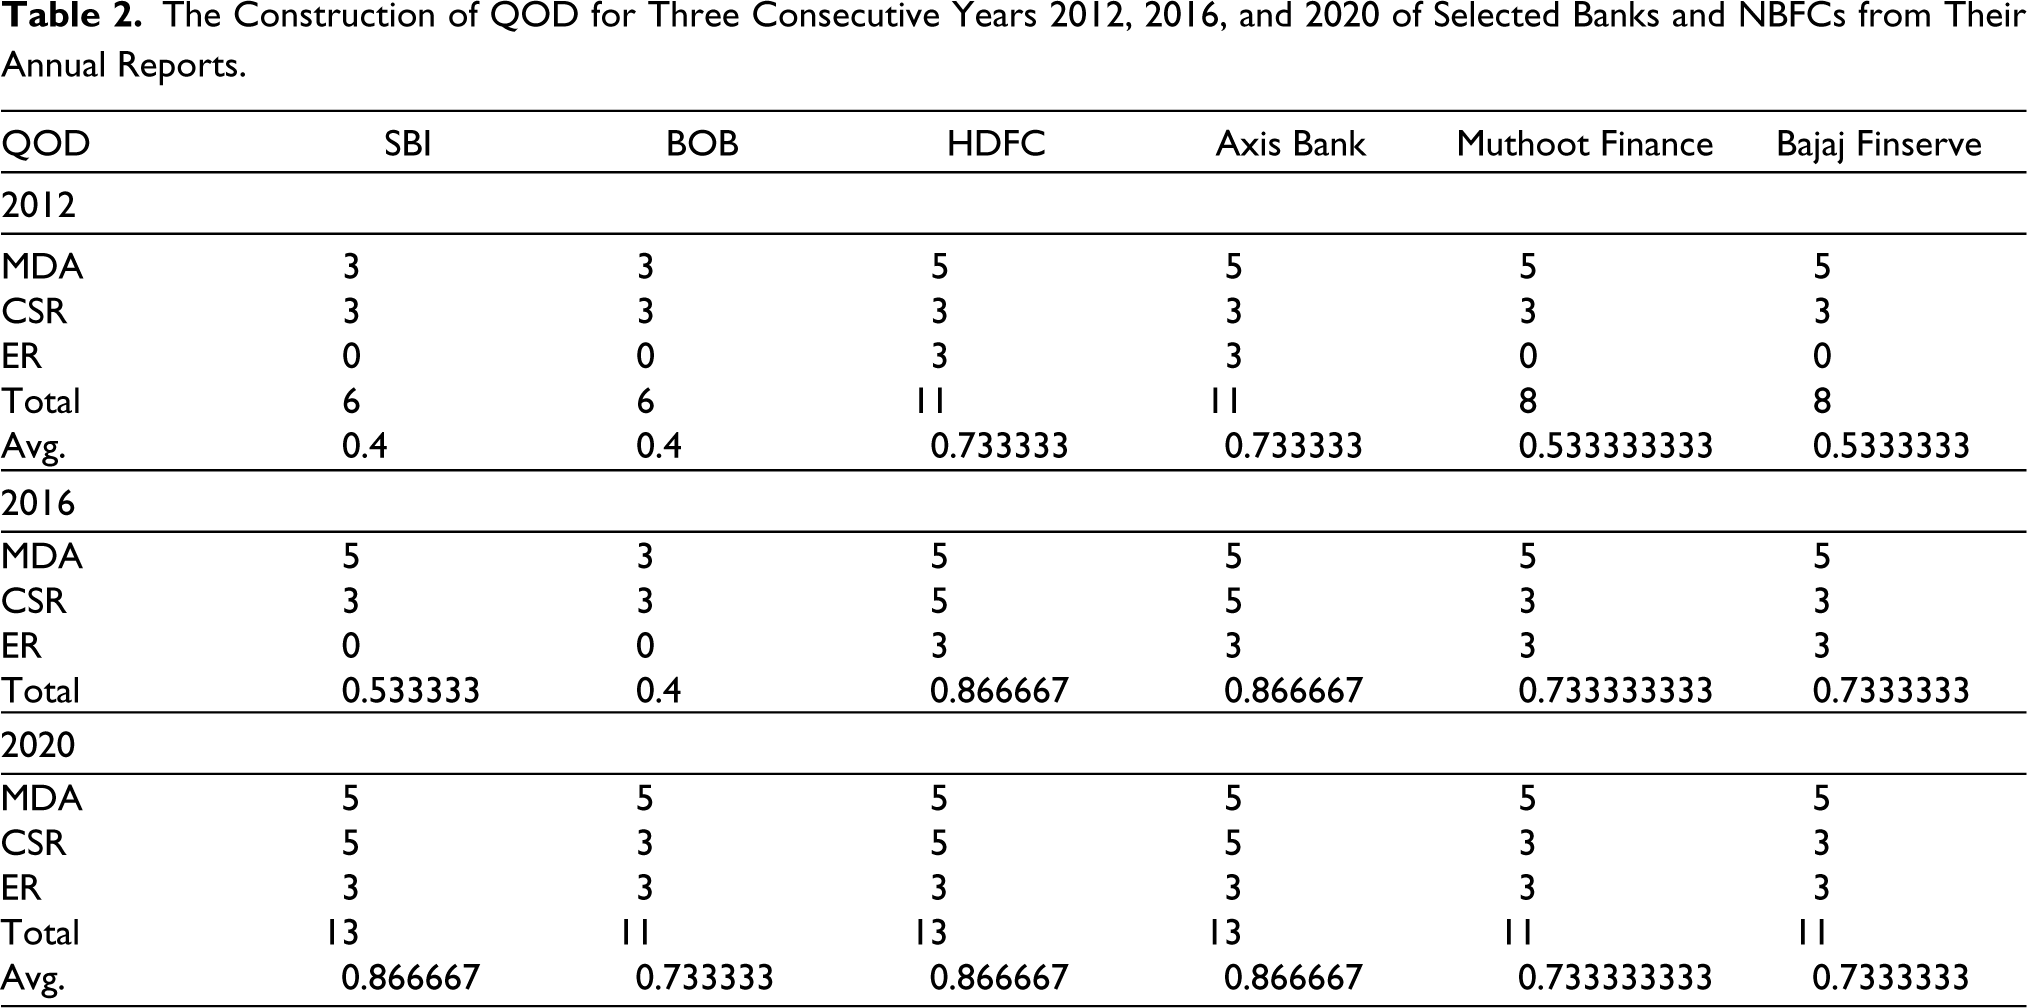
MDA (5M)
When the section is explained in detail in the annual report = 5M Less explanation = 3M No explanation in the report = 0
CSR (5M)
When the section is explained in detail in the annual report = 5M Less explanation = 3M No explanation in the report = 0
ER (5M)
When the section is explained in detail in the annual report = 5M Less explanation = 3M No explanation in the report = 0
Data for QOD and P/BV for Three Consecutive Years (2012, 2016, and 2020): (Exhibit 5)
Result Analysis
In Exhibit 6, Tables 6.1–6.3 and Figures 6.1–6.3 show the comparative analysis of all banks for three selected years 2012, 2016, and 2020.
From the above, we analyse that in the case of public sector banks (SBI and BOB), QOD has improved over the years but again declined in the year 2020 whereas there is a decline in P/BV over the year except in 2020. In private sector banks (HDFC and Axis Bank), QOD has been improved over the years, but there is a fall in P/BV.
As observed for NBFCs (Muthoot Finance and Bajaj Finserve), QOD has been improved, but we can see a decline in the values of P/BV.
Therefore, we can conclude that QOD has been improved for all three sectors over the years.
The result is inconclusive for the relationship between QOD and P/BV since the variation in values of QOD is inversely related to P/BV.
Hypothesis 5: The QOD has been improved over the years in all sectors of banks.
Hypothesis 5: Accepted.
Hypothesis 7: The market performance variable (P/BV) is directly proportional to the QOD.
Hypothesis 7: Inconclusive result.
Limitations and Future Scope
The limitations and future scope of the study include the following:
One of the primary limitations of this study is the small sample size. The research paper only considers data from six banks. A small sample size can limit the generalizability of the findings and may not fully represent the diversity and complexity of the banking industry. Future studies could benefit from a larger and more diverse sample to draw more robust conclusions. The study’s time period spans only five years. While this may provide valuable insights into short-term relationships, it may not capture longer-term trends or the full impact of certain variables. Extending the time period could offer a more comprehensive view of how accounting and qualitative variables affect market performance over time. The study includes a limited set of accounting and qualitative variables. While these variables are undoubtedly important, the complexity of the banking industry suggests that additional variables could be considered for a more comprehensive analysis. For instance, factors like interest rate fluctuations, macroeconomic indicators, or regulatory changes could significantly impact market performance and should be considered in future research. Further, the present study contributes valuable insights into the relationship between accounting and qualitative variables and market performance in the banking sector, there are limitations that should be acknowledged. Addressing these limitations and exploring the suggested future research areas can enhance the depth and breadth of knowledge in this field.
Practical and Theoretical Implication
The theoretical implication is that firm performance is dependent on a large set of variables, both macro and firm-specific factors. Macro factors such as GDP growth rate and inflation are largely not in the control of the firms, and they can only devise some hedging strategy to prevent them from the downside risk. Within the firm-specific factors, there are again both quantitative and qualitative proxies which are used to capture the performance. Quantitative variables are standard, and it is easy for researchers to calculate them, and their relationship with market performance is fairly established. It is the qualitative factors which are difficult to estimate and suitable proxies for measuring them still continue to be a little subjective and debatable. However, informed markets will always put emphasis on both qualitative and quantitative information in the process of price discovery for any asset valuation.
The practical implication is that firms in developing markets can continue to focus more on quantitative factors, as of now, and gradually build up suitable strategies for qualitative reporting as sooner or later, these factors will also become relevant. As of now, the firms can start building appropriate structures and processes inside the organization to capture qualitative information and sensitize the employees, particularly senior management, on the importance of such practices.
Conclusion
In the present study, we have outlined to demonstrate the relation of market performance variable (P/BV) with qualitative (CGI and QOD) and quantitative (ROA, CAR, and NPA). The work focused on the qualitative factors by constructing CGI and QOD for selected NSE-listed Indian public, private sector banks, and NBFCs. The CGI is based on three prominent indices such as board characteristics, auditor quality, and RMC; seven dimensions were derived from these three indices to construct CGI. Another qualitative parameter QOD is based on three important proxies, namely, Management Discussion and Analysis (MDA), CSR, and ER. The CGI and QOD are constructed for three consecutive years, that is, 2012, 2016, 2020, for six financial institutions, whereas to determine the relation between accounting performance and market performance, the year selection is for five years from 2016 to 2020. The data selected in the study are small because the study is more focused on deriving the important qualitative factors and showing their relationship with the market performance. The methodology adopted is very basic using correlation tools to show the chart formulation between qualitative and quantitative factors and market performance variables.
As derived from some useful studies10,21,62,78,80,87, the present work serves as a pointer to demonstrate the relation of qualitative indicators (CGI and QOD) and qualitative factors (ROA, CAR, and NPA) with the market performance for Indian banking and non-banking firms.
Results of the study document that CGI and QOD have improved over the years in all sectors of banks, where CGI is directly correlated with market performance (P/BV) and QOD forms an inverse relation with P/BV. Also, it has been observed that the quantitative factors (ROA, CAR, and NPA) are better in private sector banks than in public and NBFCs, where ROA and CAR show a positive relation with P/BV, and NPA is negatively related to P/BV.
Footnotes
Declaration of Conflicting Interests
The authors declared no potential conflicts of interest with respect to the research, authorship and/or publication of this article.
Funding
The authors received no financial support for the research, authorship and/or publication of this article.
Market and Accounting Variables Used in the Study. Also,Indicators and Dimensions Used in Constructing CGI and QOD.
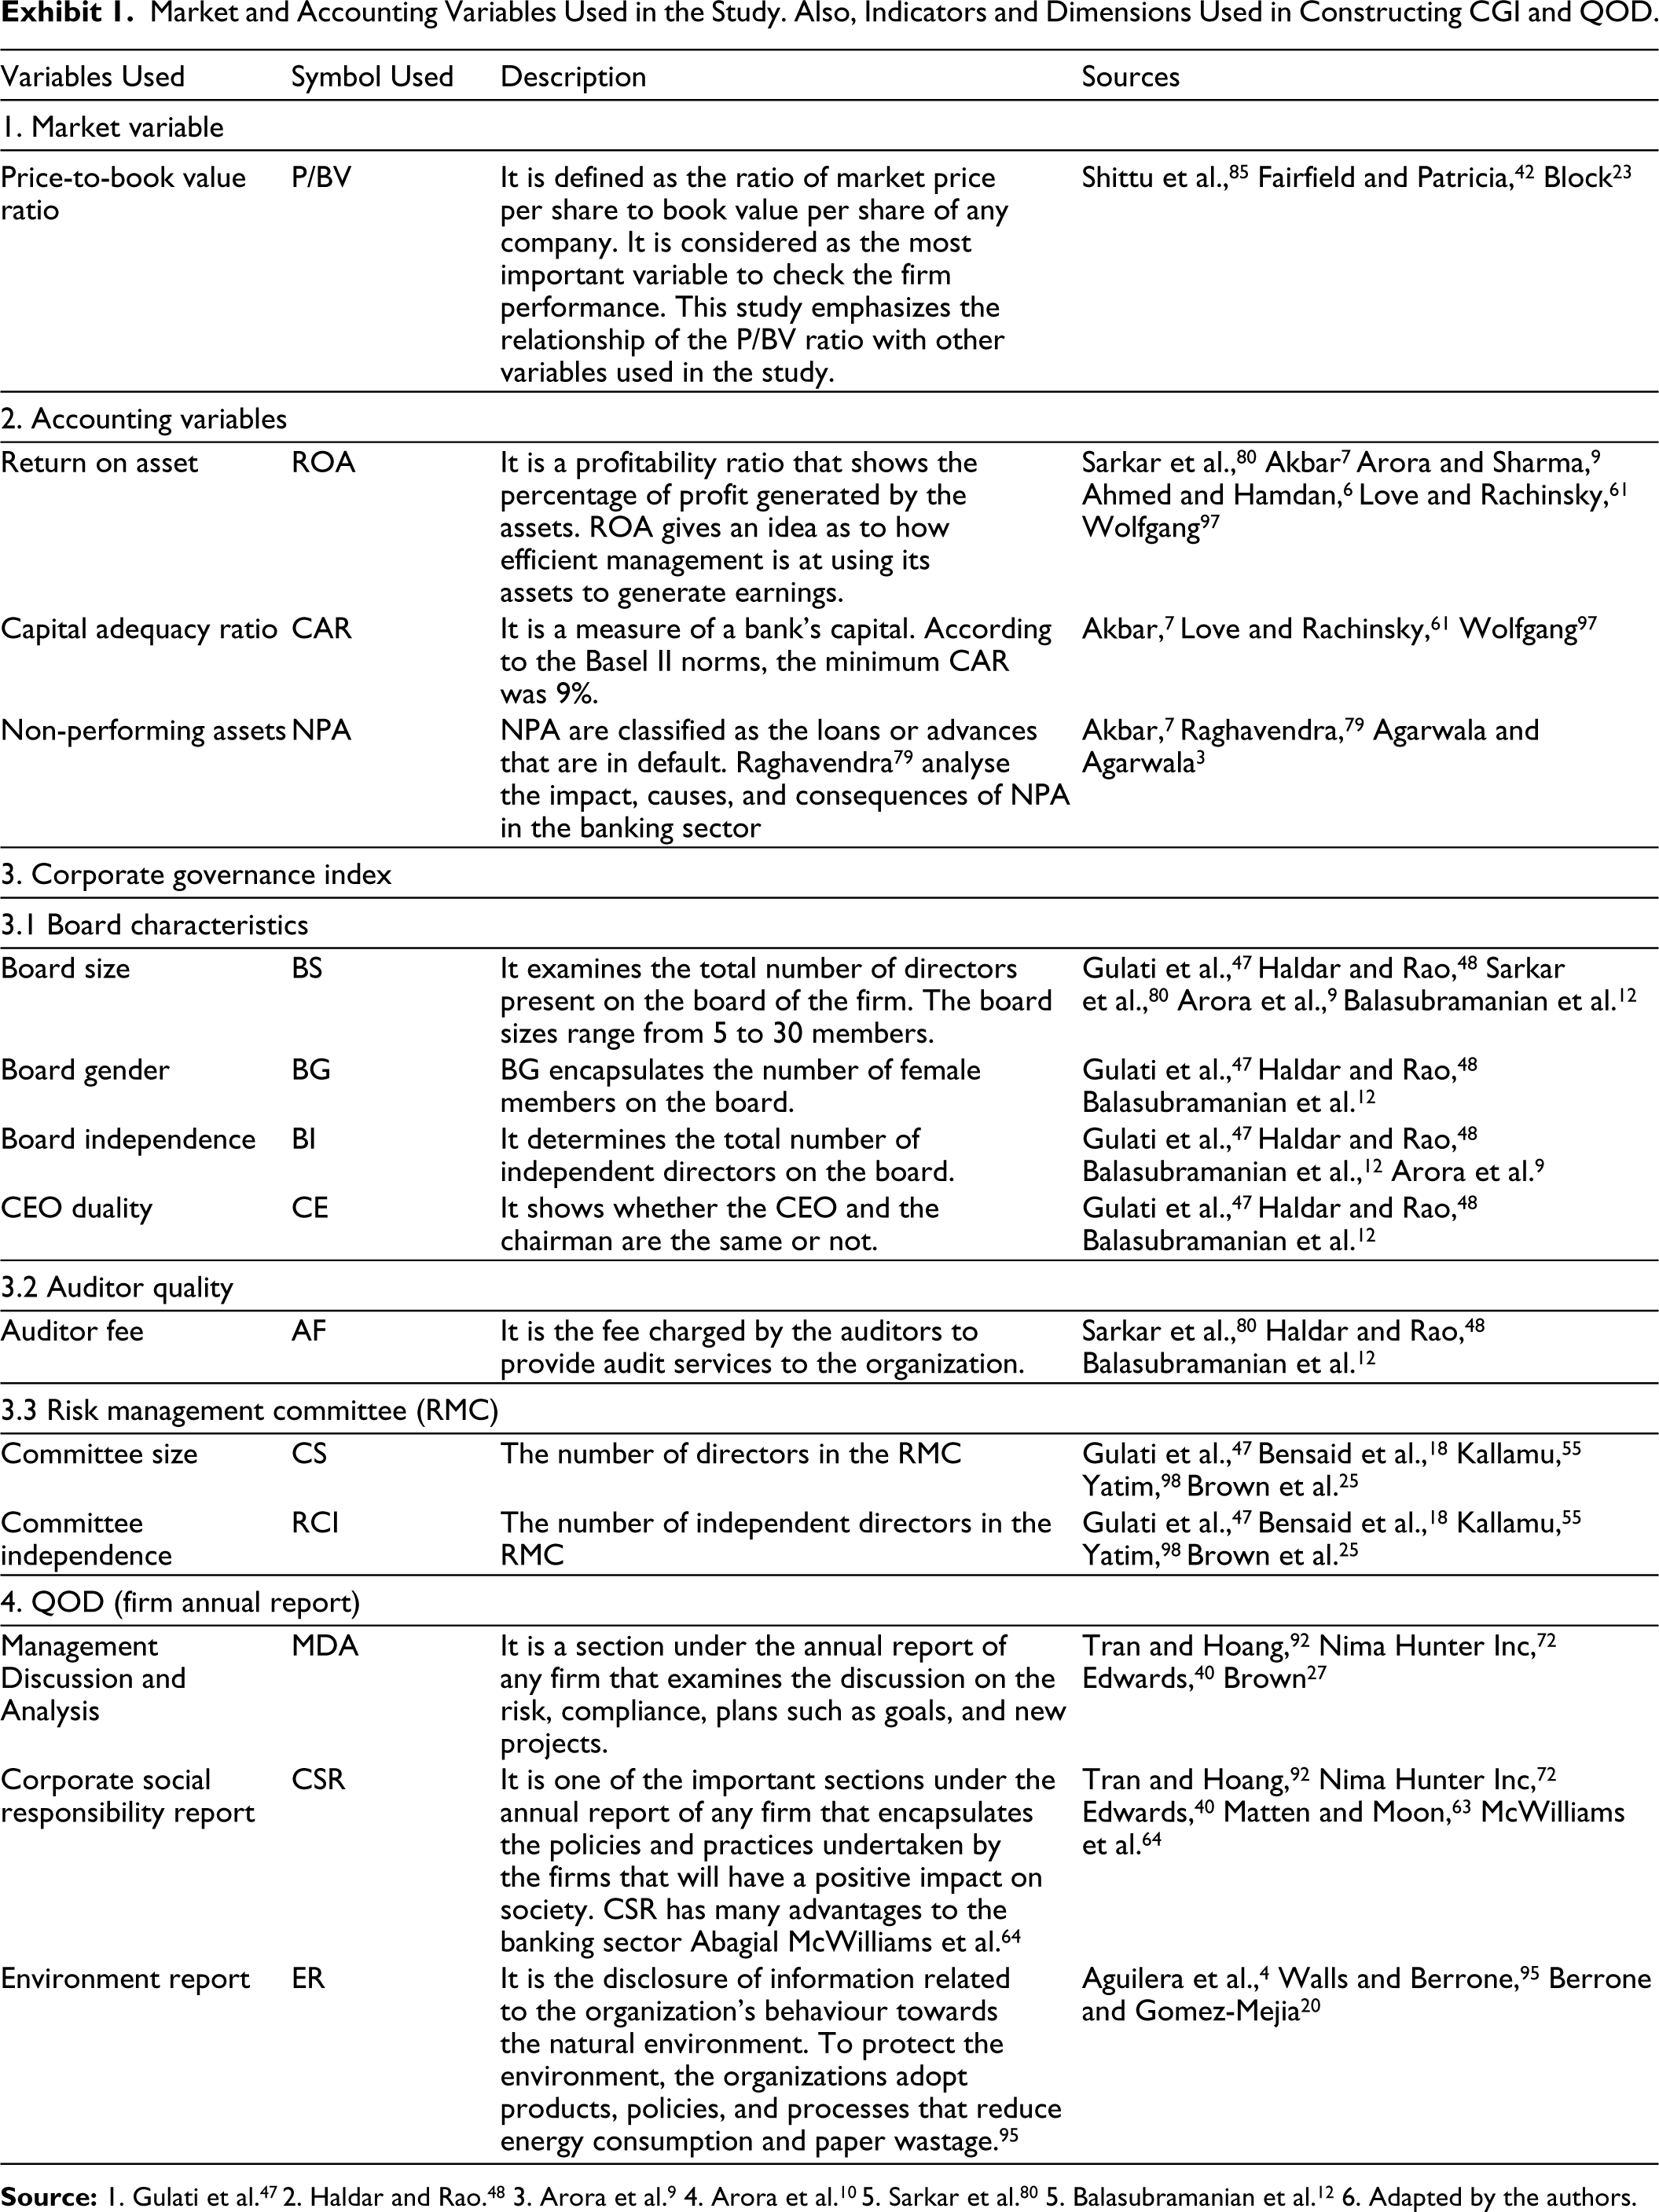
| Variables Used | Symbol Used | Description | Sources |
| 1. Market variable | |||
| Price-to-book value ratio | P/BV | It is defined as the ratio of market price per share to book value per share of any company. It is considered as the most important variable to check the firm performance. This study emphasizes the relationship of the P/BV ratio with other variables used in the study. | Shittu et al., 85 Fairfield and Patricia, 42 Block 23 |
| 2. Accounting variables | |||
| Return on asset | ROA | It is a profitability ratio that shows the percentage of profit generated by the assets. ROA gives an idea as to how efficient management is at using its assets to generate earnings. | Sarkar et al., 80 Akbar 7 Arora and Sharma, 9 Ahmed and Hamdan, 6 Love and Rachinsky, 61 Wolfgang 97 |
| Capital adequacy ratio | CAR | It is a measure of a bank’s capital. According to the Basel II norms, the minimum CAR was 9%. | Akbar, 7 Love and Rachinsky, 61 Wolfgang 97 |
| Non-performing assets | NPA | NPA are classified as the loans or advances that are in default. Raghavendra 79 analyse the impact, causes, and consequences of NPA in the banking sector | Akbar, 7 Raghavendra, 79 Agarwala and Agarwala 3 |
| 3. Corporate governance index | |||
| 3.1 Board characteristics | |||
| Board size | BS | It examines the total number of directors present on the board of the firm. The board sizes range from 5 to 30 members. | Gulati et al., 47 Haldar and Rao, 48 Sarkar et al., 80 Arora et al., 9 Balasubramanian et al. 12 |
| Board gender | BG | BG encapsulates the number of female members on the board. | Gulati et al., 47 Haldar and Rao, 48 Balasubramanian et al. 12 |
| Board independence | BI | It determines the total number of independent directors on the board. | Gulati et al., 47 Haldar and Rao, 48 Balasubramanian et al., 12 Arora et al. 9 |
| CEO duality | CE | It shows whether the CEO and the chairman are the same or not. | Gulati et al., 47 Haldar and Rao, 48 Balasubramanian et al. 12 |
| 3.2 Auditor quality | |||
| Auditor fee | AF | It is the fee charged by the auditors to provide audit services to the organization. | Sarkar et al., 80 Haldar and Rao, 48 Balasubramanian et al. 12 |
| 3.3 Risk management committee (RMC) | |||
| Committee size | CS | The number of directors in the RMC | Gulati et al., 47 Bensaid et al., 18 Kallamu, 55 Yatim, 98 Brown et al. 25 |
| Committee independence | RCI | The number of independent directors in the RMC | Gulati et al., 47 Bensaid et al., 18 Kallamu, 55 Yatim, 98 Brown et al. 25 |
| 4. QOD (firm annual report) | |||
| Management Discussion and Analysis | MDA | It is a section under the annual report of any firm that examines the discussion on the risk, compliance, plans such as goals, and new projects. | Tran and Hoang, 92 Nima Hunter Inc, 72 Edwards, 40 Brown 27 |
| Corporate social responsibility report | CSR | It is one of the important sections under the annual report of any firm that encapsulates the policies and practices undertaken by the firms that will have a positive impact on society. CSR has many advantages to the banking sector Abagial McWilliams et al. 64 | Tran and Hoang, 92 Nima Hunter Inc, 72 Edwards, 40 Matten and Moon, 63 McWilliams et al. 64 |
| Environment report | ER | It is the disclosure of information related to the organization’s behaviour towards the natural environment. To protect the environment, the organizations adopt products, policies, and processes that reduce energy consumption and paper wastage. 95 | Aguilera et al., 4 Walls and Berrone, 95 Berrone and Gomez-Mejia 20 |
ROA and P/BV from the Years 2016 to 2020.
Result Analysis: Chart Formulation
CAR and P/BV of SBI from the Years 2016 to 2020.
Result Analysis: Chart Formulation.
NPA and P/BV of SBI from the Year 2016 to 2020.
Result Analysis: Chart Formulation.
Data for CGI and P/BV for Three Consecutive Years (2012,2016,and 2020).
Result Analysis: Chart Formulation.
Data for CGI and P/BV for Three Consecutive Years (2012,2016,and 2020).
Result Analysis: Chart Formulation.