
Abstract
The study explores the theoretical background of Basel III and investigates the drivers of interest rate risk and credit risk of banks in various parlances, namely, pre and post the financial crisis, phases of implementation and ownership on a sample of 36 listed banks in India. The findings indicate that the high capital adequacy requirement (CAR) exhibits a positive relation with gross non-performing assets (GNPAs) and net interest margin (NIM). This is perhaps one of the major drawbacks of Basel implementation, which may become a cause of lower GDP in the future as explained in the findings of the literature.
Originality/value: This article is perhaps the first attempt of its kind to empirically examine the bank-specific, macroeconomic variables and link it with the Basel implementation in the Indian banking system for the time period 2002–2015. This study endeavours to enhance the existing empirical research in the field and give insights into the role of various factors on GNPAs and interest rates (with regards to Indian banks).
Introduction
The banking system is an integral part of any country and plays an important role in contributing to a country’s economic development. Though the financial sector, specifically the banking sector, has undergone structural and managerial changes, still the work of Short (1979), Molyneux and Thornton (1992), Demirgüç-Kunt and Huizinga (1999); Huizinga (2000) and Arora (2014) are the benchmark research efforts in the area. Scott and Arias (2011) are of the opinion that though this industry is very dynamic and complex, it is evidently possible to find certain key indicators that affect the profitability of the banking sector.
Basel
The Basel Committee on Banking Supervision (BCBS) was established in 1974 in the backdrop of the abolition of Bretton Woods International Monetary System of fixed exchange rates. The bankruptcy of Bankhaus Herstatt caused a domino effect of collapses in the financial markets. As a result, the group of 10 (or G-10) countries 1 established the Committee on Banking Regulations and Supervisory Practices. Later renamed as BCBS with the key objective of financial stability by improving supervisory know-how and the quality of banking supervision worldwide (BCBS, 2015a).
Basel I
In 1988, the Committee refined its structure to address market risks apart from credit risk. A vital part of which was that banks were permitted to use an internal model for measuring their market risk capital prerequisite which were subject to quantitative and qualitative guidelines (BCBS, 2015a). However, this led to an increase in the notional reduction of the weight factors of assets, thus concealing the real risk exposures of credit institutions and leaving the true picture of the institution hidden behind the cloak of manipulations (Vousinas, 2015).
Summary points of Basel I:
Introduced the concept of risk weighted assets (RWA). Minimum capital requirement of 8 per cent. Ratio of core capital to total RWA to be at least 4 per cent.
Basel II
The foundation of Basel II was laid down by the deficiencies of Basel I, especially with regard to the actual and applied credit risk weights. Basel II enforced three pillars, namely, capital requirements, supervisory review process and market discipline, which were closely interlinked, inter-related and mutually reinforcing in safeguarding against the operational risk of credit institutions.
Summary points:
Ratio of core capital to total RWA remained at, at least 4 per cent. Incentives for greater use of the process of securitisation.
Indeed, even before the breakdown of Lehman brothers in 2008, the requirement for further fortifying Basel II became significant. An excessive amount of leverage and insufficient cushion of liquidity combined with poor governance and risk management prompted the severe impacts of worldwide recession and financial crisis (BCBS, 2015b). Also, there were conflicts of interest in the ratings of counterparty risk assessing credit rating agencies. Creative methods of estimating the credit risk and complex financial products like derivatives aggravated the situation. The capital requirement was not considered pro-cyclical. All these deficiencies set the path of Basel III accords.
Basel III
In 2010, Basel III (BCBS, 2010) was accepted and was agreed upon to be implemented in a phased manner starting from 2013 over 6 years till 2019.
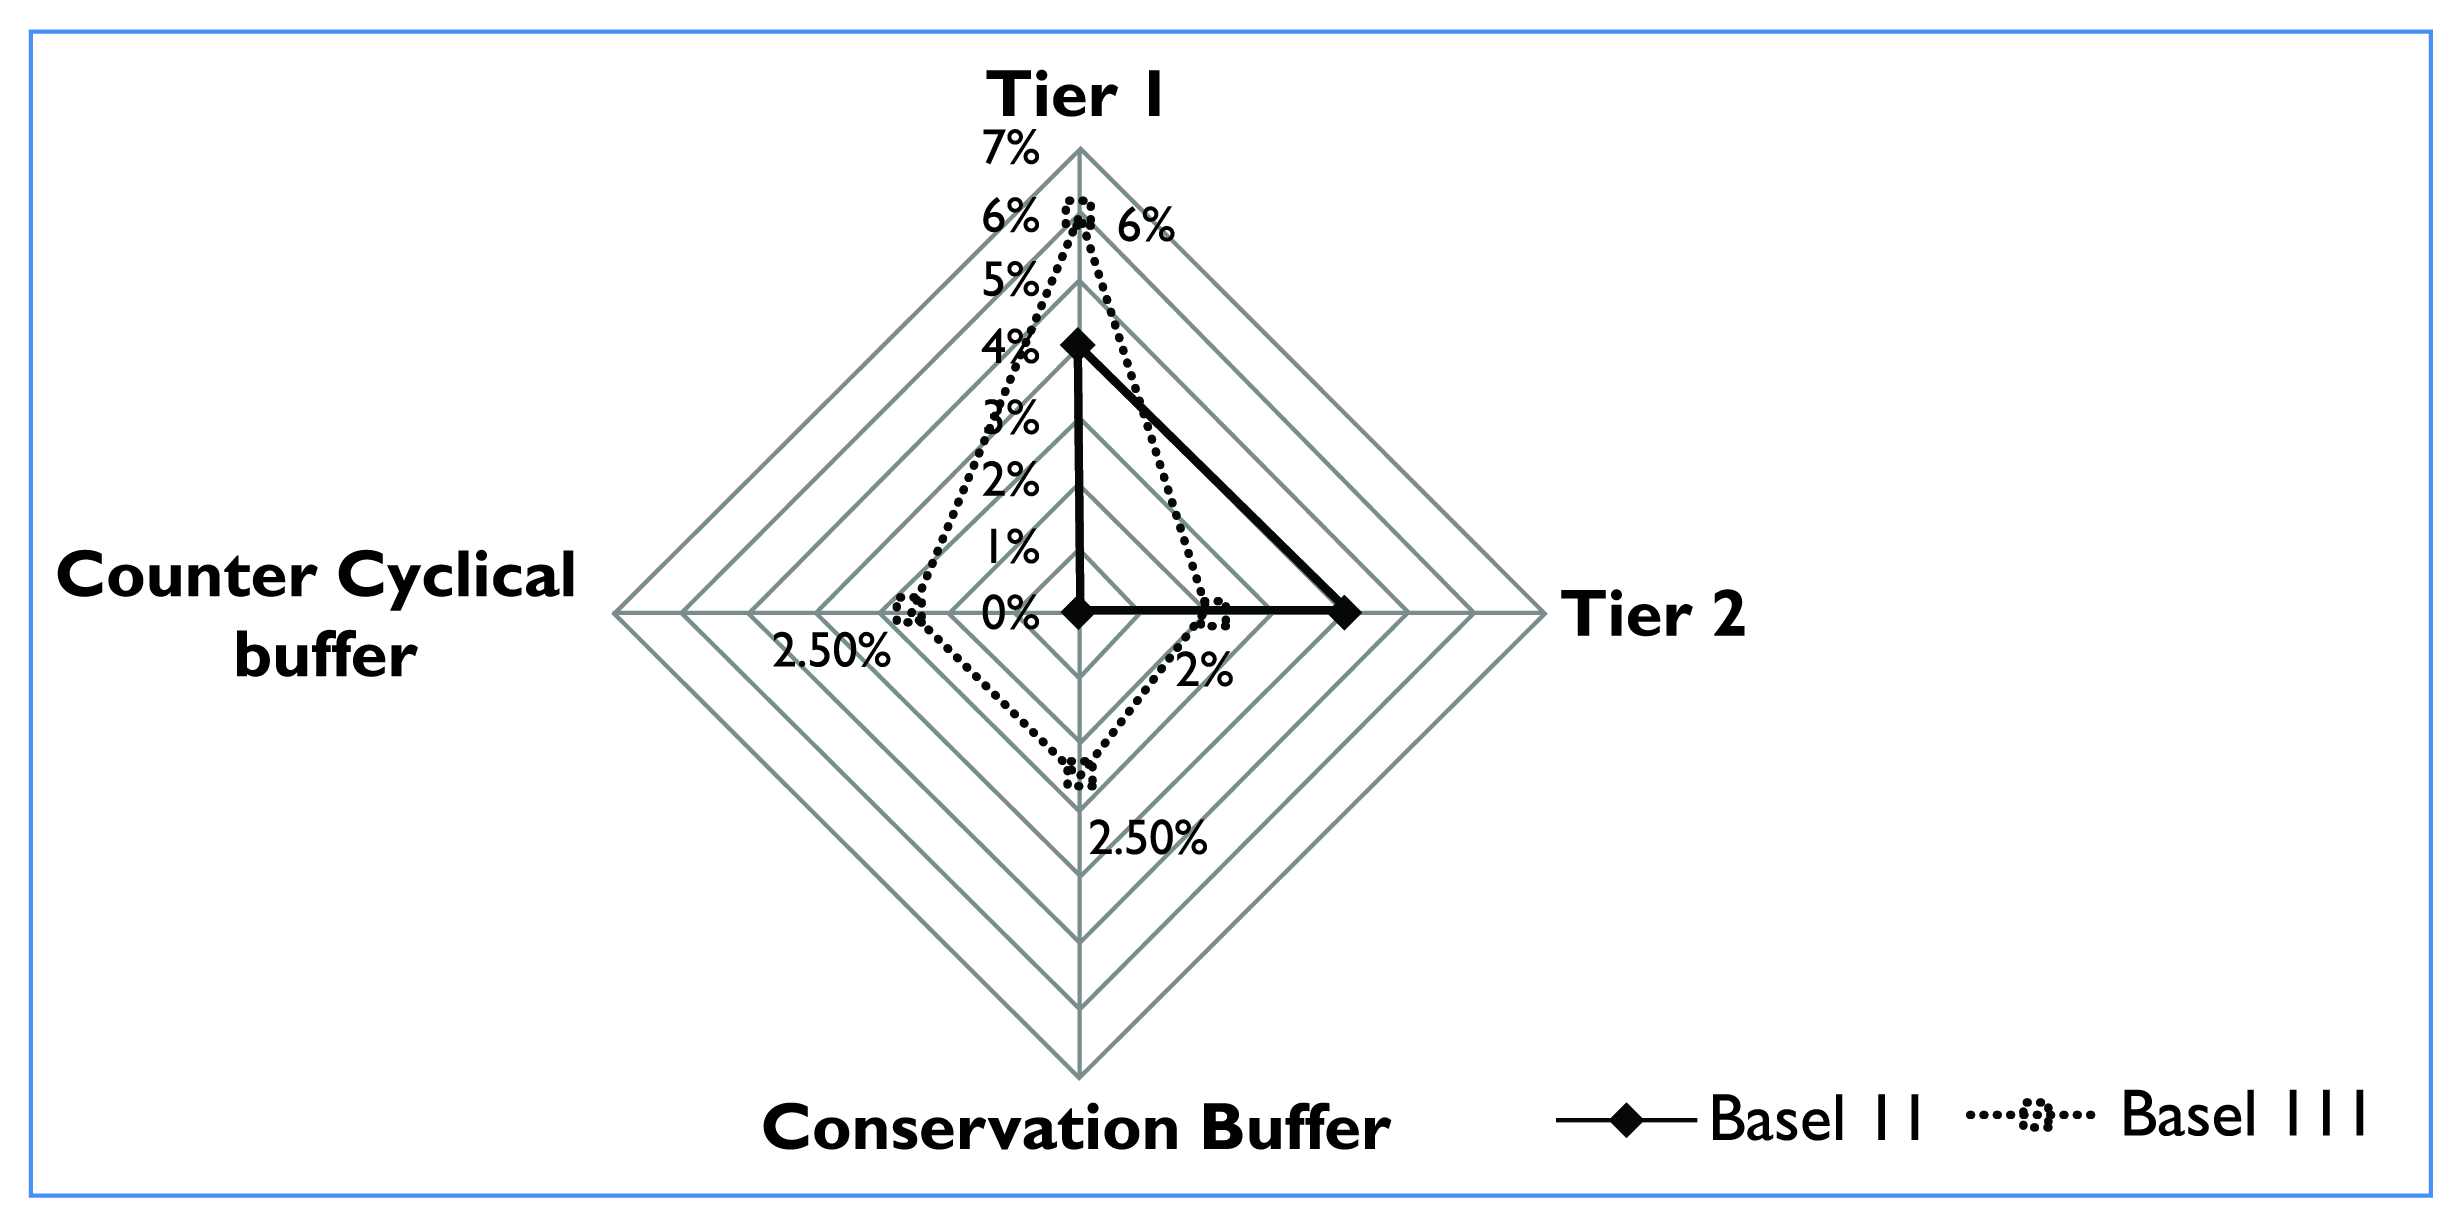
The proposed rules (as graphically represented in Figure 1):
Tier 1 capital ratio to be increased from 4 per cent to 6 per cent. Equity to RWA to be increased from 2 per cent to 4.5 per cent. Capital reserve (buffer) to be maintained at more than 2.5 per cent of capital. In the period of stress (capital adequacy ratio [CAR] < 7 per cent), financial institutions are permitted to use the excess capital generated by reducing the distribution of dividends or bonuses. Countercyclical capital surplus (0–2.5 per cent) applied only to periods of excessive credit growth (based on the discretion of the national regulatory authorities). Introduction of Liquidity Coverage Ratio (LCR) and Net Stable Funding Ratio (NSFR).
The rest of the article is organised as follows: Section 3 provides an extensive survey of the literature on the implications of Basel norms, that is, gross non-performing assets (GNPAs) and net interest margins (NIM; also called credit risk and interest risk, respectively), while the empirical methodology and description of the variables used in the empirical analysis are outlined in Section 4. Section 5 provides an empirical analysis and discussion of the results is in Section 6. Section 7 presents the conclusion.
India has been well researched in terms of its stock market integration with the other countries (Thomas, Kashiramka, & Yadav, 2017), efficiency of microfinance institutions (Kumar & Sensharma, 2017) and impact of cash dividend announcements (Anwar, Singh, & Jain, 2016) amongst various other key issues of finance domains. However, the studies related to Basel in Indian context are limited. This section synthesises the literature on the impact of Basel adherence on GNPAs and then proceeds to review the effect on interest rate.
Gross Non-performing Assets (GNPAs)
The determinants of GNPAs can be classified into three segments. The first set of studies focus on macroeconomic variables (Dash & Kabra, 2010; Espinoza & Prasad, 2010), the second set focus on both macroeconomic and microeconomic variables to identify the determinants of GNPAs (Messai & Jouni, 2013). The third set of studies focus primarily on bank-specific factors (Rajaraman & Vasishtha, 2002). Since these studies are based on different countries, the legal framework, government policies and other country-specific variables are different for each country; a general conclusion cannot be reached. Barr and Siems (1994) and Hou and Dickinson (2007) stated that the issue of NPAs has received attention lately as increasing NPAs had led to banking crisis.
This is the fundamental thought process for the endeavour in this present research effort. Poghosyan and Cihak (2011) are of the opinion that bank distress could be significantly determined by the asset quality and earning profiles of banks, along with leverage.
Existing Studies on GNPAs in India
A study on public sector banks (PSBs) conducted by Rajaraman and Vasishtha (2002) found a significant bivariate relationship between NPAs and CAR and the operating profit as a percentage of working funds (as proxy variables to operating efficiency).
Reddy, Babu, Mallikarjuna and Viswanath (2006) established a significant relation between priority sector lending and the state of NPAs in PSBs. The bank-specific variables such as credit-deposit ratios, liquidity ratio and CAR were studied by Vallabh, Bhatia and Mishra (2007) for the three types of banks PSBs, private sector banks and foreign banks. The results indicated that CAR shared a negative relationship with NPAs; however, peculiarly, the PSBs exhibited a positive relationship.
Other studies reviewed include those of Bardhan and Marjit (2005) and Bhowmick and Banerjee (2008), most of which were conducted mainly on PSBs for a period before Basel III. The literature review has indicated that very few authors have carried out empirical panel study using econometric tools to examine the determinants of NPAs (in the light of Basel norms) in the Indian banking sector. The authors have not been able to identify any study which looks at aspects of GNPAs and interest rate of both public sector and private sector banks in the light of Basel accords, for a time period that constitutes all the three accords. This study is aimed at filling the gap by giving an emphasis to bank-specific factors in explaining variations in NPAs and interest rates during the period of study (2002–2015).
Interest
The direct implication of Basel norms on interest is that in some cases its implementation may lead to a reduction in the credit supply provided by banks (Vousinas, 2015). When banks will have less money available to be disbursed and the demand for money is the same, the interest rates will increase due to inelastic supply (Miles, Yang, & Marcheggiano, 2013; Yan, Hall, & Turner, 2012). Amidu (2014) observed that regulatory initiative which restricts banking activities influences banks’ decisions to supply loans in sub-Saharan Africa.
Like the GNPAs, the literature on determinants of interest can likewise be characterised into those of bank-specific variables, industry-specific variables and macroeconomic elements. Some studies concentrate on one classification of elements while others consider two or all the three classifications of elements. By and large, many factors have been mentioned in the past studies on the determination of interest spreads and margins.
In 1998, Demirguc-Kunt and Huizinga in their benchmark research had analysed interest spreads of a sample of 80 nations. They found that few elements including bank characteristics, macroeconomic variables amongst others assume an essential part in the determination of interest. Gambacorta & Mistrulli (2004) considered both microeconomic and macroeconomic factors in an investigation of Italian banks. Grenade (2007) gauged the determinants of banks, interest spreads in the Eastern Caribbean Currency Union. In other studies of Chirwa and Mlachila (2004); Naceur and Goaied (2008); Entrop, Memmel, Ruprecht and Wilkens (2015) and Siddiqui (2012), among others, interest rate spreads are hypothesised to be a function of bank-specific and industry-specific variables, as well as macroeconomic factors. In any case, there is still a lack of empirical studies on the determination of interest rate spreads with respect to India in the context of Basel norms.
Methodology
Data
The study of 36 entities (banks) covers the period 2002–2015 which is further segregated into 2002–2008 and 2009–2015 to account for the impact (if any) of financial crisis as also stated by Macroeconomic Assessment Group (MAG, 2010). 2
Selection of Variables
Dependent variable is GNPAs in the first model and NIM in the second model. The possible explanatory, bank-specific determinants are selected keeping in mind the frequently used ratios of RBI. The CAMELS 3 model for performance measurement is selected as it is an important supervisory tool that defines the Indian bank performance in an objective manner (Dhar & Bakshi, 2015). CAMELS has been used in the study by Prasuna (2004), Siva and Natarajan (2011) and Chaudhry and Singh (2012), among others. Subsequently, the independent variables are selected from the extensive literature reviewed.
Explanatory Variables
Capital Adequacy Ratio (CAR)
CAR as defined by the Basel accord is capital to RWA. This ratio calculates banks’ profitability and efficiency to absorb shocks and risks including NPAs. As the CAR is increased, it leaves less money to disburse as loan, thus increasing the interest spreads. In the model it is expected that CAR is positively related to interest. According to the studies conducted by Mukherjee (2003) and Sinha (2006), it was revealed that NPAs are negatively related to CAR. Chipalkatti and Rishi (2007) are of the opinion that banks in order to reduce the loan loss provisions may have an intention to understate their NPAs to overstate their CAR.
NPAs to Net Advances
According to Were and Wambua (2014), there is a positive relationship between credit risk as measured by non-performing assets (NPA) ratio and interest rate spreads. Banks are compelled to shift the risk premium associated with NPAs to the borrowers, which may be coupled with a reduction in the rates offered to the depositors. The results are consistent with those found by other studies such as Ngugi (2001) and Beck et al. (2010) based on Kenya. Chirwa and Mlachila (2004) and Siddiqui (2012) also found a positive impact of NPA ratio on interest spreads of commercial banks for Malawi and Pakistan, respectively. Siddiqui (2012) indicated that NPA ratio significantly influences interest spreads. In this model, a positive relation between the NPAs and interest is expected.
Profit per Employee (PPE)
PPE gauges the management efficiency. It is measured by dividing the net profit of the bank by its total number of employees. It is believed that employees play a major role in maintaining a higher asset quality. The PPE is expected to have a negative impact on interest as it is the employees who have the ability to appraise credit proposals and monitor them after the disbursal of the same. According to Berger and DeYoung (1997), an increase in spending on monitoring and a decrease in PPE are related. Thus, in this study a negative relationship between GNPAs and PPE is expected.
Net Interest Margin (NIM) to Total Assets
NIM measures banks’ earning quality by estimating the percentage of net interest income divided by total assets. The studies reviewed present two opposite viewpoints about the relation of NIM and GNPAs. According to one set of views, there exists a positive relation between NIM and credit risk (i.e., GNPAs) which means that as the NIM increases the credit risk of a bank also increases. NIM increases when the lending rates differ significantly from deposit rates generally to provide cushion for a possible default risk as proved empirically by Demirgüç-Kunt and Huizinga (1999), Mendes and Abreu (2003) and Valverde and Fernandez (2007), among others. On the other hand, it is proved that NIM has a negative relationship with GNPAs. The reason stated is that since NIM narrows, the banks’ profit is reduced. In order to increase their profits, the banks invest in more risky ventures to increase their profits and to compensate for the narrow NIMs leading to NPAs (Dewatripont & Tirole, 1994). This study supports the first view and expects a positive relationship.
Return on Assets (ROA)
ROA, an indicator of banks’ performance is calculated by dividing total profits by total assets. If the portfolio of loan consists more of NPAs, then there would be higher provisions of NPAs reducing the profits (and consequently the return on assets). The study of Godlewski (2004) indicated a negative relation between ROA and NPAs. Siddiqui (2012) stated that ROA affect the interest rate spreads significantly by conducting a study on individual banks-specific data for a panel of 22 banks.
Credit-deposit Ratio (CDR)
It is the proportion of how much a bank loans out of the deposits it has accumulated. It indicates the amount of banks’ core funds which are being utilised for loaning which is its principle banking activity. A higher ratio indicates more dependence on deposits for loaning. Thus, a positive relation between interest and CDR is expected. It can be understood as the proportion of loan-assets created by banks from the deposits received. According to studies conducted by Caprio and Klingebiel (1996), Keeton (1999) and Jesus and Gabriel (2006), loan loss or GNPAs are caused by credit growth. In this study, it is expected that the CDR affects GNPAs positively.
Investment-deposit Ratio (IDR)
The IDR ratio is calculated by dividing the investment of a bank by its deposits. Investment in government securities is less risky, it is expected that an increases in such investments may bring down NPA levels through a lower disbursal of loans. Also, as these investments receive a lower rate of interest, they have an impact on banks’ income. Thus, to ensure similar returns (as in previous periods), it increases the lending rates and decreases the deposit rates. Therefore, a negative relationship is expected between IDRs and GNPA ratios (Dhar & Bakshi, 2015) and a positive relation between NIM and IDRs.
Lending to the Sensitive Sector (SEN)
The ‘SEN’ or sensitive sector lending comprises of sectors which are volatile, such as lending to commercial real estate, commodity sector and capital markets. The SEN ratio is calculated as per the RBI guidelines as SEN lending to gross advance ratio. Banks generally lend to SEN to increase their short-term profitability. Hence, in this study a positive relation between SEN lending and GNPAs is expected. Thus, even interest is expected to have a positive relationship with SEN lending.
GDP Growth Rate (GDP)
In this model, GDP growth rate is taken as a proxy for macroeconomic variables. GDP is defined as the sum of gross value added by all producers residing in the economy including any product taxes and deducting any subsidies not included in the value of the products.
The reason for high lending rates is the higher cost of holding stricter capital and liquidity. Banks in order to maintain higher CAR have less funds for disbursement as loans. This has been proved by Wong, Fong, Li and Choi (2010) and Gambacorta (2011) by an econometric error correction model (ECM). Thus, in this model a negative relation between GDP growth rate and interest is expected.
Model 1: GNPAs
In this study, an existing well-established model as used by Demirgüç-Kunt and Huizinga (1999), Mendes and Abreu (2003) and Athanasoglou, Brissimis and Delis (2008) is used to study the relationship and impact of bank-specific variables with the GNPAs. The model is presented ahead:

where GNPAit = GNPA ratio, that is, ratio of GNPA to gross advance for i-th bank at t time.
α = Constant.
β = coefficients of determinants of GNPA ratio.
Xk = k-th regressor.
K = Number of regressors or independent variable.
uit = error term

where α = constant,
β1 to β9 = coefficients of determinants of GNPA ratio,
i (index of banks) = 1, 2 […] 36 and
t (time-interval) = 1, 2 […] 14.

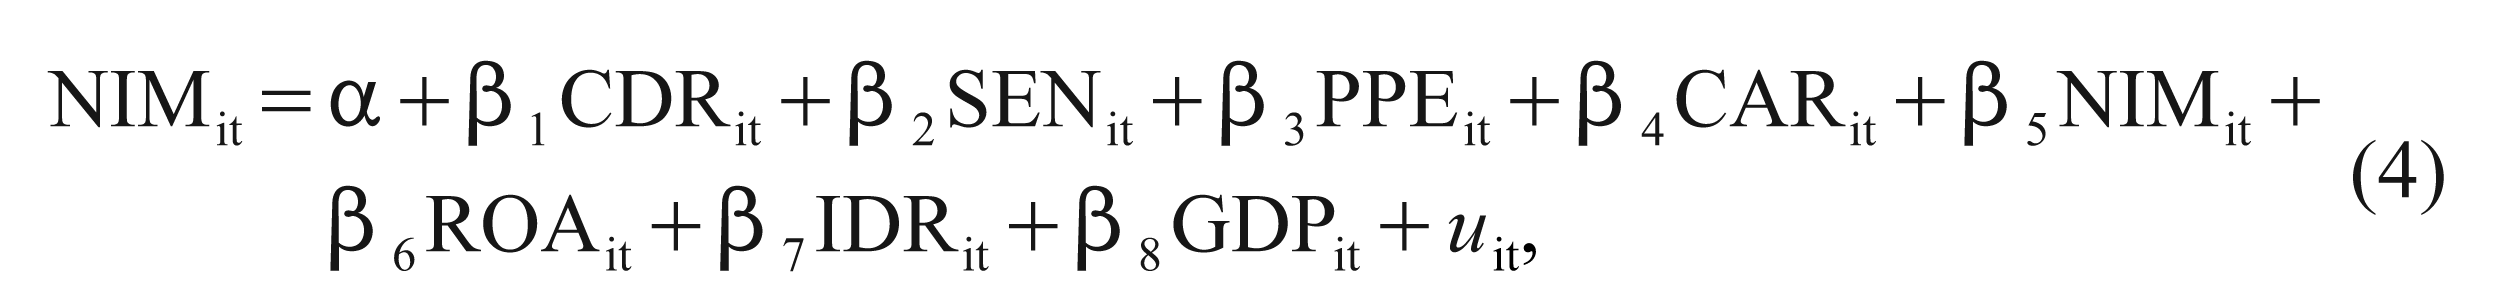
where Interestit = NIM ratio, that is, ratio of net interest income of the bank divided by total assets. Other variables are same as the previous model.
where α = constant,
β1 to β9 = coefficients of determinants of GNPA ratio,
i (index of banks) = 1, 2 […] 36,
t (time-interval) =1, 2 […] 14 and uit = error term.
The literature provides three approaches to evaluate a panel data: classic linear regression model (CLR), fixed effect model (FEM) and random effect model (REM) (Brooks, 2014).
The low value of the test statistic of the Breusch and Pagan LM test clearly indicated the preference of FEM or REM over CLR model in all cases. The descriptive statistics are provided in Annexure 1.
Model 1: GNPAs (Credit Risk)
Credit-deposit Ratio
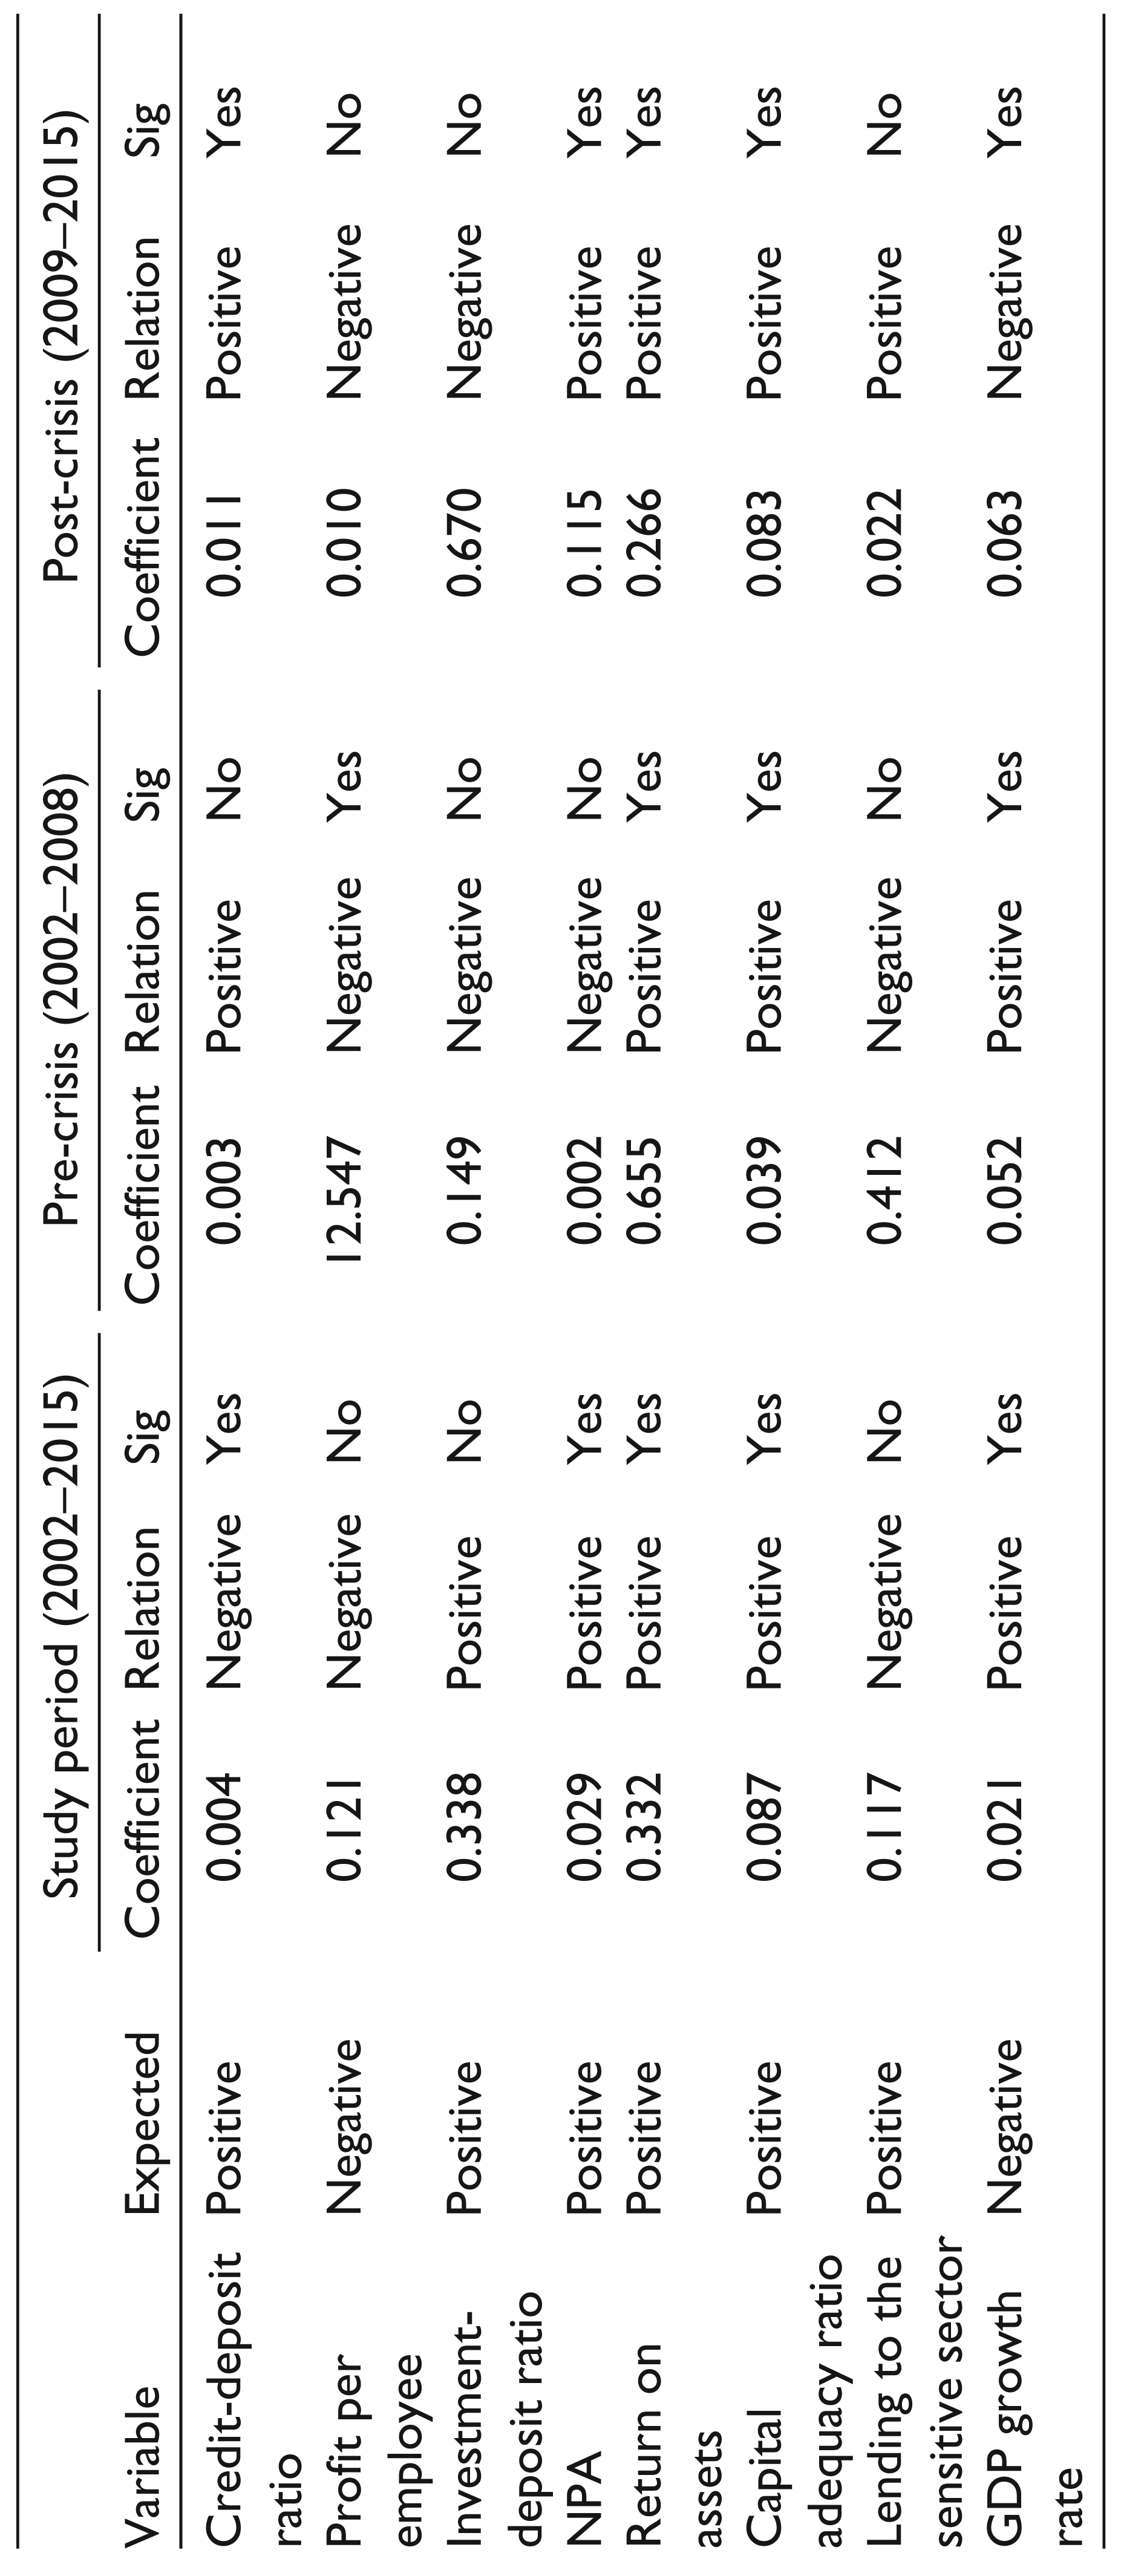
As observed in Table 1, the coefficient of CDR is negative which implies that higher loan disbursals by banks has a negative influence on GNPA ratios before the crisis. However, according to the literature review of studies conducted by Caprio and Klingebiel (1996); Keeton (1999) and Jesus and Gabriel (2006), it is expected that CDR affects GNPAs positively. Thus, a bank should not hesitate to give away more credit but do so cautiously. The result post-crisis states otherwise, however, it is statistically insignificant.
Lending to the SEN
The coefficient of SEN is negative before the subprime crisis which is in contrast to the expected result. The literature reviewed in this study mostly related to studies on PSBs exhibited a positive relation. However, the study which includes both public and private presents a negative relationship. It is evident that before the crisis when the economy was in a boom, high risk portfolios resulted in higher returns as a result decreasing the GNPAs. However, after the crisis when the economy was in a recession, these sensitive sectors turned out to be risky thus increasing the GNPAs which is evident from the positive relationship after the crisis.
Summary of Results for the Different Time Periods
Summary of Results for the Different Time Periods
The negative coefficient of PPE conforms to the hypothesis. It indicates that employees play a role in managing NPAs. Some instances stated by Narasimham Committee (1998) state that employees sometimes offer loans to such parties (termed as ‘ever greening’ in banking dynamics) which in the end reach the status of NPAs. However, the study contradicts it and proves that GNPAs can be reduced by increasing the PPE.
Capital Adequacy Ratio
The coefficient of CAR is on the same lines as expected before the crisis, that is, negative. The results reinstate the results of the studies reviewed in the literature. However, peculiarly the result of the post-crisis period contradicts with the existing literature which could be because of the fact that the banks invest in risky proposals to earn a higher return in order to stabilise and maintain the existing profits which tend to decrease after the implementation of Basel III’s stricter capital norms.
Net Interest Margin
The statistically significant positive coefficient of NIM indicates that as the GNPAs increase the NIM also increases and vice versa. This reinstates the first school of thought of literature that as the GNPAs increase the banks (in order to hedge the risk) shift the default risk to customers by increasing the lending rate. This in turn increases the range between the lending and deposit rate. Therefore, banks need to manage the interest spreads so that the asset quality is maintained efficiently.
Return on Assets (ROA)
The coefficient of ROA is negatively related to GNPAs as expected. The relationship is statistically significant post–crisis, however, is insignificant for the comprehensive time frame under study. This confirms that as the efficiency improves (i.e., ROA) the GNPAs reduce.
Investment-deposit Ratio
The positive significant coefficient of IDR is contradictory to the results stated in the literature. The implication is that the RBI needs to further make the SLR and CRR more stringent so as to make sure banks are not tempted to invest in such securities which make its portfolio prone to risk.
Interest Rate Risk
Descriptive statistical results of Model 2 are provided in Annexure 2. The low value of the test statistic of the Breusch and Pagan LM test clearly indicated the preference of FEM or REM over CLR model in all cases.
Model 2: NIM
Credit-deposit Ratio
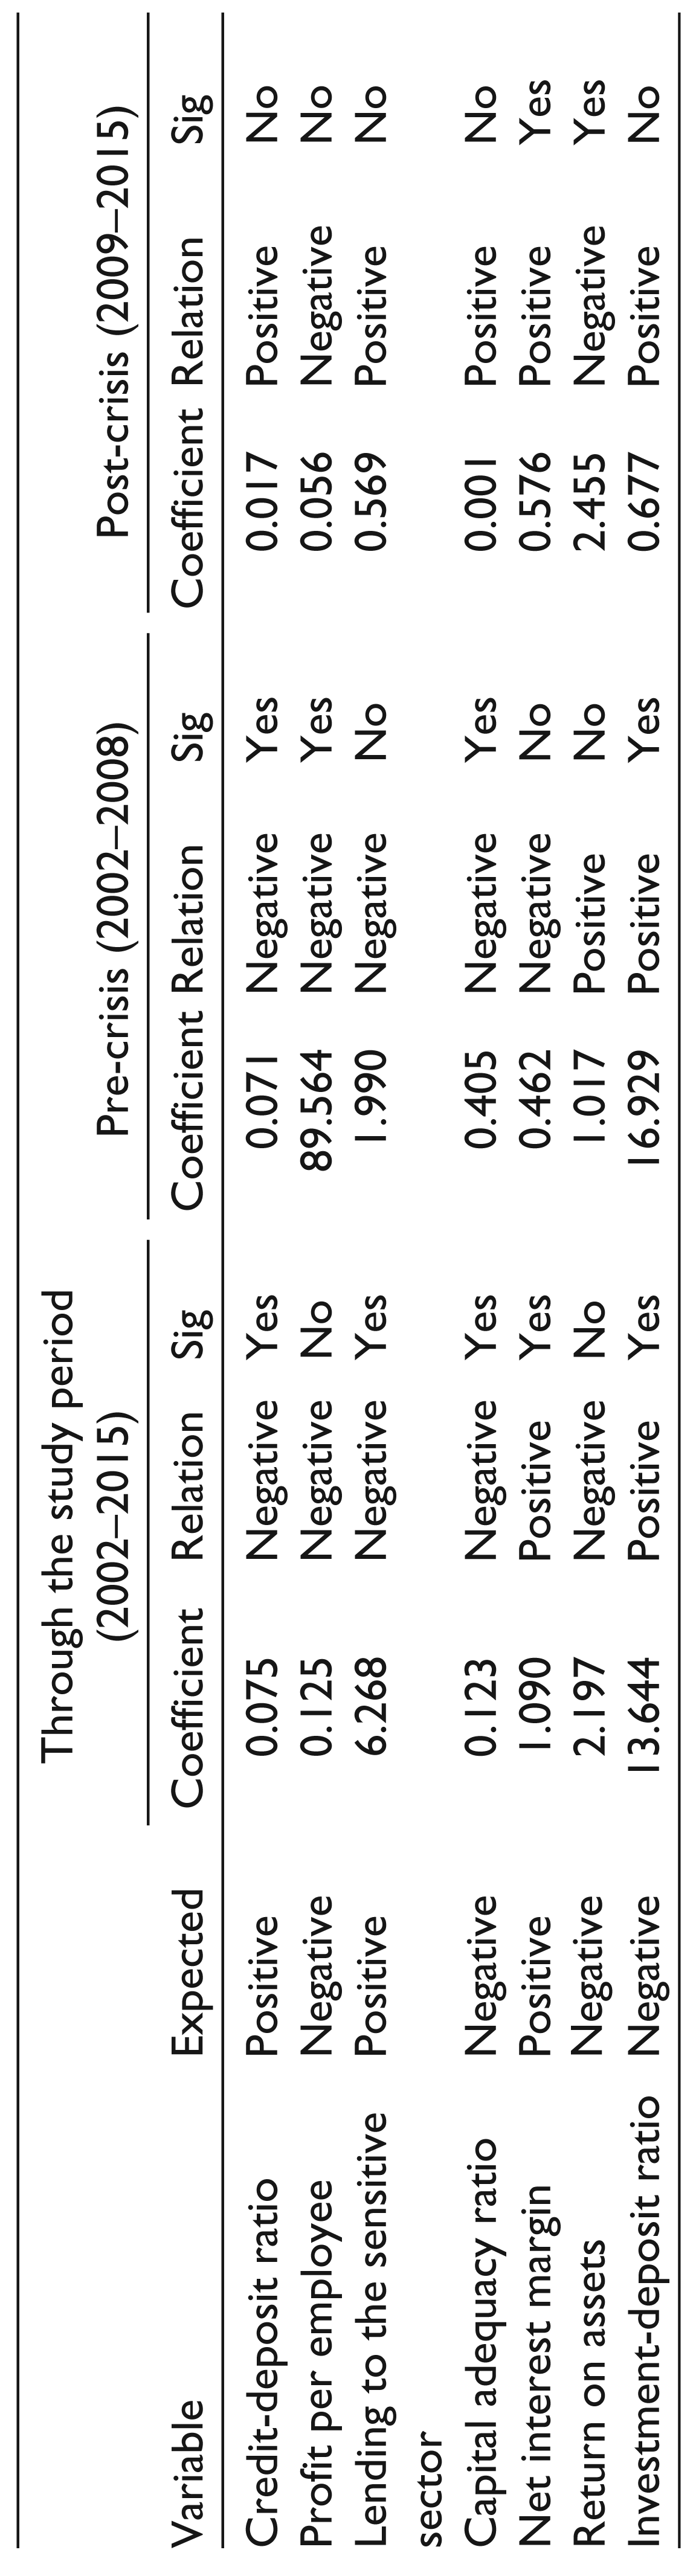
As observed in Table 2, the coefficient of CDR is positive for the pre- and post-crisis period, as expected. However, the overall result indicates a negative relationship. This implies that higher loan disbursals by banks have a positive influence on NIM.
Lending to the SEN
The coefficient of SEN is negative overall predominantly before the subprime crisis which is in contrast to the expected result. It is of pertinent importance to note that SEN lending has a positive relationship with NIM after the subprime crisis which indicates that as the lending to SEN sector increases, (which are generally risky especially after the crisis situation) the spread of interest also increases.
Profit per Employee
The negative coefficient of PPE conforms to the said hypothesis that PPE is negatively related to the NIM.
Capital Adequacy Ratio
The coefficient of CAR is on the same lines as expected throughout the period of study, that is, positive. The results reinstate the findings of the studies reviewed in the literature (MAG, 2010). The banks in order to be able to maintain the existing profits after tighter capital norms increase the interest rates, thus increasing the interest margins. This perhaps is one of the major drawbacks of Basel implementation.
Return on Assets (ROA)
The coefficient of ROA is significantly positively related to NIM as expected in the findings of the literature. This goes to indicate that as the NIM increases the ROA or the efficiency of the banks tends to increase.
Summary of Results for the Different Time Periods
Summary of Results for the Different Time Periods
The positive coefficient of IDR in the entire study period is consistent with the literature that indicates that as the investment of banks increases, the NIM increases and vice versa. This result is contradictory to the results for the sub study periods of pre-crisis and post-crisis. As the IDR increases (i.e., the banks park higher amounts in CRR and SLR), the pool of resources available for banks to be given as loans reduces, which in turn increases the lending rates, thereby reducing the NIM.
GDP Growth Rate
Wong et al. (2010) and Gambacorta (2011) concluded a negative relation between GDP growth rate and NIM. The results were contradictory for the total time frame; however, the result proves consistency for shorter time period, that is, after the subprime crisis. This contradiction from the findings of the literature could be a result of the recent recession wherein the GDP fell steeply.
Discussion
Credit Risk for Public Sector Banks (PSBs) 4
As it can be observed from the table (in Annexure 3), the PPE and ROA conforms to the results in the findings of the literature for all the time frames. The CDR and NIM exhibit consistency with the results present in the literature only after the crisis. This is perhaps because before the crisis economy faced a boom and the return avenues were much more than the risk involved, therefore a higher CDR resulted in higher profits for the banks rather than GNPAs.
The lending to sensitive sector exhibits an impressive negative trend contradictory to the findings of the available literature. It clearly indicates that the PSBs are managing their SEN lending well and are thereby reducing their GNPAs. CAR exhibited consistency before the crisis, however, after the commencement of implementation of Basel III’s stricter capital measures the variable indicates a positive relationship with GNPAs similar to the result of the entire banking sector post-crisis. A reason for this can be that as the compliance for tighter capital is increasing the banks in order to maintain their previous profits invest in risky avenues for higher profits. IDR is observed to indicate a positive relation unlike the negative trend expected. The reason is similar to CAR.
Credit Risk for Private Sector Banks 5
The PPE (being consistent with the existing studies) exhibits a negative trend. The CDR and lending to sensitive sector indicates a contradiction with the findings in the literature (Jesus & Gabriel, 2006; Keeton, 1999). Both these variables were expected to be positive, however, under all time frames a negative relationship has been observed. This indicates the degree of efficiency, caution and high recovery rates at the private sector banks. A higher CAR and IDR are expected to reduce GNPAs, however, it is actually working in the reverse. The fear of less money for loan disbursement due to stricter and tighter capital norms has induced banks to invest in riskier proposals. NIM and ROA have exhibited consistency with existing studies after the crisis.
Interest Risk (NIM) for Public Sector Banks (PSBs)
Interest margin presents a negative relation with PPE and a positive relation with CAR, NPA and ROA as suggested by the existing studies. 6 CDR and SEN lending that ought to have positive relation with NIM comply only in the post-crisis phase (and contradicts in the other two time frames). This is perhaps because pre-crisis banks had excess money available to disburse as loans to sensitive sectors. IDR although consistent with the literature findings in the pre-crisis phase exhibited a positive relation; however, exhibited a negative relation in the post-crisis phase. GDP was expected to be negatively related to NIM, however, it indicated a positive relation in the pre-crisis phase. This could be due to the high return earning projects available before the crisis in the period of boom. GDP indicated a negative relation, consistent to the findings in the literature only in the post-crisis phase.
Interest Risk (NIM) for Private Sector Banks
CDR, PPE, SEN, CAR and ROA reinstated the existing findings in the literature. 7 IDR exhibited a contrasting result in the different time frames. According to the literature findings, IDR has a positive relation with interest margins. GDP exhibited a negative trend post commencement of implementation of Basel III which indicates that as capital requirements become tighter, less funds are available for disbursement which in turn increases the interest rates. The findings of Wong et al. (2010) and Gambacorta (2011) are reported to be similar.
Conclusion
It may be concluded that PPE is negatively related to GNPAs and IDR is positively related to GNPAs under all circumstances. CAR, one of the major components affected by Basel norms in negatively related to GNPAs, however, it has been observed that after the financial crisis this variable has exhibited a positive relation. Similarly, the SEN had been indicating a negative impact on GNPAs, however, post-crisis, it has exhibited a positive relationship. Thus, it can be stated that after the implementation of Basel II both variables—SEN lending and CAR—have started exhibiting a positive relation with GNPAs. According to studies conducted by Mukherjee (2003) and Sinha (2006) on various Indian banks, it was revealed that NPAs are negatively related to CAR. The same is true for the findings for the period before 2008. However, the results post-crisis support findings of Chipalkatti and Rishi (2007). They were of the opinion that banks in order to reduce the loan loss provisions may have an intention to understate their NPAs. In our view, this is being done by banks to be in synchronisation with the required tighter capital norms. Hence, this overstating of CAR is leading to GNPAs.
From the second model it is concluded that PPE is negatively related to NIM which reinstates the findings of the literature reviewed. Similarly, it can be concluded that the ROA of the banks is positively related to the NIM. The GDP growth rate (an indicator of macroeconomic variable) has indicated a highly significant negative relation with NIM as suggested by the findings in the literature only in the Basel II and Basel III norms. This means that a high GDP growth rate reduces the interest margins. As stated earlier CAR is an important tool in Basel implementation. This study (across all time frames) indicates a statistically significant positive relationship between CAR and NIM. This suggests that as the capital adequacy becomes stricter, the banks tend to raise the interest rates of lending (which is a cause for concern). This analysis through empirical and statistical relationships indicate that there is a potential increase of interest rates on loans in the banking system of India due to the phased-in implementation of Basel III regulatory reforms.
This study acknowledges, however, that the article has several limitations. Foremost, difficulty in quantification has limited other possible economic benefits and costs arising from the Basel III requirements. Notwithstanding this, effort has been undertaken to quantify the impact of the Basel requirements for the Indian economy in one of the first stand-alone country analyses of the combined impact of the recently agreed changes to the international standards for banks’ capital and liquidity.
Footnotes
Model 1: GNPAs
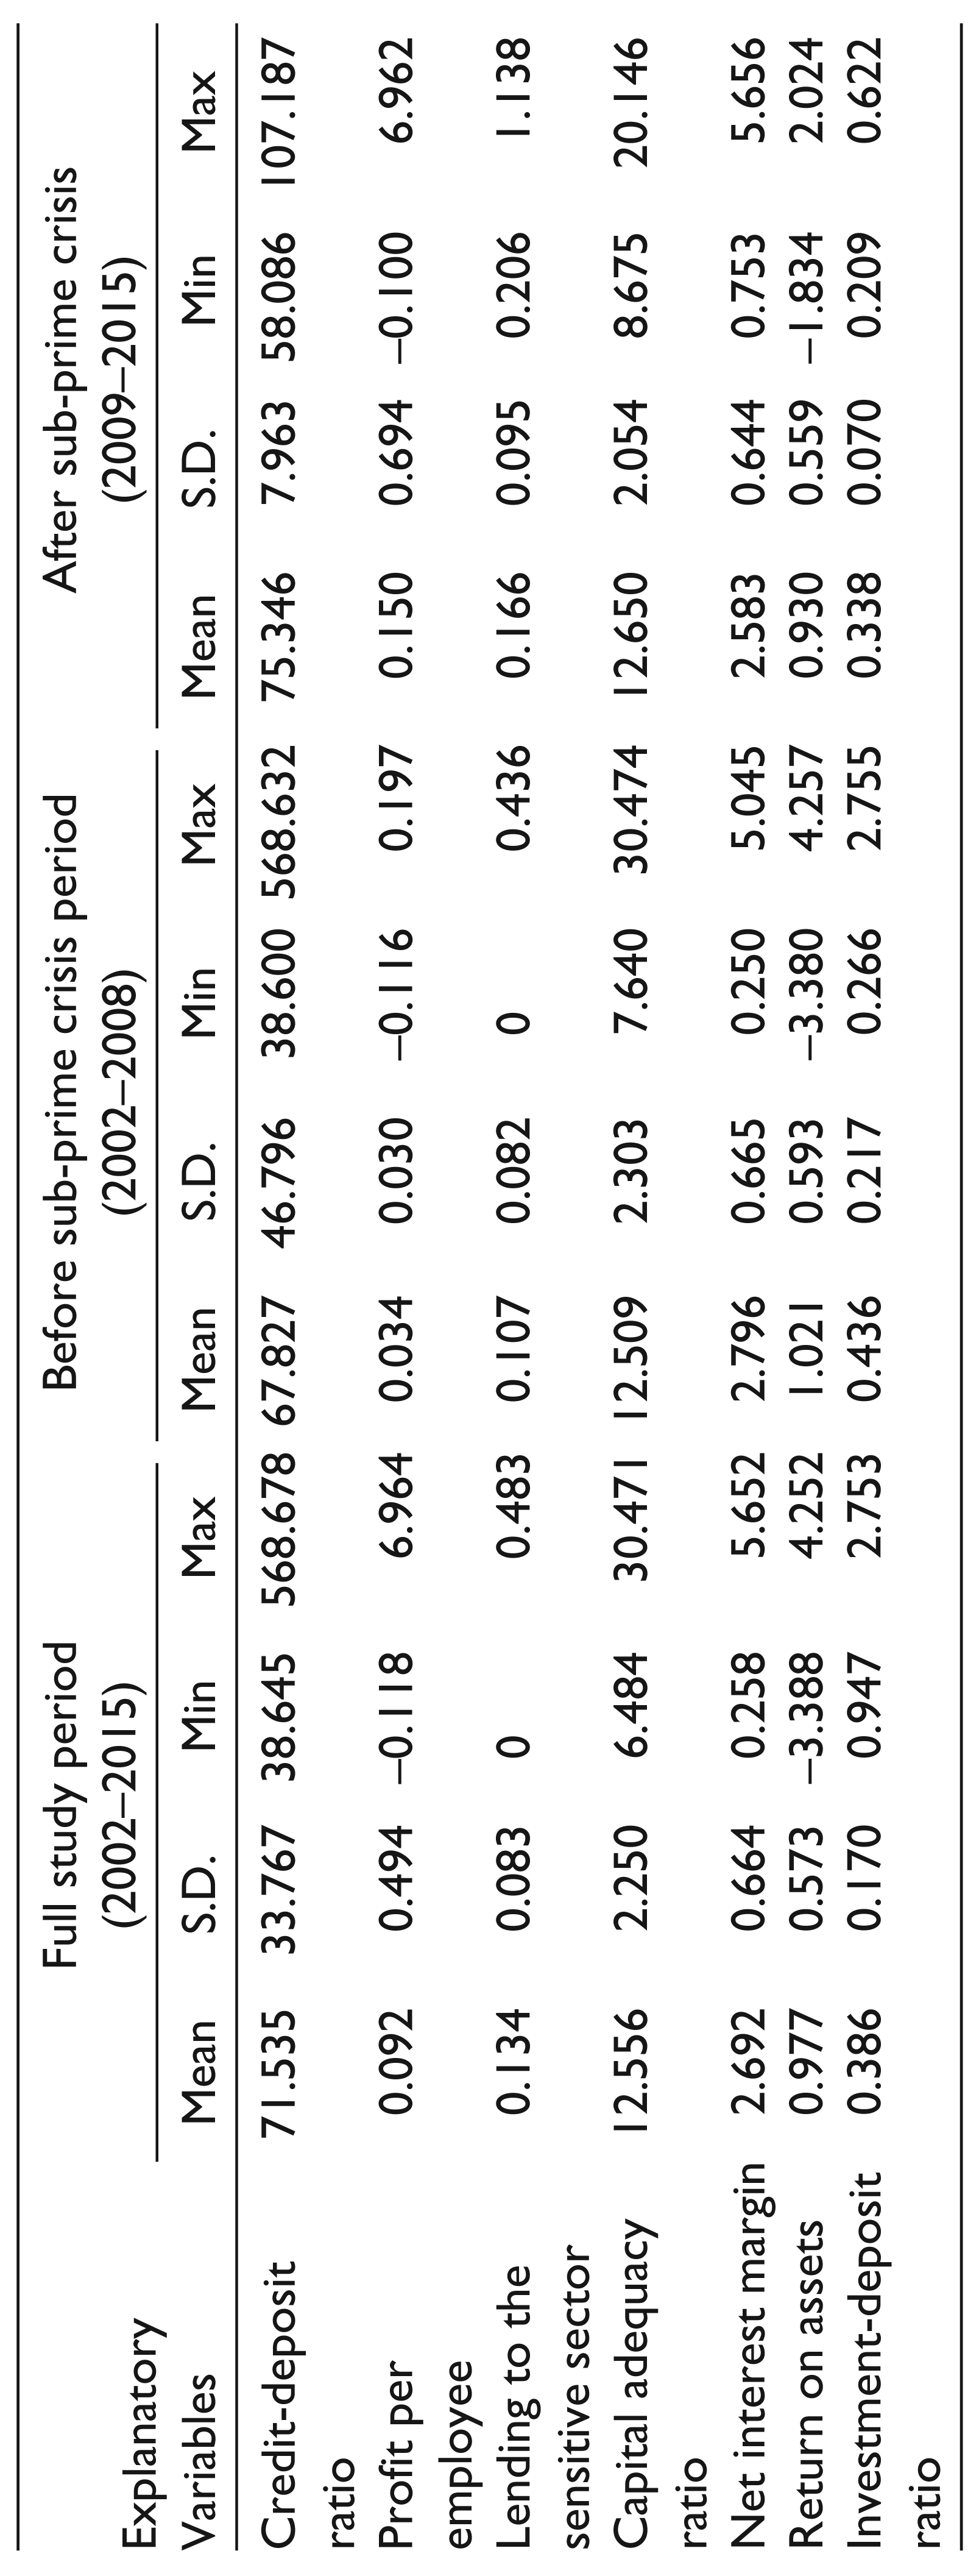
Descriptive Statistical Results of Model 1(GNPAs) for 2002–2015, Before and After Sub-prime Crisis
| Explanatory Variables | Full study period (2002‒2015) |
Before sub-prime crisis period (2002‒2008) |
After sub-prime crisis (2009‒2015) |
|||||||||
| Mean | S.D. | Min | Max | Mean | S.D. | Min | Max | Mean | S.D. | Min | Max | |
| Credit-deposit ratio | 71.535 | 33.767 | 38.645 | 568.678 | 67.827 | 46.796 | 38.600 | 568.632 | 75.346 | 7.963 | 58.086 | 107.187 |
| Profit per employee | 0.092 | 0.494 | ‒0.118 | 6.964 | 0.034 | 0.030 | ‒0.116 | 0.197 | 0.150 | 0.694 | ‒0.100 | 6.962 |
| Lending to the sensitive sector | 0.134 | 0.083 | 0 | 0.483 | 0.107 | 0.082 | 0 | 0.436 | 0.166 | 0.095 | 0.206 | 1.138 |
| Capital adequacy ratio | 12.556 | 2.250 | 6.484 | 30.471 | 12.509 | 2.303 | 7.640 | 30.474 | 12.650 | 2.054 | 8.675 | 20.146 |
| Net interest margin | 2.692 | 0.664 | 0.258 | 5.652 | 2.796 | 0.665 | 0.250 | 5.045 | 2.583 | 0.644 | 0.753 | 5.656 |
| Return on assets | 0.977 | 0.573 | ‒3.388 | 4.252 | 1.021 | 0.593 | ‒3.380 | 4.257 | 0.930 | 0.559 | ‒1.834 | 2.024 |
| Investment-deposit ratio | 0.386 | 0.170 | 0.947 | 2.753 | 0.436 | 0.217 | 0.266 | 2.755 | 0.338 | 0.070 | 0.209 | 0.622 |
Model 2: NIM
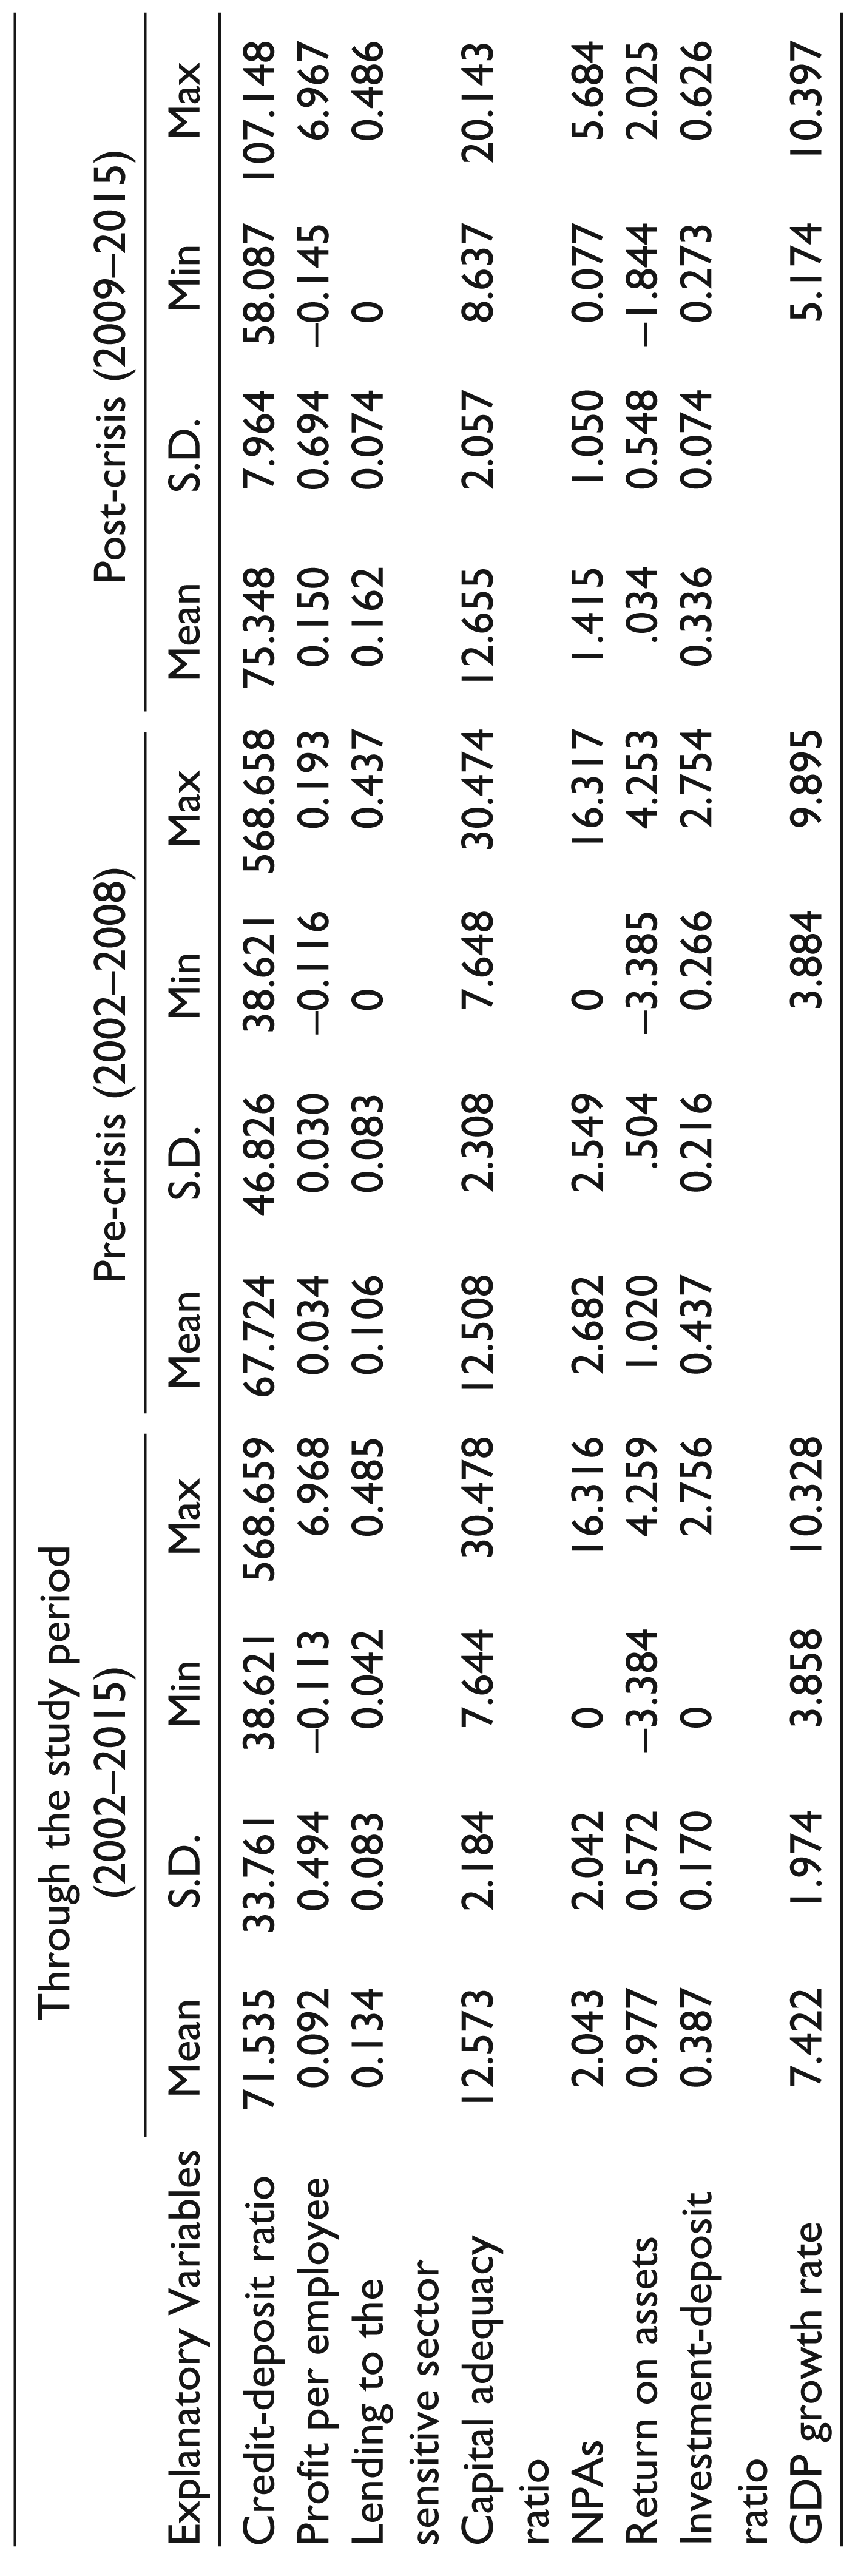
Descriptive Statistical Results of Model 2 (NIM) for 2002–2015, Before and After Sub-prime Crisis
| Explanatory Variables | Through the study period (2002‒2015) |
Pre-crisis (2002‒2008) |
Post-crisis (2009‒2015) |
|||||||||
| Mean | S.D. | Min | Max | Mean | S.D. | Min | Max | Mean | S.D. | Min | Max | |
| Credit-deposit ratio | 71.535 | 33.761 | 38.621 | 568.659 | 67.724 | 46.826 | 38.621 | 568.658 | 75.348 | 7.964 | 58.087 | 107.148 |
| Profit per employee | 0.092 | 0.494 | ‒0.113 | 6.968 | 0.034 | 0.030 | ‒0.116 | 0.193 | 0.150 | 0.694 | ‒0.145 | 6.967 |
| Lending to the sensitive sector | 0.134 | 0.083 | 0.042 | 0.485 | 0.106 | 0.083 | 0 | 0.437 | 0.162 | 0.074 | 0 | 0.486 |
| Capital adequacy ratio | 12.573 | 2.184 | 7.644 | 30.478 | 12.508 | 2.308 | 7.648 | 30.474 | 12.655 | 2.057 | 8.637 | 20.143 |
| NPAs | 2.043 | 2.042 | 0 | 16.316 | 2.682 | 2.549 | 0 | 16.317 | 1.415 | 1.050 | 0.077 | 5.684 |
| Return on assets | 0.977 | 0.572 | ‒3.384 | 4.259 | 1.020 | .504 | ‒3.385 | 4.253 | .034 | 0.548 | ‒1.844 | 2.025 |
| Investment-deposit ratio | 0.387 | 0.170 | 0 | 2.756 | 0.437 | 0.216 | 0.266 | 2.754 | 0.336 | 0.074 | 0.273 | 0.626 |
| GDP growth rate | 7.422 | 1.974 | 3.858 | 10.328 | 3.884 | 9.895 | 5.174 | 10.397 | ||||
Model 1: Credit Risk for Public Sector Banks
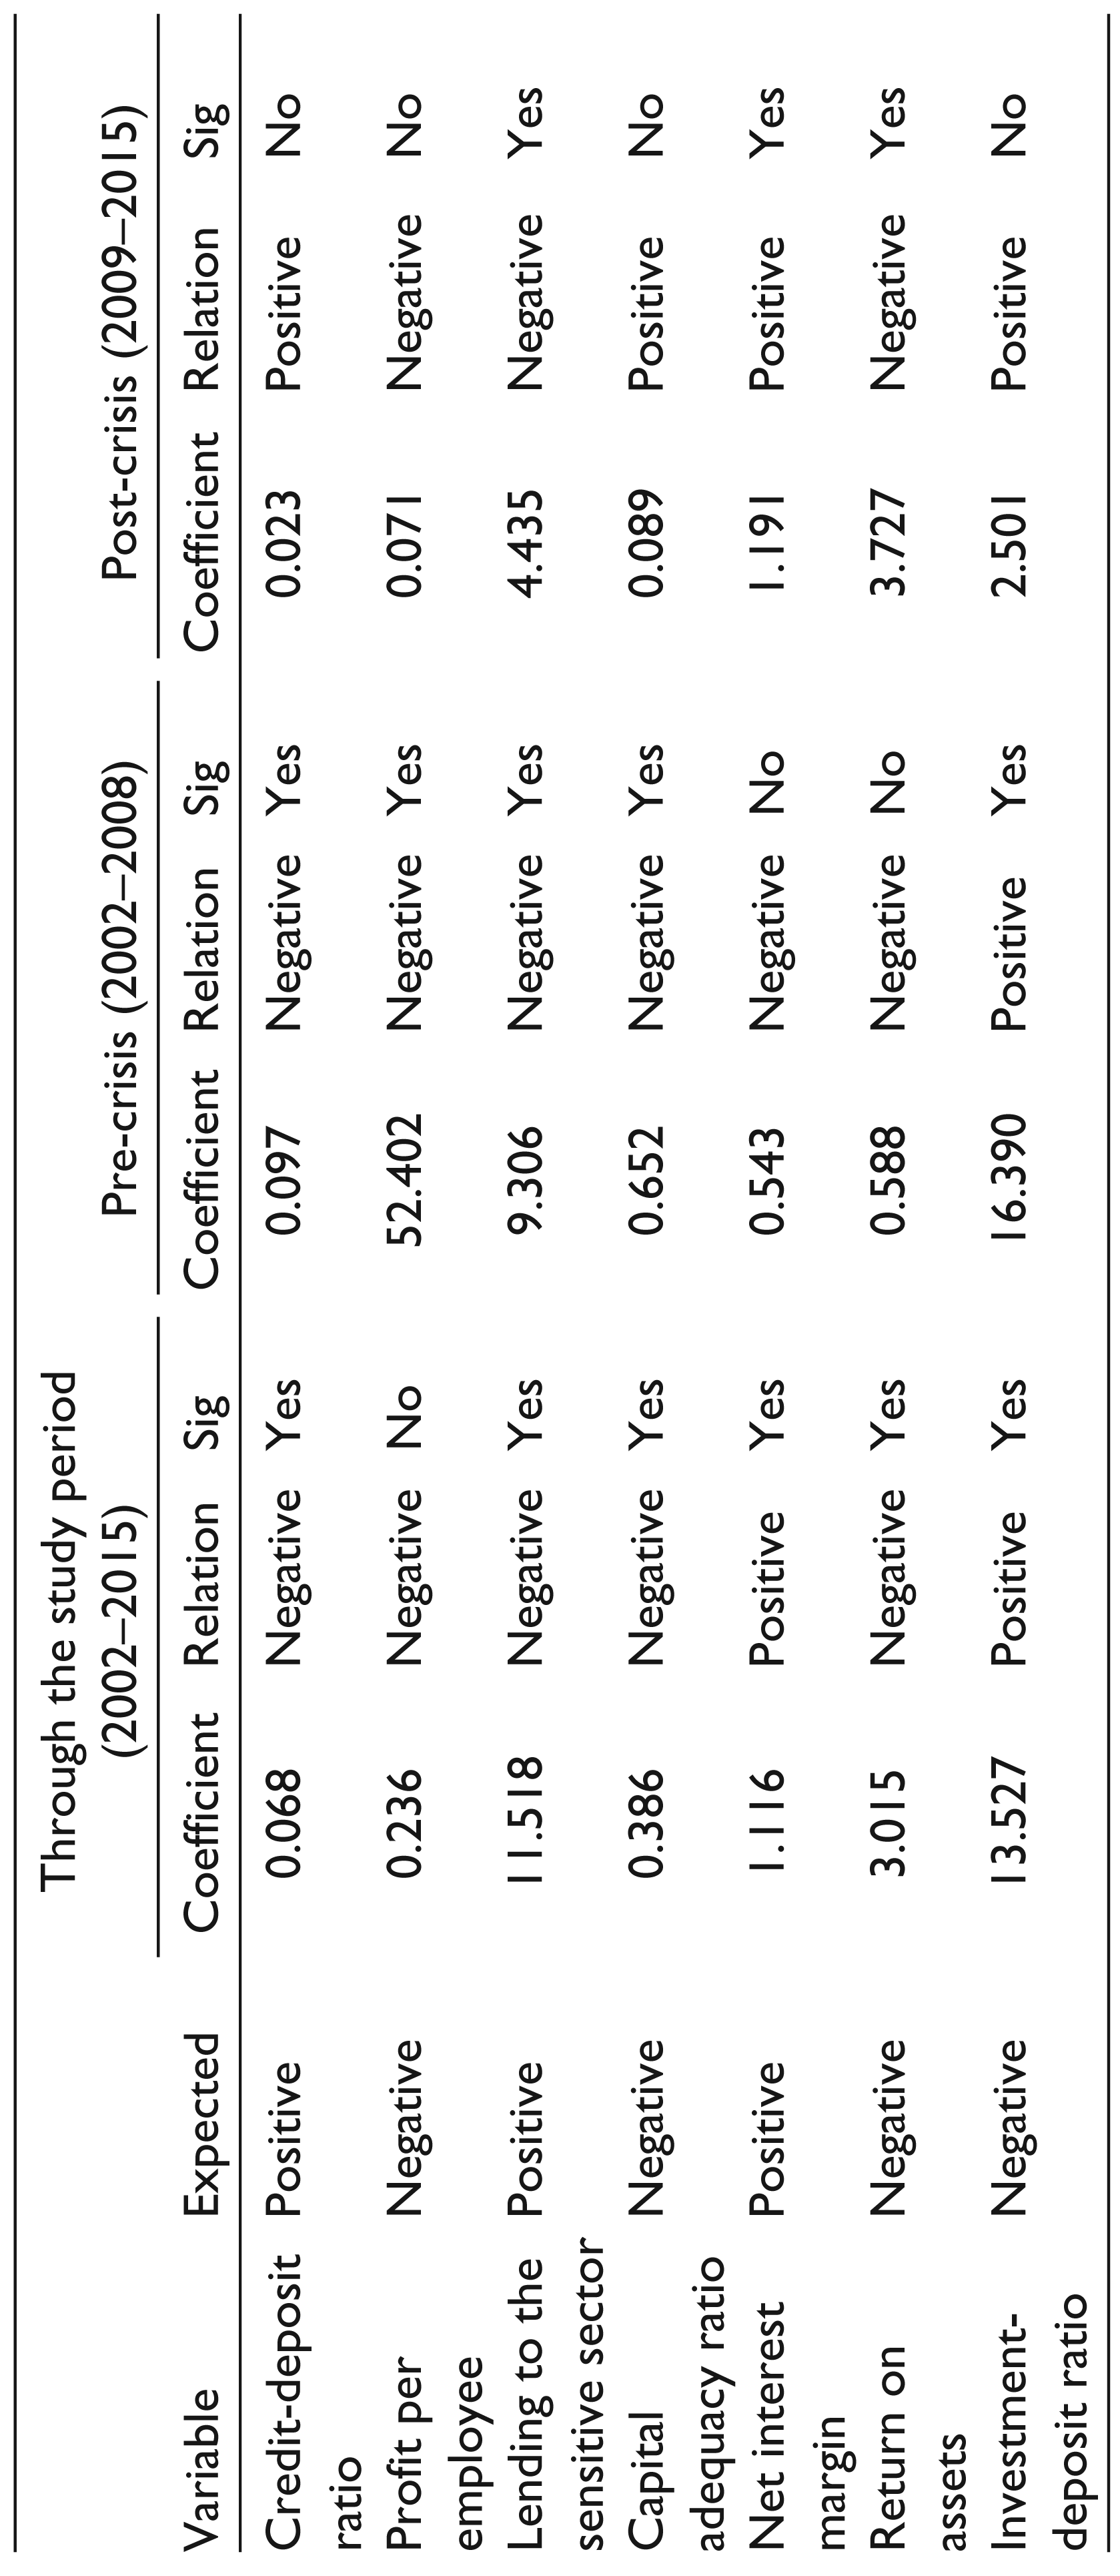
Summary of Results for the Different Time Periods
| Variable | Expected | Through the study period (2002‒2015) |
Pre-crisis (2002‒2008) |
Post-crisis (2009‒2015) |
||||||
| Coefficient | Relation | Sig | Coefficient | Relation | Sig | Coefficient | Relation | Sig | ||
| Credit-deposit ratio | Positive | 0.068 | Negative | Yes | 0.097 | Negative | Yes | 0.023 | Positive | No |
| Profit per employee | Negative | 0.236 | Negative | No | 52.402 | Negative | Yes | 0.071 | Negative | No |
| Lending to the sensitive sector | Positive | 11.518 | Negative | Yes | 9.306 | Negative | Yes | 4.435 | Negative | Yes |
| Capital adequacy ratio | Negative | 0.386 | Negative | Yes | 0.652 | Negative | Yes | 0.089 | Positive | No |
| Net interest margin | Positive | 1.116 | Positive | Yes | 0.543 | Negative | No | 1.191 | Positive | Yes |
| Return on assets | Negative | 3.015 | Negative | Yes | 0.588 | Negative | No | 3.727 | Negative | Yes |
| Investment-deposit ratio | Negative | 13.527 | Positive | Yes | 16.390 | Positive | Yes | 2.501 | Positive | No |
Model 1: Credit Risk for Private Sector Banks
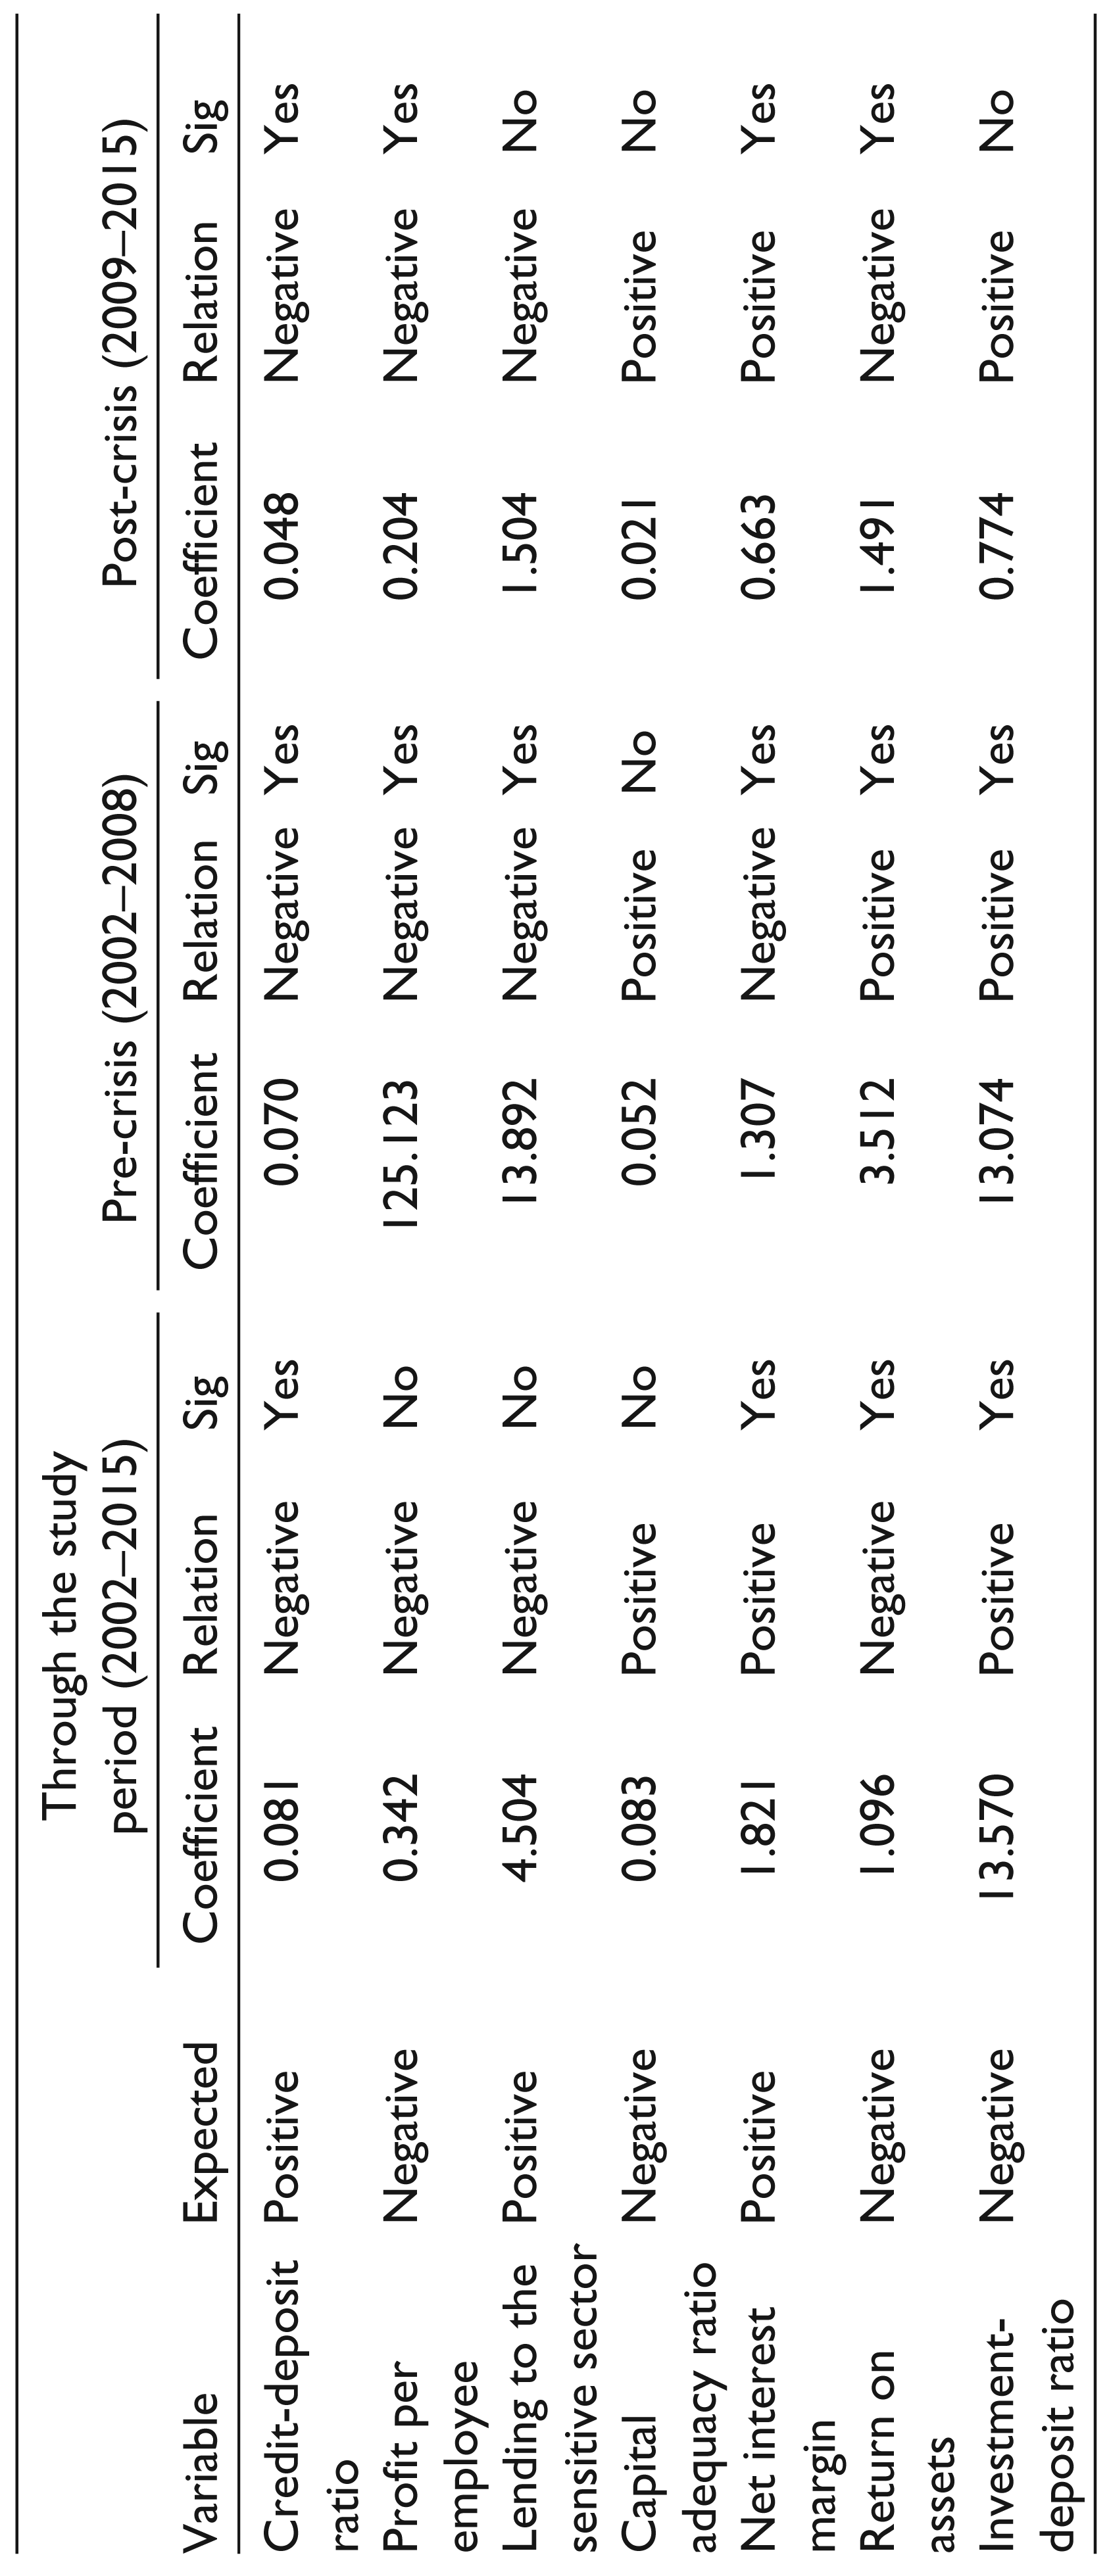
Summary of Results for the Different Time Periods
| Variable | Expected | Through the study period (2002‒2015) |
Pre-crisis (2002‒2008) |
Post-crisis (2009‒2015) |
||||||
| Coefficient | Relation | Sig | Coefficient | Relation | Sig | Coefficient | Relation | Sig | ||
| Credit-deposit ratio | Positive | 0.081 | Negative | Yes | 0.070 | Negative | Yes | 0.048 | Negative | Yes |
| Profit per employee | Negative | 0.342 | Negative | No | 125.123 | Negative | Yes | 0.204 | Negative | Yes |
| Lending to the sensitive sector | Positive | 4.504 | Negative | No | 13.892 | Negative | Yes | 1.504 | Negative | No |
| Capital adequacy ratio | Negative | 0.083 | Positive | No | 0.052 | Positive | No | 0.021 | Positive | No |
| Net interest margin | Positive | 1.821 | Positive | Yes | 1.307 | Negative | Yes | 0.663 | Positive | Yes |
| Return on assets | Negative | 1.096 | Negative | Yes | 3.512 | Positive | Yes | 1.491 | Negative | Yes |
| Investment-deposit ratio | Negative | 13.570 | Positive | Yes | 13.074 | Positive | Yes | 0.774 | Positive | No |
Model 2: Interest Risk for Public Sector Banks
Summary of Results for the Different Time Periods
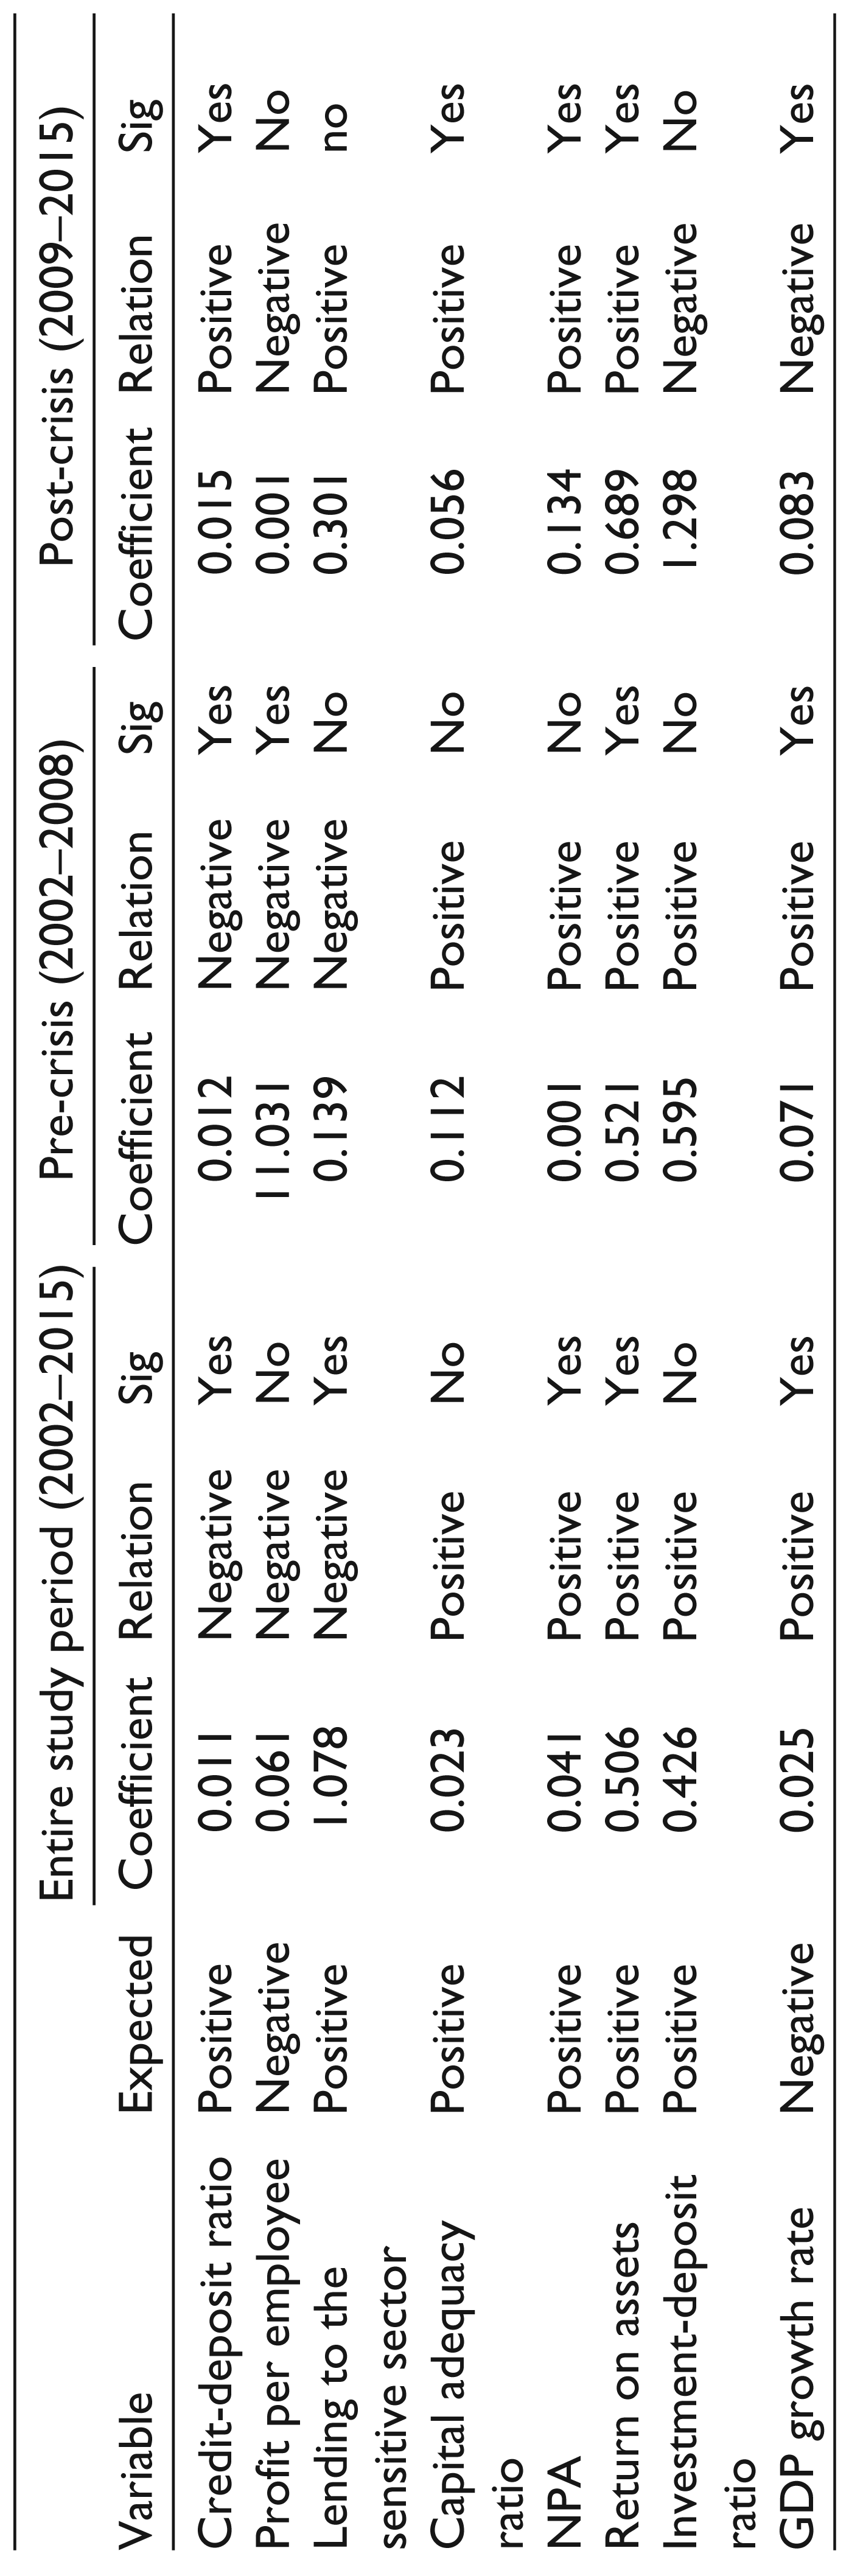
| Variable | Expected | Entire study period (2002‒2015) |
Pre-crisis (2002‒2008) |
Post-crisis (2009‒2015) |
||||||
| Coefficient | Relation | Sig | Coefficient | Relation | Sig | Coefficient | Relation | Sig | ||
| Credit-deposit ratio | Positive | 0.011 | Negative | Yes | 0.012 | Negative | Yes | 0.015 | Positive | Yes |
| Profit per employee | Negative | 0.061 | Negative | No | 11.031 | Negative | Yes | 0.001 | Negative | No |
| Lending to the sensitive sector | Positive | 1.078 | Negative | Yes | 0.139 | Negative | No | 0.301 | Positive | no |
| Capital adequacy ratio | Positive | 0.023 | Positive | No | 0.112 | Positive | No | 0.056 | Positive | Yes |
| NPA | Positive | 0.041 | Positive | Yes | 0.001 | Positive | No | 0.134 | Positive | Yes |
| Return on assets | Positive | 0.506 | Positive | Yes | 0.521 | Positive | Yes | 0.689 | Positive | Yes |
| Investment-deposit ratio | Positive | 0.426 | Positive | No | 0.595 | Positive | No | 1.298 | Negative | No |
| GDP growth rate | Negative | 0.025 | Positive | Yes | 0.071 | Positive | Yes | 0.083 | Negative | Yes |
Model 2: Interest Risk for Private Sector Banks
Summary of Results for the Different Time Periods
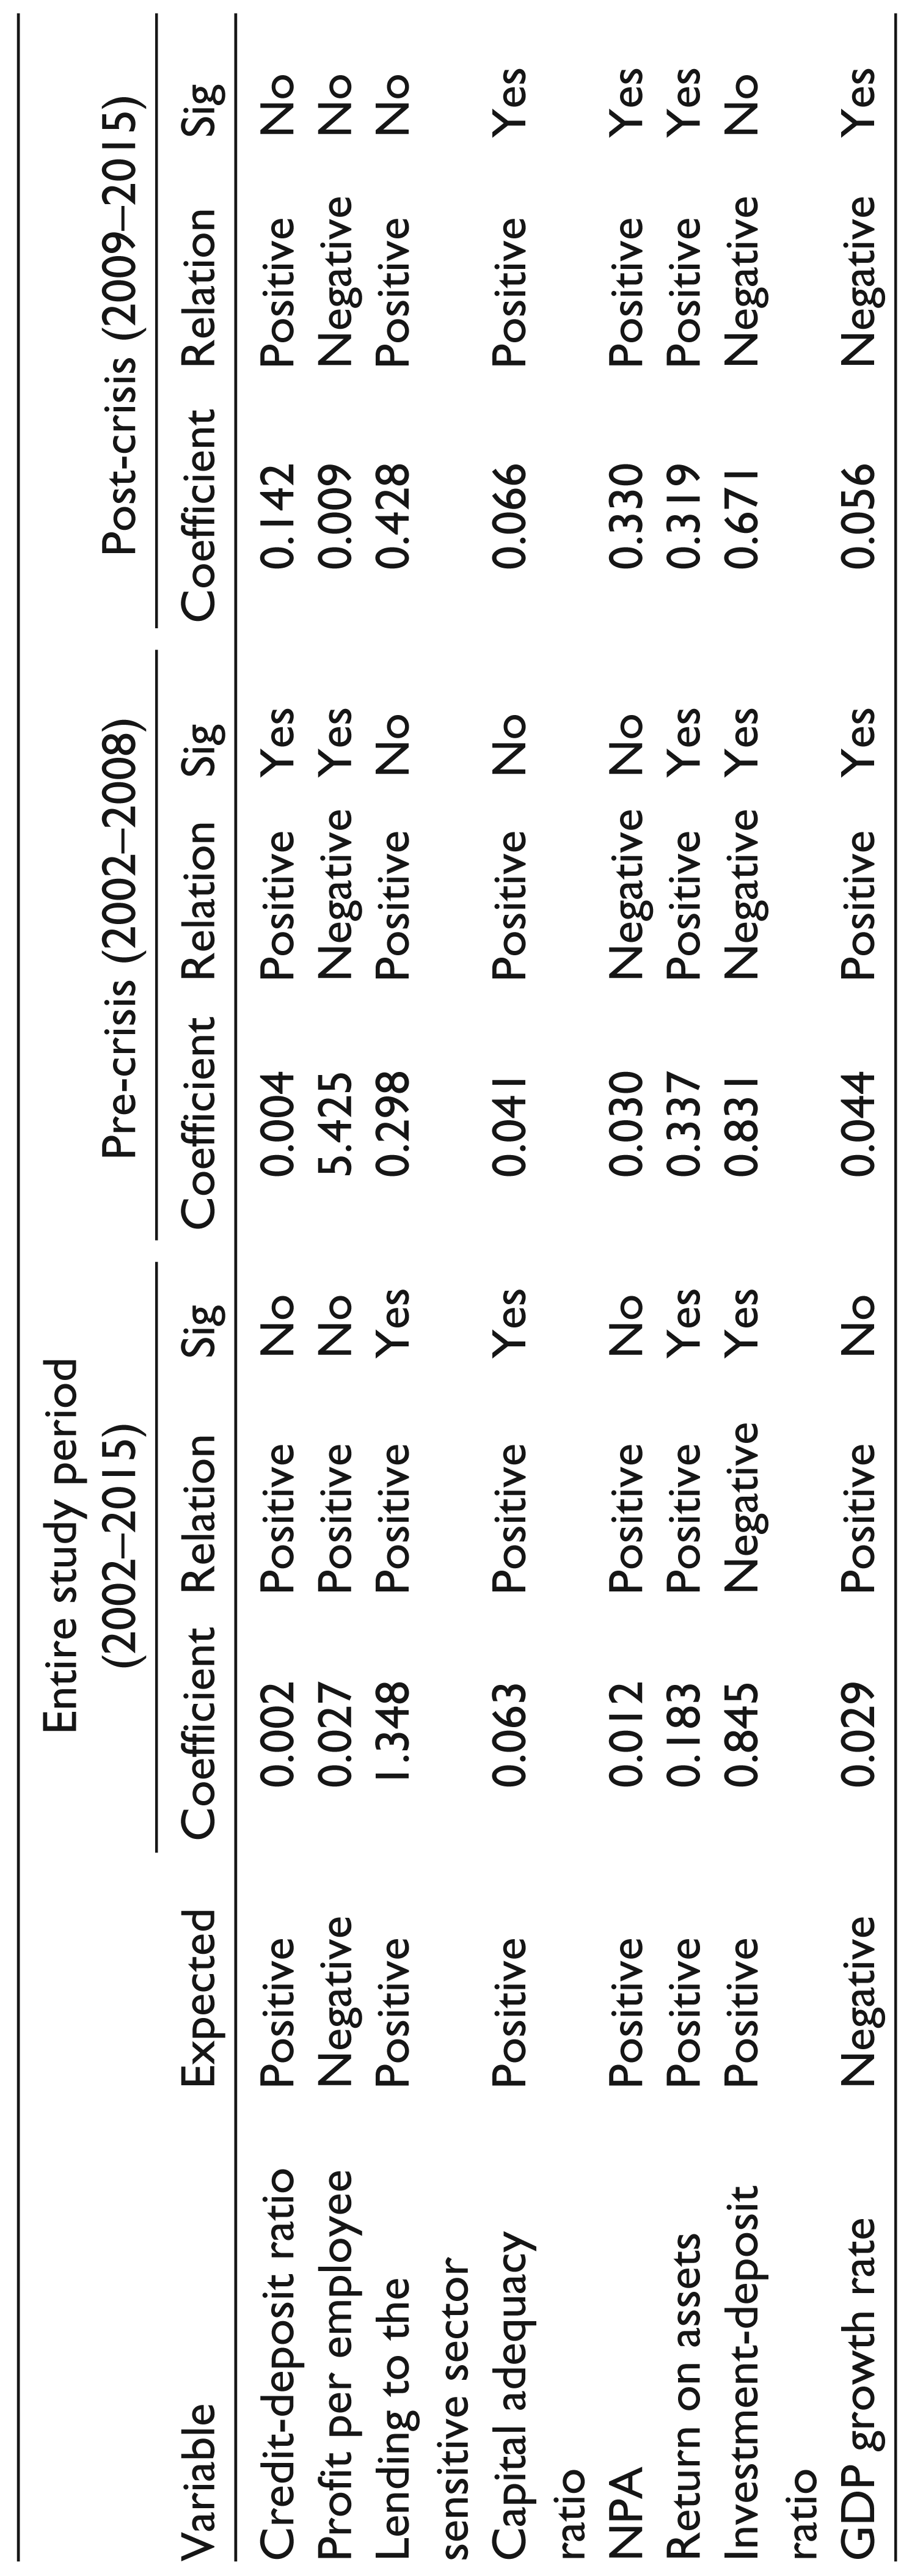
| Variable | Expected | Entire study period (2002‒2015) |
Pre-crisis (2002‒2008) |
Post-crisis (2009‒2015) |
||||||
| Coefficient | Relation | Sig | Coefficient | Relation | Sig | Coefficient | Relation | Sig | ||
| Credit-deposit ratio | Positive | 0.002 | Positive | No | 0.004 | Positive | Yes | 0.142 | Positive | No |
| Profit per employee | Negative | 0.027 | Positive | No | 5.425 | Negative | Yes | 0.009 | Negative | No |
| Lending to the sensitive sector | Positive | 1.348 | Positive | Yes | 0.298 | Positive | No | 0.428 | Positive | No |
| Capital adequacy ratio | Positive | 0.063 | Positive | Yes | 0.041 | Positive | No | 0.066 | Positive | Yes |
| NPA | Positive | 0.012 | Positive | No | 0.030 | Negative | No | 0.330 | Positive | Yes |
| Return on assets | Positive | 0.183 | Positive | Yes | 0.337 | Positive | Yes | 0.319 | Positive | Yes |
| Investment-deposit ratio | Positive | 0.845 | Negative | Yes | 0.831 | Negative | Yes | 0.671 | Negative | No |
| GDP growth rate | Negative | 0.029 | Positive | No | 0.044 | Positive | Yes | 0.056 | Negative | Yes |