
Abstract
This study examines the extent to which the Hai Yang Shi You 981 (HD-981) event, the sudden deployment of a Chinese oil rig in disputed territorial waters near Paracel Islands in May 2014, affected the stock market performance of 20 sectors of the Vietnamese economy. The impact was measured in terms of stock returns, using daily data on stock market indices. The results strongly indicate that the HD-981 event significantly and negatively affected the overall performance of Vietnam’s stock markets. There is, however, considerable variation across sectors. While most sectors which are heavily dependent on the economy of China were adversely affected, the impact on some sectors was negligible. By conducting this study on Vietnam’s stock markets, we hope to generate implications and lessons for other emerging markets in the region.
Introduction
Stock markets have received a great deal of attention, both as an important channel for raising capital and absorbing foreign investments and in the context of large swings in stock market valuation. This is particularly relevant to emerging markets like Vietnam, which is one of the fastest growing economies in the world, with rising stock markets. Vietnam’s stock markets are relatively new. It came into being with the establishment of the Ho Chi Minh City Securities Trading Center (HoSTC) on 20 July 2000. Subsequently, Hanoi Securities Trading Center (HaSTC) was launched in March 2005. HoSTC was renamed as Ho Chi Minh City Stock Exchange (HOSE) in 2007 and HaSTC was also renamed as Hanoi Stock Exchange (HSX) in 2009. The indexes of HOSE and HSX are called VN-Index and HNX-Index, respectively.
Since its inception, Vietnam’s stock markets have made significant contributions to the country’s financial and economic development (refer to Rahman, Adrian, & Mustafa, 2014). During its relatively short history, Vietnam’s stock markets have also been rather volatile, due mainly to fluctuations of key macroeconomic variables such as interest rate, inflation rate, exchange rate and money supply. In addition, due to its relatively small size (in terms of market capitalisation) 1 and short history, Vietnam’s stock markets tend to be vulnerable to crucial domestic or international events. Yet, to the best knowledge of the authors, there is to date no published event-study article on Vietnam’s stock markets.
The principal aim of this article is to examine the impact of the Hai Yang Shi You 981 (HD-981 hereafter) incidence on Vietnam’s stock markets using the event-study approach. The HD-981 incidence refers to China’s sudden and unilateral placement of the HD-981 oil rig in disputed territorial water near Paracel Islands on 1 May 2014. The news of the HD-981 oil rig installation was publicly announced in Vietnam on 8 May 2014, which generated apparent impact on Vietnam’s stock exchange market performance, as elaborated in the third section of this article. There have been many specific events which affected Vietnam’s stock exchange markets, but the HD-981 event is chosen because it is perhaps the only recent one specifically related to geopolitical conflict between China and Vietnam. Note also that the focus of this article is on the financial consequences of the incidence without making political claims or attributions of any types.
This study is expected to improve our understanding of Vietnamese financial markets in a number of ways. First, our analysis helps to clarify how sentiment or confidence affects the decisions of investors in Vietnam. Second, it provides insight into how investors in different sectors reacted to this geopolitical event. More specifically, we address two issues: (a) whether and for how long in advance investors can predict/forecast the event date and (b) the extent to which the stock market returns of different sectors are affected by the event. Furthermore, by conducting this study on Vietnam’s stock markets, we hope to generate implications and lessons for other emerging markets in the region.
The remainder of the article is organised as follows: the second section reviews the related literature. The third section provides an overview of how the Vietnam’s stock markets are related to the HD-981 event. The fourth section explains the empirical strategy of this article. We employ a number of econometric methods to analyse the research questions at hand. We also describe the data to be utilised in our empirical analysis. The fifth section presents and discusses the main results of our empirical analysis of the impact of the HD-981 event on Vietnam’s overall and sectoral stock market performance. The sixth section concludes the article.
Literature Review
In the financial economics literature, event studies have been used to analyse a wide range of issues. In particular, in the fields of corporate finance and banking, common event studies have been performed to examine the extent to which stock returns are affected by a press release or other specific events.
For example, the US terrorist attacks on 11 September 2001 were perhaps one of the most studied events in the literature. The attacks were widely expected to entail a dramatic economic impact. A large number of studies were conducted to investigate the effects of the 9/11 attacks on capital markets (Bertrand & Thierry, 2005; Charles & Darné, 2006; Chen & Siems, 2004; Maillet & Michel, 2005; Nikkinen, Omran, Sahlström, & Äijö, 2008), commercial airlines (Carter & Simkins, 2004; Drakos, 2004; Guzhva, 2008; Guzhva & Pagiavlas, 2004) and airline industry (Blunk, Clark, & McGibany, 2007; Clark, McGibany, & Myers, 2009; Holguín-Veras, Xu, & Bhat, 2012; Inglada & Rey, 2004; Ito & Lee, 2005), among others. 2
For instance, Charles and Darné (2006) examine the effects of the 9/11 attacks on 10 daily stock market indexes using an outlier detection methodology. They found that the stock markets experienced large permanent and temporary shocks in the aftermath of the terrorist attacks, including abnormal returns. Given the decline in the US domestic air travel after the 9/11 attacks, Blunk et al. (2007) investigate whether the detrimental impact of the attacks was temporary or permanent. Their findings suggest that domestic air travel did not return to levels that would have prevailed in the absence of the attacks.
Furthermore, Balke and Fomby (1991, 1994), Bradley and Jansen (1995) and Darné and Diebolt (2004) show that specific events have a pronounced impact on modelling macroeconomic and financial time series. These type of events includes, for example, oil shocks, wars, financial slumps, changes of political regime, natural catastrophes and so on. They applied outlier detection methodology to detect shocks that affect economic time series.
The effects of macroeconomic news have been the subject of a substantial wave of academic research that covered a wide set of financial elements (Bomfim, 2003; Engelberg & Parsons, 2011; Evans & Speight, 2010; Fatum, Hutchison, & Wu, 2012; Rangel, 2011; Rühl & Stein, 2014; Simpson, Ramchander, & Chaudhry, 2005). For example, Bomfim (2003), Rangel (2011) and Rühl and Stein (2014) investigate the various implications of macroeconomic announcements on the evolution of equity markets. Simpson et al. (2005) observe the effects of 23 types of announcement on exchange rates and forward premium. They find that exchange rates are influenced by events linked to consumer demand, inflation and Internet but are not sensitive to news on the general state of the economy. Evans and Speight (2010) use 5-minute returns for EUR-USD, EUR-GBP and EUR-JPY exchange rates in order to study the volatility of euro returns to a set of macroeconomic announcements. They use a periodicity adjusted model and find that macroeconomic news from the USA accounts for a large share of volatility.
There is an apparent gap in the literature in the sense that majority of studies could not adequately explain the underlying diffusion mechanism of major shocks. For instance, we do not know why and how much countries or markets react to major political/terrorist incidents. Clearly, analysis of such reactions would be valuable not only to policymakers and supervision authorities but, more importantly, also to portfolio managers. More specifically, knowledge of these reaction patterns could assist portfolio managers in assessing whether diversification across local markets within a country is possible. For instance, if the exogenous shocks exhausted their effect within a market, then they could be thought as being part of its idiosyncratic risk and, therefore, can be diversified away. If, however, the shocks were diffused across markets, the scope for diversification would depend on the pattern of diffusion.
Overview of the Reaction of the Vietnam’s Stock Markets
Immediately following the announcement of the HD-981 incidence on Vietnam’s news, the stock markets in both Ho Chi Minh City and Hanoi experienced the sharpest decline since 2001 and reached a 13-year record low (see Figures 1a and 1b). Vietnam’s stock market index plunged 13 per cent from March 2014, when the index enjoyed the best growth in the last 4 years. In particular, PetroVietnam, Vietnam’s largest oil producer and the second-largest power producer, saw its share prices fall sharply by 6.6 per cent to its lowest level in 1 year. Stock price indices plummeted, and many stocks were left without buyers. At the end of the session on 8 May 2014, the VN-Index lost 32.88 points, its biggest drop since 3 October 2001. The HNX-Index also suffered the largest decline in its short history, by 6.4 per cent from 76.56 to 71.66 points. Market capitalisation fell by about VND65,087 billion, equivalent to more than USD3 billion.
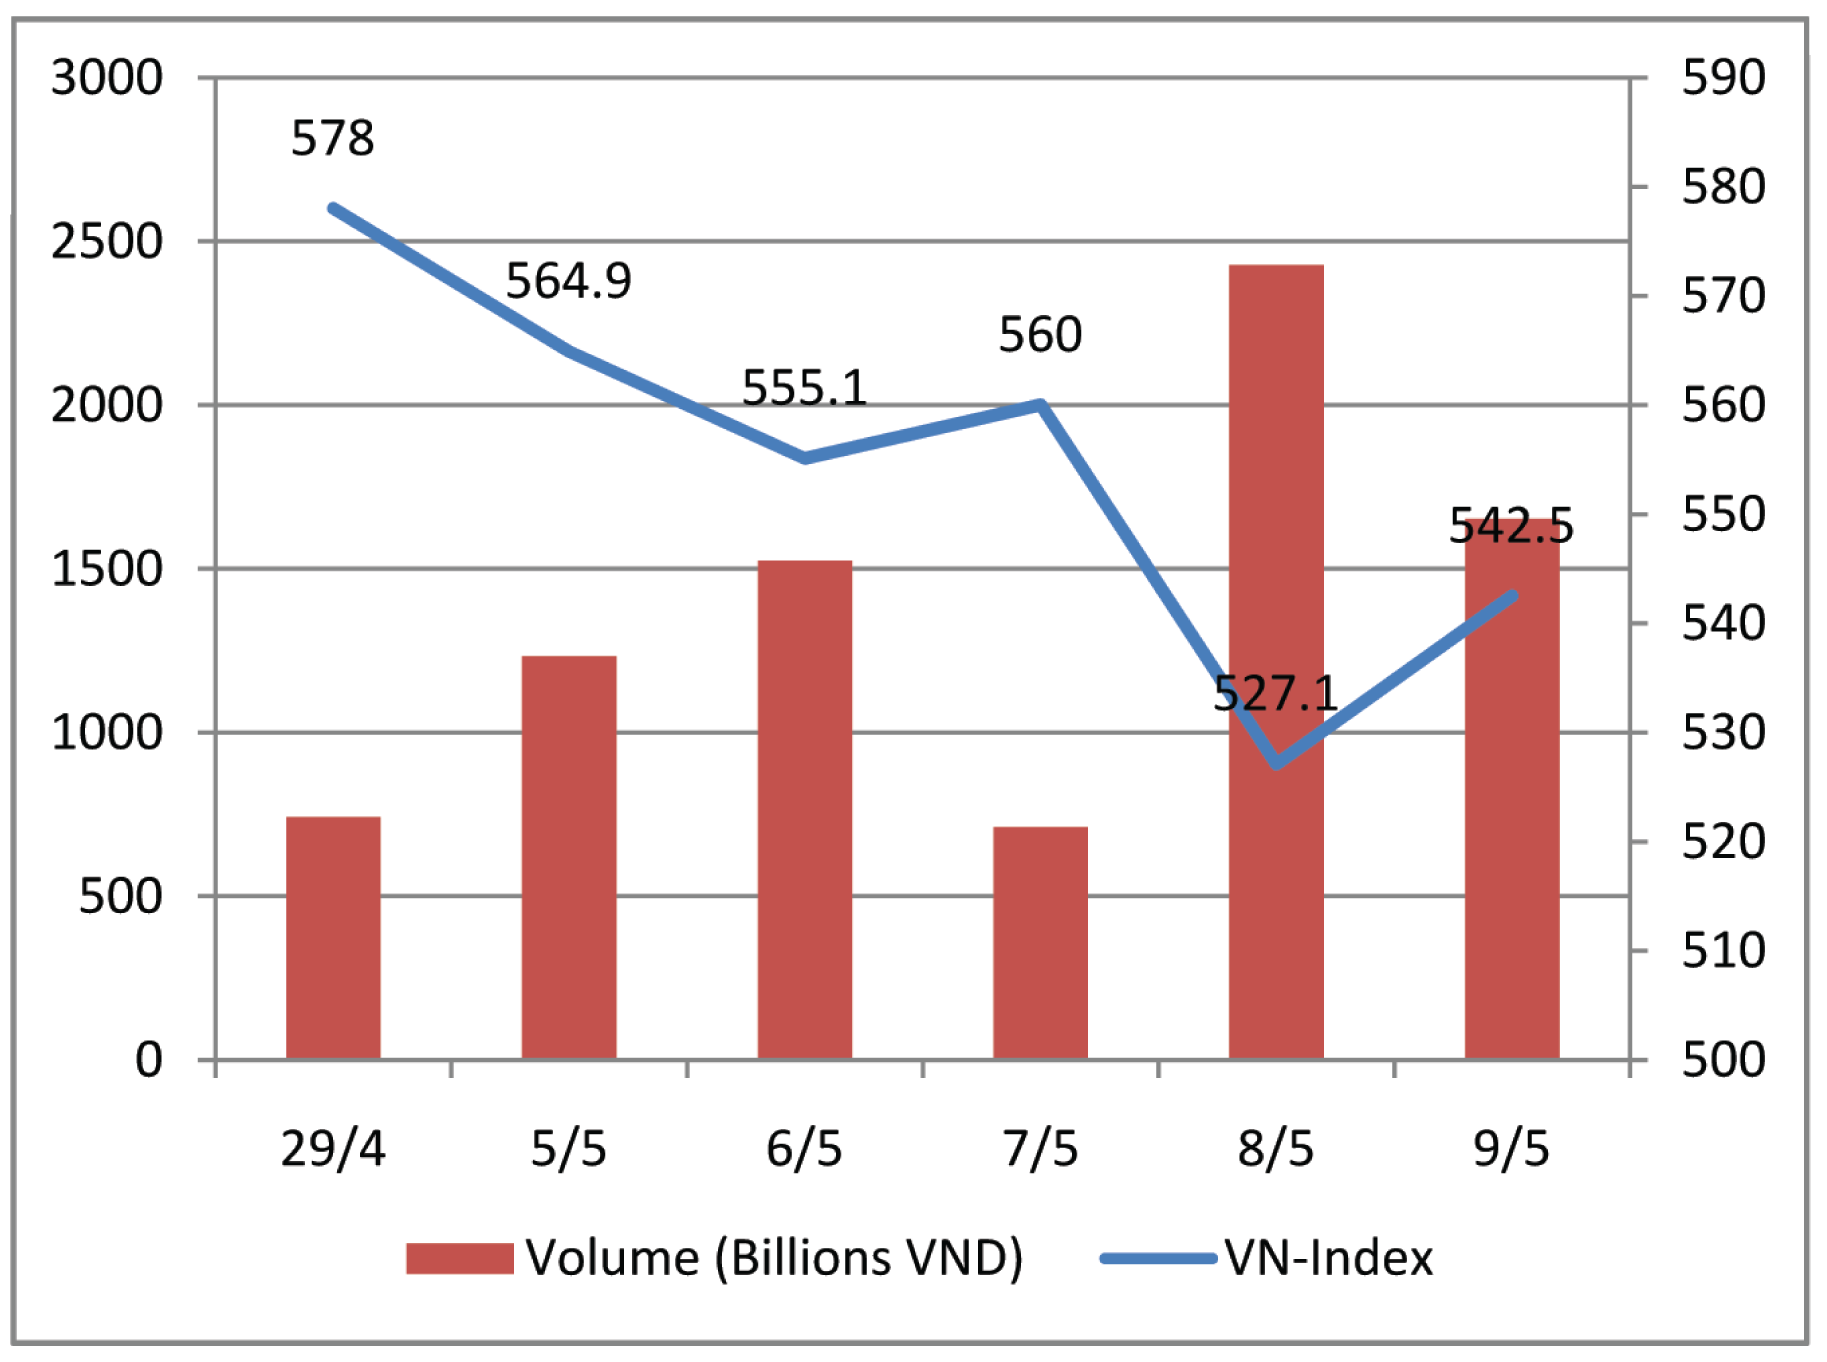
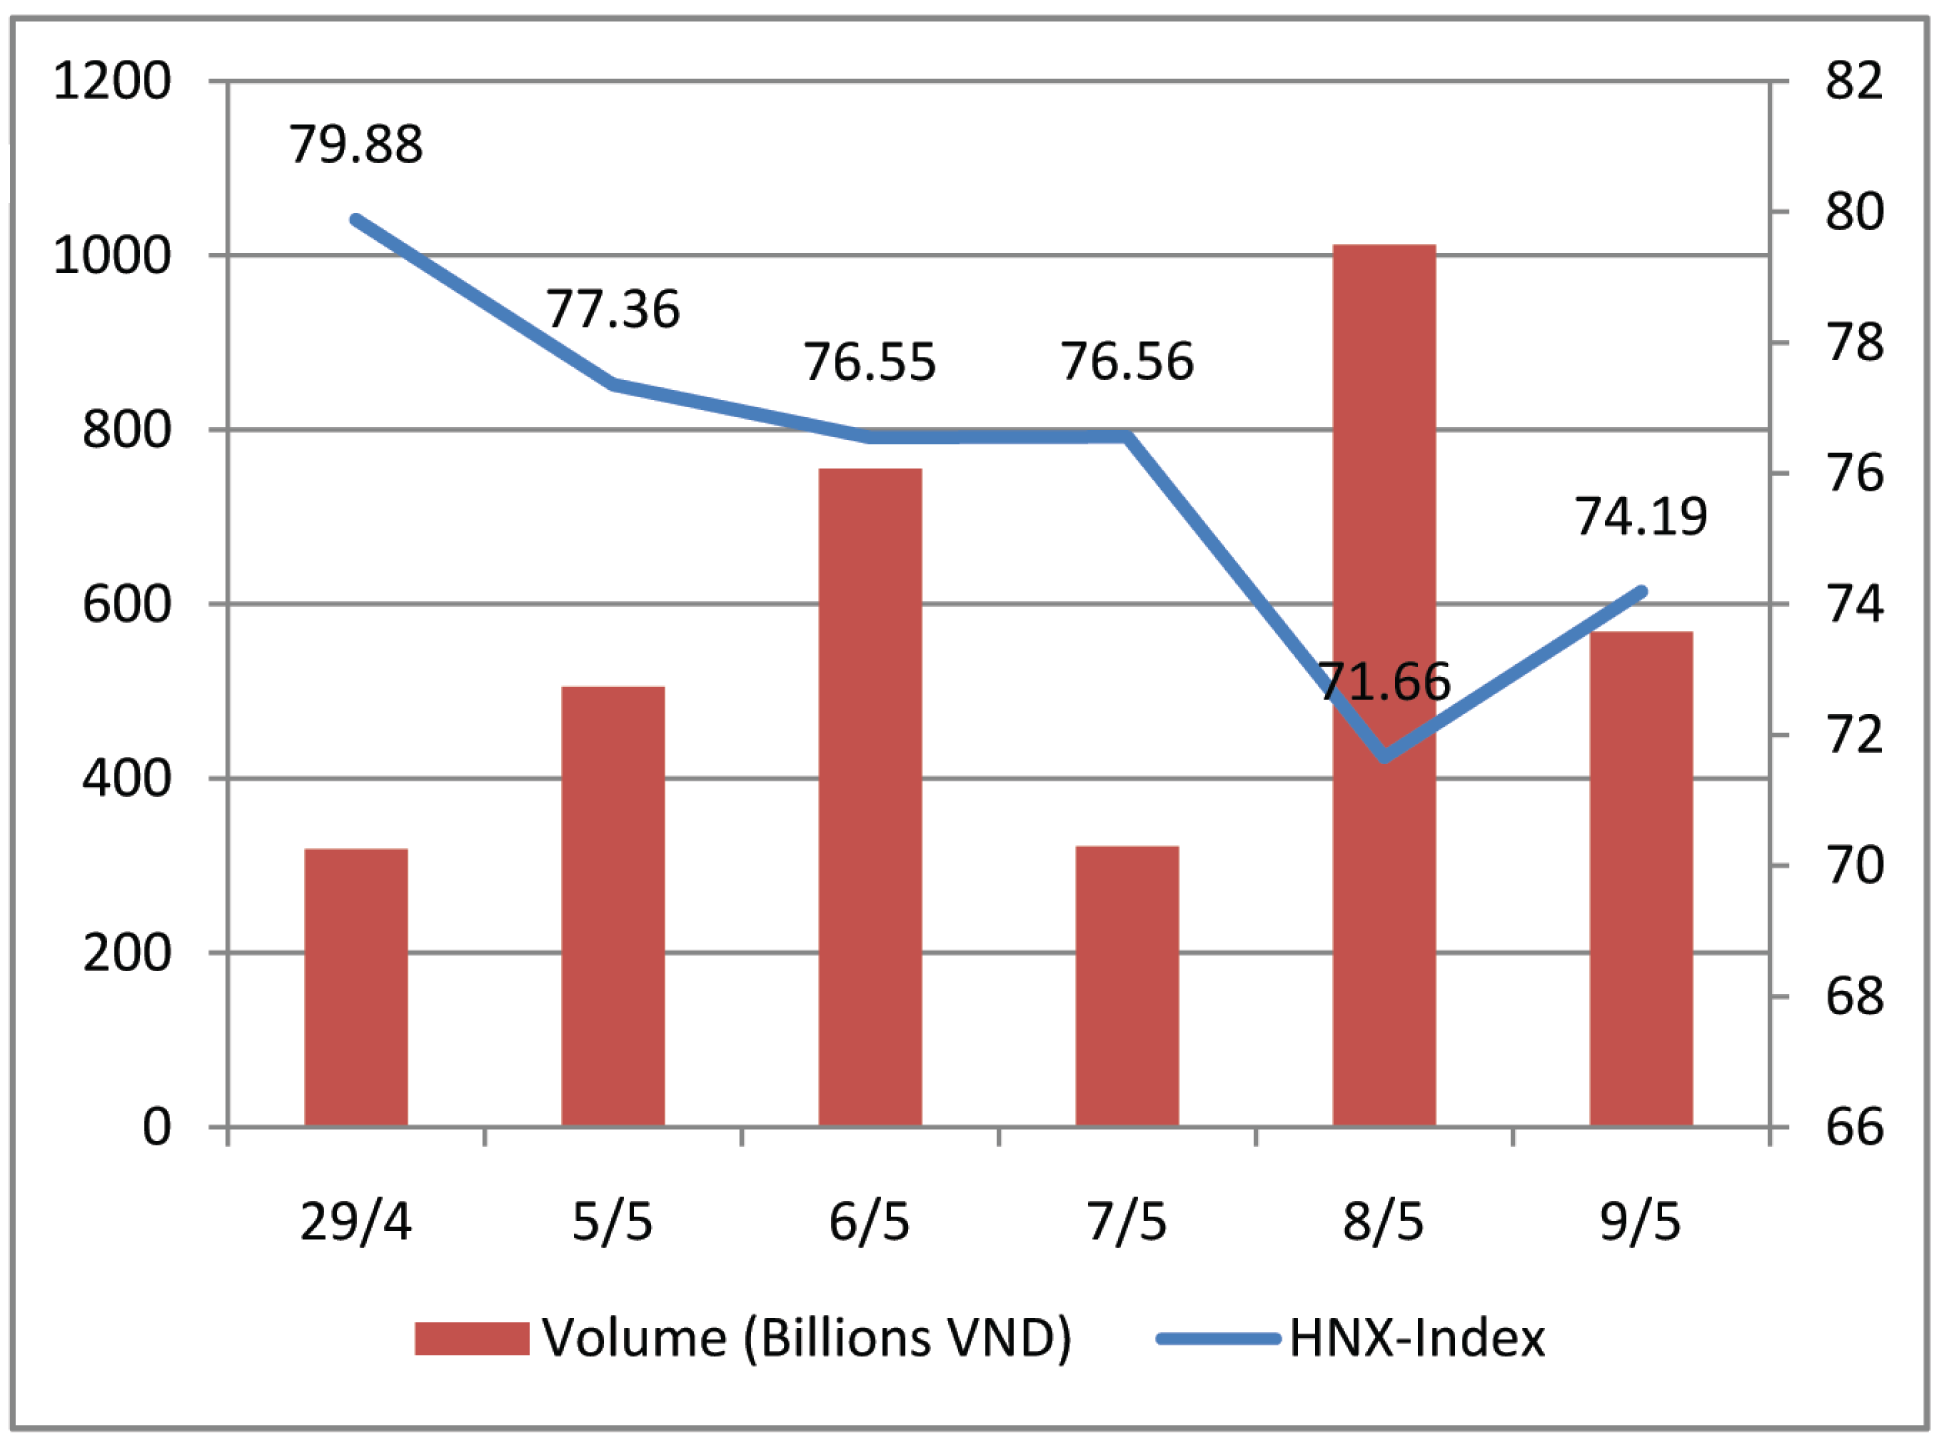
On 9 May 2014, investor sentiments stabilised since the East Sea issue was believed to have been resolved. Consequently, the shares began to rebound, suggesting that the sharp decline was coming to an end. The stock indices on both HOSE and HSX experienced a speedy recovery. The VN-Index rose by 15.37 points or 2.92 per cent to 542.46 points, and total trading volume reached 118.856 million shares. Overall, 162 stocks rose, 84 stocks fell and 58 stocks remained unchanged. Meanwhile, the HNX-Index stood at 74.19 points and was up by 2.54 points or 3.54 per cent. Total trading volume reached 65.043 million shares, worth VND568.43 billion (equivalent to about USD27 million), and there were 182 gainers, 54 losers and 138 unchanged stocks. But the resurgence was short-lived.
In the following days, a number of blue chip stocks plummeted while other stocks dropped below the floor price. Sell orders overwhelmed the market and caused the index to fall sharply. The price declined contributed to a rebound in demand. Although market liquidity consequently improved, it was not strong enough to prevent the VN-Index from plummeting. Withdrawal of foreign investors adversely affected investor sentiment. Another negative factor was the US Federal Reserve’s continued reduction of its quantitative easing programme. The reduction raised significant concerns about the withdrawal of foreign capital from emerging markets such as Vietnam. In addition, the continuous withdrawal of recent exchange-traded funds reinforced such concerns. In short, a number of unfavourable macroeconomic trends dented the risk appetite of investors, who became more cautious and curtailed their trading activities.
Figures 1a and 1b summarise the fluctuations from 5 May 2014 to 9 May 2014 in Ho Chi Minh City and Hanoi stock markets, respectively.
In light of China’s emergence as a global economic power and Vietnam’s economic reliance on China, it is not surprising that Vietnam’s stock markets were affected by the political tension between China and Vietnam over the East Sea. All the more so since investors in a nascent market like Vietnam are prone to herd behaviour.
The HD-981 incidence provides an excellent opportunity to conduct an event-study research on the performance of Vietnam’s stock markets. To this end, this study employs event-study methodology that focuses on identifying abnormal returns from a specific event. The methodology rests on the efficient markets hypothesis of Fama, Fisher, Jensen, and Roll (1969), which generally states that as value-relevant information becomes available it is fully taken into consideration by investors. The new assessment results in stock price changes that reflect changes in the discounted value of current and future expected cash flows. Significant positive and negative stock price changes can then be attributed to specific events.
Since we examine industry stock market indices rather than individual stocks, we follow the event-study method described by Brown and Warner (1985) to measure a market’s or industry’s abnormal performance. This event-study approach has been widely used in the literature (refer to Aizenman, Jinjarak, Lee, & Park, 2016; Brounen & Derwall, 2010; Chen & Siems, 2010; Crawford, Johnson, & Wingender, 2015; DeLong, 2001). This methodology allows us to statistically test the significance of an event’s economic impact across markets as measured by the deviation of index returns from their averages. In other words, we examine how widely the market’s returns deviate from past averages following an event.
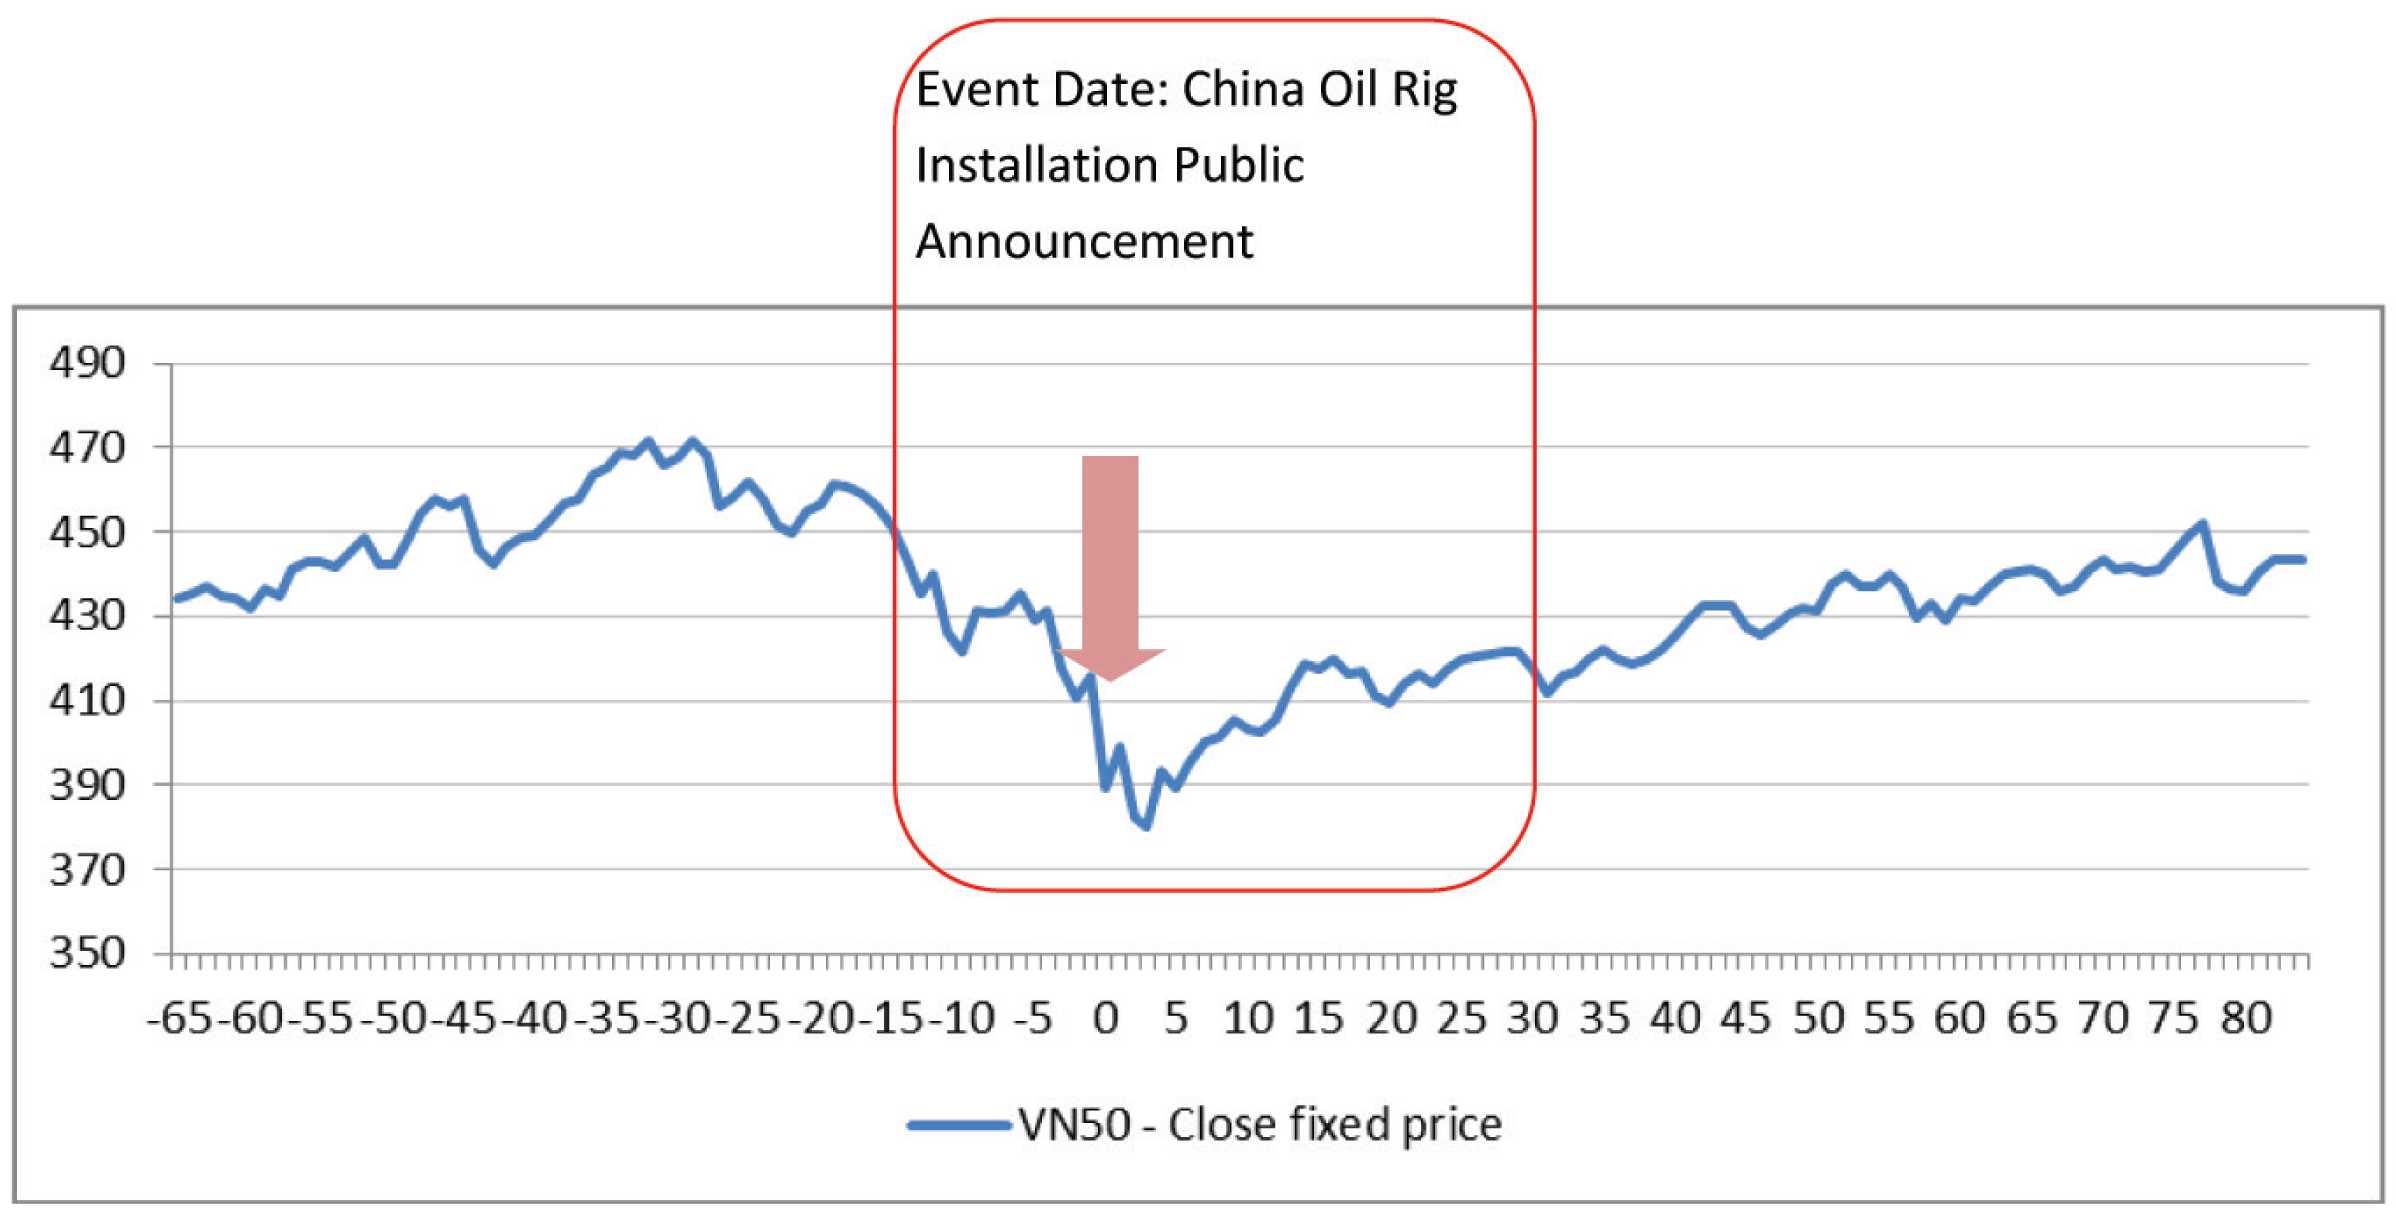
Following the literature, the event study in this article was performed using a number of steps. First, the event date was specified as 8 May 2014, the public announcement date of China’s installation of the HD-981 oil rig in disputed territorial waters near Paracel Islands. Next, the event window, which is the number of trading days preceding and following the event date, was defined to capture both the leakage and the time needed for the data to effectively reach the market. In this study, the event window was set as 15 and 30 trading days before and after the event date, respectively (refer to as –15 and 30, respectively).
In principle, an ideal event window should be sufficiently long to capture the dissemination of information about the event’s public announcement. On the other hand, assuming efficient processing of information from public announcements, an event window should be as short as possible. There are two reasons for the setting of the event window in this article. First, the date that China actually installed the oil rig was 1 May 2014, so the event window had to cover this date. Further, the performance of the VN50 (top 50 stock indices by market capitalisation) stock market index, which is the average stock market index of the top 50 firms, was relatively stable until 15 trading days before the event date. Second, the event was observed to affect the stock markets for about 30 trading days after the event date (see Figure 2).
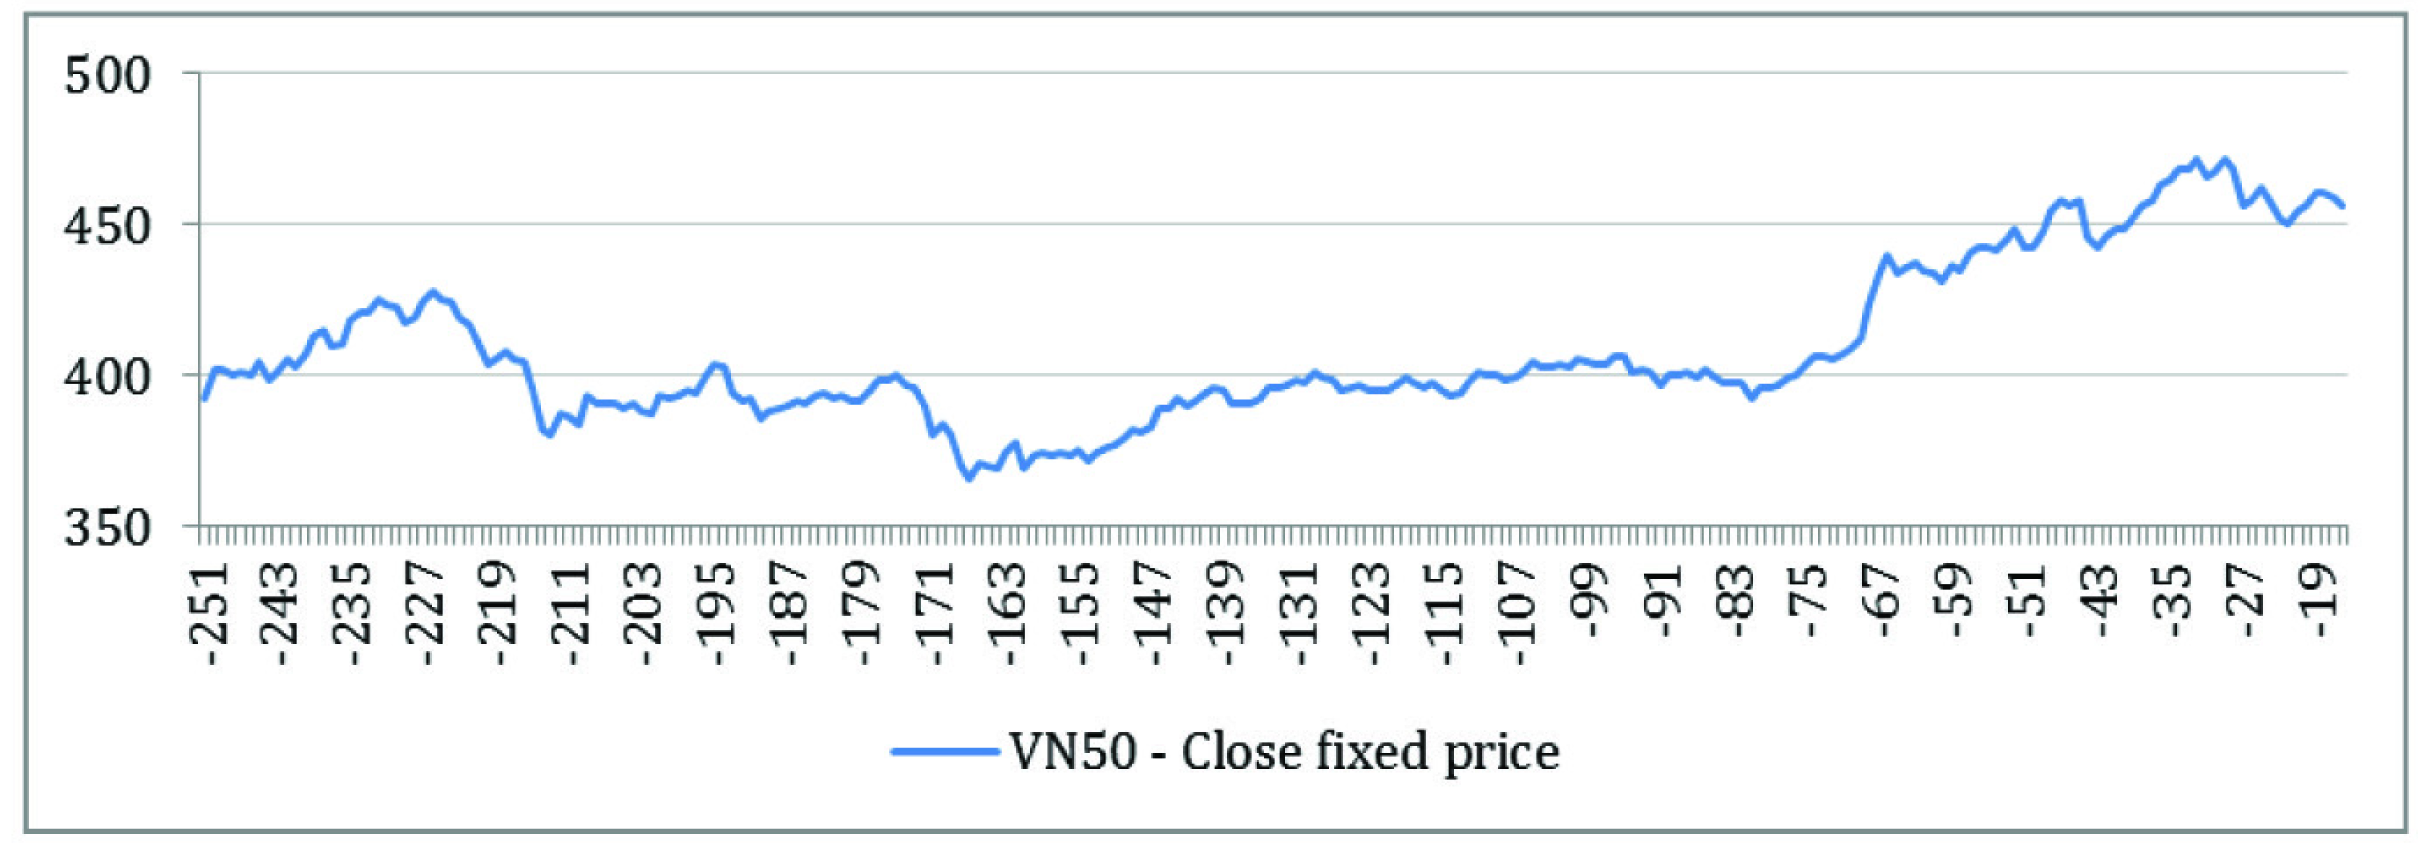
In the third step, the estimation period, which is the period of time over which no event occurred, was defined to establish how the returns would behave normally, that is, in the absence of the event. In this article, the estimation period was set as 236 trading days (1-year period) before the event window (referred to as from –251 to –16 days). This choice is based on the observation of the overall stock market performance, depicted in Figure 3. Furthermore, this choice is consistent with the empirical finding by Friday and Hoang (2015) that the seasonality of Vietnam’s stock market is 1 year. The article uses sector-level data, so that a good estimation period should be sufficiently wide to capture the overall trend of the whole economy, as well as the relationship between the individual stock and the overall market.
The rationale behind the selection of the estimation period is to make sure that it does not overlap with the event window period. This allows for an unbiased estimate of the counterfactual—that is, how the industry’s stock prices would behave normally without the event’s occurrence. Furthermore, the seasonal pattern of Vietnam’s stock markets is such that returns are normally very high in April, which is the second peak in a year after the January period, since companies often publish financial reports in early April (Friday & Hoang, 2015). As such, April 2013 was not included in the estimation period.
The fourth step was to select the study sample. This article employed the daily sector stock market indices of all sectors in Vietnam’s market, namely, real estate, services, pharmacy, education, production, steel, transportation, technology, building materials, oil and gas, mineral, plastic, commerce, construction, securities, banking, food processing, rubber, energy and seafood processing. As discussed above, the estimation period was from day –251 to day –16, which corresponds to the period from 3 May 2013 to 11 April 2014, and the event window was from day –15 to day 30, that is, from 14 April 2014 to 19 June 2014. The daily data of VN50 index and sector stock market indices were taken from the Golden Bridge Vietnam Securities Joint Stock Company (GBVS). 3 VN50 index (top 50 stock indices by market capitalisation) is used as an indicator of the overall stock market performance in Vietnam.
In the fifth step, normal returns, which are the counterfactual returns that would have occurred in the absence of the event, were calculated. This article employed a procedure whereby the market model adjusts the event date returns to remove the influence of the overall market (refer to Brown & Warner, 1985). Mathematically, the market model is specified as follows:

where Rt and RM t denote the return on day t for the stock and the overall market, respectively; et represents industry-specific returns; and the parameters a and b specify the linear structure of the market model. By assumptions inherent in the structure of the market model, the industry-specific returns et is unrelated to the overall market and has an expected value of zero. 4 Hence, the expected event date stock return conditional on the event date market return is

The sixth step was to compute abnormal returns based on the expected event date returns as specified in Equation (3). This was achieved by subtracting the conditional expected returns from the observed event date returns R0. Note that the abnormal return AR0 is simply the day zero, industry-specific returns et identified by the market model in Equation (1). The advantage of the market model is that AR0 provides an unbiased estimate of the future earnings generated by the event and is a random variable with a zero mean (Fama, 1970; Gielens, Van de Gucht, Steenkamp, & Dekimpe, 2008).

In order to compare and determine statistical significance, a series of abnormal returns were obtained from the estimation period.

The market model parameters a and b were estimated by an ordinary least-squares (OLS) regression of abnormal industry returns AR t on market returns RM t , over the estimation period. 5 The article then assessed the event date abnormal return AR0, for statistical significance relative to the distribution of abnormal returns AR t , in the estimation period. A common assumption used to formulate tests of statistical significance is that abnormal returns are normally distributed.
In the seventh stage, cumulative abnormal returns (CAR), the aggregation of the AR t for alternative event periods, were calculated, each ranging from t1 to t2.

The cumulative average abnormal returns of the industries in the sample n of this article were also calculated for various event windows (CAAR).

The final stage was to determine the statistical significance of the CAR t and CAAR t , which requires specification of the test statistics. This article tests whether the CAR t and CAAR t in the event window are different from the estimation period and whether they are significantly different from zero. We a priori expected the public announcement of China’s installation of the HD-981 oil rig to produce positive or negative CAR t and CAAR t and, thus, formulate the alternative hypotheses accordingly.
The first set of hypotheses, testing for mean difference of CAAR t for overall market performance in the sample, is given as follows:


These hypotheses test whether the CAAR t in the event window are different from that of the estimation period (without news announcements) and whether they are significantly different from zero. We expect positive (negative) announcements to lead to positive (negative) CAAR t and, thus, formulate the alternative hypotheses accordingly.
The second set of hypotheses, testing for mean difference of CAR t of each sector in the sample, is given as follows:


These hypotheses test whether the CAR it in the event window are different from that of the estimation period (without news announcements) and whether they are significantly different from zero. We expect positive (negative) announcements to lead to positive (negative) CAR it and, thus, formulate the alternative hypotheses accordingly.
As described above, the basic structure of an event study in which abnormal returns are measured by deviations from market model predictions remains largely the same as when first introduced in Fama et al. (1969). However, the methods by which statistical inferences are obtained from abnormal returns have been and continue to be a popular research area characterised by constant attempts at innovation and refinement (Corrado, 2011). For the testing purposes, this study employs a number of tests, including modern and advanced tests, to obtain statistical inferences from abnormal returns, as described in the next section.
An event study normally employs a classical statistical approach, specifying null and alternative hypotheses to detect the presence of event-induced returns within an event period—whether a single day or a longer period. Under a null hypothesis, event-induced returns are not present within the event period but are present under an alternative hypothesis. The power of a test determines its ability to detect a true alternative, when it is present.
The variance estimators were built based on the assumption that the event windows of the N securities do not overlap and the covariance terms were set at zero. In order to test the null hypothesis that the abnormal returns are zero, inferences about the cumulative abnormal returns were specified as follows:

with


In practice, because

This distribution result is asymptotic with respect to the number of securities N and length of the estimation window.
Sign Test
Non-parametric tests were also employed in this article to cross-check the parametric tests. The sign test, based on the sign of the abnormal return, requires that the abnormal returns (or more generally cumulative abnormal returns) are independent across stocks and that the expected proportion of positive abnormal returns under the null hypothesis is 0.5. The basis of the test is that, under the null hypothesis, it is equally probable that the CAR will be positive or negative. If, for example, the null hypothesis is that there is a positive abnormal return associated with a given event, the null hypothesis is H0: p ≤ 0.5, and the alternative is Ha: p > 0.5, where p = pr[CARi ≥ 0.0]. To calculate the test statistic, we need a number of cases with a positive abnormal return, N+, and the total number of cases is denoted as N. Let θ2 be the test statistic, then

This distribution result is asymptotic, and for a test of size (1 – α), H0 is rejected if θ2 > Φ–1(α) where θ2 ~ N(0,1),
A weakness of the sign test is that it may be wrongly specified or if the distribution of abnormal returns is skewed, as could be the case with daily data (Brown & Warner, 1985). In response to this possible shortcoming, common non-parametric tests were proposed by Corrado (1989) and Corrado and Zivney (1992), based on standardised returns. These tests have been proven to have very competitive and often superior power properties. In these tests, the combined estimation period and event period returns were used in the ranking.
This study employs three modern tests by Kolari and Pynnönen (2011), namely, GRANK-T, GRANK-Z and GRANK-Z*, which followed the logic of common practice in parametric testing. In these tests, only the estimation period returns and the cumulated return on the event period were used. As such, the number of observations in the testing was always one, in addition to the number of estimation period returns. The advantage is that the test is much less sensitive to the length of the event period than previous rank tests. Further, it was demonstrated by Kolari and Pynnönen (2010) that the GRANK-T statistic should be reasonably robust to event day clustering. In addition, since these tests are non-parametric, the statistics are less sensitive to distribution assumptions than parametric tests. Finally, both GRANK-Z and GRANK-T should be reasonably robust to autocorrelation.
Empirical Results
Summary statistics for the data used in the sample (the index level data) are provided in Table 1.
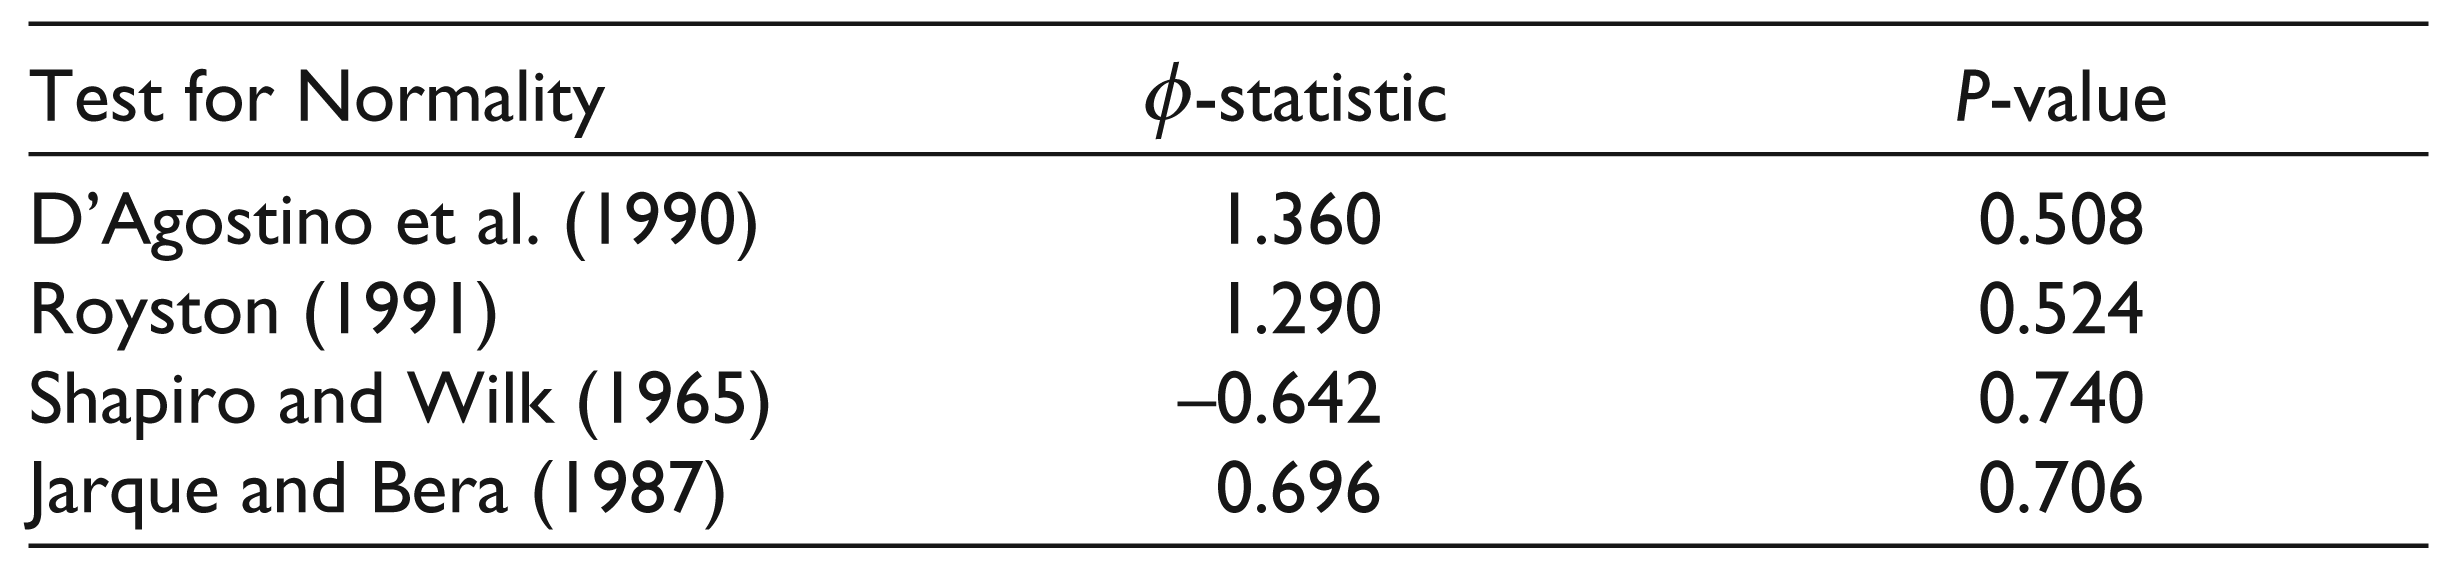
The statistical analysis of parametric and non-parametric (sign) tests is based on the assumption that returns are jointly normal. Without assuming normality, all results would be asymptotic. However, for rank tests, this is generally not a problem because for the test statistics, convergence to the asymptotic distributions was rather rapid (Brown & Warner, 1985). As such, the study checked whether AR is normally distributed using a number of normal distribution tests proposed by D’Agostino, Belanger, and D’Agostino (1990), Royston (1991), Shapiro and Wilk (1965), and Jarque and Bera (1987). All of these tests are well known and commonly used in literature, so their details are not described here.
The results reported in Table 2 show that, at any significance levels, there is insufficient evidence to reject the null hypothesis that AR is normally distributed. This finding is consistent for all the tests used.
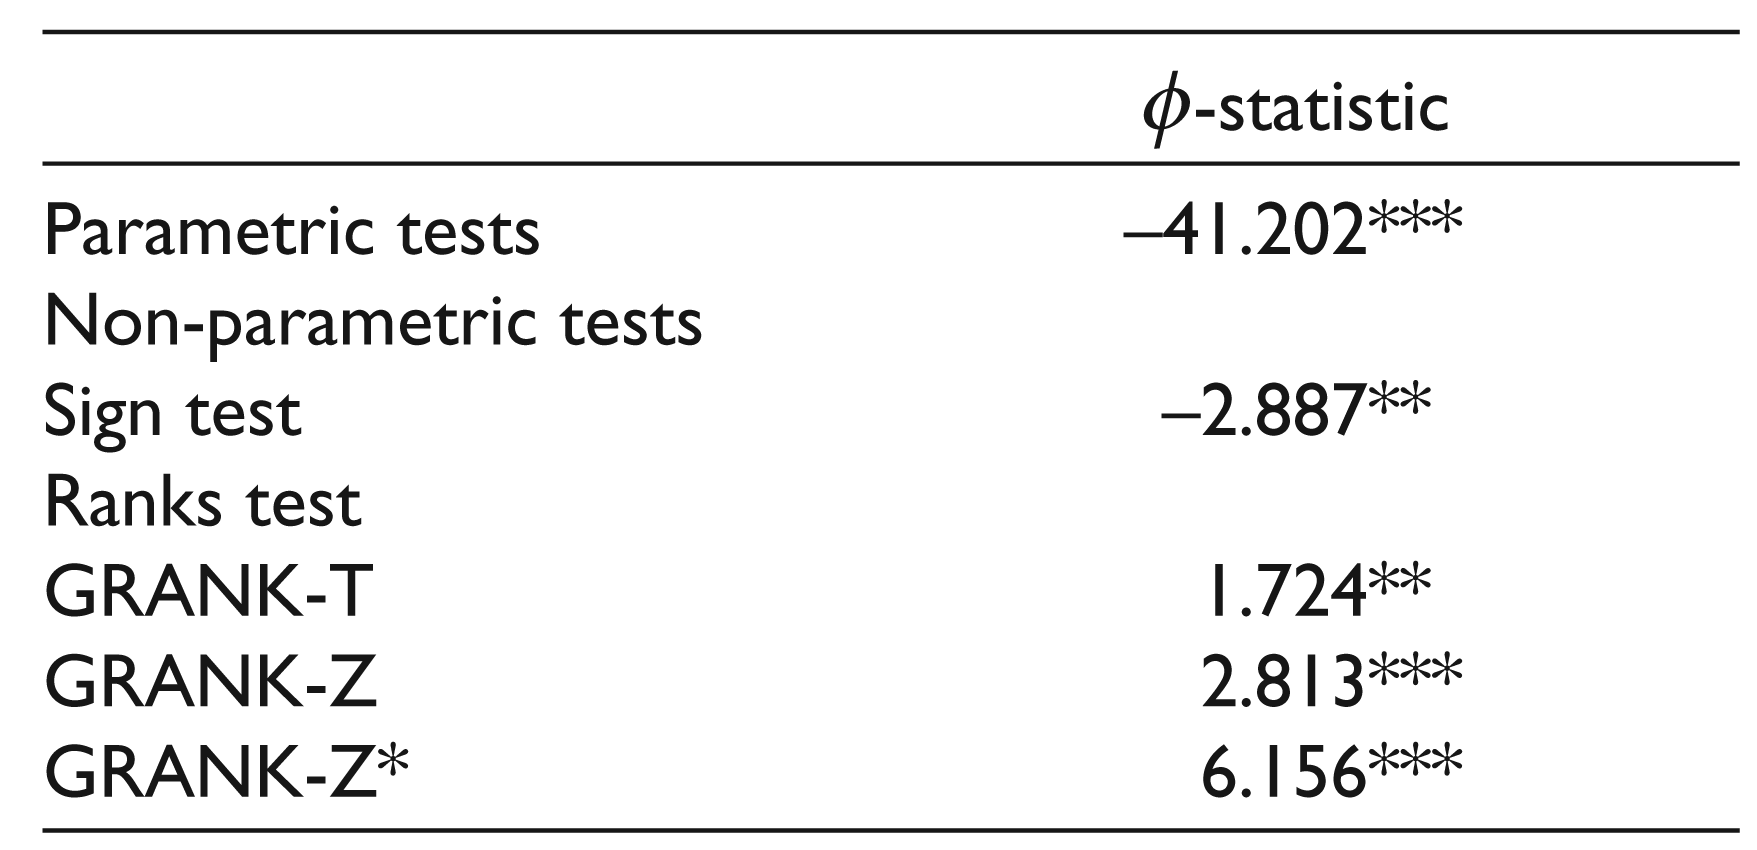
Next, the article examines the null hypothesis that the event had no significant impact on the overall stock markets of Vietnam. As described above, five tests were conducted for this testing purpose, consisting of a parametric test and four non-parametric tests (a sign test and three rank tests). The results of these tests are summarised in Table 3.
Based on these results, at any conventional significance levels, there is insufficient evidence to accept the null hypothesis. This finding is robust to all the five tests employed in this study. Hence, it may be concluded that the event had a statistically significant influence on Vietnam’s overall stock market performance during the event window period.
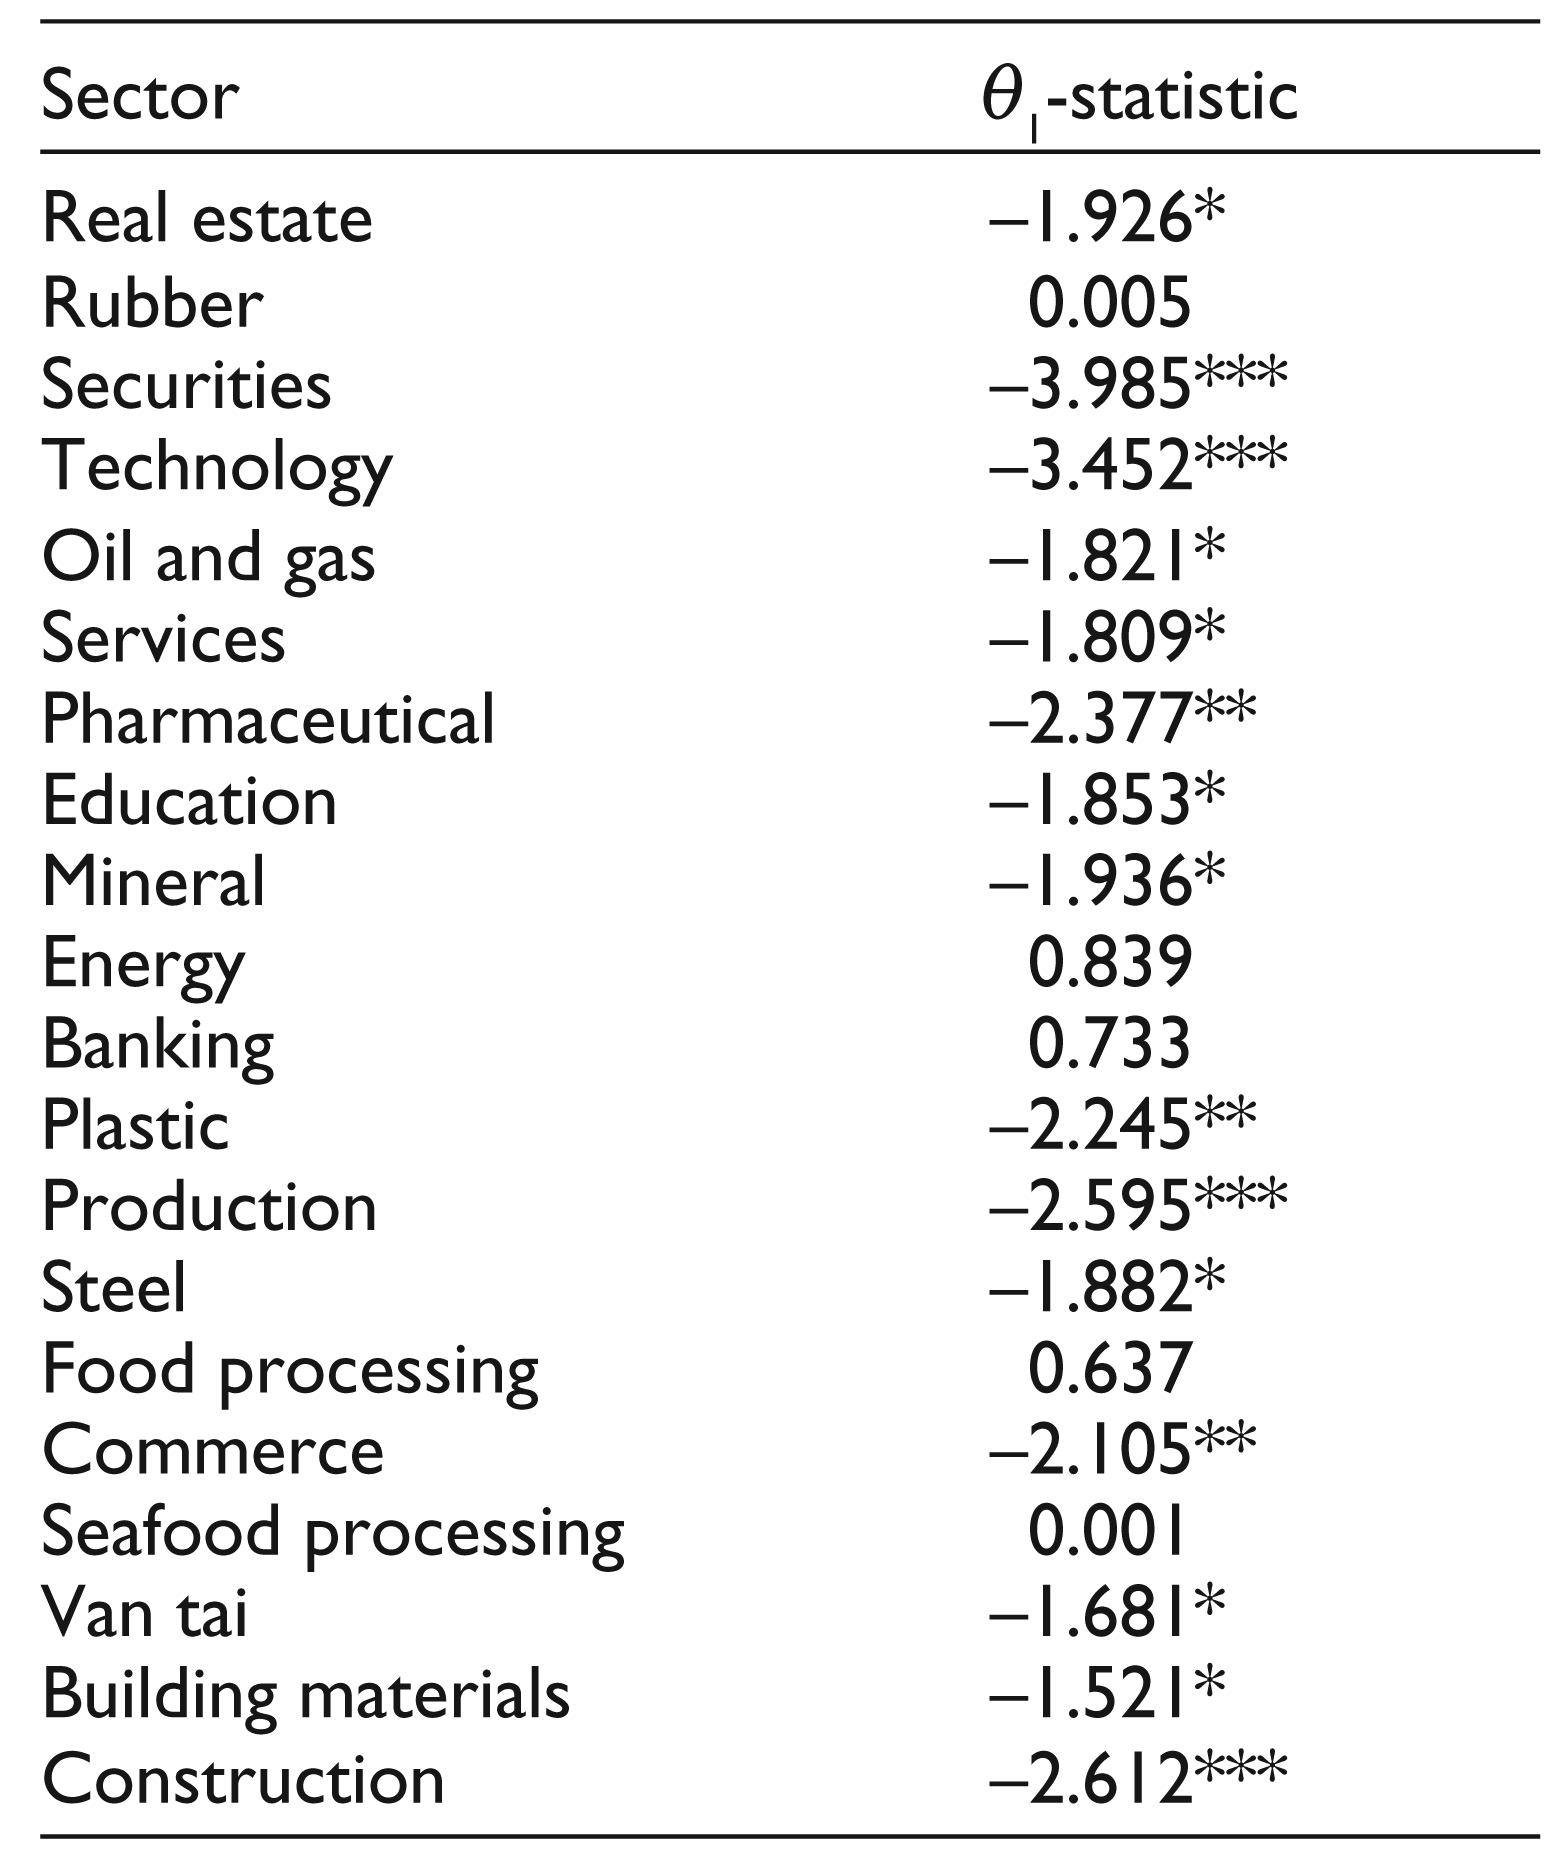
The study then examines the null hypothesis that the event had no significant impact on Vietnamese stock market at sector level. The parametric test was conducted for this testing purpose. The results are reported in Table 4. The results reveal that there is insufficient evidence to accept the null hypothesis for most of the sectors in Vietnam. On the other hand, during the event window period, the event appeared to have a negligible influence on Vietnam’s five sectors including: rubber, energy, banking, food processing and seafood processing.
Descriptive Statistics for the Sample Period (from 3 May 2013 to 19 June 2014)
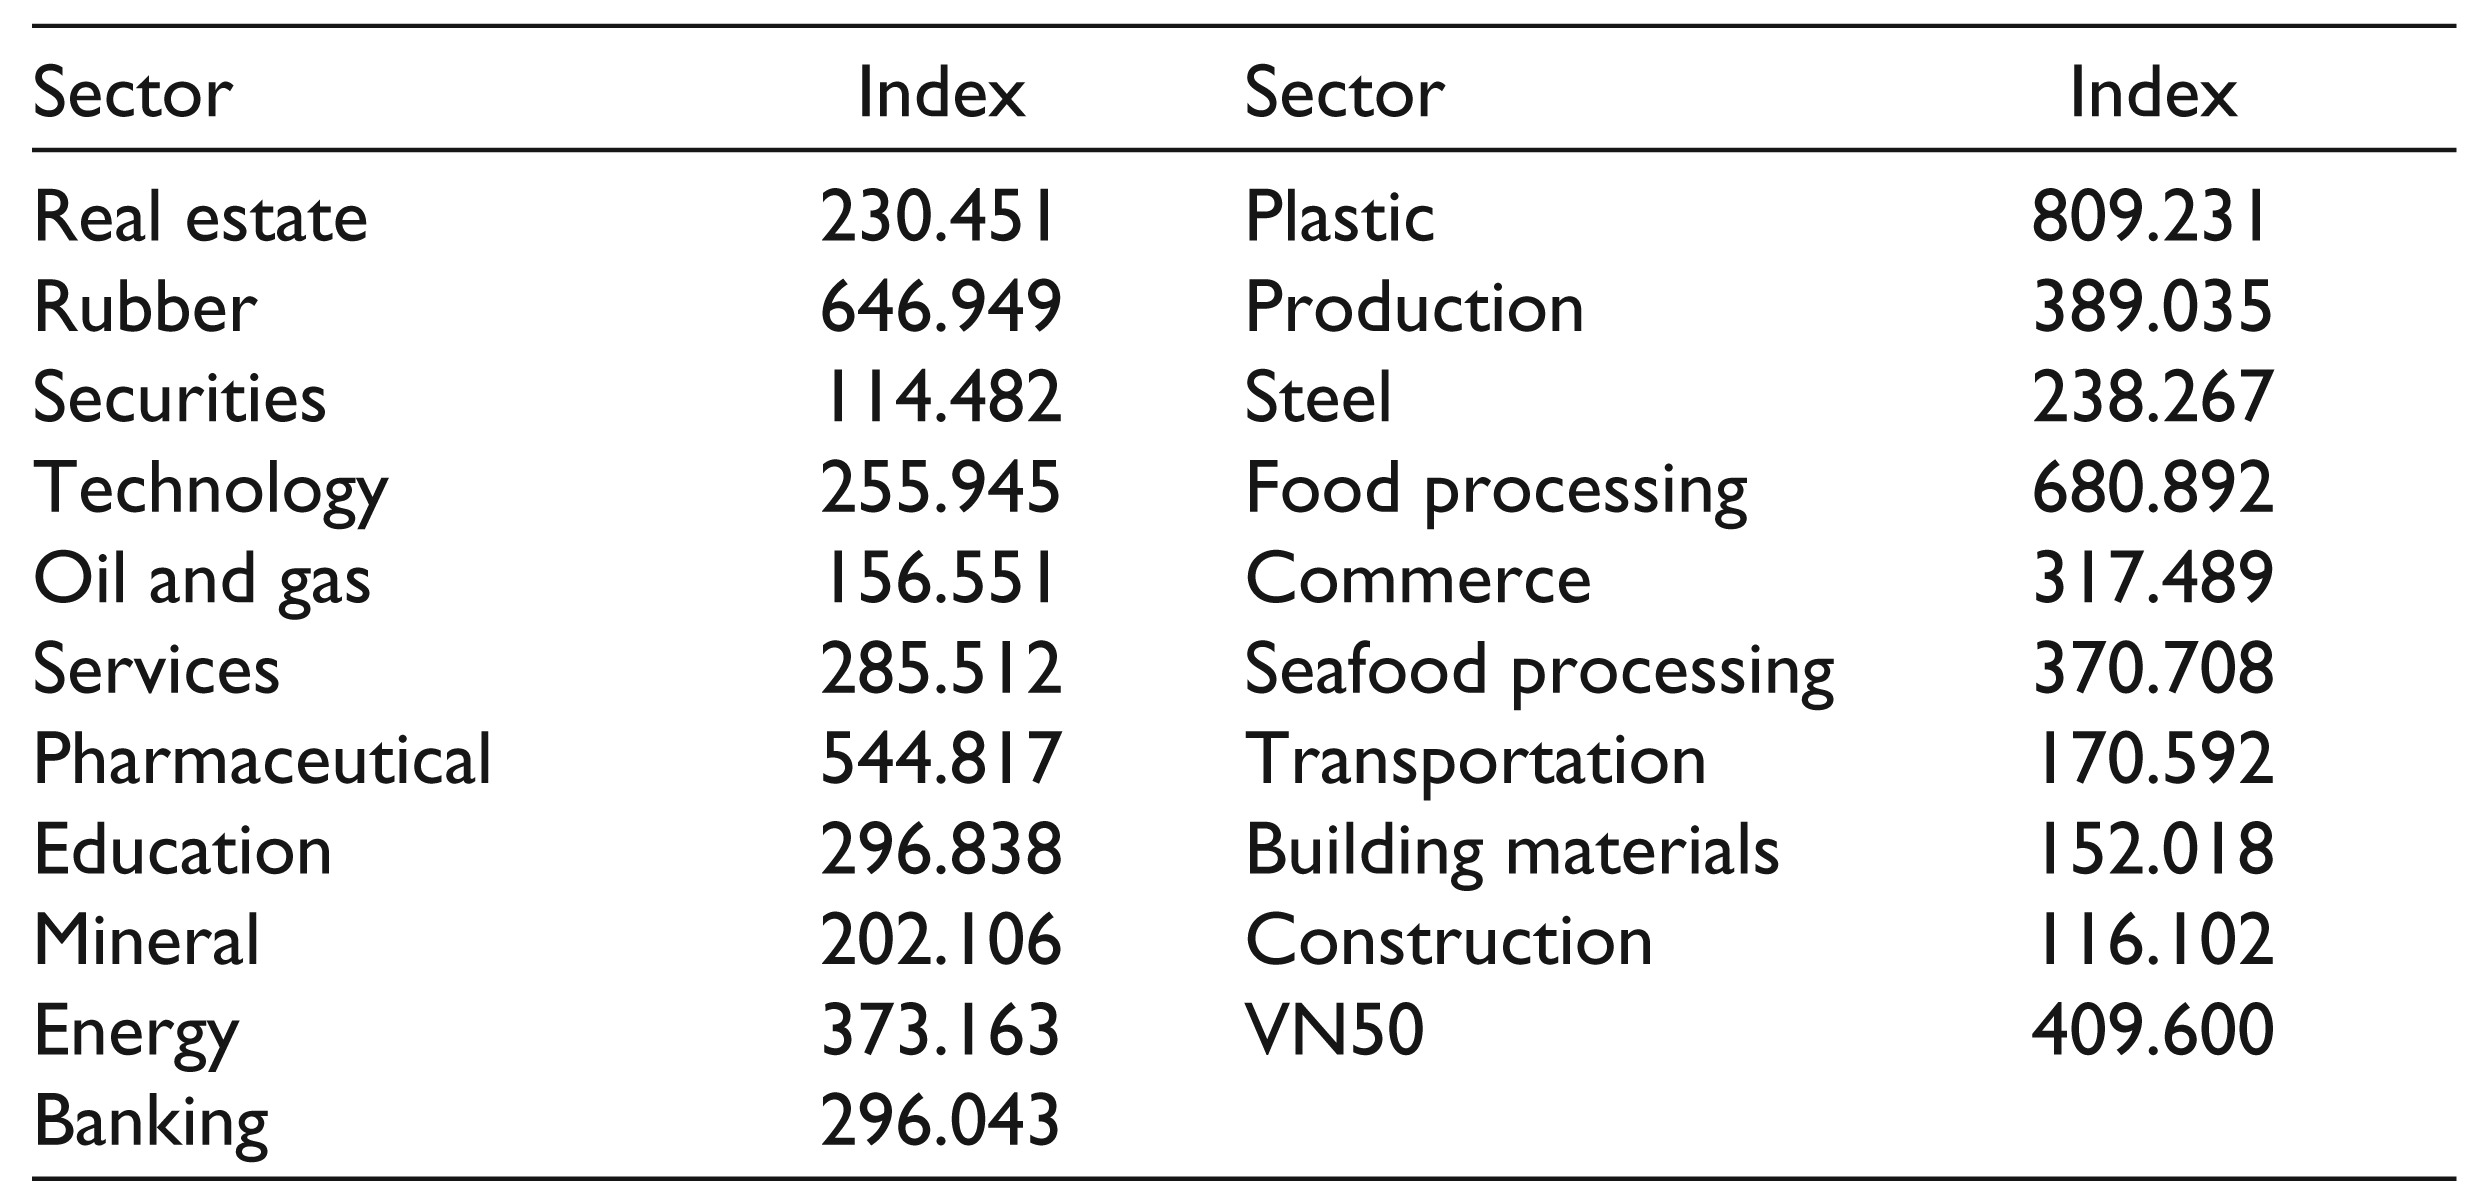
Descriptive Statistics for the Sample Period (from 3 May 2013 to 19 June 2014)
Normal Distribution Test Results
Parametric and Non-parametric Test Results
Parametric Test Results at Sector Level
Next, the cumulative average abnormal return (CAAR) of the overall market performance is plotted in Figure 4. It can be observed that CAAR occurred about 15 trading days before the event date. This implies that investors started responding to this event 15 trading days before the public announcement date. In fact, the Hainan Maritime Safety Administration of China had made an announcement on their website (in Chinese) on 17 April 2014 about the drilling work of HD-981 that would last from 2 May to 15 August 2014. 6 The CAAR became negative during the whole event window period.
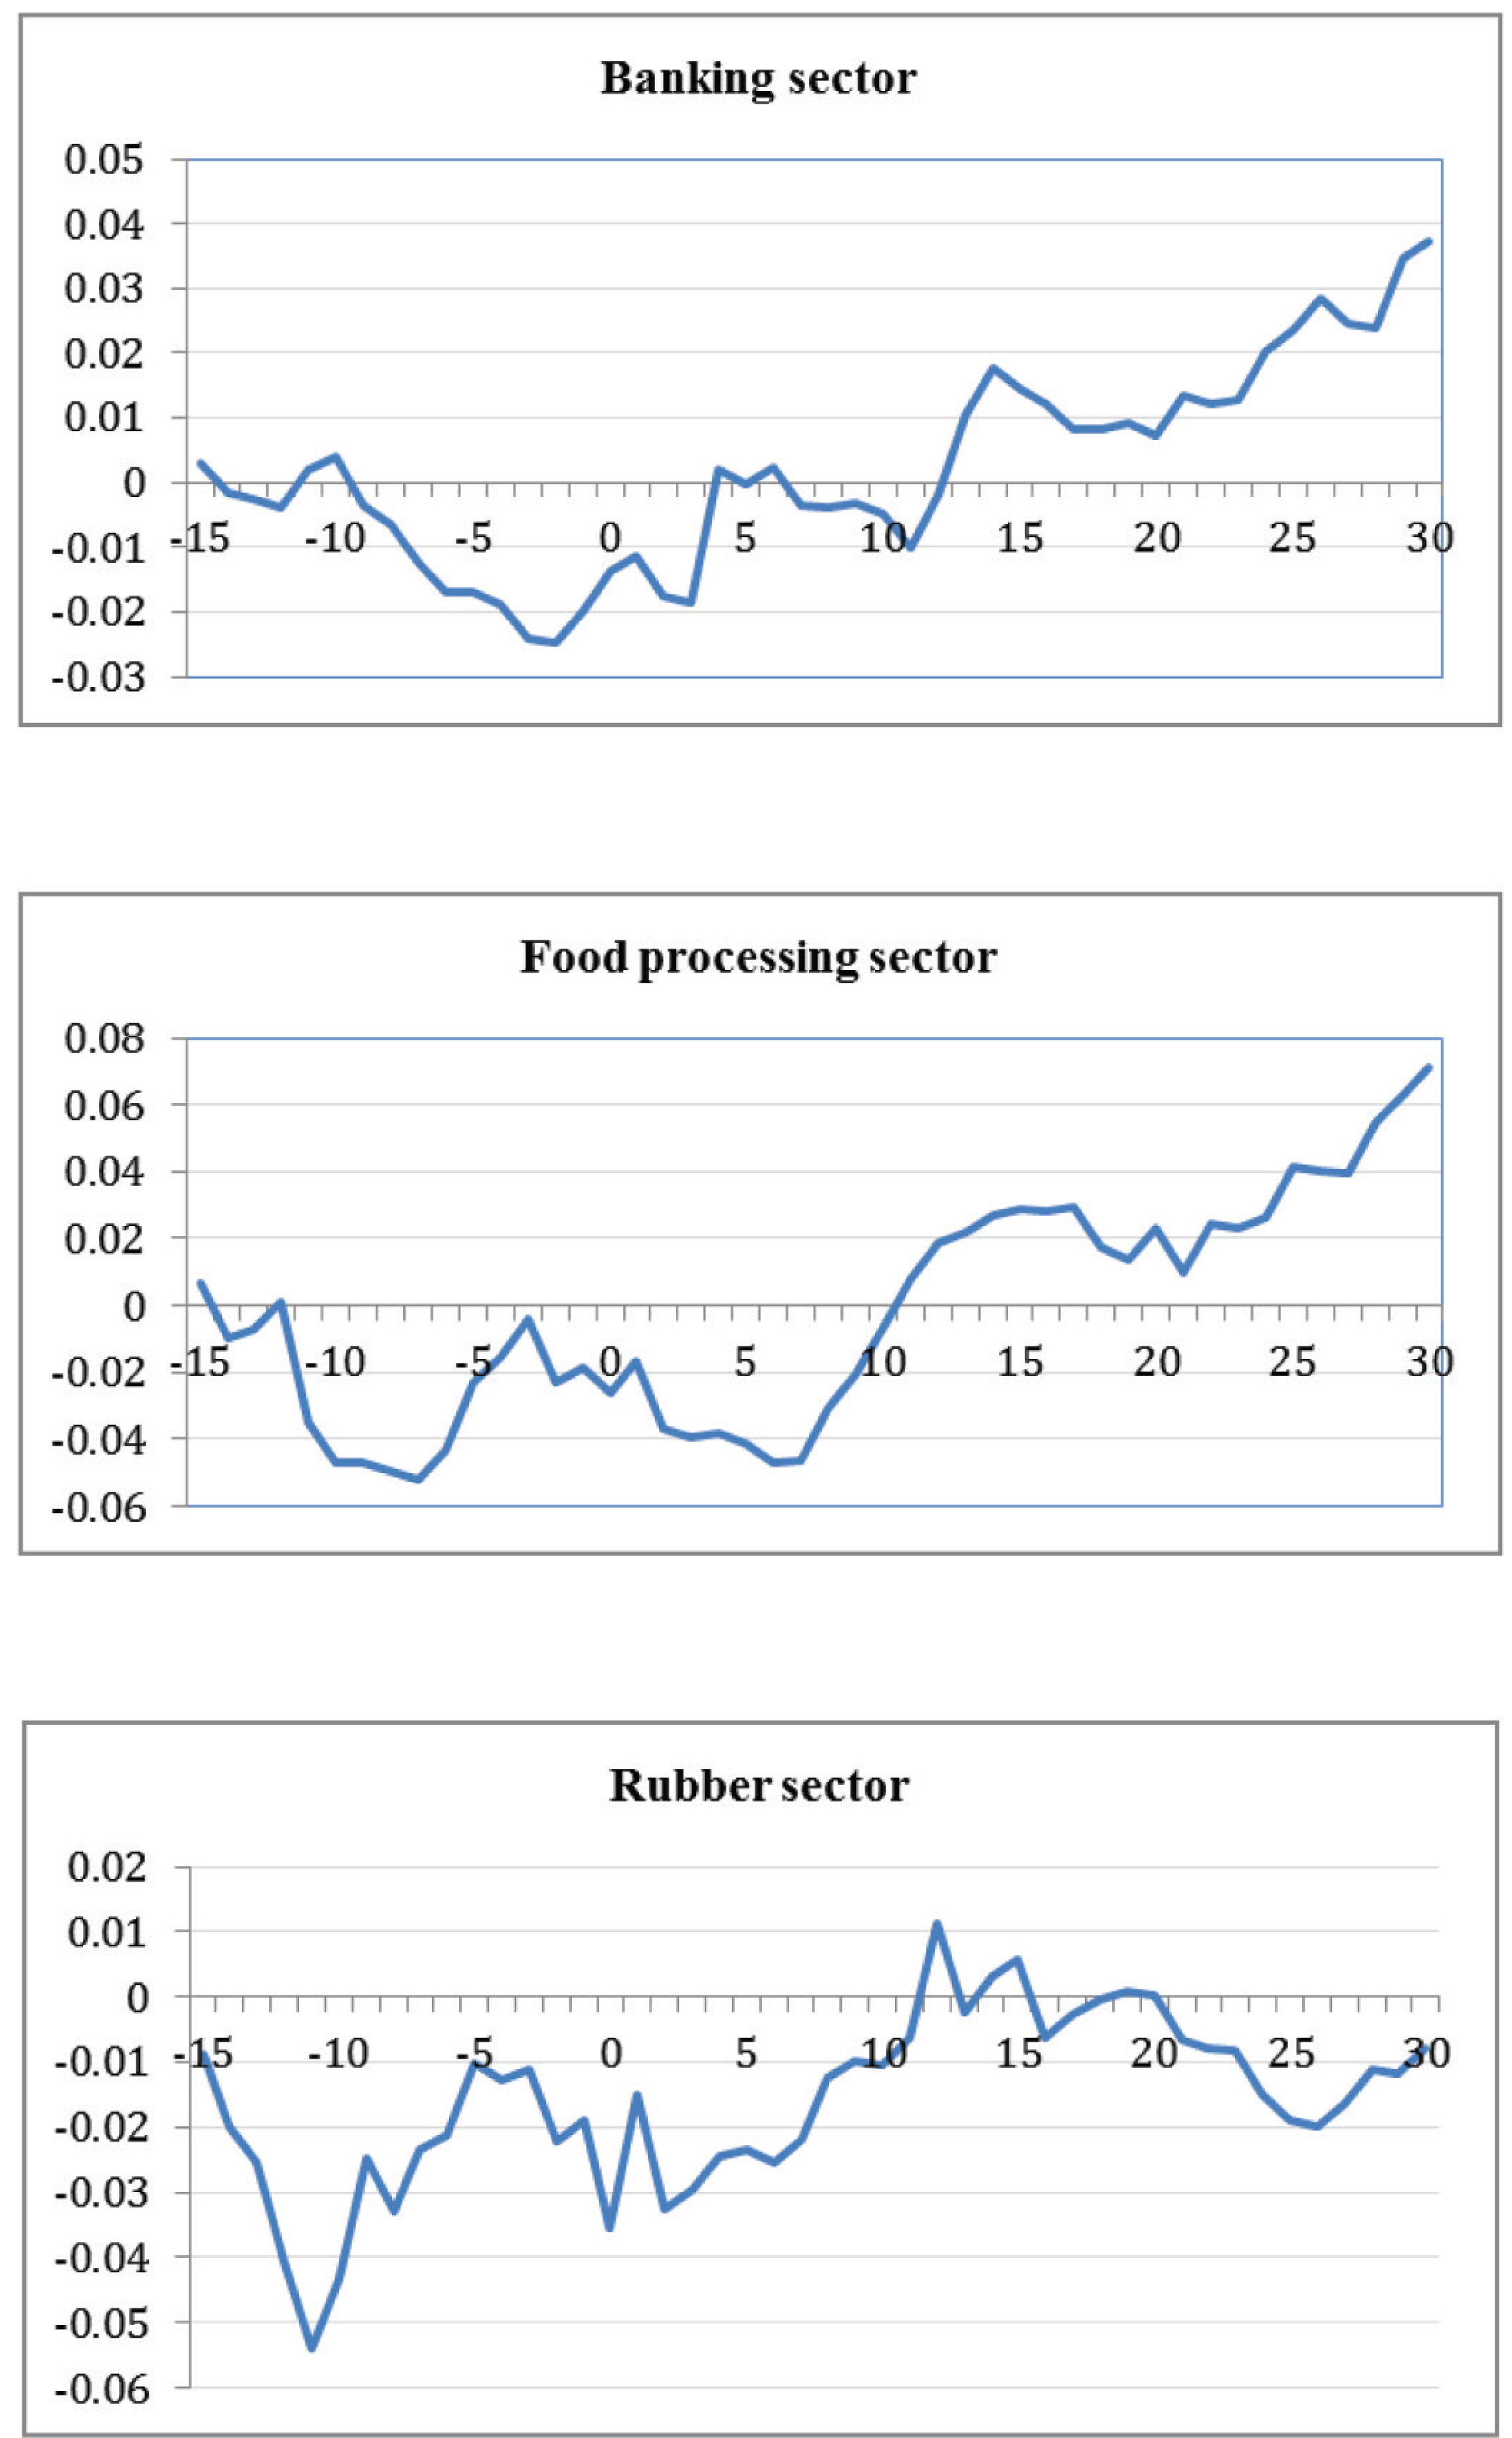
The CAR plots of all the sectors included in this study are presented in Figure 5 and 6. Based on their responses to the event, the sectors were divided into two groups: (a) sectors with negative abnormal returns after the event date and (b) sectors with zero abnormal returns after the event date.
The first group, which experienced negative cumulative abnormal returns after the event date, consists of real estate, services, pharmaceutical, education, production, steel, transportation, technology, building materials, oil and gas, mineral, plastic, commerce, construction and securities. In those sectors, the incidence adversely affected investor sentiment. Vietnam has close economic links with its neighbour China, a global economic power, in many industries. The HD-981 event created a lot of uncertainty in business transactions and activities between both countries, resulting in the cancelation of many orders. The incidence also severely affected the local operations of a large number of foreign manufacturing firms, which are mainly from Hong Kong, Taiwan and Singapore. Especially damaging were disturbances which broke out in Binh Duong, Dong Nai and Ha Tinh during 13 and 14 May. Thousands of Chinese workers were evacuated to China and around 60,000 Vietnamese workers were also adversely affected.
Tourism, a sub-sector of the services sector, also suffered a big fallout from the oil rig incidence. Occupancy rates fell sharply due to concerns from international tourists about the disturbances. According to statistics from the 18 largest hotels in Vietnam, from May to June 2014, 10 per cent of foreign guests cancelled their reservations. Tourist arrivals declined by about 10.4 per cent from April to May 2014, causing a loss of millions of US dollar for the tourism industry. Especially hard hit was tourism trade from Chinese visitors (decline by 20.4%), followed by Russian visitors (decline by 15.4%), then by South Korean visitors (decline by 6.8%) and by Taiwanese visitors (decline by 3.3%).

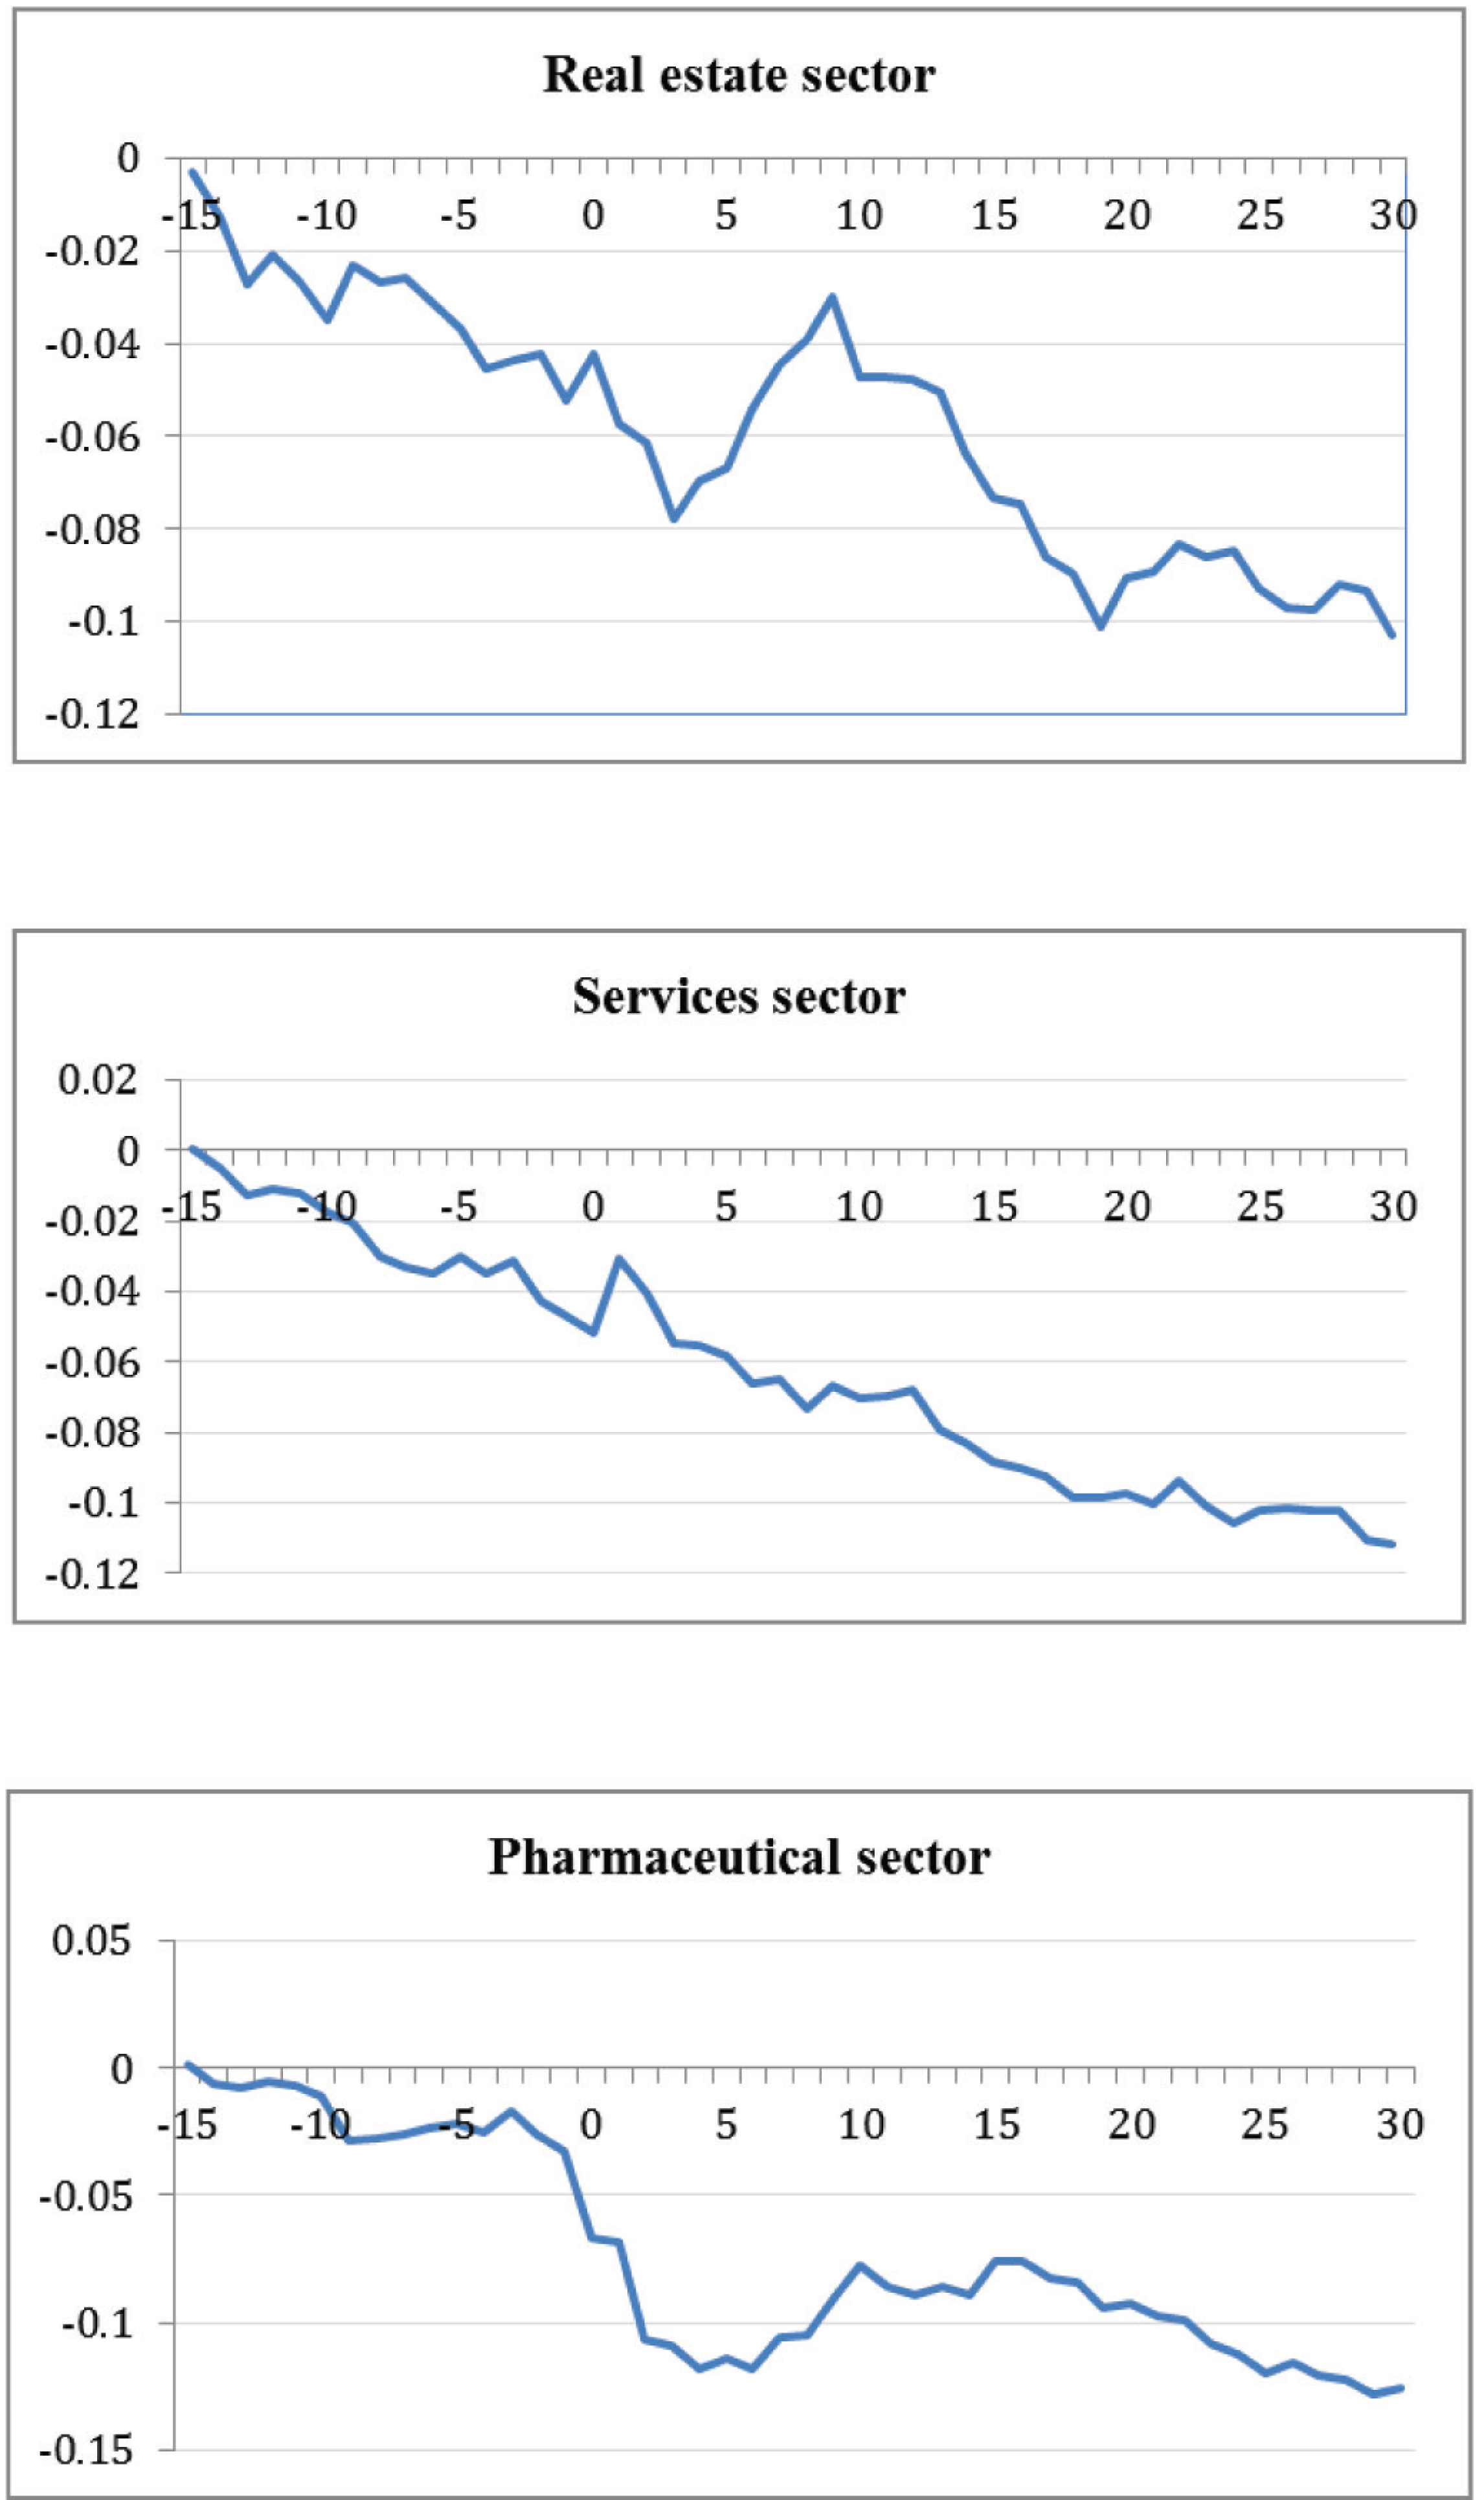
In the context of the oil and gas sector, the HD-981 event provoked concerns about negative impact on oil exploration in the East Sea. As a result, the stock market index of this sector also declined. For the securities trading sector, businesses had two main sources of income: (a) brokerage fee and (b) net profit from trading activities. The territorial tension led to a decline in overall market performance, which reduced the expected number of transactions. This adversely impacted the business operations of security firms and hence the stock market index of the sector.
Before 1 May 2014, the key indicators of the real estate sector were highly promising. More specifically, the stock market index surpassed 600 points, and cash flows from banks to the real estate market increased by over 30 per cent, from VND200 trillion (equivalent to more than USD9.5 million) about to VND268 trillion (equivalent to about USD12.8 million). Annual remittances in 2014 exceeded USD10 billion, and much of that went into the real estate market. Differences between purchase price and selling price emerged, and many real estate projects were highly profitable. The HD-981 incidence caused panic and insecurity among investors, who resorted to hoarding US dollar and gold instead of investing in real estate.
The second group with zero cumulative abnormal returns after the event date includes the banking, rubber, energy, food processing and seafood processing sectors. In particular, the influence of the HD-981 event on the operation of the banking system was negligible. In Vietnam, the banking sector is relatively low-risk due to tight control by the state and strong prudential regulation. The full-fledged commitment of the central bank—the State Bank of Vietnam (SBV)—to protect the security of credit institutions and foreign bank branches operating in Vietnam helped to shore up financial stability. In fact, the banking system shook off the psychological impact of the oil rig incidence in only 1 week. In order to calm down financial institution and markets, SBV also held meetings with foreign banks, including Chinese banks. Both local and foreign banks expressed a willingness to commit long-term to operation in Vietnam in response to such timely and proactive reassurances of the SBV.
With regard to the food and food processing sector, during the HD-981 event, many people in Vietnam felt insecure so they tried to hoard food. The evidence that political or violent conflicts cause food insecurity has been well documented in literature (refer to Messer & Cohen, 2006). The heightened sense of food insecurity increased the demand for food in Vietnam. Stronger demand raised the price of food and hence the profitability and stock prices of the food industry. The impact is thus somehow positive, however, insignificant.
Since the rubber sector is mainly export-oriented, its share price is mostly affected by climate and the international demand for rubber, neither of which depends on the political conflict between Vietnam and China. Another factor is the price of domestic fertiliser which was very stable due to government control. As such, there were no significant developments in the rubber sector and hence in its stock prices. The energy sector is also under tight government control, and hence the scope for market volatility is low.
At the time of the oil rig incidence, there was an announcement that Russia’s Veterinary and Phytosanitary Surveillance Service would lift a ban on various seafood imports from Vietnam. While Russia is not yet a major market for Vietnamese seafood exporters, the news turned Russia into a promising major export market. We can expect this to have a positive impact on the future prospects of seafood and seafood processing companies. This helps to explain why the stock market index of this sector was not adversely affected by the HD-981 event.
The estimation window used in this article is from t = –251 to t = –16. The robustness check utilised estimation windows of shorter length with 200 and 150 days, but the results were essentially the same. As such, it may be concluded that the results of this article are relatively robust to changes in the length of the estimation window.
China’s installation of the HD-981 oil rig in disputed territorial waters near Paracel Islands had a pronounced impact on Vietnam’s infant stock markets, wiping out tens of thousands of billions of Vietnamese dong within a few days, even within minutes of 15 May 2014. In this first ever event study for Vietnam’s stock markets, we analysed whether and how long in advance investors can predict the event date as well as the extent to which the event affected the performance of Vietnam’s stock markets, measured in terms of daily stock returns.
The results reveal that CAAR occurred about 15 trading days before the event date. This implies that the market anticipated this event and started responding to this event 15 trading days before the public announcement date. Further, the results strongly suggest that the event had a statistically significant influence on Vietnam’s overall stock market performance during the event window period. However, when looking at stock market performance by sector, it is found that while many sectors were badly affected by the event, the impact on a few sectors was either negligible or even positive.
During the time of the event, due to many different streams of information, there was fear of losing money in a part of the population as a result of lack of knowledge. As such, they sold off stocks or withdrew their savings to invest in gold and foreign currencies as a precaution. This made Vietnam’s stock market which just recently recovered to lose momentum and decline rapidly. It should be noted that the world financial markets including stock market, foreign exchange market and gold market did not have any significant volatilities due to this incident (which is different from the Ukraine incident). International stock markets remained highly stable, gold prices continued on its downward trend and the foreign exchange market also remained positively stable.
This suggests that the limited local nature of the problem did not affect the confidence of the international financial investors. On the other hand, it led to a sharp decline in market confidence in Vietnam. In the short and medium term, those that incited market panics, especially in the gold and stock markets, profited the most. What happened during the period of the HD-981 event also showed that SBV needs to make more efforts to restore confidence in the markets, particularly in terms of institutional factors and investor protection. To convince the market and increase its credibility, there is no other way for SBV other than promoting institutional reforms which are the primary obstacle of the restructuring programme, including the banking system restructuring, public investment restructuring, state owned enterprises’ (SOEs) reformation and attraction of foreign investment.
A number of factors explain why Vietnamese financial markets stabilised relatively quickly after the incidence. First, the incidence was resolved peacefully in a short period of time. Second, global financial market trends which determine the trend of Vietnam’s financial markets were stable during the incidence. Third, the SBV actively took measures to stabilise the market. However, the recovery speed of each sector varied depending on the interaction of the three factors mentioned above, especially the intervention of the central bank.
It is expected that this event study enriches our understanding of Vietnam’s infant stock markets and how they react to major shocks. At a broader level, we anticipate that our study encourages researchers to actively pursue event studies of infant financial markets in developing countries.
Declaration of Conflicting Interests
The author declared no potential conflicts of interest with respect to the research, authorship and/or publication of this article.
Funding
The author received no financial support for the research authorship, and/or publication of this article.
Footnotes
Appendix
The usual approach in event-study methodology is to calculate the cross-section average and cumulative abnormal returns for the industries. The cross-section cumulative average abnormal returns (CAARs) are calculated by summing the abnormal returns (CARs) and dividing by the number of industries in the study (N). The averages take into account the possibility that the event may have different impacts on the industries in the sample. (Using data for many industries provides evidence as to whether the impact of the event is more than just a one-time occurrence for a single industry). CAARs, representing the sum of the average abnormal return to a point in time, show the impact of the event over time. If the market does not anticipate an event, the CAARs up to the event date should be approximately zero.
In Figure A1, Panel A shows what the CAARs would look like for an event that has a 1-time positive impact on stock returns. The CAARs are zero until the event date, plotted as day 0; on the event date, the abnormal returns jump. Panel B, on the other hand, shows the event having a 1-time negative impact. In both panels, however the event has a lasting effect in that the CAARs do not return to zero. If the event is anticipated, the pattern of CAARs would look like Panel C; here, the returns start to move up several days before the event date, then jump on the event date.