






Abstract
Background
Glioblastoma (GBM) is the most aggressive primary brain malignancy, characterised by hypoxia-driven proliferation, therapeutic resistance and poor prognosis. While hypoxia-induced transcriptional changes are well documented, the temporal regulation of cell cycle genes under sustained hypoxia remains unclear.
Purpose
This study aimed to profile transcriptomic alterations induced by graded hypoxia and identify key hypoxia-responsive regulatory genes in GBM.
Methods
U87MG cells were cultured under normoxia and graded hypoxia (1–3 days), and experimental data of U87MG and LN229 GBM cells were utilised for validation and addressing heterogeneity. Differentially expressed genes (DEGs) were identified and analysed using STRING, Cytoscape, MCODE and CytoHubba to construct protein–protein interaction networks and extract hub genes. Functional enrichment was assessed through DAVID, ClueGO and KEGG, while prognostic relevance was evaluated using GlioVis and ONCOMINE data sets. Quantitative reverse transcription polymerase chain reaction (qRT-PCR) validated hub gene expression dynamics.
Results
A total of 275 DEGs formed two main functional modules enriched in cell cycle regulation and chemokine signalling. Eighteen hub genes (KIF20A, KIFC1, CCNB1, AURKA, EGR1, CDCA3, CENPF, CDCA2, ASPM, KIF11, CCL2, CXCL8, CCNA2, DLGAP5, RACGAP1, TPX2, PTGS2 and CTGF) were significantly associated with mitotic processes and GBM progression. Survival analysis demonstrated that 17 hub genes correlated with poor overall survival (p < .05). qRT-PCR confirmed that hub gene expression peaked during early hypoxia and declined with prolonged exposure, indicating dynamic regulatory adaptation.
Conclusion
These findings identify key hypoxia-responsive genes governing cell cycle progression and immunomodulation in GBM, highlighting their prognostic value and therapeutic potential in GBM.
Introduction
Gliomas are the most common neoplasms of the central nervous system, significantly impairing brain function. Among these, high-grade gliomas (WHO grades 3 and 4), particularly glioblastoma (GBM, WHO grade 4), rank among the most aggressive human cancers, with a median survival of only 12–15 months despite multimodal treatments including surgery, radiotherapy and chemotherapy. 1 GBM is notable for its extensive hypoxic regions, which are closely linked to anti-apoptotic mechanisms, tumour recurrence, therapeutic resistance and enhanced invasiveness, culminating in a highly malignant phenotype and poor clinical outcomes. 2 These challenges underscore the urgent need to decipher the molecular drivers that connect hypoxia with glioma progression.
Tumour hypoxia arises when oxygen demand surpasses supply due to rapid cellular proliferation and abnormal vasculature. Under hypoxic stress, glioma cells engage in complex transcriptional and non-transcriptional adaptations that facilitate survival, angiogenesis, invasion and resistance to therapy. 3 These adaptations are primarily orchestrated by hypoxia-inducible factors, which intersect with critical regulators of the cell cycle such as c-Myc, p53, cyclin D1 and Aurora kinase A (AURKA). 4
Histopathological features frequently observed in GBM, including nuclear atypia, multinucleation and failed cytokinesis, reflect profound dysregulation of cell cycle control, promoting genomic instability and driving malignancy. 5 Although hypoxia is recognised as a key factor enhancing glioma aggressiveness, its specific impact on cell cycle regulation, particularly the contrasting effects of acute versus chronic hypoxia, remains incompletely understood. Emerging evidence indicates that acute hypoxia may stimulate proliferation, whereas chronic hypoxia can suppress DNA replication, alter checkpoint control and induce dormant-like cellular states.6, 7 This duality emphasises the necessity for systematic evaluation of hypoxia-mediated changes in cell cycle-associated gene networks.
Recent advances in high-throughput transcriptomic profiling combined with protein–protein interaction (PPI) network analysis have enabled the identification of hub genes and key molecular pathways involved in cancer progression. In gliomas, molecules such as cyclins, kinesins and cell division cycle associated (CDCA) proteins have emerged as pivotal drivers of proliferation and invasion; however, their expression dynamics in the context of hypoxia remain poorly characterised. 8
Based on the recent literature, a robust research gap in the field of hypoxia’s role in glioma biology is evident. Although numerous studies describe hypoxia-induced gene expression changes, there remains a lack of comprehensive understanding regarding the temporal dynamics of hypoxia-driven transcriptional regulation, particularly in relation to cell cycle hub genes in GBM. While static gene expression snapshots are common, the complex adaptive transcriptional responses over time, especially under sustained hypoxia, are underexplored. Additionally, there is insufficient integration of transcriptomic data with functional network analyses to identify critical regulatory hubs that could serve as precise therapeutic targets. Addressing these gaps through dynamic, systems-level investigations could significantly enhance our understanding of glioma progression and resistance mechanisms under hypoxic stress. Our findings provide new and comprehensive insights into the complex transcriptional remodelling of glioma cells in response to hypoxic stress, revealing dynamic regulatory networks that govern adaptation, proliferation and survival in the hypoxic tumour microenvironment. By identifying key hypoxia-responsive hub genes with prognostic significance, this study not only enhances understanding of GBM biology but also highlights promising molecular biomarkers that could inform patient prognosis and guide the development of targeted therapeutic strategies aimed at overcoming hypoxia-driven treatment resistance.
Material and Methods
Cell Culture
U87MG cells procured from ATCC were cultured in Dulbecco’s Modified Eagle Medium (DMEM) (Sigma-Aldrich, Germany) supplemented with 10% FBS (heat-inactivated) and 10 µg/mL of Ciprofloxacin (Sigma-Aldrich, US) at 37°C and 5% CO2. Cultures were regularly checked for mycoplasma contamination. Trypsin-EDTA (Gibco) was used to de-adhere the cells for subculture. Hypoxic conditions were established using a regulated Anoxomat system (Mart Microbiology) in which the cells were incubated in chambers flushed with pre-set oxygen concentrations. Hypoxia at 0.1% O2 was given for 24, 48 and 72 h with media replenished every second day during the culture. The available whole transcriptome data set (GSE27523) of LN229 GBM cells treated with siHIF-1α, siHIF-2α and scrRNA, cultured in hypoxia (1% O2), was analysed.
Ribonucleic Acid Isolation and Microarray
Ribonucleic acid (RNA) was isolated from cultured cells using TriReagent (Sigma-Aldrich, Germany). RNA was then treated with DNase (MBI Fermentas, USA). To inactivate the DNase, 0.1 volume of DNase inactivation reagent was added and quantified by a NanoDrop ND-1000 spectrophotometer (Thermo Fisher Scientific, USA). The optical densities (OD) were measured at 260 and 280 nm spectrophotometrically, and the quality of RNA was further checked on a Bioanalyzer before proceeding with the microarray. The RNA Integration Numbers of more than 9.0 were further processed for microarray. Microarray was performed on an Illumina Beadchip HT-12 v3 in a commercial facility for the U87MG data set. Microarray images were analysed by using Genome Studio 2011.3 software (Illumina), where the data were pre-processed and normalised at the probe level. Background correction was performed, and multiple testing corrections were applied. Probes with low expression (e.g., those below background or not expressed in the majority of samples) were filtered out prior to downstream analysis. Subsequently, probe intensities were collapsed to gene symbols by mean, and differential gene expression analysis was performed at the gene level. Log2 ratios of differentially expressed genes (DEGs) were calculated and utilised to analyse pathways significantly altered in hypoxia. Differential expression was assessed using fold change-based criteria.
Differential score = Treatment signal/Control signal
Log2 ratio = Log2 differential ratio; fold change = 2(Log2 ratio)
Microarray data set (GSE27523) of LN229 GBM cells comprising the experimental conditions hypoxia siHIF-1α, hypoxia siHIF-2α and untreated scrambled hypoxia were analysed in triplicate for microarray profiling. Pairwise comparisons between the averages of each set were made with a scrambled hypoxia control. Fold change and p value (<.5) were calculated to determine whether the HIF-mediated response in the 17 genes identified from the survival analysis reverted in the absence of hypoxia-inducible factors.
Protein Isolation and Western Blotting
Cultured GBM cells were lysed in triple detergent lysis buffer containing protease inhibitors. To ensure equal loading, the protein in the cell lysate was quantified using a BCA protein estimation kit. Lysates were resolved on 10% SDS-PAGE and electroblotted onto a nitrocellulose membrane. Anti-VEGFA, anti-CA9 and anti-β-actin (Abcam, USA) antibodies were used as primary antibodies for hybridisation to detect the specific proteins. For secondary binding, the blot was incubated with alkaline phosphatase/HRPO-conjugated goat anti-mouse/anti-rabbit antibody (Santa Cruz Biotechnology Inc., California) and developed in a Chemidoc system.
Bioinformatic Analysis
Differential Expressions Gene Analysis
DEGs were identified based on classification into three hypoxic conditions: 24 h, 48 h and 72 h with respect to normoxia in glioma cells (logFC > 1 or logFC < −1, p value < .05). The overlapping DEGs among these three hypoxic conditions were also identified by a Venn diagram (
Functional Enrichment Analysis of Common Differentially Expressed Genes (1–3 Days)
Functional enrichment analysis plays a vital role in annotating the large-scale biological attributes based on rigorous statistical methods in high-throughput genomic studies. Pathway enrichment analysis and key Hallmark gene sets of DEGs were performed with the Metascape online tool. 9 Metascape is a web-based tool for functional annotation of genes that identifies large-scale databases, including Hallmark Gene Sets and Kyoto Encyclopaedia of Genes and Genomes (KEGG) pathways.
Establishing Protein–Protein Interaction Network and Analysis of Module and Hub Gene
The Search Tool for the Retrieval of Interacting Genes (STRING, version 11.5) is a web tool application for evaluating the PPI networks based on computational prediction methods, public text collections and web resources of experimental data.
10
To build the PPI network, overlapping DEGs were submitted to STRING, version 11.5, and then visualised using Cytoscape software (version 8.0;
Validation of Significant Hub Gene Using Oncomine and Gliovis
The mRNA expression level of the significant hub genes was further measured in GBM versus normal brain tissue and validated using Gliovis 13 and Oncomine. 14 Both databases are user-friendly web tools for data visualisation and exploration of brain tumour expression data sets. In the Gliovis web tool, RNA-seq expression data of TCGA GBM-HGG- HG-U133A array consisted of 528 GBM tumours and 10 normal brain samples. Furthermore, expression levels of hub genes were also measured between 515 GBM and 152 low-grade gliomas using the TCGA GBM-LGG data sets. Expression of these genes was represented as boxplots wherein values are given as the mean ± SD. Tukey’s Honest Significant Difference test was performed, and p values of the pairwise comparisons are indicated as ***p < .001; **p < .01; *p < .05; and ns, not significant. The ONCOMINE microarray database was further used to check the mRNA expression levels of hub genes. Oncomine helps to investigate the gene rank (median rank for one target gene) as an overall analysis. The threshold was set at p = .05, a two-fold change and the top 10% gene rank. It compares the GBM versus normal brain tissue analysis, which includes 272 GBM and 50 normal brain tissue from seven data sets (Bredal Brain 2, Lee Brain, Liang Brain, Murat Brain, Shai Brain, Sun Brain and TCGA Brain).
Survival Analysis of Hub Genes
Survival data were obtained from Gliovis for glioma patients. A Cox proportional hazards model p < .05 was considered significant, and associated data analysis was displayed in a Kaplan Meier plot.
Complementary Deoxyribonucleic Acid Synthesis and Quantitative Reverse Transcription Polymerase Chain Reaction for Validation of Selected Genes
First-strand cDNA was synthesised using the MMLV Reverse Transcriptase Kit (MBI Fermentas, USA) and random decamers. Real-time RT-PCR was performed using SYTO-9 (Invitrogen, Carlsbad, USA) on a RotorGene 6000 real-time PCR machine (Corbett Research, Australia). The relative fold change of gene expression was calculated by the ∇∇CT method. 18s was used as the internal control or reference gene, and the qRT-PCR data have been represented as fold change ± standard error mean.
Results
Hypoxia Induces Morphological Alterations and Transcriptomic Reprogramming in Glioblastoma Cells
U87MG GBM cells were cultured under normoxia (20% O2) or hypoxia (0.1% O2) for 24 h (1DH), 48 h (2DH) and 72 h (3DH). Hypoxia induction was verified by nuclear stabilisation of HIF-1α as shown by western blotting (Figure 1A). Consistent with HIF activation, VEGF-A and CA9 protein levels were increased in hypoxic cells compared with normoxic controls at all time points (Figure 1B). Transcript levels of canonical hypoxia markers, including GLUT1, CA9 and VEGFA, were also significantly upregulated in 1DH, 2DH and 3DH (Figure 1C). Together, these findings confirmed robust activation of the hypoxia signalling pathway.
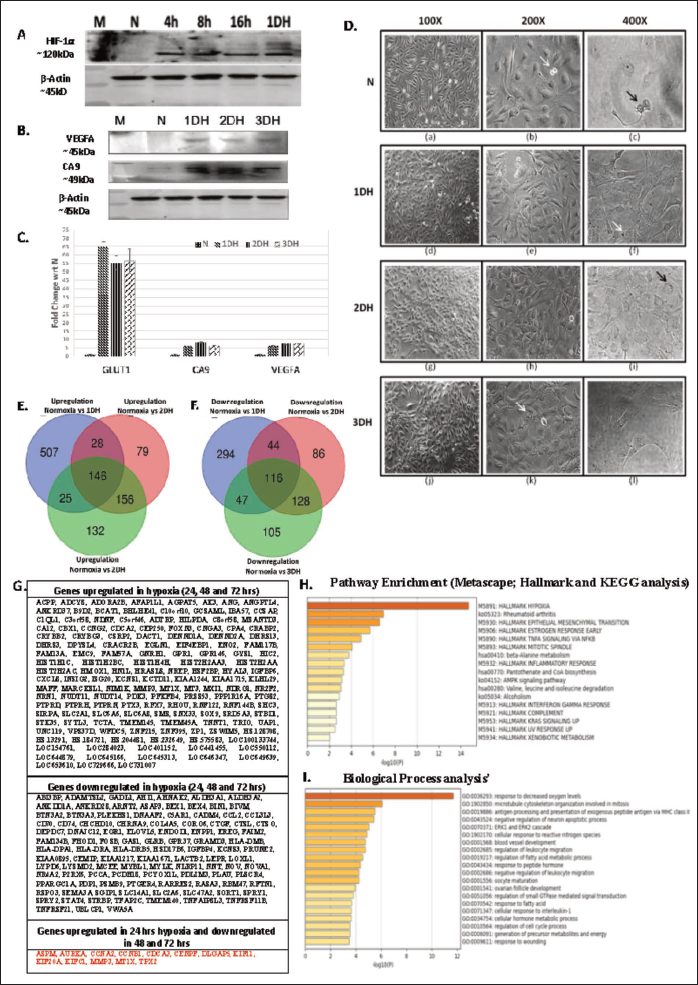
The induction of hypoxia was accompanied by morphological changes in U87MG cells. Cells displayed nuclear condensation and cytoplasmic vacuolisation, with abnormalities in cell division becoming more pronounced after prolonged hypoxia (72 h) (Figure 1D). These structural alterations suggest a direct effect of oxygen deprivation on cell cycle regulation.
To further characterise the molecular consequences of hypoxia, we performed transcriptomic profiling by microarray. DEG analysis (fold change ≥1.5 or ≤−1.5, p < .05), identified 1207 DEGs in 1DH (706 upregulated, 501 downregulated), 783 DEGs in 2DH (409 upregulated, 374 downregulated) and 855 DEGs in 3DH (459 upregulated, 396 downregulated) relative to normoxia (Figure 1E–1F). Across all time points, 146 genes were consistently upregulated, and 116 were consistently downregulated (Figure 1G).
Functional enrichment analysis (KEGG and biological process terms) revealed that hypoxia-regulated genes were enriched in pathways related to hypoxia homeostasis, epithelial-to-mesenchymal transition, estrogen resistance, TNFα signalling, mitotic spindle formation and inflammation (Figure 1H–1I). Of note, a subset of 13 genes (ASPM, AURKA, CCNA2, CCNB1, CDCA3, CENPF, DLGAP5, KIF11, KIF20A, KIFC1, MMP3, MTIX and TPX2) showed transient upregulation at 1DH but downregulation at 2DH and 3DH (Figure 1G, right panel). These genes are primarily involved in microtubule cytoskeleton organisation and mitotic regulation, highlighting the disruptive effect of hypoxia on cell division and cell cycle progression.
Network Analysis Identifies Hypoxia-related Modules
To explore the functional relationships among hypoxia-regulated genes, a PPI network was constructed. A total of 275 overlapping DEGs were uploaded into the online STRING database to gain PPI information and were visualised in Cytoscape, which resulted in 241 nodes and 334 edges with a PPI enrichment p value of 3.33e-16 (Figure 2A).
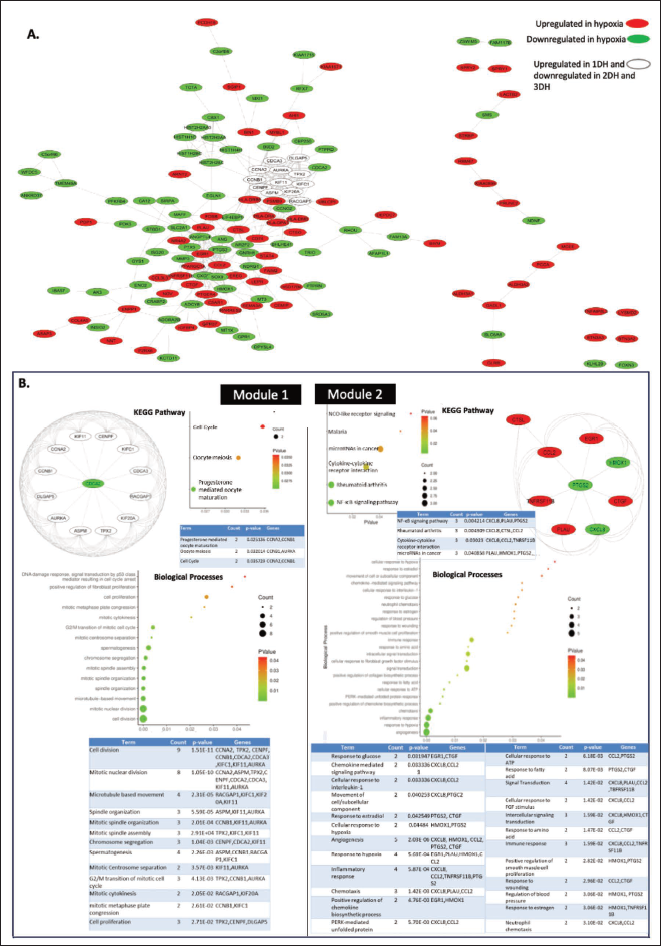
Module detection using Cytoscape with the MCODE plugin using the cutoff MCODE score >5 and number of nodes ≥5, identified six significant clusters (Supplementary Table 1). Cluster 1 (annotated as module 1; score = 13; nodes = 13; edges = 78) showed the highest density, size and cohesive core module. Module 1 consisted of 13 genes (CDCA2, CCNA2, KIF11, CENPF, KIFC1, CDCA3, RACGAP1, KIF20A, TPX2, ASPM, AURKA, DLGAP5 and CCNB1) that are predominantly involved in cell cycle regulation and mitosis (Figure 2B). Again, Cluster 3 (annotated as module 2; score = 6; nodes = 9; edges = 24) also showed strongly topologically significant genes and contained functionally coherent genes enriched in chemokine signalling pathways (Figure 2B). Another significant module consisting of histone-related proteins (Supplementary Figure 1) also emerged from the analysis. Interestingly, many Module 1 genes overlapped with the subset of DEGs that were transiently upregulated at 24 h of hypoxia and subsequently downregulated under prolonged exposure, suggesting dynamic regulation of mitotic pathways in response to hypoxic stress.
Functional enrichment analysis of the MCODE modules using the DAVID database further confirmed associations with key cell division processes, including spindle organisation, chromosome segregation and mitotic spindle assembly (Figure 2B). These results highlight that hypoxia primarily influences genes associated with cell cycle control and mitosis.
Prioritisation of Hub Genes by CytoHubba
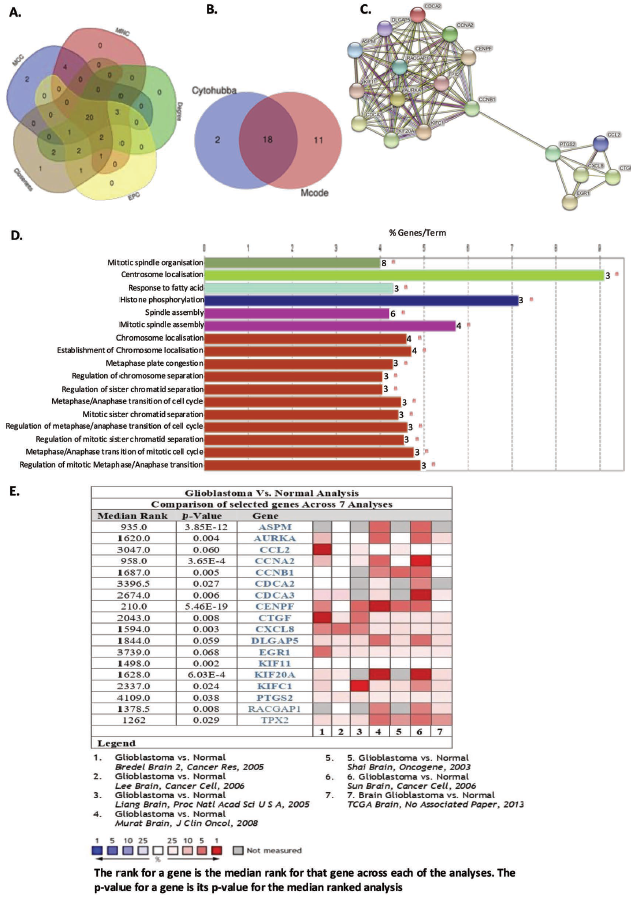
To identify the most influential genes within the PPI network, hub gene analysis was performed using the CytoHubba plugin. Genes were ranked based on five topological measures: closeness, degree, EPC, MCC and MNC. The top 30 genes from 275 DEGs in the PPI network were evaluated using five calculation methods (MCC, MNC, degree, EPC and closeness) employing CytoHubba in Cytoscape, and their scores in each of the methods used are represented in Supplementary Table 2. The intersection of the top 20-ranked genes across these parameters was considered the set of candidate hub genes (Figure 3A).
Further refinement was performed by overlapping CytoHubba-ranked genes with those from the MCODE modules, resulting in a set of 18 hypoxia-related hub genes: KIF20A, KIFC1, CCNB1, CXCL8, AURKA, EGR1, CDCA3, CENPF, CDCA2, ASPM, KIF11, CCL2, CCNA2, DLGAP5, RACGAP1, TPX2, PTGS2 and CTGF (Figure 3B). PPI analysis using the STRING database revealed that the CytoHubba-derived hub genes are highly interconnected (p value < 1.0e-16; Figure 3C), indicating their possible involvement in shared biological pathways. Furthermore, functional enrichment of these hub genes using ClueGO and CluePedia revealed strong associations with mitotic processes, including spindle organisation, centrosome localisation, spindle assembly and chromosome segregation (Figure 3D). Sixteen out of the top 17 enriched terms corresponded to mitosis and cell division, underscoring the central role of these hub genes in glioma biology.
Validation in clinical data sets using the ONCOMINE database confirmed that all hub genes except KIF11 were significantly upregulated in at least two independent glioma patient cohorts (Figure 3E). These results demonstrate that hypoxia-regulated hub genes are strongly linked to mitotic control and are consistently dysregulated in glioma, suggesting their potential as therapeutic targets.
Prognostic Relevance and Validation of Hypoxia-regulated Hub Genes
To assess the prognostic value of the identified hub genes, survival analysis was performed using the Gliovis platform. Sixteen of the 18 hub genes (KIF20A, CCNB1, AURKA, EGR1, CDCA3, CENPF, CDCA2, ASPM, KIF11, CCL2, CCNA2, DLGAP5, RACGAP1, TPX2, PTGS2 and CTGF) were significantly associated with OS in glioma patients (p < .05) (Figure 4A). Elevated expression of these genes correlated with shorter OS, highlighting their potential as clinically relevant prognostic markers in glioma (Supplementary Table 3).
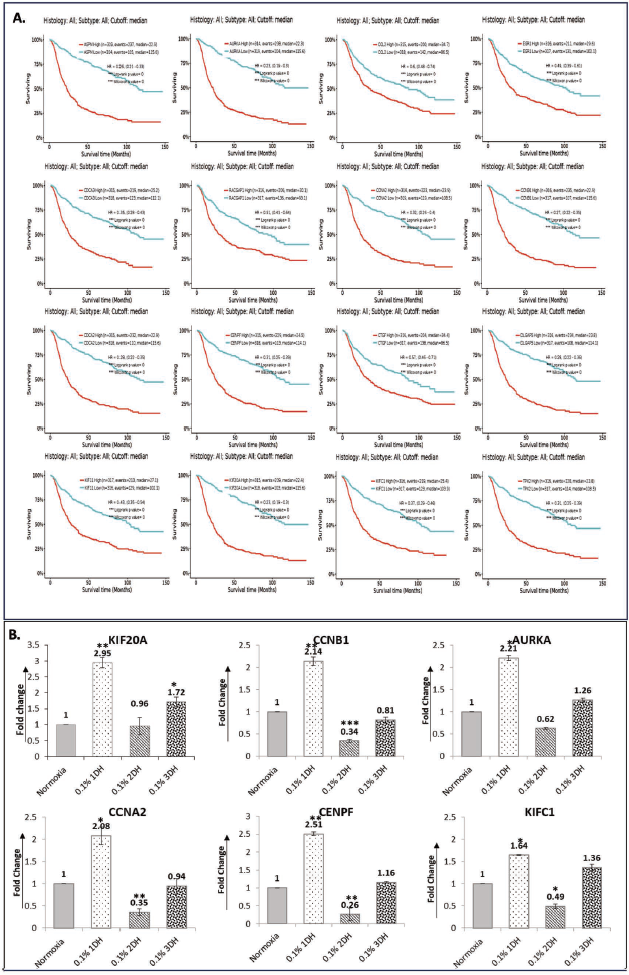
Given their prognostic importance, we next evaluated the expression dynamics of selected hub genes under hypoxic stress. qRT-PCR analysis of six candidates (KIF20A, KIFC1, CENPF, AURKA, CCNA2 and CCNB1) was conducted in U87MG cells cultured under normoxia and hypoxia (1DH, 2DH, 3DH). In line with the microarray results, transcript levels were significantly upregulated at 1DH but declined with prolonged hypoxia (2DH and 3DH) (Figure 4B). Notably, at 3DH, KIF20A, AURKA and KIFC1 expression remained higher than in normoxia (fold change > 1), whereas CCNA2 and CENPF returned to near-baseline levels.
Analysis of the key mediators of hypoxia response, HIF-1α and HIF-2α, in LN229 GBM cells cultured in hypoxia exhibited significant downregulation in many of the hub genes analysed (Supplementary Figure 2), signifying that downregulation of HIFs reduces the hypoxia-induced changes in GBM cells, although not significantly. These findings indicate a dynamic, time-dependent regulatory adjustment of cell cycle-associated genes in response to progressive hypoxic stress within the tumour microenvironment of gliomas. The analysis confirms that hypoxia-induced response occurs across genetically heterogeneous GBM cells.
Discussion
Hypoxia represents a defining microenvironmental hallmark of GBM, shaping its genetic, metabolic and immunological landscape.15–17 Prolonged hypoxia acts as a potent inducer of genomic instability and phenotypic plasticity in GBM, leading to compromised DNA repair.18, 19 The present study identifies 18 hypoxia-associated hub genes clustered around cell cycle, mitotic control and immune regulation—molecular systems central to tumour adaptability under low oxygen tension. These findings underscore the interplay between oxygen deprivation and transcriptional reprogramming, which collectively sustain glioma proliferation, invasion and resistance to therapy.
The upregulation of kinesins (KIF20A, KIF11, KIFC1), cyclins (CCNA2, CCNB1) and cell division-associated proteins (CDCA2, CDCA3) aligns with the proliferative and invasive behaviour of hypoxic tumour cells.20–23 These gene families orchestrate spindle assembly, mitotic checkpoint regulation and chromatin remodelling, reflecting an adaptive proliferative response that sustains tumour growth despite metabolic stress.24–30 The identification of these molecular signatures complements previous reports linking chronic hypoxia to dysregulated DNA repair and repeat element incorporation, mechanisms that promote oncogenic evolution within the glioma microenvironment. 18
Among the identified hub genes, AURKA, CENPF and CTGF demonstrate consistent upregulation across independent data sets and significant association with poor clinical outcomes. AURKA, beyond its canonical mitotic role, operates as a metabolic hub through regulation of c-Myc and glycolytic pathways, conferring treatment resistance under hypoxia.31, 32 CENPF, a kinetochore protein responsive to hypoxic stress, integrates p53 and MAPK signalling to modulate cell-cycle checkpoints,33, 34 while CTGF participates in extracellular matrix remodelling and angiogenic signalling.35, 36 The convergence of these molecules highlights a coordinated transcriptional network that links hypoxia to both proliferative and migratory phenotypes in GBM.
In addition to promoting cell division, hypoxia-induced transcriptional programmes remodel the immune microenvironment. Chemokines such as CCL2, among the identified hub genes, mediate recruitment of regulatory T cells and myeloid-derived suppressor cells, reinforcing GBM’s immunosuppressive niche.37, 38 These molecules also activate ERK1/2-driven signalling in tumour-associated macrophages, promoting pseudopodia formation and glioma invasiveness.38, 39 Such dual functionality, amplifying tumour aggressiveness while attenuating immune surveillance, illustrates the multifaceted impact of hypoxia-responsive genes on tumour–host interactions. Our results align with recent single-cell and spatial transcriptomic studies that highlight the heterogeneous hypoxic tumour-driven programmes in GBM. For example, single-cell RNA sequencing has identified a distinct hypoxic tumour cell subpopulation localised within the tumour core, characterised by enhanced invasiveness and macrophage interactions mediated by transcription factors such as CEBPD and FOSL1. 40 Similarly, combined single-cell RNA and ATAC (scMultiome) analyses revealed that chronic hypoxia remodels both transcriptional and chromatin landscapes to maintain glioma stem cell proliferation under low oxygen tension. 41 Spatial single-cell proteomic mapping further demonstrated that hypoxic niches in GBM harbour unique metabolic, stemness and immune signatures, including lymphocyte depletion and reprogramming of myeloid states. 42 These complementary findings highlight the dynamic, spatially distinct adaptations induced by hypoxia at both the cellular and microenvironmental levels and provide a broader context for the regulatory adjustments of hub genes observed in our data set. Trends in publicly available microarray data sets showed that HIF inhibition can modulate the downstream effector function of many of these genes.
Interestingly, sustained hypoxia did not uniformly maintain transcriptional activation of hub genes. Instead, many exhibited transient upregulation during early hypoxia (1DH) followed by a decline and modest rebound under chronic conditions (2DH-3DH). This biphasic response may reflect a diapause-like adaptive state, a reversible phase of metabolic quiescence that allows tumour cells to survive prolonged oxygen deprivation. 43 Comparable transcriptional dormancy programmes have been documented in colorectal cancer, mediated by proteins such as SMC4, which regulate lactate metabolism and chemotherapy resistance. 44 Moreover, treatment-persistent tumour cells across multiple cancers exhibit transcriptional states resembling diapause, involving suppression of MYC and mTOR pathways. Disruption of this adaptive programme, for example by targeting MYC activity, has been shown to enhance chemosensitivity. 45 These findings suggest that GBM cells utilise hypoxia-induced dormancy as a survival-adaptive strategy, a concept with implications for therapeutic design targeting resistant tumour cell subpopulations.
The identification of hypoxia-modulated hub genes integrates cell cycle regulation, immune modulation and stress adaptation into a unified model of GBM progression. These genes hold diagnostic and prognostic potential and represent promising candidates for therapeutic intervention targeting hypoxia-driven oncogenic pathways. The dynamic regulation of their expression also challenges static models of hypoxia response, emphasising the need for temporal and spatial analyses to elucidate molecular switching events governing glioma survival strategies.
Beyond GBM, hypoxia-induced molecular alterations have profound implications for the pathogenesis of other nervous system diseases. 46 Notably, hypoxic lesions in Alzheimer’s disease drive amyloidogenic processing via HIF-1α-mediated upregulation of β-secretase, contributing to plaque formation and neuronal death. 47 Hypoxia further exacerbates neuroinflammation and calcium dysregulation, which are pivotal in AD progression. 48 Similar hypoxia-driven mechanisms are implicated in stroke and traumatic brain injury, where HIF-1α regulates neurogenesis and metabolic adaptation. Thus, the hypoxia-responsive hub genes identified here reflect a broader molecular framework relevant to multiple neurodegenerative and neurovascular disorders, underscoring the translational potential of targeting hypoxia-adaptive pathways across nervous system diseases. Overall, these findings advance the understanding of how hypoxia orchestrates GBM’s molecular complexity, providing a mechanistic framework for future studies aimed at developing dual-targeting strategies combining cell cycle inhibition with modulation of hypoxia-adaptive pathways.
Footnotes
Acknowledgements
MKS acknowledges the Senior Research Fellowship from ICMR. JC is grateful for the Junior Research Fellowship from the Department of Biotechnology (DBT), Senior Research Fellowship (SRF) from the Indian Council of Medical Research (ICMR) and Research Associateship from DBT (DBT-RA). SS is a National Science Chair awardee of the ANRF, India; NSC/2022/000054. The Central Instrumentation Facility at UDSC has provided us with access to many equipment and facilities.
Author’s Contribution
MKS: Study design, culture of cells, RT-PCR, western blotting, microarray; JC: Culture of cells for validation of hub genes, qRT-PCR, bioinformatic analysis, first draft of manuscript. AB: Bioinformatic pipeline and analysis, KC: Resources, editing of manuscript, SS: Study design, resources, funding and editing of manuscript; TS: Study design, experiments, resources, funding, editing of manuscript.
Data Availability
The data supporting this article have been included as part of the Supplementary Information.
Declaration of Competing Interests
The authors declared no potential conflicts of interest with respect to the research, authorship and/or publication of this article.
Funding
The authors disclosed receipt of the following financial support for the research, authorship and/or publication of this article: The work was supported by ICMR (IIRP 2023-1868), SERB (SPG/2021/004574), SERB (CRG 2016/003523) and DBT (BT/PR14722/BRB/10/2010) granted to TS and National Science Chair (NSC/2022/000054) of the Science and Engineering Board (SERB), India, awarded to SS. Funding from the Department of Biotechnology, Indian Council of Medical Research (ICMR), Science and Engineering Research Board (SERB-CRG, SERB-POWER), University of Delhi—IoE-FRP and IoE-MRP to TS is gratefully acknowledged. The authors are thankful for the DST-FIST Level 2 funding to the Department of Genetics.
Statement of Ethics and Patient Consent
This study did not involve any human participants, human data, or human tissue. Therefore, ethics approval and informed consent for participation are not applicable.
Supplementary Material

References
Supplementary Material
Please find the following supplemental material available below.
For Open Access articles published under a Creative Commons License, all supplemental material carries the same license as the article it is associated with.
For non-Open Access articles published, all supplemental material carries a non-exclusive license, and permission requests for re-use of supplemental material or any part of supplemental material shall be sent directly to the copyright owner as specified in the copyright notice associated with the article.
