






Abstract
Background
Obesity has a detrimental effect on skeletal muscle mass and performance. Despite the widespread use of smokeless tobacco, particularly in India, limited information is available regarding its effect on neuromuscular performance and electromyographic characteristics in obese individuals.
Purpose
To estimate the effect of tobacco chewing on the electrical and mechanical equivalents of muscle performance among apparently healthy obese male tobacco chewers.
Methods
A total of 80 male participants aged 40–60 years were recruited for this study. The participants, based on their chewing habit, were grouped into cases (tobacco chewers for more than 5 years = 40) and controls (non-chewers = 40). Anthropometric measurements such as height (m), weight (kg) and body mass index were taken. Electromyography (EMG) and handgrip strength assessments were conducted on all participants. Surface EMG of upper limb muscles: flexor digitorum profundus (FDP), flexor digitorum superficialis (FDS) and extensor carpi radialis (ECR) were recorded bilaterally during maximum voluntary contraction (MVC) as well as during endurance time (ET).
Result
ET of a non-chewers was higher than that of a tobacco chewer in both hands (p = .006 and .00, respectively). A significant increase in root mean square values was noted in the left-hand FDP (p = .039) and ECR muscles (p = .014) during MVC among tobacco chewers.
Conclusion
The study shows that tobacco chewing may be associated with altered muscle endurance and selective neuromuscular activation patterns.
Keywords
Introduction
Obesity is characterised by excess fat deposition in adipocytes, which may induce chronic low-grade inflammation of adipocytes and other cells. 1 Genetic, environmental, socioeconomic and behavioural or psychological factors are all part of the complex aetiology of obesity. 2 Body mass index (BMI) is the most widely used indicator of obesity. In the Indian population, there is a revision of BMI criteria, that is, it has been categorised as underweight (<18.5 kg/m2), normal BMI (18.5–22.9 kg/m2), overweight (23.0–24.9 kg/m2) and obese (≥25 kg/m2). 3 Increasing BMI decreases physical performance. The pathways linking obesity to decreased physical performance and impairment are fully unknown. 4 Reduced mobility, strength, posture and dynamic balance problems are all signs of increased functional impairment linked to obesity. After midlife, muscular mass declines by about 6% per decade. 5 Researchers have investigated how obesity affects maximal isometric strength in a range of age groups. The performance of the skeletal muscles in the lower limbs has been the main focus of most studies. 6 The loss of physical function is often made worse by low muscle mass. However, there is an ongoing debate over the impact of obesity on physical performance. 7 Increased fat can deteriorate skeletal muscle contractile performance, which limits mobility. 8
Tobacco in its different forms of usage is one of the most common risk factors for all-cause mortality. 9 It has previously been discovered that tobacco usage, including smokeless and smoking, is associated with a lower BMI among Indians. 10 Another study showed that most people who quit smoking end up gaining weight. 11 Although tobacco’s detrimental effects on general health are widely known, little is known about how smoking specifically affects human muscle mass. 12
Several different approaches can be used to measure muscle performance. One approach is to estimate maximum voluntary contraction (MVC) and endurance time (ET) from handgrip strength (HGS). Hand dominance, hand size and the person’s posture throughout the test can all have an impact on HGS readings. 13 Muollo et al. examined the relationship between physical performance, lower limb muscular function as assessed by an isokinetic dynamometer, and HGS. 14
A second approach focuses on surface electromyography (sEMG). Electromyography (EMG) signals are essentially the electrical activity of a muscle’s motor units; they reflect the anatomical and physiological characteristics of the muscle. 15 Numerous techniques have been developed to use sEMG during isometric and dynamic contraction to characterise muscle performance. 16 Even though obesity is often associated with decreased motor function, sEMG studies have not been conducted on obese people. The present study assesses the effects of tobacco chewing on the mechanical and electrical components of muscle strength in obese subjects.
Methods
Study Population
Eighty healthy male obese (i.e., BMI ≥23 kg m−2) subjects (40–60 years) were included in this cross-sectional analytical study. Subjects with a history of nerve or spinal injury, nerve or neurovascular degenerative disorders, limb surgery, any systemic diseases or metabolic disorders were excluded from the study. Study subjects were subdivided into two groups: case—tobacco chewers (n = 40) for more than 5 years, and control—non-chewers (n = 40). Standing height and weight were measured to calculate BMI [weight/height2 (kg/m2)]. The study was undertaken after prior approval by the Institutional Human Ethics Committee of All India Institute of Medical Sciences (AIIMS), Gorakhpur, UP (IHEC ref no.: IHEC/AIIMS-GKP/BMR/253/2024) on 13/02/2024, and participants gave their written informed consent.
Muscle Performance
The HGS and EMG were used to assess the functional performance of the upper limb. The test was performed on a digital data acquisition system (AD Instrument PowerLab system, PL26T04 Dunedin, New Zealand). EMG, MVC and ET were recorded on LabChart-8 software.
Electromyography
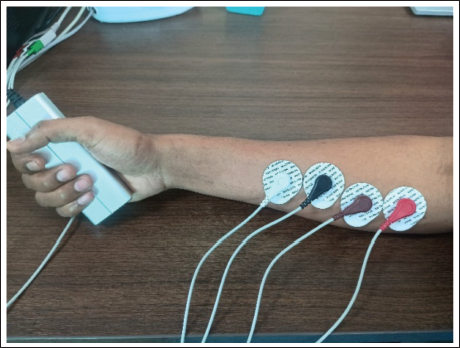
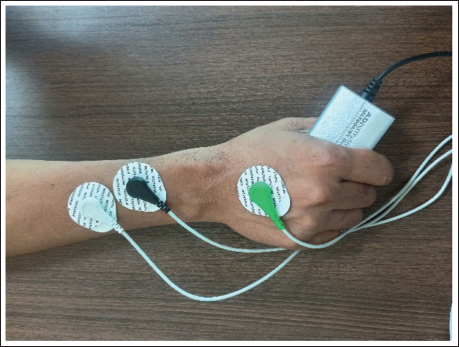
The participants were informed regarding the procedures before the test. sEMG was done in the upper limb bilaterally in the sitting position. Surface EMG of flexor digitorum profundus (FDP), flexor digitorum superficialis (FDS) and extensor carpi radialis (ECR) were recorded in resting position as well as during MVC and ET (Figures 1 and 2). sEMG electrodes were positioned according to established anatomical landmarks. For the FDS, electrodes were placed over the anterior forearm approximately one-third of the distance between the medial epicondyle and the wrist crease, along the muscle belly. For the FDP, electrodes were positioned over the proximal anterior–medial forearm, lateral to the ulna, corresponding to the deep flexor muscle mass. For the ECR, electrodes were placed over the lateral forearm approximately one-quarter of the distance distal to the lateral epicondyle, aligned with the muscle belly. The active electrode was placed on the most prominent part of the belly of each muscle, while the reference electrode was placed on the muscle belly 2 cm apart from the active electrode, and the ground electrode was placed on the dorsum of the hand.
Electrode Placement of Flexor Digitorum Superficialis Muscle (Black—Active, White—Reference) and Flexor Digitorum Profundus Muscle (Red—Active, Brown—Reference) for Surface Electromyography (sEMG) Along with Digital Dynamometer to Assess Handgrip Strength (HGS).
Electrode Placement of Extensor Carpi Radialis Muscle (Black—Active, White—Reference, Green—Ground) for Surface Electromyography (sEMG) Along with Digital Dynamometer to Assess Handgrip Strength (HGS).
Instrument Setting
The gain was set to around 2,000 for sEMG, with a sampling rate of 2 kHz. Filter setting was 1–5 Hz (high pass, low cut) to approximately 200–4,000 Hz (low pass, high cut). 17
EMG signals are often analysed using both time-domain and frequency-domain methods across short time periods, or epochs, that typically last 0.5–1 s. Variations in the spectral content of sEMG signals, which manifest as changes in the EMG amplitude or the power spectrum’s form, can be revealed through frequency-domain analysis. In the time domain, assuming the EMG has a mean of 0 V, the root mean square (RMS) of the signal represents the degree of variation from zero and acts as an estimate of the standard deviation. It stands for the square root of the signal’s total power. 17 The mean power frequency (MPF) in the frequency domain and the RMS in the time domain were extracted from the raw EMG recordings for each of the muscles—FDS, FDP and ECR—during both MVC and ET. 18
Handgrip Strength
HGS was measured using a digital hand dynamometer, MLT004/ST Grip Force (ADInstruments, Australia). Before starting, participants observed a demonstration of the test procedure and engaged in two practice attempts. After 5 min of familiarisation, participants were seated with their feet supported on the ground, the elbow flexed at 90°, the forearm in a natural position, and the wrist in extension. The subjects were instructed to apply the maximum possible handgrip pressure for 5 s with each hand. The test was performed three times, interspersed by a 1 min rest between trials. The highest peak was used for the statistical analysis. Following the assessment of MVC, the subject was instructed to maintain a target value of 30% MVC for as long as possible for the evaluation of ET. 13
Statistical Analysis
The Shapiro–Wilk test was applied to assess the normality of data distribution. Independent sample t-tests were conducted to compare parameters, including EMG variables (MPF and RMS), and HGS components, such as MVC and ET, between tobacco chewers and non-chewers. A p value < .05 was considered statistically significant for all tests. Data analysis was carried out using SPSS Version 22, and graphical/chart representations were prepared in Microsoft Excel 2016.
Results
Handgrip Strength
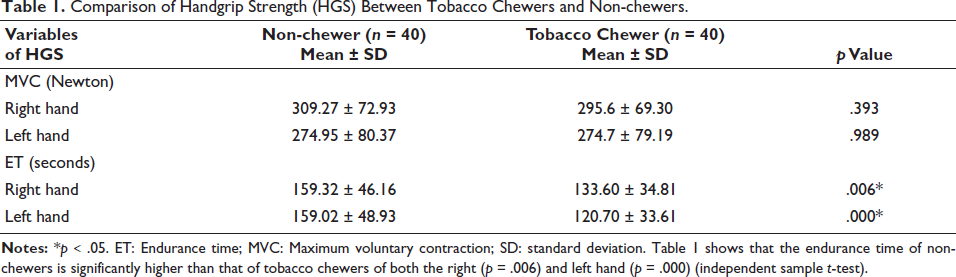
The comparison of HGS between tobacco chewers and non-chewers is shown in Table 1. During MVC, no significant association between tobacco chewers and non-chewers was observed. However, a statistically significant difference in ET was observed between tobacco chewers and non-chewers in both the right and left hands.
Comparison of Handgrip Strength (HGS) Between Tobacco Chewers and Non-chewers.
Electromyography
Both time domain (RMS) and frequency domain (MPF) parameters were analysed from the raw EMG signals of three different muscles.
Flexor Digitorum Superficialis
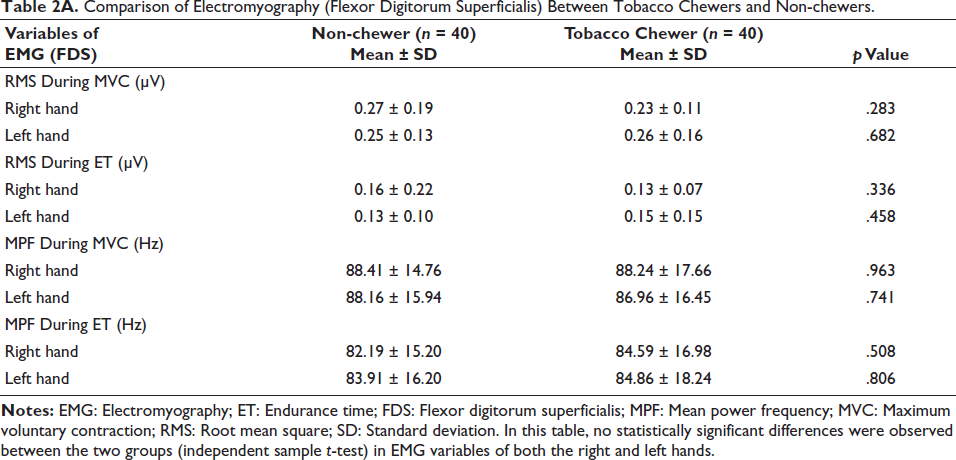
No statistically significant differences were observed between the two groups when comparing the RMS as well as MPF of EMG in the FDS muscle of both the right and left hands. The results of the electromyographic evaluation of the examined muscles are presented in Table 2A.
Comparison of Electromyography (Flexor Digitorum Superficialis) Between Tobacco Chewers and Non-chewers.
Flexor Digitorum Profundus
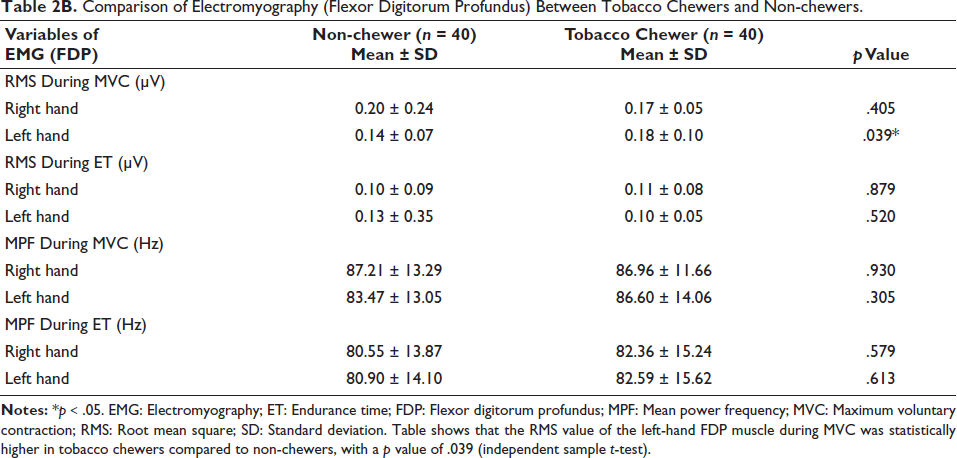
The RMS value of the left-hand FDP muscle during MVC was higher in tobacco chewers compared to non-chewers. However, no significant differences were observed in the MPF value of the FDP muscle activity during MVC or ET between the two groups. The results of the electromyographic evaluation of the examined muscles are presented in Table 2B.
Comparison of Electromyography (Flexor Digitorum Profundus) Between Tobacco Chewers and Non-chewers.
Extensor Carpi Radialis
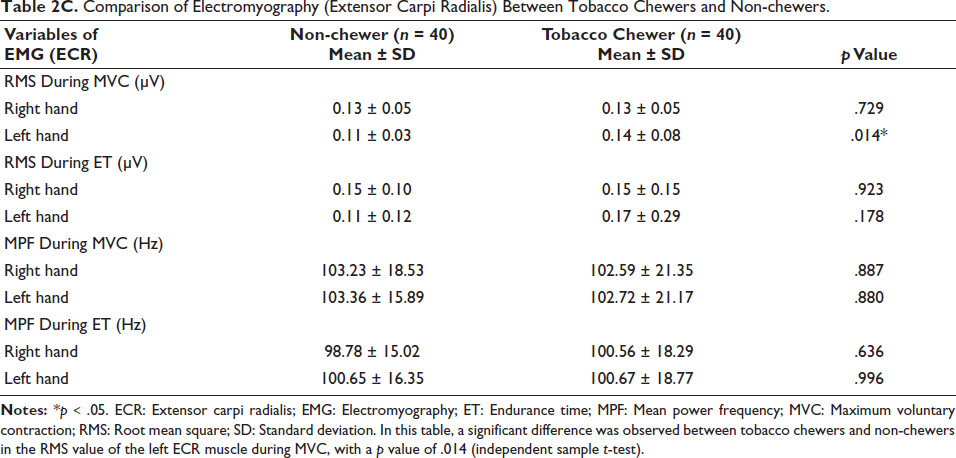
Similar findings were observed in the ECR muscle. The RMS value of the left-hand ECR muscle during MVC was higher in tobacco chewers compared to non-chewers. However, no significant differences were observed in MPF values of EMG in the ECR muscle during MVC or ET in either the right or left hand between the two groups. The results of the electromyographic evaluation of the examined muscles are presented in Table 2C.
Comparison of Electromyography (Extensor Carpi Radialis) Between Tobacco Chewers and Non-chewers.
Discussion
In this cross-sectional study, we found a significant difference in ET for both the right and left hands between tobacco chewers and non-chewers. Additionally, a statistically significant difference was noted in the RMS values of the left-hand FDP muscle during maximal voluntary contraction (MVC) between the groups. Significant differences were also observed in the RMS of the left-hand ECR muscle during MVC between tobacco chewers and non-chewers.
Handgrip Strength
Measures of muscular endurance showed notable variations. There was a notable difference between the ET of the right and left hands, with non-chewers performing better than tobacco chewers. Although prior studies have investigated the association between cigarette smoking and muscle strength, nothing is known about the relationship between tobacco chewing and muscle performance metrics. A prior study that indicated smokers had lower maximum and dominant HGS than non-smokers produced similar results. 12 According to earlier studies, smoking cigarettes may have a deleterious impact on muscle strength, especially grip strength, in Japanese males, which is consistent with the results of this study. 19 The level of leg fatigue intensity rose with increased exposure to cigarette smoke, according to Adatia et al.’s assessment of peripheral muscular strength and MVC against hydraulic resistance. Nonetheless, there was no clear correlation seen between smoking and total muscular strength. 20 Our results point to a possible link between tobacco consumption and muscle endurance. Nevertheless, there was no discernible variation in MVC across the groups in our investigation. This disparity could be explained by the fact that endurance, which is determined by time to fatigue, is impacted by a number of variables, such as blood supply and nutritional state, while MVC is predominantly determined by total muscle mass. It is well recognised that smoking causes atherosclerotic artery alterations, which can reduce blood flow and, in turn, muscle endurance.
Electromyography
Differences in the RMS values of particular forearm muscles were found to be statistically significant. The FDP and ECR muscles of the left hand showed changed RMS values in tobacco chewers, suggesting alterations in neuromuscular activation patterns that may be associated with tobacco use. In both the FDP and ECR muscles of the non-dominant hand, tobacco chewers had greater RMS values than non-chewers. Our results are supported by another study that showed increased muscular activation can be reflected in surface EMG signal amplitude. This was demonstrated by an increase in the EMG signal’s RMS values during voluntary muscular contractions. 17 The possible effect of tobacco chewing on excitation-contraction coupling could be the cause of this. As a stimulant, tobacco may make muscle fibres more excitable, but this effect is not translated or linked to the muscle’s mechanical strength.
Limitation
A limitation of this study is that only selected muscles were examined, and the focus was limited to hand muscles, which may not represent overall muscle performance. Additionally, lifestyle factors such as physical activity, diet and duration/frequency of tobacco use were not fully controlled, which could influence the outcomes.
Conclusion
This study examined how chewing tobacco affected the electromyographic activity and muscle endurance of specific forearm muscles. The findings showed that smokeless tobacco has a definite detrimental effect on muscle function. EMG showed changed RMS values in the FDP and ECR muscles, especially in the left hand during MVC, and tobacco users had considerably shorter ETs in both hands. These results imply that, even in the absence of systemic physiological alterations, tobacco chewing may affect regional muscle performance. This demonstrates how using smokeless tobacco may affect the health of the musculoskeletal system.
Footnotes
Acknowledgements
The authors express their gratitude to each and every study participant for their cooperation. The authors also thank their department and faculty for their help and advice throughout this project. The authors are appreciative of AIIMS Gorakhpur for providing the resources required to conduct this study.
Author’s Contribution
Zainab Noorain: Conceptualisation, data collection, experimental work, data analysis, interpretation of results and drafting the initial manuscript.
Ashish Arvind: Methodology development, assistance in data acquisition and contribution to data analysis.
Ekanki Samui: Statistical analysis, data validation and contribution to the interpretation of results.
Kumar Sarvottam: Conceptualisation, study design, supervision, data interpretation, critical revision of the manuscript for important intellectual content and final approval of the version to be published.
Amarpreet Kaur: Biochemical investigations and laboratory support.
Ratnesh N. Gajbhiye: Literature review, manuscript editing and formatting.
Anil Gangwar: Technical support, data management and assistance in manuscript preparation.
Declaration of Conflict of Interests
The authors declared no potential conflicts of interest with respect to the research, authorship and/or publication of this article.
Funding
The authors received no financial support for the research, authorship and/or publication of this article.
Patient Consent
Written informed consent was obtained from all participants for participation in the study and publication of the findings. All data were anonymized, and participants were informed that the published article would be freely accessible online.
Statement of Ethics
The research was conducted as per the Declaration of Helsinki guidelines. The study protocol was approved by the institutional human ethics committee of our institute (ref no - IHEC/AIIMS -GKP/BMR/253/2024).
