






Abstract
Improving economic viability of Indian agriculture is contingent upon agri-environmental sustainability (AES). Objective assessment of environmental costs of agriculture is lacking in India. Unless internalise environmental impacts of agriculture will be borne by the society at large, in terms of depletion and degradation of water resources, land degradation and emissions of greenhouse gases, etc. To assess AES of Indian agriculture, the present article builds a comprehensive agri-environmental sustainability index (AESI) based on 40 agri-environmental indicators. The study captures both spatial and temporal aspects of AES by covering 17 major Indian states over 24 years (1990–1991 to 2013–2014). The estimated AESI scores are validated with outcome indicators (e.g., groundwater depletion, depletion of soil nutrients). The results show that states having higher score in Sustainable Irrigation Index are facing lower fall in groundwater level and there are negative correlations across sub-indices of AESI and macronutrient deficiencies in soil. An inverse relationship between AESI scores and agricultural intensity (as measured by average productivity of foodgrains in kilograms per hectare) is also observed. The study comes out with policy suggestions which could help to attain AES of Indian agriculture.
Keywords
Introduction
Agricultural sustainability is defined as ‘when current and future food demands can be met without unnecessarily compromising economic, ecological, and social/political needs’ (Agricultural Sustainability 2004 as cited by Królczyk and Latawiec 2015). Agricultural sustainability depends on agri-environmental sustainability (AES) (Hayati et al. 2011). In absence of ‘system of integrated environmental and economic accounting’ (SEEA), objective assessments based on agri-environmental sustainability index (AESI) could be useful in understanding the state of environmental debt of Indian agriculture. 1 Achieving environmental sustainability of Indian agriculture is crucial not only to protect livelihoods of a large section of the populace but also to eradicate poverty and malnutrition. Intensive agricultural practices followed since 1960s have resulted in depletion of soil nutrients and degradation of soil, conversion of forest land, depletion and degradation of groundwater resources, diversions of surface water and loss of biodiversity in various parts of India (Damerau et al. 2020; Gill and Nehra 2018; Shah 2012; Srivastava et al. 2016). Agriculture touches upon all spheres of environment and natural resources (e.g., land, water and air) to source inputs as well as sink of wastes. Agricultural sustainability is largely depended on sustainability of natural resources (like land and water) as well as ecosystem services. There is a two-way relationship between agriculture and environment. Agriculture and related activities impact environment and also polluted environment impacts agriculture, for example, impacts of climate change on agriculture (UNDP 2019). Deteriorating water environment, land degradation, loss of biodiversity and growing demand for land from alternative uses are the major challenges that Indian agriculture is facing today (Srivastava et al. 2016). Though agriculture is the major user of water, diversions of water for alternative uses is rising with rise in population, urbanisation, per capita income and unavailability or pollution of local sources of water. Moreover, due to scarcity of water in semi-urban and urban locations, marginal quality water is often used in agriculture, which is not only polluting groundwater resources but also posing potential public health hazards in terms of contamination of food chains by heavy metals and other emerging pollutants. Large-scale depletion and degradation of groundwater resources is observed in various parts of India (CGWB undated). Deterioration of soil fertility and rising cost of accessing desirable quality and adequate quantity of water for irrigation are the major factors influencing the rising cost of agriculture (Mukherjee 2008). Water scarcity and degradation of agricultural land are the major hurdles in alleviating poverty, especially in developing countries, as it reduces the productivity of land on which the poor depend more. Hence, environmental degradation can perpetuate poverty and inequality (Barbier and Hochard 2016).
Rising anthropogenic pressures on the earth systems in general and agri-environment (land, water, biogeochemical cycle and biodiversity) in particular may result in abrupt global environmental change (Rockström et al. 2009). Growing pressures on agri-environment due to unsustainable agricultural practices may not only diminish the country’s ability to produce sufficient food in the future (Damerau et al. 2020) but also transgress ‘planetary boundaries’ (e.g., climate change, rate of biodiversity loss, changes to the nitrogen cycle) (Rockström et al. 2009). A comprehensive assessment of AES of Indian agriculture may help to take necessary actions to reduce pressure on agri-environment.
Given the importance of AES, United Nations set the following target (Target 2.4) under the Sustainable Development Goals (SDGs):
To assist countries to assess the achievement in SDG Target 2.4, Food and Agriculture Organisation (FAO) has brought out a draft list of agri-environmental indicators (AEIs) for discussion (FAO 2017). However, many targets set under SDGs are affected by AES and also AES is affected by many other targets (Mukherjee 2020). It is to be acknowledged that any assessment of AES based on AEIs must be based on local conditions and availability of data on target indicators.
Given the Government of India’s initiative to lunch ‘National Mission for Sustainable Agriculture’, development of a comprehensive AESI for India could help to focus on issues related to long-run AES. Moreover, AESI could also help to assess the present state of AES across Indian states and devise state-specific policies/programmes to achieve SDG’s Target 2.4. In the next section, we review literature that develops AEIs to assess AES. In the third section, we present our methodology and data sources and in the fourth section we present our results. In the fifth section, we validate our results with various outcome indicators. We draw our conclusions in the sixth section.
Literature Review
Literature on agri-environmental index has evolved over the last two decades. The existing studies on agri-environmental index could be classified into two broad categories: (a) macro- or indicator-based assessment of environmental impacts of agriculture (e.g., Binder et al. 2010; Girardin et al. 2000; Hajkowicz et al. 2008) and (b) field level experiments (either based on simulations or model-based analysis, experiments, e.g., Bockstaller et al. 2008; Langeveld et al. 2007; van der Werf and Petit 2002). In this article, we mostly focus on studies that assess the overall status of AES based on indicators. The effectiveness of AEIs can be judged from their quantifiability, scientific soundness, reference to relevant issues and cost-effectiveness.
Sustainable agriculture is the way of managing the agricultural ecosystem in terms of maintaining biological diversity, regeneration capacity, productivity, vitality and ability to function so that it can fulfil current as well as future economic, social and ecological functions without harming the other ecosystems (Lewandowski et al. 1999). The basic attributes of sustainable agriculture include the efficient use of natural resources (land, water, energy, nutrients, etc.), productive use of human capital through reducing ecological footprints of production and consumption, and use of traditional and modern scientific knowledge to minimise emissions of greenhouse gases (GHGs), soil and water pollution (Koohafkan et al. 2012). Agricultural sustainability has different attributes, indicators and components that capture the complex interactions among economy, society and environment (Lopez-Ridaura et al. 2005; Wilson and Buller 2001). These dimensions are also interlinked to other three dimensions, viz., spatial, temporal and normative, which help to capture the dynamic aspects of AES (von Wirén-lehr 2001; Zhen and Routray 2003). Given the importance of AES, several studies capture different indicators to reflect state of AES of a specific country or region, for example, Astier et al. (2011) for Latin America, Dillon et al. (2010) for Ireland, Eilers et al. (2010) and Huffman et al. (2000) for Canada, Brower and Crabtree (1999) and Gomez-Limon and Fernandez (2010) for Spain, Kelly et al. (2018) and Wilson and Buller (2001) for European Union, Langeveld et al. (2007) for the Netherlands, Roy and Chan (2012) for Bangladesh, Sands and Podmore (2000) for Colorado, USA, Vandermeulen and Huylenbroeck (2008) for Belgium, Xavier et al. (2018) for Portugal. Based on the analysis of 84 studies conducted in the United States, Asia, Africa, New Zealand and Australia, Rasmussen et al. (2017) identified unique indicators—180 environmental indicators, 65 economic indicators and 49 cultural/social indicators—for measuring AES. The study concludes that there is no ideal set of indicators that will represent all desired perspective of AES and suggested researchers to use the existing data and indicators for better alignment of different approaches.
The OECD Compendium of Agri-Environmental Indicators (AEIs) provides a set of 18 AEIs across 34 OECD countries from 1990 to 2010 (OECD 2013). Moreover, various organisations of the United Nations Economic Commission for Europe (UNECE) are preparing AEIs for Eastern Europe, Caucasus and Central Asia. The major indicators include fertiliser consumption, pesticide consumption, irrigation, energy consumption, agriculture land use, cropping and livestock pattern, gross nitrogen balance, agriculture ammonia emission, emission of methane and nitrous oxides and other GHGs, water abstraction, soil erosion and nitrates in water.
Different aspects of AES have been studied extensively for developed countries; however, literature specific to Indian context is sparse. Earlier Mukherjee and Kathuria (2006) and Mukherjee and Chakraborty (2009) constructed Environmental Quality Index (EQI) for Indian states to assess environmental quality for two time periods 1990–1996 and 1997–2004. These studies build three sub-indices—‘depletion and degradation of water resources’, ‘nonpoint source water pollution potential’ and ‘pressure and degradation of land resources’—which have some relations with AES. However, those studies have limitations in terms of coverage of indicators and period of analysis. Kareemulla et al. (2017) construct agricultural sustainability index based on 13 indicators for 2 years, viz., 2001 and 2011 and assesse performance of 19 Indian states. The study concludes that performance of states vary over periods. However, the study includes indicators like productivity of foodgrains (kg/ha), value of agriculture output (₹/ha, crops only), per capita income (₹/head), human development index (HDI) and female work participation rate (%), which are either outcome indicators (e.g., productivity of foodgrains, value of agricultural output, depletion of groundwater) or may influence adoption of sustainable agri-environmental practices (e.g., HDI index, per capita income, female work participation rate). In another study, Veluguri et al. (2019) assesse ecological sustainability of agriculture of 29 states based on 24 indicators. The study also includes outcome indicators (e.g., groundwater development, per cent of wells classified as ‘safe’, per cent of districts with nitrate concentration above permissible limits) and indicators selected for the study are not all pertaining to a single year but drawn from different years between 2011 and 2018. The study is single point assessment of state of ecological sustainability of agriculture across Indian states. However, state of AES is dynamic and changes over time and space.
State-specific studies exploring agricultural sustainability are also sparse in India. Ghosh and Chakma (2019) assess agriculture sustainability by considering interactions among land, water and energy in agricultural production systems at Bardhhaman district in West Bengal. The results indicate that increasing use of chemical inputs and specialisation of energy and water intensive crops are reducing sustainability of agriculture. Sajjad et al. (2014) explore agriculture sustainability in Bihar. The study indicates that improper management of resources, increasing population growth, natural calamities and increasing inequality are the major hurdles in achieving agriculture sustainability. The study by Hatai and Sen (2008) assesses agriculture sustainability in Orissa by using a composite index of ecological security, social equity and economic efficiency. In another study in Bihar, Sharma and Shardendu (2011) develop agriculture sustainability index with the help of 30 indicators. The study highlights the importance of soil quality, air quality, water quality, biodiversity, ecological literacy, population, intensity of agriculture and agricultural output, which are the major indicators contributing to the sustainability of agriculture.
Existing studies on AES of Indian agriculture have three major limitations. Firstly, both state-specific and cross-state studies consider specific time point(s) or period(s) for the assessment. Therefore, the exiting studies are not adequately capturing the dynamic aspects of AES by covering large period of analysis. Secondly, some existing studies include outcome indicators in the construction AES index and this is likely to impact the results. Thirdly, limited number of indicators is considered, and therefore the results of the exiting studies may not reflect the actual state of AES of Indian agriculture. The present article attempts to overcome the limitations of the existing studies by expanding number of indicators and covering a large period (1990–1991 to 2013–2014) of analysis. In addition, the present study validates the estimated AESI scores with the outcome indicators. Therefore, the present article is a robust estimation of AES of Indian agriculture and fills the gap in the existing literature.
Methodology and Data Sources
Sub-indices of Agri-environmental Sustainability Index (AESI)
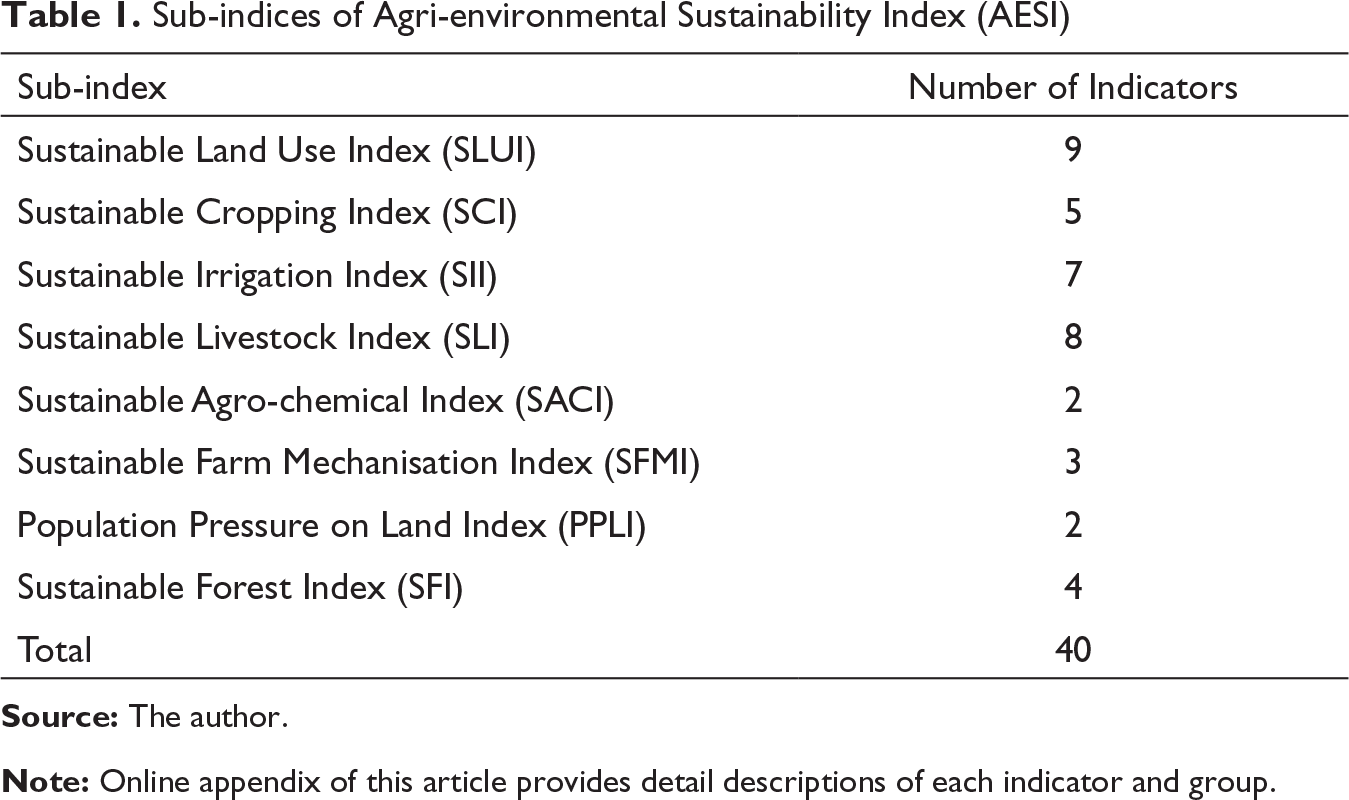
Each indicator has been re-scaled using appropriate scaling indicator keeping in mind diversity (heterogeneity) among states in their geographical area, size of the economy, size of the population, etc. (see online appendix for details). Since there is no performance benchmark (either national or international) available for the indicators, we have used the best performing state for each indicator as an ideal benchmark and standardised the indicators by the methods described below. Therefore, all estimates are relative estimates with reference to the best performing state for each indicator.
In line with the United Nations’ Human Development Index (HDI) method, the indicators are transformed into their standardised form, by which the normalised value of Xij (i.e., NXij) becomes
or
where X
ij
is the value of jth state with reference to ith indicator and
Now, AESIkj is score of the kth sub-index of AESI for the jth state (which constitutes of n number of indicators, n varies from 2 to 9 across sub-indices), and it is arrived at by averaging of NXij over i by using the following formula:
In the similar manner, AESIj, that is, the overall AESI score for the jth state, is derived by averaging the AESIkj over k by using the following formula:
The obtained AESIs are relative measure of agri-environmental sustainability (AES) of the states where equal weightages are given to each sub-index. The states with higher score in AESI (or any sub-index of AESI) having relatively higher AES. The obtained AESIj (where j = 1 to 17) leads to the ranks of the jth state, where states having higher score in AESIj get higher rank.
For a few indicators, data is available only for different time points. However, we have taken only those indicators that have at least three observations, and one of these observations falls within the boundary of our three sub-periods (1990–2000, 2001–2010 and 2011–2014). This analysis is based on the state level secondary information available in various published government reports and databases (see online appendix for details). There may be several other sources of data on Indian agriculture, but those are either not published regularly or not available for all States.
Results
Analysis of Rankings of States in AESI During 1990s
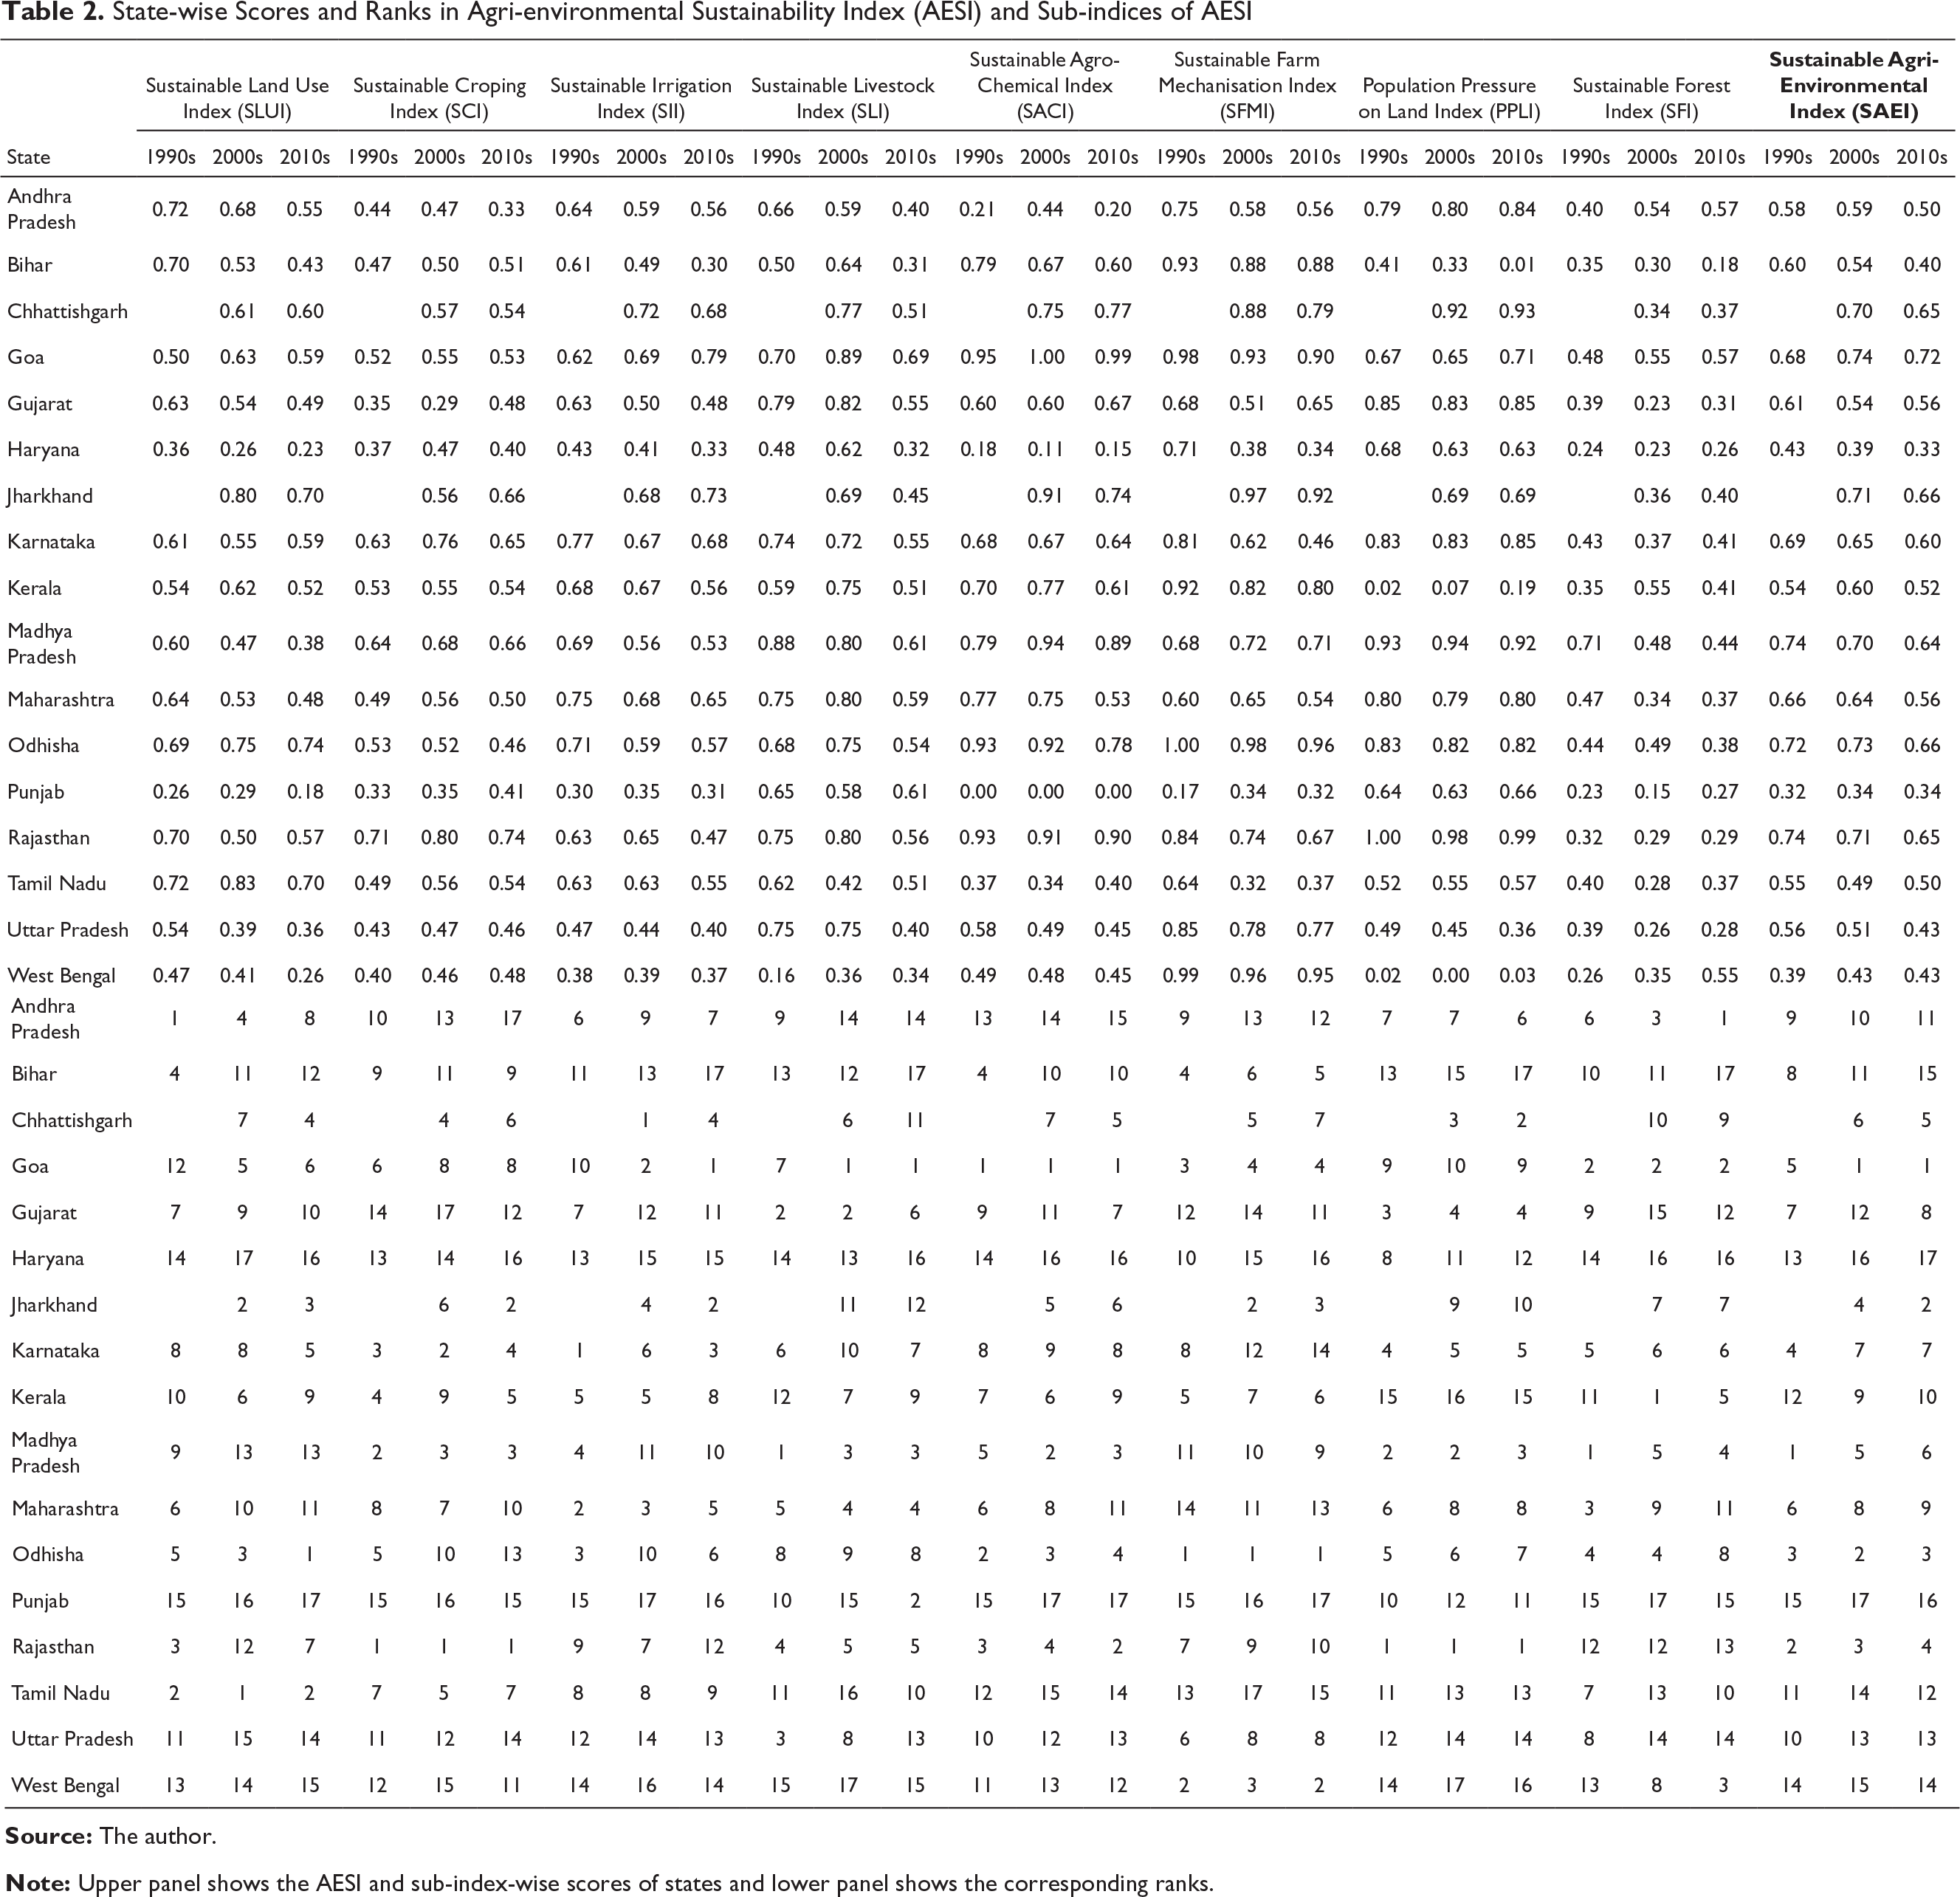
State-wise Scores and Ranks in Agri-environmental Sustainability Index (AESI) and Sub-indices of AESI
Rankings of States in AESI During 2000s
Except Andhra Pradesh (AP), Goa, Kerala, Punjab, WB and Odisha, performances of all other states have deteriorated during 2000s, as compared to 1990s. Performance deterioration is the most prominent for Gujarat, Bihar, TN and UP. During 2000s, Goa, Odisha, Rajasthan, Jharkhand, MP and Chhattisgarh are the six best performing states. Punjab, Haryana, WB, TN, UP and Gujarat are the worst performing states during 2000s. Punjab and Haryana continue to be the laggards. However, performances of Gujarat and MP have deteriorated during 2000s. Except in Sustainable Livestock Index (SLI), performance of Gujarat has deteriorated in all other sub-indices of AESI during 2000s. For MP, considerable fall in performance observed in SLUI and SII. Performance of Goa has improved considerably during 2000s as compared to 1990s.
Rankings of States in AESI During 2010s
Except Gujarat, Punjab, TN and WB, all other states have recorded lower AESI score during 2010s as compared to 2000s. Goa, Jharkhand, Odisha, Rajasthan, Chhattisgarh and MP are the six best performing states during 2010s. Haryana, Punjab, Bihar, WB, UP and TN are the six worst performing states during the period. Performances of Bihar, AP and Kerala have deteriorated considerably during 2010s. Except in Sustainable Cropping Index (SCI) and SFMI, performance of Bihar has deteriorated during 2010s in all other sub-indices of AESI. Performance of Gujarat has improved marginally during 2010s. The analysis supports the hypothesis of temporal variations in AES. Regular assessment of environmental sustainability of Indian agriculture is important to capture the dynamic aspects of AES.
Our analysis shows that Goa, Jharkhand, Odisha and Rajasthan maintain their AES consistently during the period of our analysis. However, performances of Karnataka and MP have deteriorated over the periods. Similarly, the performance of Chhattisgarh has improved during 2010s. For middle-order states (having rankings 6 to 10), deterioration in performance in AES is observed for Bihar, Gujarat, UP during 2000s. Though Gujarat has improved the performance during 2010s, the others could not. Haryana, Punjab, TN and WB are consistently lagging behind other states in AES. Performance improvement of Kerala during 2000s and deterioration of AP during 2010s are worthy to highlight. The analysis shows that temporal and spatial variation AES across Indian states needs to be captured to make any attempt to improve performance of states. There is no distinct factor specific to location (e.g., semiarid/arid vs. alluvial) or natural resource endowments (e.g., access to water/irrigation) of a state which is determining the performance of the state. For example, when Bihar and WB are laggards, neighbouring states Jharkhand and Odisha are doing well in AES. When Rajasthan is one of the forerunners in AES, Gujarat is a middle order state. Similarly, when Karnataka and Kerala are middle order states, TN is a laggard.
Sensitivity Analysis
To understand sensitivity of the constructed AESI scores with respect to agricultural intensity, we have tested the relationship between ‘state-wise average productivity of foodgrains (in kg/ha)’—as an alternative measure of agricultural intensity—and AESI score. Figure 1 shows that there is an inverse relationship between AESI score and average productivity of foodgrains across periods of analysis. However, measuring statistical strength of the relationship requires further research. This implies that states are achveing higher productivity of foodgrains at the cost of agri-environmental sustainability. Agricultural activities are the decision of individuals and they individually may not know that their activities are detrimental for long-run sustainability of agriculture. Studies show that environmental awareness, availability of agricultural extension services and sharing agricultural information with farmers may influence individual farmer’s decision to adopt agricultural best management practices to protect agri-environment (Mukherjee 2008).
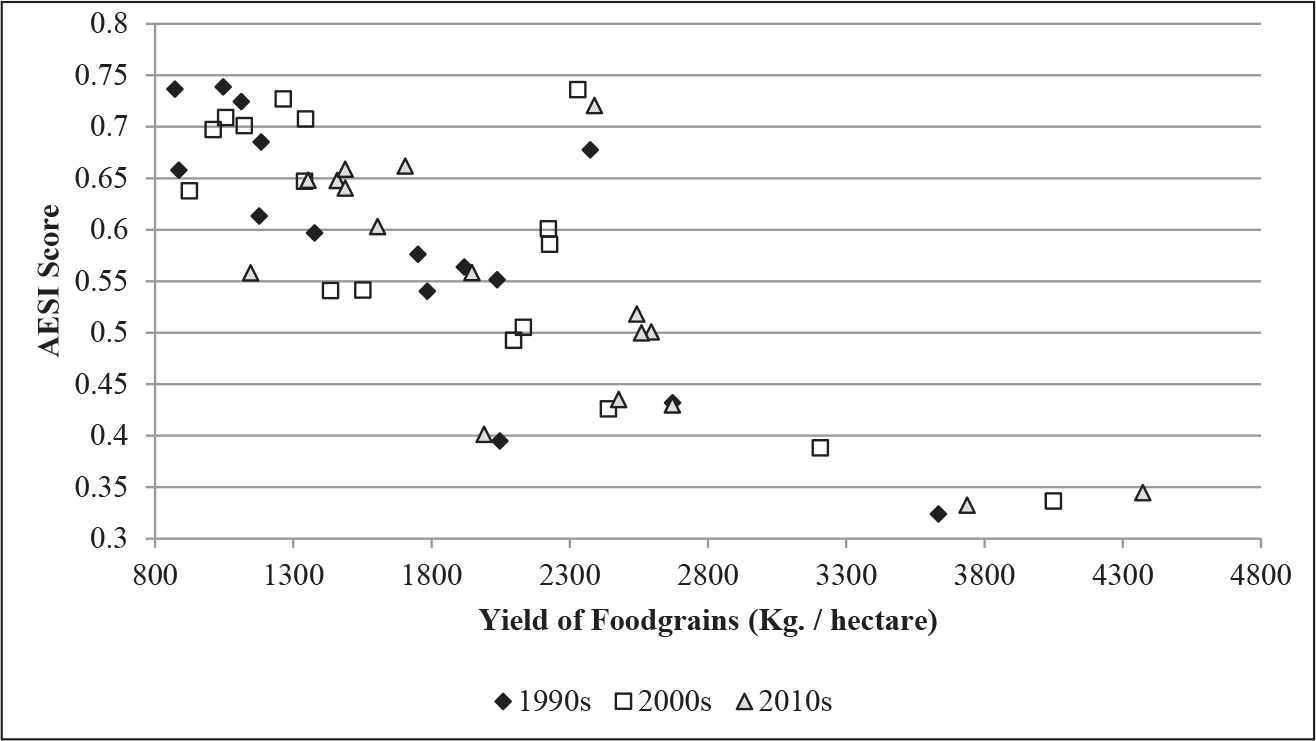
Relationship Between AESI Score and Agricultural Intensity
Agriculture is not just an economic activity for developing countries like India; it is source of food security and livelihoods. For populated country like India, self-sufficiency in food production is important for macroeconomic stability and overall economic development. To check whether there is any relationship between food security and AES, we have plotted AESI scores over ‘state-wise average share in India’s total foodgrains production’ in Figure 2. We found that there is an inverse relationship between the two for all the periods of our analysis. It implies that states having higher share in total foodgrains production also have lower AESI score. In other words, states that produce maximum foods are deteriorating their agri-environment. Decoupling food production from AES is a challenge not only for developing countries like India but also for developed countries (González de Molina et al. 2017; Yang et al. 2017). Therefore, better targeting of agri-environmental policies for states where maximum foodgrains are produced could help to achieve overall AES in India.
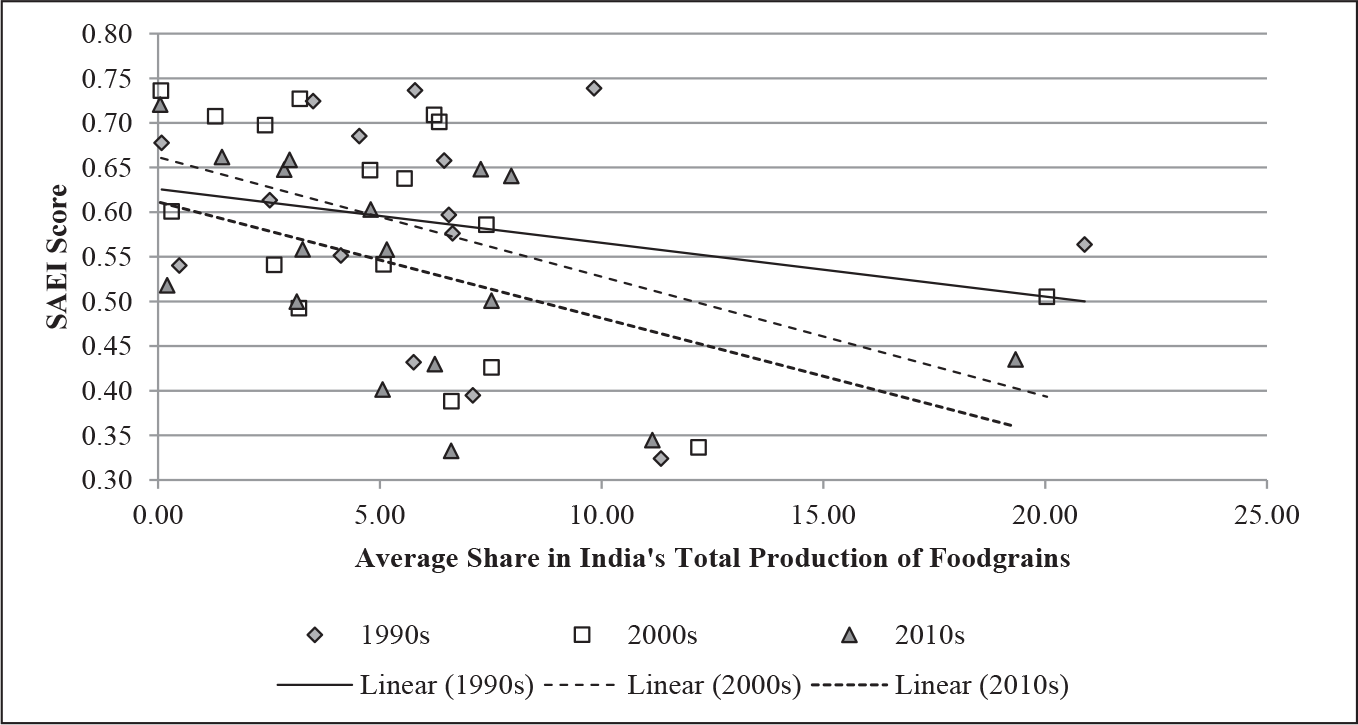
Relationship Between AESI Score and Average Share in India’s Total Foodgrains Production
Impacts of Agriculture on Environment
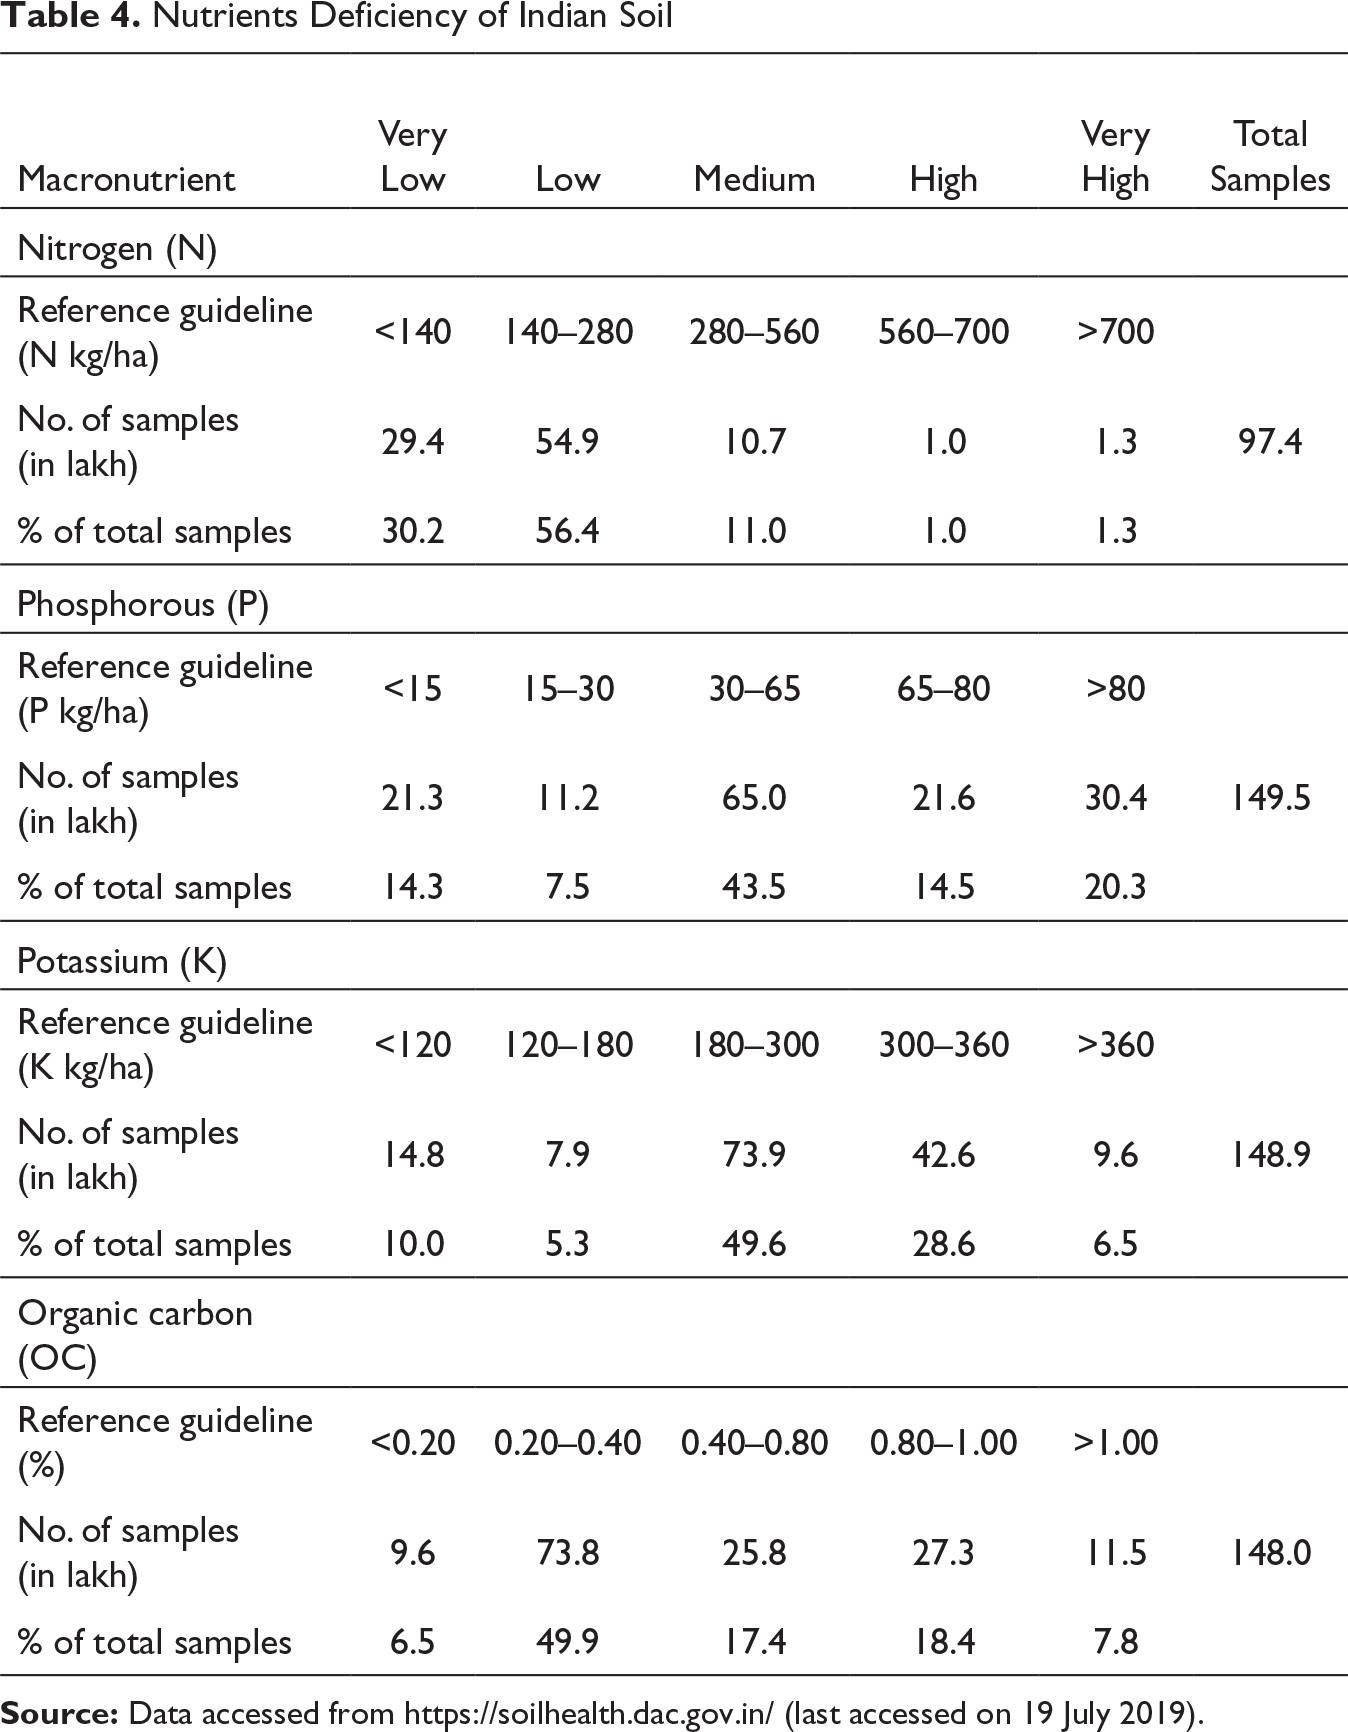
The impacts of agriculture on environment and natural resources are multi-dimensional. To validate whether the constructed AESI and sub-indices reflect reality with reference to existing evidences of agri-environmental impacts, we have considered groundwater depletion and depletion of soil nutrients.
Depletion of Groundwater
Decadal Changes in Groundwater Level in Major States
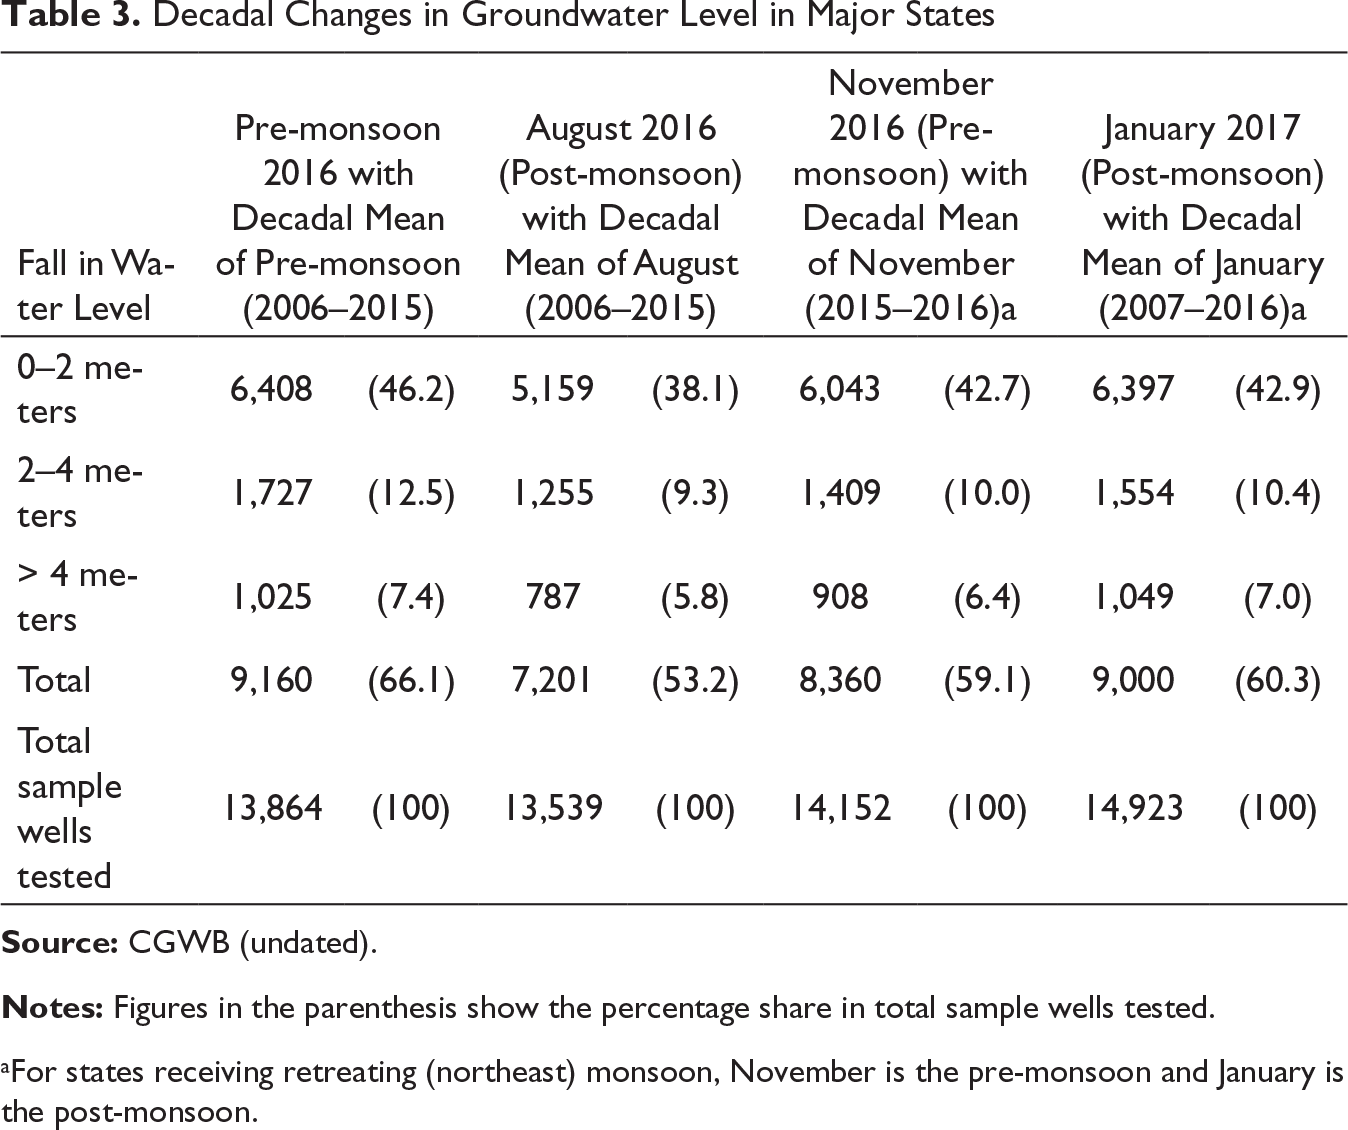
aFor states receiving retreating (northeast) monsoon, November is the pre-monsoon and January is the post-monsoon.
Depletion of groundwater is largely depends on agricultural withdrawal of water. Sustainable irrigation practices could help in sustainable management of groundwater resources. Figure 3 shows that states having higher score in Sustainable Irrigation Index (SII) are facing lower fall in groundwater level. This not only validates our methodology and selection of indicators for construction of SII but also supports the existence of a relationship between irrigation practices and groundwater management.
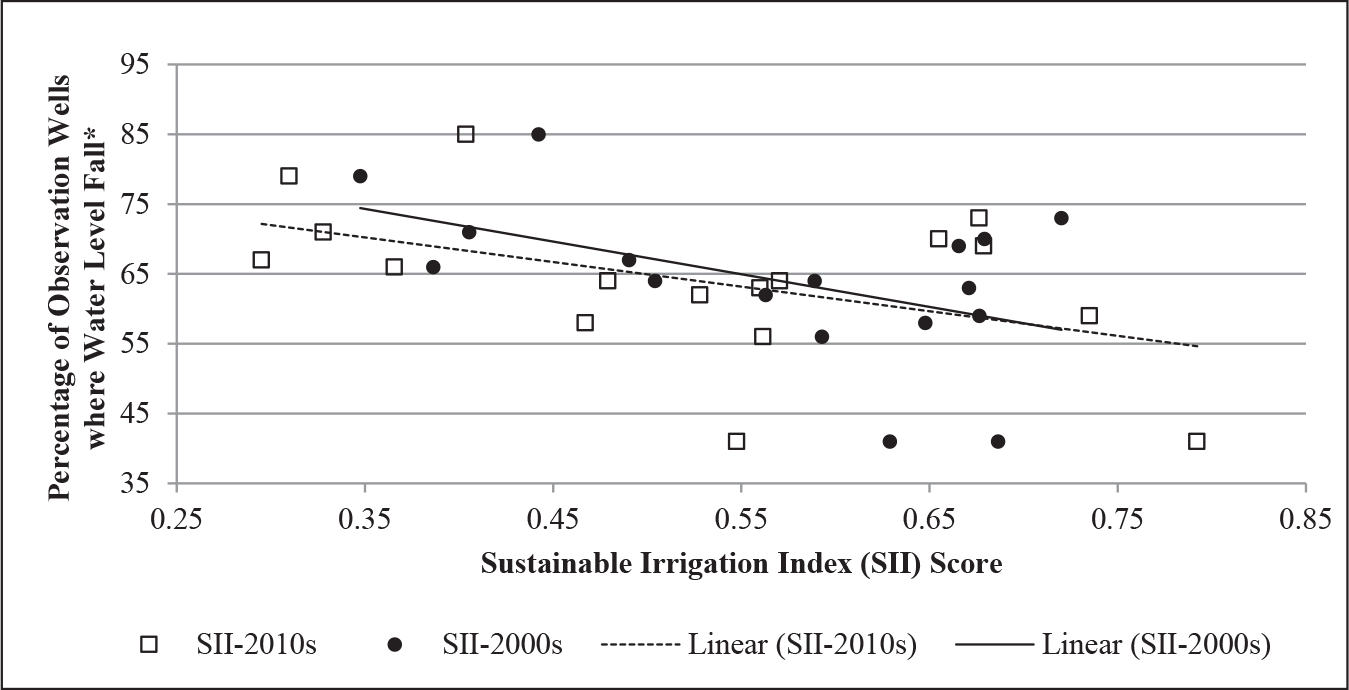
Relationship Between Sustainable Irrigation Index (SII) Score and Fall in Groundwater Level
Depletion of Soil Nutrients
Nutrients Deficiency of Indian Soil
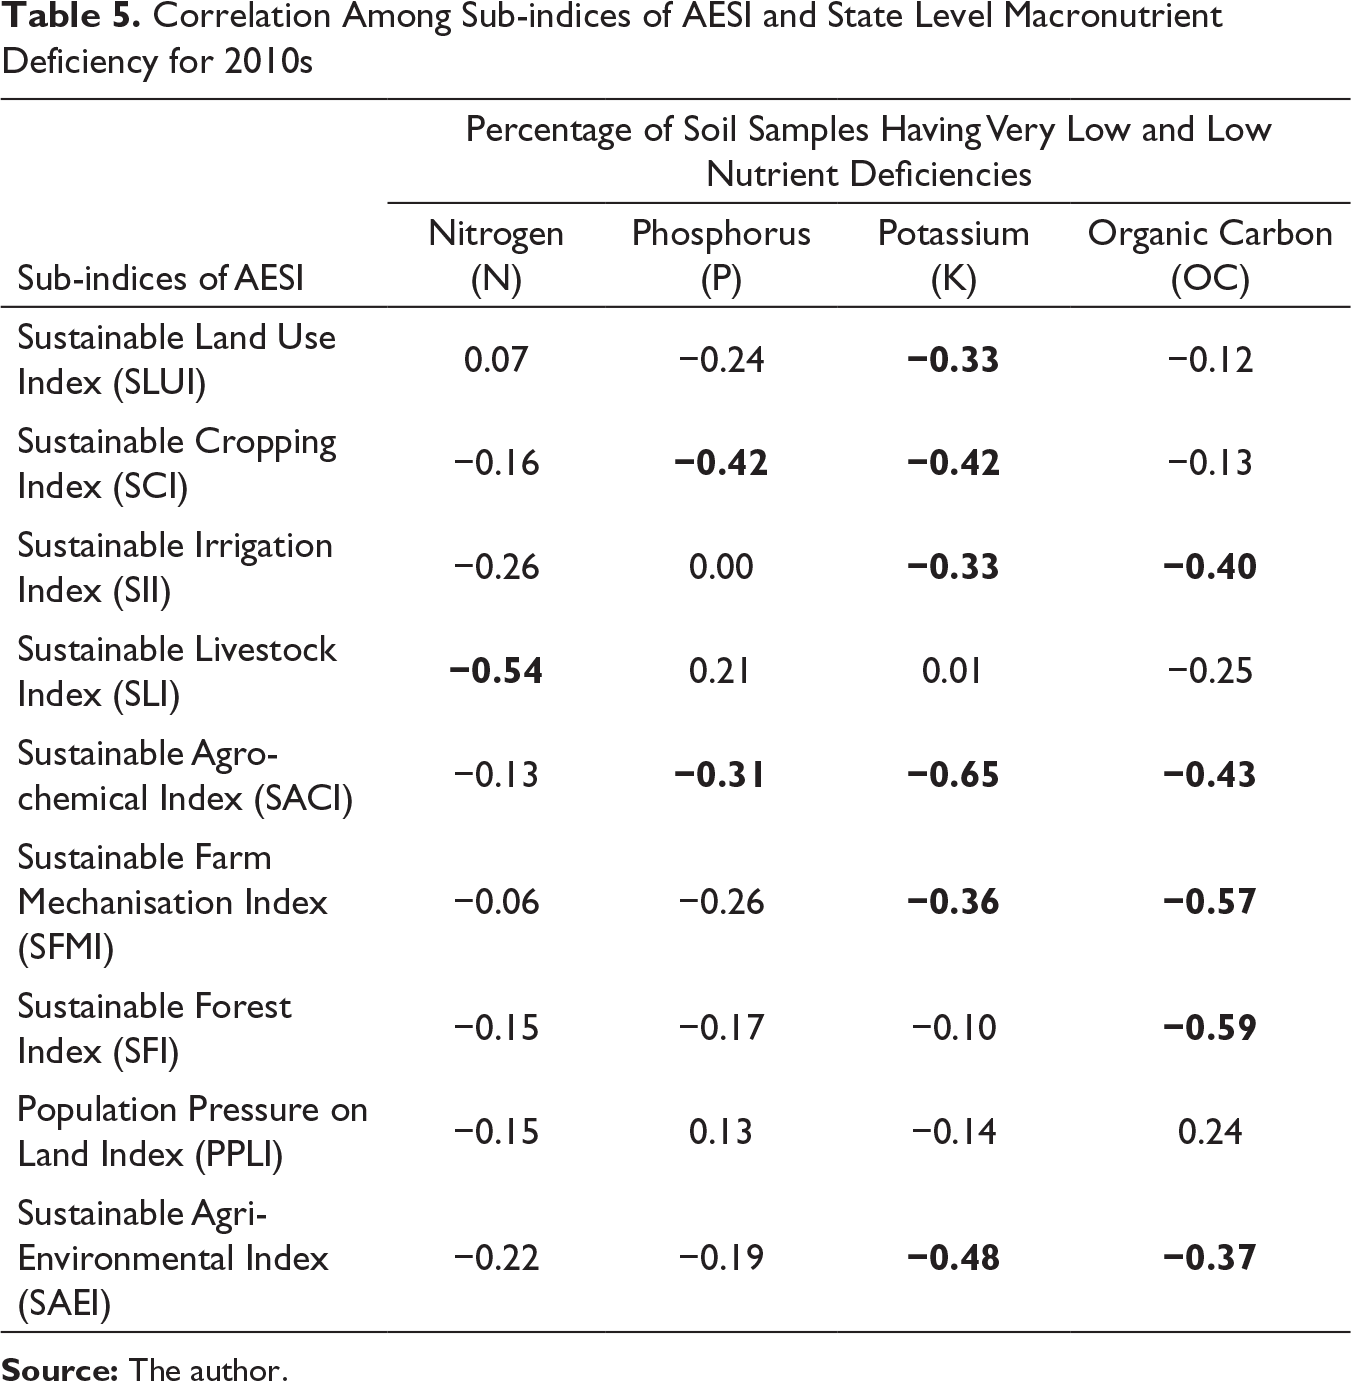
Correlation Among Sub-indices of AESI and State Level Macronutrient Deficiency for 2010s
Conclusion and Policy Suggestions
The results of the present study show that different states have different strengths and weaknesses in managing various aspects of AESI. Therefore, a comprehensive assessment of AES better reflects the reality than individual indicator based assessment. The analysis shows that temporal and spatial variation AES across Indian states needs to be captured by regular assessment of environmental sustainability of Indian agriculture to make any attempt to improve performance of states. There is no distinct factor specific to location (e.g., semi-arid/arid vs. alluvial) or natural resource endowments (e.g., access to water/irrigation) of a state which is determining AES of the state.
There is an inverse relationship between AESI scores and agricultural intensity (as measured by average productivity of foodgrains). It implies that states are achieving higher productivity of foodgrains at the costs of their agri-environmental sustainability. Growing intensity agriculture to meet demands for food, fibre and fodder results in stress on environment and natural resources. We find an inverse relationship between AESI score and average share of a state in total foodgrains production. Decoupling food production from AES is a challenge not only for developing countries like India but also for developed countries. Better targeting of agri-environmental policies in states where maximum foodgrains are produced may help in achieving overall AES in India.
States having higher score in Sustainable Irrigation Index (SII) are facing lower fall in groundwater level. There are many aspects of AES that impact soil health. We find that there are negative correlations across AESI sub-indices and macronutrient deficiencies. These findings not only validate our methodology but also selection of indicators for the construction of AESI.
It would be important to adopt ‘precautionary principle’ and include agri-environmental sustainability as an objective in overall policies/programmes of the government. Integration agricultural policies with environment, water and land use policies could be the first step towards achieving sustainability in Indian agriculture. Agriculture is the predominant user of freshwater in India. Pricing of irrigation water is a contentious political issue. In the absence of proper pricing and recovery of water charges, true cost of water is not reflected and as a result water use efficiency of Indian agriculture remains low. In addition, many states provide free/subsidised electricity to farmers (e.g., Punjab, Haryana), as a result cost of abstraction of water becomes zero. High reliance on groundwater-based irrigation system and over extraction of groundwater has resulted in fall in groundwater level in many parts of India. Proper pricing of irrigation water and electricity for agricultural uses may help to reduce stress on Indian water resources.
Union government provides subsidy on fertilisers (urea, phosphorous, potash, city compost). Approximately 66% of the annual subsidy on fertiliser goes to urea (indigenous as well as imported) and the rest to other farm nutrients. Farmers do not pay actual price of fertilisers and since the fertiliser subsidy policy favours urea over other nutrients. Therefore, unbalanced and overuse of urea lead to runoff and leaching of nitrates into surface water bodies and groundwater, respectively. Application of nitrogen (N) fertilisers by foodgrain crops accounts for 69% of total consumption of N-fertiliser in India, out of which rice and wheat consume about 61% (Prasad 2011). Average nitrogen use efficiency varies from 21% to 33% whereas agronomic efficiency value is 4–17 kg grain/kg N in rice-wheat cropping system (Prasad 2011). It implies that two-thirds of applied N-fertiliser is lost in the environment. Improving fertiliser management practices—for example, crop-specific application of fertilisers after soil tests could increase fertiliser use efficiency. Recovery and recycling of farm nutrients (e.g., farm yard manures) may help to reduce dependence on chemical fertilisers.
Existing studies show that improving environmental awareness, availability of publicly funded agricultural extension services and sharing agricultural information with farmers may influence individual farmer’s decision to adopt agricultural best management practices to protect agri-environment. Linking agricultural produces procurement policy of the government with green certification of agricultural produces may encourage farmers to adopt sustainable agricultural practices.
Agriculture, being the primary activity, particularly for a large populated country like India, remains the most important part of the economy, with direct impact on people’s livelihood. Therefore, finding out environmentally sustainable solutions requires detailed understanding regarding space and people, located in major parts of the country. In this context, the state wise analysis of agri-environmental sustainability may not be the first best method to capture the environmental impacts of Indian agriculture. However, given the data constraints this analysis cannot be extended beyond state level at this time. There are several state-specific factors/policies (e.g., economic, social, institutional, political) which influence AES of states. A single framework may not necessarily capture all dynamic aspects of AES. It is expected that future research will identify state-specific factors/policies influencing performance of states in AES. In this article, for simplicity, the AESI is computed by taking equal weights of eight sub-indices, and indicators are given equal weights within each sub-index. The assessment of exact weights of components and indicators of AESI can be considered as a part of future research.
Supplemental Material
Supplemental material for this article is available online.
Supplemental Material for Agri-Environmental Sustainability of Indian Agriculture: A State Level Analysis by Sacchidananda Mukherjee, in International Journal of Rural Management
Footnotes
Acknowledgements
Research assistance provided by Trisha Chandra and Shivani Badola is gratefully acknowledged. Comments and suggestions received from Professor U. Sankar, Professor Amita Shah, Dr Kaushal Garg, Associate Editor and anonymous reviewer of the journal helped me to revise the article substantially. Usual disclaimers apply.
Declaration of Conflicting Interests
The author declared no potential conflicts of interest with respect to the research, authorship and/or publication of this article.
Funding
The author received no financial support for the research, authorship and/or publication of this article.
Notes

References
Supplementary Material
Please find the following supplemental material available below.
For Open Access articles published under a Creative Commons License, all supplemental material carries the same license as the article it is associated with.
For non-Open Access articles published, all supplemental material carries a non-exclusive license, and permission requests for re-use of supplemental material or any part of supplemental material shall be sent directly to the copyright owner as specified in the copyright notice associated with the article.
