
Abstract
The prime objective of the study is to analyse and evaluate the financial performance of the FPCs in India. Financial ratios, trend analysis and grey relational analysis (GRA) were the tools used to achieve this objective. The present study analysed the financial performance of 83 FPCs in India from 2013–2014 to 2018–2019. The liquidity position of the FPCs was found to be above satisfactory levels. The solvency position of the FPCs was found to be improving as they were shifting from debt financing to equity financing. The efficiency and profitability positions of the FPCs were below par. Almost one-third of the FPCs were loss-making in 2018–2019. Using GRA, ‘Howrah Agro Producer Company’ from West Bengal was found to be the best performing FPC among the select 83 FPCs. The solvency position of the FPCs was found to have a strong positive association with the overall financial performance of the FPCs. The study also proposed financial ratio benchmarks for the FPCs using quartiles. The present study finally proposes to incorporate ‘second-class shareholders’ into the FPC model. These shareholders would have limited rights and voting power, and they would provide FPCs with capital, marketing channels and managerial support.
Keywords
Introduction and Research Motivation
Agriculture cooperatives in India were plagued with bureaucracy as the cooperatives acted as an extended arm of the government to implement its policies (Alagh Committee 2000). Post liberalisation in 1991, Indian agriculture also needed an institutional reform, where farmers and farmer organisations were given autonomy to operate and compete in the open markets (local, national as well as international). Consequently, in 1999, Y. K. Alagh Committee was set up to identify the shortcomings and revitalise Indian agriculture. In 2000, the Y. K. Alagh Committee proposed to corporatise the Indian agricultural sector. The Government of India approved the proposal in 2002 and incorporated ‘Producer Company’ into the Companies Act (Amendment), 2002, in 2003.
Initially, the (Farmer) Producer Company (FPC) concept did not receive much acknowledgement from either the bankers or the policymakers (Singh and Singh 2013). In 2011, NABARD, the apex bank for agriculture and rural development in India, launched the ‘Producer Organisation Development Fund’ with an initial corpus of ₹500 million for the promotion and formation of new producer organisations. Two additional funds under Small Farmer Agribusiness Consortium (SFAC) were launched in 2013–2014. A matching-equity fund of ₹1 million per FPC and a credit guarantee fund of ₹100 billion for the promoters were announced. In 2014–2015, the ‘Producers Development and Upliftment Corpus (PRODUCE) fund’ was launched for the promotion and formation of 2,000 new FPCs across the country. The fund sought to help the FPCs financially and in rendering creditworthy, economically viable and sustainable business enterprise. The Reserve Bank of India in 2015 also included FPCs under ‘Priority-Sector Lending’. Accordingly, banks such as State Bank of India, Vijaya Bank, Punjab National Bank, etc., and even non-banking financial companies (NBFCs) such as Samunati Ltd., NEDFi Ltd., Assam Finance Corporation Ltd. and many more are now financing FPCs with long-term as well as short-term working capital funds.
In the budget speech of 2018–2019, the then Finance Minister, Arun Jaitley, particularly emphasised on incorporation, promotion and development of Farmer Producer Organisations (FPOs), along with village producer organisation and women self-help groups. The focus was primarily on organic farming; therefore, ‘Operation Green’ was also launched to promote FPOs operating in products such as tomatoes, onions and potatoes. The FPCs/FPOs were also fully exempted from income tax for 5 years from the financial year 2018–2019. Thus, from these developments, it could be deduced that, lately, the Indian government has been giving enough significance to FPCs for agriculture as well as rural development. On the other hand, their performance as corporate entities has been shrouded to a great extent. Most of the studies found on the FPCs were generally case studies or conceptual or theoretical studies (Prasad and Prateek 2019). Studies such as NRAA , Aditya , Chauhan , Nayak , Kanitkar , Venkatesan et al. and Kakati and Roy identified problems related to the scarcity of working capital, weak capital base, poor profitability, etc., among the select FPCs. These studies were descriptive and cross-sectional research with relatively small sample size (average 10 samples per study) and limited geographical scope. Although they make a valuable contribution to the existing body of literature on the financial performance of the FPCs, their findings cannot be generalised to the FPCs in other parts of the country. Therefore, to profoundly understand the financial position of FPCs over time, a nationwide financial performance analysis is needed with a larger sample size. The financial performance analysis would also provide an answer to whether the billions of rupees infused into the FPC model by the Government of India has resulted in the emergence of profitable FPCs or not. It would also assist the policymakers as well as stakeholders to develop tailor-made financial policies and plans for FPCs to achieve better financial performance.
Financial ratio is the most common tool to analyse the financial performance of a firm (Hamzaçebi and Pekkaya 2011). Financial ratios summarise large quantities of financial data into meaningful information (Hamzaçebi and Pekkaya 2011). Moreover, they help in effectively understanding the financial performance of a business and compare it with peers within and across the industries. The present study also aims to evaluate the FPCs on their financial performance, using financial ratios as multiple criteria, and one such tool that is widely used in a similar situation is GRA (Inani and Gupta 2017). GRA is a user-friendly tool that provides users with a systematic approach to relatively evaluate a set of samples in case of multiple criteria decision-making. The GRA is a part of grey system theory, proposed by Julong Deng of Huazhong University of Science and Technology, China. The grey system theory defines a situation with no information as black; alternatively, a situation where complete information is available is defined as white. These are idealised situations, and their occurrence in the real world is seldom. In the real world, usually, partial information or dispersed information is available. This partial or dispersed information is defined as grey information. Thus, GRA operates in these grey areas, where there is no complete information.
Literature Review
There is a paucity in the literature available on the financial performance of the FPCs. Prasad and Prateek conducted an annotated bibliographical study, compiling 72 studies in the area of FPOs. The study mostly found case studies and conceptual reviews on the FPC model, but none of the studies was dedicated to the financial performance of FPCs in India. The present study found that, initially, conceptual studies such as Dwivedi and Joshi , Singh, Mahajan , Trebbin and Pradhan and NRCRL , discussed the challenges and opportunities of FPCs for farmers and rural development. These studies emphasised on the legal concerns of the FPCs and focused on their promotion. They compared the FPC model with the cooperative model on the legal and the organisational structure and advocated how the FPC model was better than the cooperative model (Singh 2008). Sharma observed that policy support is important to improve sustainability, market access as well as mitigate risk. Shah observed that the FPC model was better than the cooperative model but was plagued with similar problems. The study suggested that FPCs should emphasise on member centrality, patronage centrality and domain centrality. Ganesh found Shah to be controversial and observed that the dairy business model was inherently more profitable than the agriculture business model; thus, FPCs involving agriculture could not be compared with dairy cooperatives.
Case studies such as NRAA , Pustovoitova , Puznak and Cegys, Sankri and Ponnusamy , CIKS and FWWB and Trebbin and Hassler focused on promoting institutions, financing options and problems, technical aspects, management and marketing of the FPCs, etc. These studies primarily focused on the incorporation process and hurdles faced to attract farmers into the FPCs, governance of the FPCs like selecting leaders and board members, implementing by-laws, conducting meetings, etc., and the functioning such as identifying supply chains, marketing strategies, procuring inputs, availing and utilising credit, etc. Cherukuri and Reddy observed that FPCs in Uttarakhand and Kerala have successfully improved their member’s income, market access and bargaining power. Dey conducted three case studies and identified few determinants of financial and non-financial performance and viability of FPCs. These determinants were leadership, managerial skills, competitive advantage, financial and technical support from resource institutions, management of earnings and accounting policies. Other studies carried out by Deka et al. identified the key challenges faced by the FPCs such as inadequate training, inadequate organisational skills and incompetent management, and also suggested ways to improve the supply chain of the FPCs.
Eventually, only a handful of the studies were found on the financial performance of FPCs of India. Garg analysed the financial performance of Rewa Crop Producer Company Private Limited using financial ratios and Garrett’s ranking technique and found that only the liquidity performance was at satisfactory levels. The study found that the FPC’s liquidity position was satisfactory, while efficiency and profitability positions were non-satisfactory. The study attributed high inventory levels and lack of working capital as the primary reasons for low profits. Singh and Singh studied 24 FPCs from the west and central India and found that not only was the financial performance of the FPCs poor, but there was also a lack of genuine FPCs. The study revealed problems such as lack of credit and funds, incompetent management, poor profitability and turnover, etc. The study found that many of the FPCs were not owned and controlled by farmer-producers; rather, the big businessmen and professionals owned and controlled them. Chauhan studied the financial performance of 18 FPCs in Madhya Pradesh (central India). The study used sales and net profit data and concluded that the financial performance of the FPCs in Madhya Pradesh was below par. The study also attributed the poor performance to the unavailability of funds and poor management. Kakati and Roy studied the financial performance of four FPCs from northeast India and found that only the liquidity position of the FPCs was at par, and other measures such as solvency, efficiency and profitability were below par. Chauhan and Murray studied the financial performance of six FPCs from south India using financial ratios and found similar results to Kakati and Roy and Garg. Mourya and Mehta used trend analysis to assess the performance of five FPCs of Gujarat (western India) from 2016–2017 to 2019–2020 and found none of them profitable. The study was descriptive and only focused on total earnings and total profits but not on the overall financial performance. Thus, the literature on the financial performance of the FPCs incorporated in various regions of the country concludes that the FPCs performed very well in terms of liquidity but poorly in terms of solvency, efficiency and profitability. The studies found were descriptive and were conducted using cross-sectional data with a small sample size and limited geographical scope. The average sample size in these studies was around 10 samples. The samples in the studies ranged from 1 to 24 samples. The select FPCs in these studies were selected from the western, central and southern regions of India. Therefore, these important findings on the financial performance of the FPCs could not be generalised to other FPCs across the country. Thus, the present study attempted to fill this gap by conducting a nationwide study with a large sample size.
Methodology
The primary objective of the study is to analyse and evaluate the financial performance of the FPCs in India. To achieve this objective, only the active FPCs that had published their financial statements with the Registrar of Companies (ROCs) from 2013–2014 to 2018–2019 were selected (Kakati and Roy 2017; 2018; 2019). Initially, in a census study, all the active 364 FPCs incorporated before 31 March 2013 were selected as the sample for the study from 17 Indian states and 2 union territories. Subsequently, it was found that only 83 FPCs (from 14 states and 1 union territory) had published sufficient information about their financial statements from 2013–2014 to 2018–2019. A total of 18 financial ratios were used. Four liquidity ratios, five solvency ratios, four efficiency ratios and five profitability ratios were used to analyse the trends over the years. Trend analysis was used to analyse the financial performance of the FPCs over the six financial years. GRA is a popular tool to evaluate business financial performance, especially industry performance. Relative performance measures like GRA helps researchers to account for the hidden or unobserved variables like management quality, product innovation, etc. (Dawkins et al. 2007). To compute the GRA, the following steps were undertaken:
The 18 financial ratios were assimilated into a decision matrix:
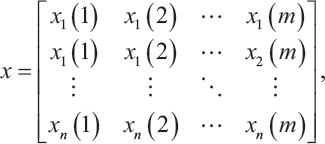
where
x i(j) = value of ith sample corresponding to jth indicator (financial ratio).
The x i(j) is normalised into x* i(j):
For larger the better,
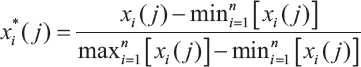
For smaller the better,
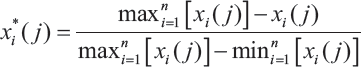
where
i(j) = the value of the jth indicator,
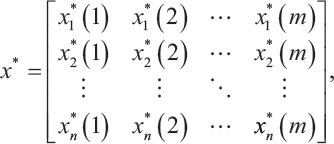
The normalised data matrix is as follows:
The reference value, that is, x0 (j)* could be determined as follows:

The reference value is the maximum value of x*i (j), which is normally 1. Thus, the reference value could also be defined as follows:
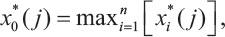
where
x*0 (j) = the reference value for the jth indicator.
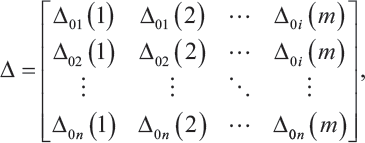
To prepare the difference matrix, the absolute value is derived from subtracting the ‘normalised value’ of the jth indicator from the ‘reference value’. Thus, to calculate the absolute value, the above-mentioned statement can put into the following equation:
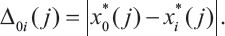
After the calculation of the absolute value,
The coefficient value generally falls between 1 and 0. The grey relational coefficient can be derived using the following equation:
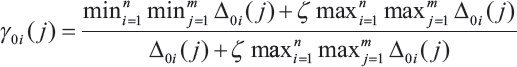
where
The symbol ‘ζ’ is described as the distinguishing coefficient. In case there is a huge variation, the ζ also helps in minimising the effect of large
After calculating the grey relational coefficient, the next step is to calculate the GRG.
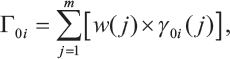
where
w(j) = weights assigned to the indicators, if any.
The FPCs were then ranked using the GRG for each year. It was observed that the negative values and outliers had a significant impact on the results of GRA. Hence, FPC-years with negative values in the solvency ratios were removed, and outliers were tackled using winsorisation at 10%. Median and quartiles are one of the most preferred tools to prepare benchmarks or grades for financial ratio performance (Risk Management Association 2019; Schmidgall and DeFranco 2004; Zafra-Gómez et al. 2009). Thus, they were used to prepare financial ratio benchmarks for the FPCs. These benchmarks could help stakeholders to compare FPCs with the industry performance.
Analysis and Discussion
Showing Descriptive Statistics and Financial Ratio Benchmarks (quartiles).
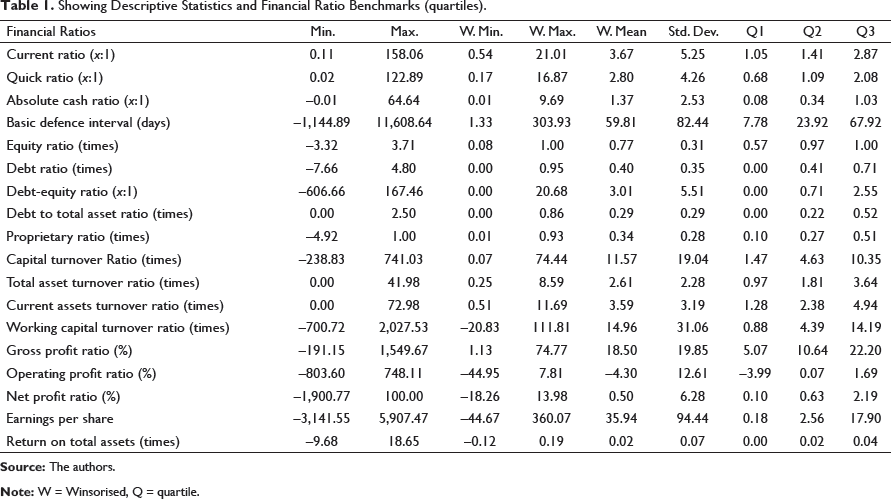
The descriptive table (Table 1) shows that the original data set contains extreme values, and the financial ratios were also not normally distributed. Thus, they were winsorised at 10%, and median values of the ratios were used in the trend analysis. One of the most important contributions of the study to the existing body of knowledge is the financial ratio benchmarks (Q1, Q2 and Q3 in Table 1). These benchmarks were computed, using quartiles of the financial ratios (Risk Management Association 2019). All the financial ratios could be considered as ‘larger the better’ with the exception to debt ratio, debt-equity ratio and debt to total assets ratios. These three ratios should be considered ‘lower the better’ as higher debt increases financial risk in the business.
Financial Ratios and Trend Analysis
In this section, the financial performance of the FPCs was analysed using financial ratios and trend analysis.
Liquidity Ratios
Liquidity ratios measure the near-term solvency of a business.
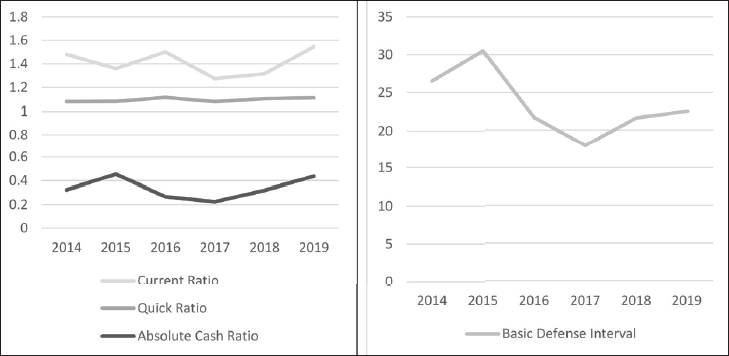
Generally, the median current ratio and quick ratio were well above 1:1, indicating that most of the FPCs were capable of repaying their current obligations. In 2015–2016, a divergence was observed between the median absolute cash ratio and other liquidity ratios. It could be attributed to the inefficient conversion of inventory and receivables into cash. In 2016–2017, there was a sharp decline in the current ratio as compared to the quick ratio, thus, indicating a decline in the amount of closing inventory of the FPCs. The declining inventories, declining cash reserves and stable quick ratio indicate that there was an increase in trade receivables (debtors). However, post-2017–2018, the liquidity position of most of the FPCs significantly improved. In 2018–2019, it could be observed that the median current ratio and median absolute cash ratio were exponentially rising, while the median quick ratio was relatively flat. The increase in closing inventory indicates that the FPCs were not able to achieve their sale targets; thus, it could conclude that in 2018–2019, the FPCs faced operational difficulties. The increase in cash reserves also indicates that idle cash was building up with the FPCs. The decrease in trade receivables complements the increase in closing inventory as it also signifies that the sales slowed down in 2018–2019. Alternately, some analysts could also assume that debtors of the FPCs paid their dues to the FPCs, which resulted in a decrease in receivables and an increase in cash reserves. The median basic defence interval conveys a similar story, as it has declined over the years, which suggests that the ability to survive without any external support in case suddenly the sales revenue ceases (e.g., Coronavirus Disease 2019—COVID-19 pandemic lockdowns) is diminishing. The number of days for which the FPCs can cover their cash expenses with no sales revenue has decreased from 26 days in 2013–2014 to 17 days in 2018–2019. The trends in liquidity ratio is shown in Figure 1.
Solvency Ratios
Solvency ratios measure the business long-term solvency position. These ratios facilitate the assessment of long-term stability and the capital structure of a business.
Over the years, the number of debt-free FPCs has reduced from 25% to 20%. The number of FPCs with positive shareholders’ fund and debt in their capital structure had also declined from 84% in 2016–2017 to 81% in 2018–2019. Interestingly, the FPCs with negative shareholder’s fund and debt in their capital structure had increased from 8% in 2016–2017 to 11% in 2018–2019. The banks and lenders must make a note of the situation and scrutinise the borrower-FPCs to avoid NPAs.
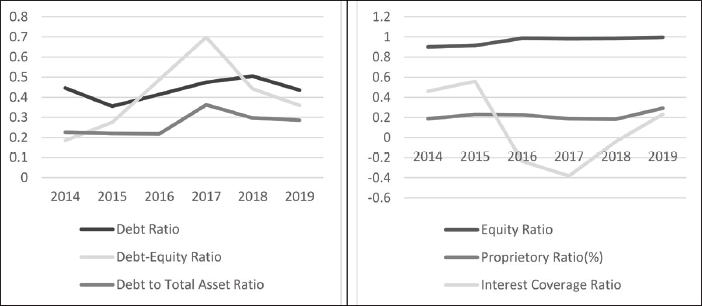
The median equity ratio of the FPCs was found to be extremely high. From 2015–2016 to 2018–2019, the proportion of equity in capital employed (median) was near to 1. Simultaneously, the median debt to equity ratio suggests that although the proportion of debt had decreased, it was around 0.3 to 0.4 times of equity. The ratios conclude that most of the FPCs now preferred equity over debt. The divergence between the median debt ratio and debt to equity ratio signifies that in 2014–2015, the number of FPCs with higher ‘net assets’ and lower ‘shareholder’s fund’ had increased. This indicated that the number of FPCs with large debt in their capital structure had increased during the period. According to the trends in median debt to total assets ratio and proprietary ratio, it could be observed that since 2016–2017, a significant number of FPCs had reduced their dependency on debt and shifted towards equity financing. Overall, it could be observed from the trend in solvency ratios that the FPCs in India were trying to reduce their risk by shifting from debt financing to equity financing. Another way to interpret this is that there is a possibility that financial institutions were not willing to lend money to these FPCs as pointed out by Garg , Singh and Singh and Chauhan. Few reasons for not lending the FPCs could be information asymmetry, lack of collateral, previous experience of fund mismanagement, etc. (Myers and Majluf 1984; Prabhakar et al. 2012; Rajan and Zingales 1995). The trends in solvency ratios is shown in Figure 2.
Efficiency Ratios
Efficiency ratios measure the efficiency with which the business manages and utilises its assets and resources to generate revenue from its operations.
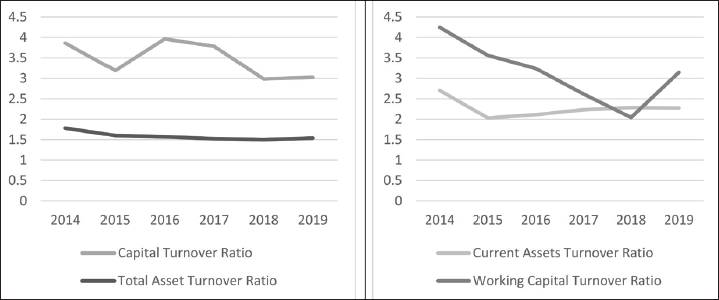
The trends in median efficiency ratios raise serious questions on the operations and the efficiency of the FPCs in India. The efficiency ratios were in a downward trend. This signifies that the ability to generate sales of capital and assets has diminished over the years. It was evident from the efficiency ratios that most of the FPCs’ performance had declined. The median revenue of the FPCs was found to have increased over the years. Hence, the increase in the capital, total assets and working capital with higher momentum could be the reason behind the falling ratios. The trends in the efficiency ratios is shown in Figure 3.
Profitability
These ratios are generally known as the bottom-line ratios, as these ratios deal with the business’ profits and earnings.
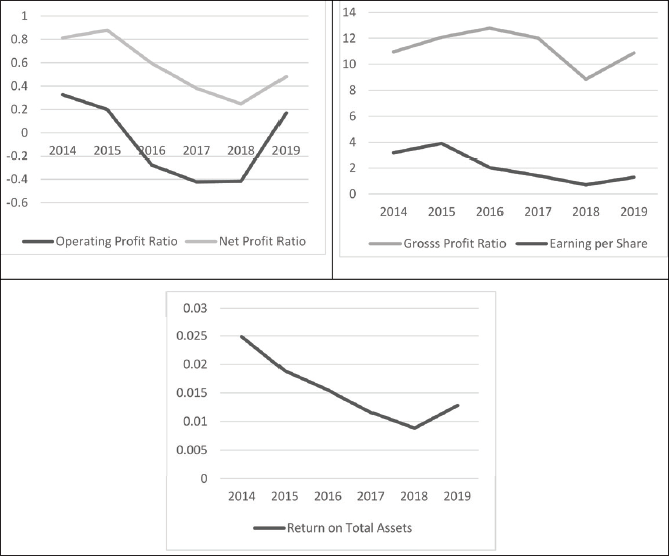
The profitability ratios were found to be downward trending. Therefore, the profitability performance of the industry could be considered as below par. From 2015–2016 to 2017–2018, the median operating ratio (negative) indicated that most of the FPCs were not able to cover their operating cost with their operating revenue. Even though there was a 20% decline in the median revenue from operations in 2018–2019, the profitability ratios showed an improvement over the previous financial years. The median cost of goods sold also decreased by 21% in 2018–2019, while the median finance cost decreased by 32%. These figures led to the sudden surge in median gross profit ratio, net profit ratio and operating ratio in 2018–2019. The median return on total assets and earnings per share were also found to be trending downward. The trends in the profitability ratios is shown in Figure 4.
Grey Relational Analysis
Showing the Top-Ranked and Bottom-Ranked FPCs for Each Financial Year.
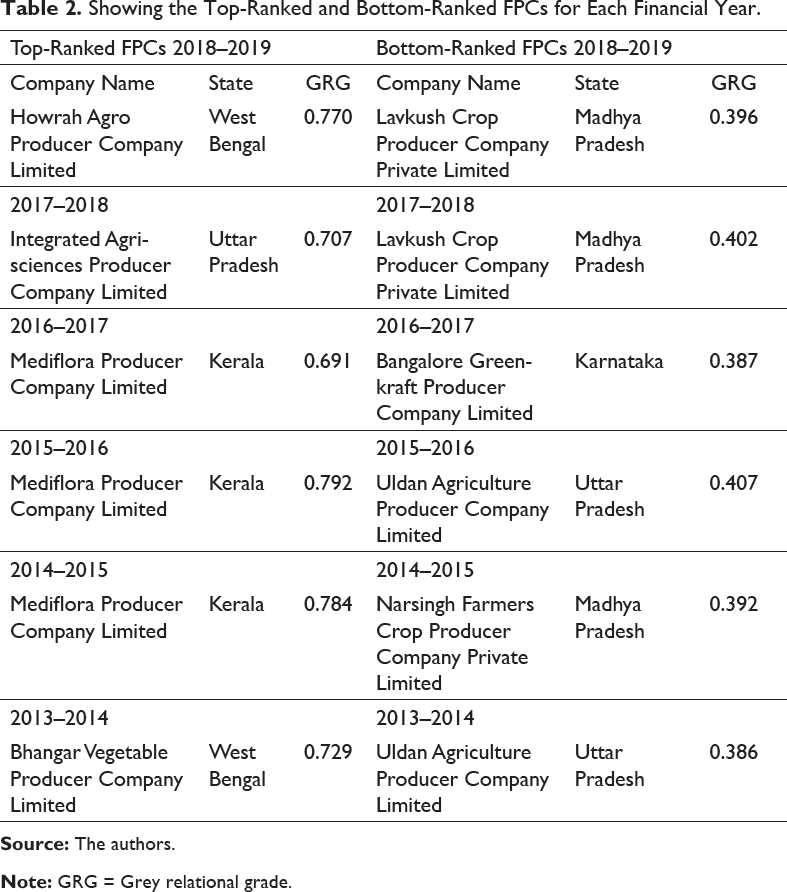
Over the years, Howrah Agro Producer Company from West Bengal had the highest average GRG among the select FPCs. Thus, it could be considered as the best FPC in India, followed by Mediflora Producer Company Limited from Kerala and Integrated Agrisciences Producer Company Limited from Uttar Pradesh. On the other hand, Uldan Agriculture Producer Company Limited from Uttar Pradesh was found to have the lowest average GRG, followed by Narsingh Farmers Crop Producer Company Private Limited and Lavkush Crop Producer Company from Madhya Pradesh. The mean performance (GRG) of the FPCs in the eastern region was found to be better than the mean performance of FPCs in other regions, while the mean performance of FPCs in the northern region was found to be the worst as compared to other regions. It was also observed that the mean performance of FPCs involved in trading (retail and wholesale) was better than those involved in the manufacturing and agriculture, forestry and the fishing sector.
Showing Spearman Rank-Order Correlation.
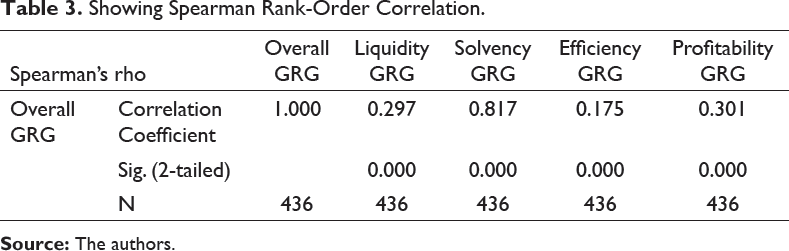
Table 3 shows that there is a very strong positive correlation between overall financial performance and solvency performance. Other individual performance measures were found to have a low correlation with overall financial performance. FPCs in India should focus on variables such as equity ratio, debt ratio, debt to equity ratio, total debt to total asset ratio and proprietary ratio to improve the overall financial performance.
Discussion, Major Findings and Suggestions
The overall financial ratio trend analysis signified that the financial performance of the FPCs was below par. Before 2016–2017, the median liquidity position of the FPCs was found to be declining; on the contrary, post-2016–2017, the liquidity position improved significantly. The median basic defence interval of the FPCs was just 17 days, while 28% of the FPCs’ basic defence interval was less than a week. Thus, this could cause survival issues during extraordinary events such as the COVID-19 pandemic. It was found that most of the FPCs were capable of honouring their current liabilities, using their current assets without depending on the sales of their inventory. The median long-term debt of the FPCs declined by 75% from 2013–2014 to 2018–2019. In 2018–2019, the median long-term debt was merely ₹21,120. Although the overall median total debt (non-current liabilities + short-term liabilities) increased by 124% over the past 6 years, it declined from 2016–2017 to 2018–2019 by 28%. The number of debt-free FPCs declined from 24% to 17% during the period from 2013–2014 to 2017–2018, and then in 2018–2019, the number increased to 23%. A total of 8% of the FPCs remained debt-free for all the 6 years of the study. The number of FPCs with negative shareholders’ fund increased from 14% in 2013–2014 to 19% in 2018–2019. The study also found that the number of FPCs with negative shareholder’s fund and debt in their capital structure had also increased over the years.
The efficiency position of the FPCs was below par as the trends were in a downwards direction, indicating poor management of assets by the FPCs. The profitability ratios also trended downwards. The situation looked grim as the shareholder dropouts increased in 2018–2019. As on 31 March 2018, there were 284,768 shareholders in the 83 select FPCs of India, it reduced to 273,048 shareholders as on 31 March 2019. The number of loss-making FPCs has continuously increased since the period from 2013 to 2014. In 2013–2014, 19% of the FPCs were loss-making entities, and in 2018–2019, 31% were loss-making entities. Profitability has been a major concern for the FPCs. Poor profitability over many years has been the principal reason behind diminishing shareholders’ funds in most of the FPCs.
In 2016–2017, the demonetisation of Indian currency was suddenly announced, and in the same year, the median shareholders’ funds declined by 17%. This signifies that demonetisation destroyed 17% of the shareholders’ (farmers) wealth. The median total debt of the FPCs increased by 137% and the finance cost (interest) increased by 228%. Another effect of demonetisation was that it pushed the FPCs towards indebtedness. Although the median number of shareholders increased by 12% in the year, the cost of goods sold (procurement from farmers) merely increased by 2%, and the median closing inventory increased by 17%. The increase in the median closing inventory suggests that most of the FPCs could not meet their budgeted sales target during the year. Moreover, the median trade receivables (debtors) of the FPCs also increased by 104%. This signifies that the debtors were not in a position to honour their obligations during the year. The median net profit of the FPCs also declined by 28% in 2016–2017.
The findings of the present study were similar to that of Garg , Chauhan , Kakati and Roy and Chauhan and Murray. Nevertheless, the study concludes that the poor financial performance of FPCs is not a regional phenomenon or is related to a few states; rather, FPCs all across the country had performed poorly. This study could be used as a baseline by the policymakers and researchers to design new tailor-made policies and schemes according to the needs and attributes of the FPCs. Recently, the Indian government introduced two new funds for the promotion, development and formation of new FPCs all across the country. Under the central sector scheme of 2019, a matching-equity grant of ₹2,000 per farmer-member was announced, with a maximum threshold of ₹1.5 million per FPC. Under the central sector scheme, a credit guarantee scheme of ₹20 million per FPC project was also announced for promoting agencies and non-governmental organisations (NGOs). The central sector schemes aim to promote and incorporate 10,000 new FPCs in the next 5 years. Another fund was introduced in 2020, the ‘Agriculture Infrastructure Fund’ with a corpus of ₹1 trillion. Under this fund, FPCs, agripreneurs, NGOs, self-help groups, etc., could avail the funds in the form of long-term debt finance. The study made fairly sufficient arguments and put forth enough evidence that the previous measures by the government did not have any significant impact on the financial performance of the FPCs. Problems such as diminishing ability to earn profits, diminishing shareholders’ fund and inability to service finance cost were also observed. With the present scenario, the central sector scheme would be welcomed by FPCs as it provided FPCs with equity financing. On the contrary, Agriculture Infrastructure Fund, which is a debt financing scheme, might not get popularity among the FPCs. Repaying of principal and interest amount would be very difficult for the loss-making FPCs. They might also create large NPAs for the banks. The study evidently found that FPCs preferred equity financing over debt financing, and among the debt financing options, they generally preferred short-term debt over long-term debt. To what extent the ‘Agriculture Infrastructure Fund’ was useful for the FPCs would be something engaging for future researchers.
The stimulus packages might not be that useful as an institutional reform in the structure and functioning of the FPCs could be. The study proposes for the policymakers to introduce the ‘second-class shareholders’ concept in the FPC model, where the ‘second-class shareholders’ would have limited and reduced rights as well as voting power. The ‘second-class shareholders’ could be the FPCs’ suppliers, vendors, promoters, agriculture experts, bankers, etc. It would instantly provide the FPCs with much-needed additional low-risk fund in the form of equity capital. The suppliers and vendors as shareholders would help the FPCs in building strong supply chains through forward and backward linkage. Thus, FPCs would be able to increase and generate stable and sustainable revenue from their operations. Problems such as diminishing ability to earn profits, deteriorating shareholders’ fund, credit policy, etc., are all interconnected and are all managerial-level problems. With improved and well-equipped management, FPCs might be able to tactically deal with these issues. These ‘second-class shareholders’ would be able to aid the management with their experience, advice and suggestions on markets and management. Generally, the suppliers and vendors were well aware of the market demand and trends, and along with bankers, promoters and agriculture experts, these ‘second-class shareholders’ could act as mentors and advisors to the management of these FPCs. However, necessary steps should be taken to avoid the shift in ownership and control from farmers to second-class shareholders. Regular inspection and corporate veil lifting exercise could be a possible intervention to keep a check on the ownership.
Conclusion
It was quite evident from the study that the financial performance of the FPCs was below par. Primarily, the study found that liquidity and solvency trends of the FPCs were improving, while other measures of performance like efficiency and profitability were meagre. The finding of the study was in line with other studies found in the literature. It was startling to find that the number of loss-making FPCs between 2013–2014 and 2018–2019 increased from 19% to 31%. Negative earnings also affected the net worth of these FPCs as 19% of the FPCs were found to have negative shareholders’ fund as on 31 March 2019. The introduction of ‘second-class shareholders’ might help the FPCs’ to efficiently manage their finances and operations. The FPCs need to primarily focus more on their solvency performance to improve their overall financial performance. Future researchers could explore topics such as financial health, sustainability, distress and bankruptcy, along with the financial performance of the FPCs.
Footnotes
Declaration of Conflicting Interests
The authors declared no potential conflicts of interest with respect to the research, authorship and/or publication of this article.
Funding
The authors received no financial support for the research, authorship and/or publication of this article.