






Abstract
This article estimates and analyses trends of calorie, protein and fat consumption in India. It finds notable increases in the intake of all three nutrients in 2022–2023. The increase marks the second recorded rise in nutrient consumption since 2011–2012, following a prolonged secular decline in calorie and protein intake up to 2009–2010. The earlier decline was primarily driven by a fall in real income rather than a reduced energy requirement. The article highlights the critical role of government interventions, particularly the public distribution system and the Pradhan Mantri Garib Kalyan Anna Yojana, in mitigating the nutritional deficit in recent years. Without these interventions, calorie and protein intake could have declined even more, despite rising average income.
Introduction
Measurement of economic welfare is a central theme in upper-middle income economics, especially in lower-middle income countries like India, where persistent poverty and undernutrition coexist with rising national income. India is one of the fastest-growing economies and is ranked as the third largest economy in the world in PPP terms (IMF, 2025). However, the country also has the largest number of poor (approximately 234 million) in the world (UNDP & OPHI, 2024). In the Global Hunger Index (2024), India is ranked 105th out of 127 countries. Around 35.5% of children under the age of five in the country were stunted, and 32% were underweight in 2021 (Ram & Alha, 2025).
Traditionally, change in real income—calculated by deflating nominal incomes using consumer price indices (CPIs)—has served as the primary measure of household welfare. However, this approach has increasingly come under scrutiny in recent decades. Scholars argue that CPIs fail to accurately reflect the consumption pattern of the masses and consequently fail to estimate the rise or fall of real income for them (Patnaik, 2007, 2013).
The Laspeyres price index, commonly used in the calculation of poverty, is criticized for using fixed base-year consumption weights, as it does not represent the current consumption basket of low-income households. This results in an overestimation of the real-income growth and an underestimation of poverty figures. This mismatch presents distorted results on welfare improvement and economic development (Basu & Basole, 2012; Patnaik, 2007, 2013; Pogge, 2010; Reddy, 2009).
However, besides the issue of appropriateness of measuring real income, considering welfare through actual food and non-food consumption suggests that economic development alters dietary habits. People shift from the consumption of cheap cereals to more expensive food such as meat, milk, fruits and vegetables with the rise in earnings. However, the effect of this rise can be offset by food price inflation and myriad factors like cost of healthcare, education or transportation, which squeeze households’ budget to the extent that households fail to maintain adequate calorie consumption.
The available data reveal a consistent drop in per capita daily calorie intake up to 2009–2010, with only an increase after 2011–2012 for both rural and urban areas. The declining trend of calorie consumption has been widely discussed in the literature. One strand of literature argues that the decline in calorie consumption is mainly due to a reduction in calorie requirements resulting out of mechanization, automation and the electrification of work, which enables people to do their work with less energy requirement. It is argued that declining calorie intake across all expenditure groups in both rural and urban India is an indicator of a downward shift in the ‘calorie–Engel curve’. This suggests that people demand fewer calories than they did earlier. It is also argued that calorie consumption is not solely determined by income but also depends upon other factors such as price, activity patterns, water supply, demographic composition and epidemiological environment. Any positive change in these factors causes a lower demand for calories. Diversification of the consumption basket from traditional coarse cereals to expensive foods such as meat and processed foods, which are lower in nutrient value, is another explanation for the decline in calorie and protein intake (Deaton & Drèze, 2009; Rao, 2000). Bhalla (2002) supports this argument, arguing that calorie-based poverty measures suffer from major conceptual problems as consumer preferences shift towards non-cereals, and from cheap to rich sources of calories, and towards low-calorie, high-nutrition foods with the rise in incomes. He further states that ‘likelihood of Type II error (people consuming few calories but otherwise rich) was large’ (Bhalla 2002, p. 61).
However, in contrast to the above, another strand of literature, which offers a broader critique of neoliberal economic policies, argues that people are consuming fewer calories because they are no longer able to afford the required calories norm due to a decline in their real income. It argues that economic liberalization has led to demand deflation due to decline in growth of employment, rise in cost of food and non-food commodities and increase in income inequality (Chandrasekhar & Ghosh, 2004; Patnaik, 2007; Sen & Himanshu, 2004). Together, this causes a fall in real income of a large section of the population, which cannot be captured through the conventional measure of real income (Patnaik, 2010).
The question of whether declining per capita calorie intake reflects voluntary dietary transition or involuntary income compression is not unique to India. Similar patterns have been observed in China, Brazil, Mexico and several Southeast Asian countries, where declines in calorie and cereal consumption, alongside increased consumption of animal protein, fat and processed foods, have been interpreted as an indicator of dietary diversification and rising living standards (Du et al., 2004; Popkin, 2003). However, while dietary diversification may adequately account for declining cereal dependence among middle- and higher-income groups, it is far less persuasive as an explanation of undernutrition, child stunting and stagnant protein consumption among the poorest deciles (Behrman & Deolalikar, 1987). The income elasticity of calorie demand, widely estimated to be low but positive for the lower-middle income countries, implies that a genuine rise in real income ought to translate into at least modest improvement in calorie intake, even accounting for dietary diversification (Behrman & Deolalikar, 1987; Subramanian & Deaton, 1996). The failure to observe such improvement across all income deciles in India, therefore, raises questions that the dietary diversification narrative alone cannot adequately resolve.
A solution proposed in such a situation is: If we think of some directly measurable entity, which is an inherently plausible indicator of well-being and strongly linked to real income, then we can take it as a proxy of real income (Pogge & Reddy, 2005). Considering this hypothesis, Patnaik (2010) has suggested using cereal/calories intake as a proxy for real income and indeed used it in the calculation of ‘true real income’. She has used her own constructed implicit price deflator 1 and has shown that per capita real expenditure has declined during the period 1993–1994 and 2004–2005. However, this alternative method is derived assuming ‘positive monotonic relationship between per capita real income on the one hand and per capita food grains/cereals/calories intake on the other’.
Against this position, Deaton and Drèze (2010) have argued that taking per capita food grains/cereals/calories intake as a proxy for per capita real income/real expenditure
would require not just that the relationship them is monotonic but also that cereal/calorie intake depends only on real income and on nothing else (or at least nothing else that might change over time). But cereal and calorie consumption do indeed depend on other things—price, mechanization, activity-pattern, body weight, water supply, the epidemiological environment, and the demographic composition of the population. (p. 90)
It is therefore inappropriate to consider cereals/calories intake as a proxy for real income/real expenditure.
Further, Deaton and Drèze have argued that there is no relationship between cereal consumption and income, and so there is apparently no relationship between calories and nutrition. They explained that although the calorie consumption is a key determinant of nutrition, other factors, such as balance in diet (adequate proportion of fruits, vegetables and fat), activity level, sanitation, clean water, hygiene practice and vaccination, are also important determinants of nutritional status. If any positive improvement in these factors is accompanied by a decline in calories, it does not necessarily mean a worsening of nutritional status (Deaton & Drèze, 2009, p. 43).
In contrast to Deaton’s observations, evidence from countries such as Indonesia and China reiterates a strong link between calories and income (Block & Webb, 2009; Osberg et al., 2009). Several studies also reiterate a strong positive relationship between calorie intake and income (Alderman, 2012; Bouis, 1994; Bouis & Haddad, 1992; Quisumbing, 2003).
Ram (2013, 2017) has empirically investigated the relationship between cereal consumption and real income using panel data, showing that cereal consumption (i.e., direct plus indirect) can be taken as a proxy for real income, and that the relationship between income and nutrition is sufficiently strong.
This debate underscores a deep epistemological divide in Indian development discourse, with one set of scholars viewing declining calorie intake as evidence of declining purchasing power, while the other group of scholars sees it as a consequence of economic transition and improved quality of life. Both perspectives have their own merit and limitations. While the demand side argument may hold for better-off households, it fails to explain the continued prevalence of undernutrition, child stunting, anaemia and protein–energy malnutrition among the poor.
In the light of these two divergent perspectives, this article seeks to empirically examine trends in calorie, protein and fat consumption in India, disaggregated by socio-economic status. The article specifically estimates calorie, protein and fat consumption for the year 2022–2023; assesses whether improvements in nutritional intake have been inclusive or skewed; and whether the observed trend of calorie and protein consumption aligns more closely with the hypothesis of welfare improvement through dietary transition or with the argument of real income decline and involuntary consumption compression. It also evaluates the role of safety nets such as the public distribution system (PDS) and PMGKAY in mitigating nutritional deficits and promoting food security in the country.
Method and Data Sources
Findings in the article are derived from the unit-level data of Household Consumption Expenditure Survey (HCES) data sets of 2011–2012 (Type 2) and 2022–2023 conducted by the National Sample Survey Organisation (NSSO). The article estimates the daily per capita calorie, protein and fat consumption across income deciles and social groups for both rural and urban India. In addition to estimating overall nutrient intake, it also examines the contribution of major food items to total calorie, protein and fat consumption.
To compute nutrient intake, we have used the nutrition conversion chart based on the Indian Council of Medical Research (ICMR) publication given in the NSSO Nutritional Intake India Report 2011–2012 (pp. 14–18, hereafter NII 2011–2012). This chart provides calorie, protein and fat content information for approximately 150 food items.
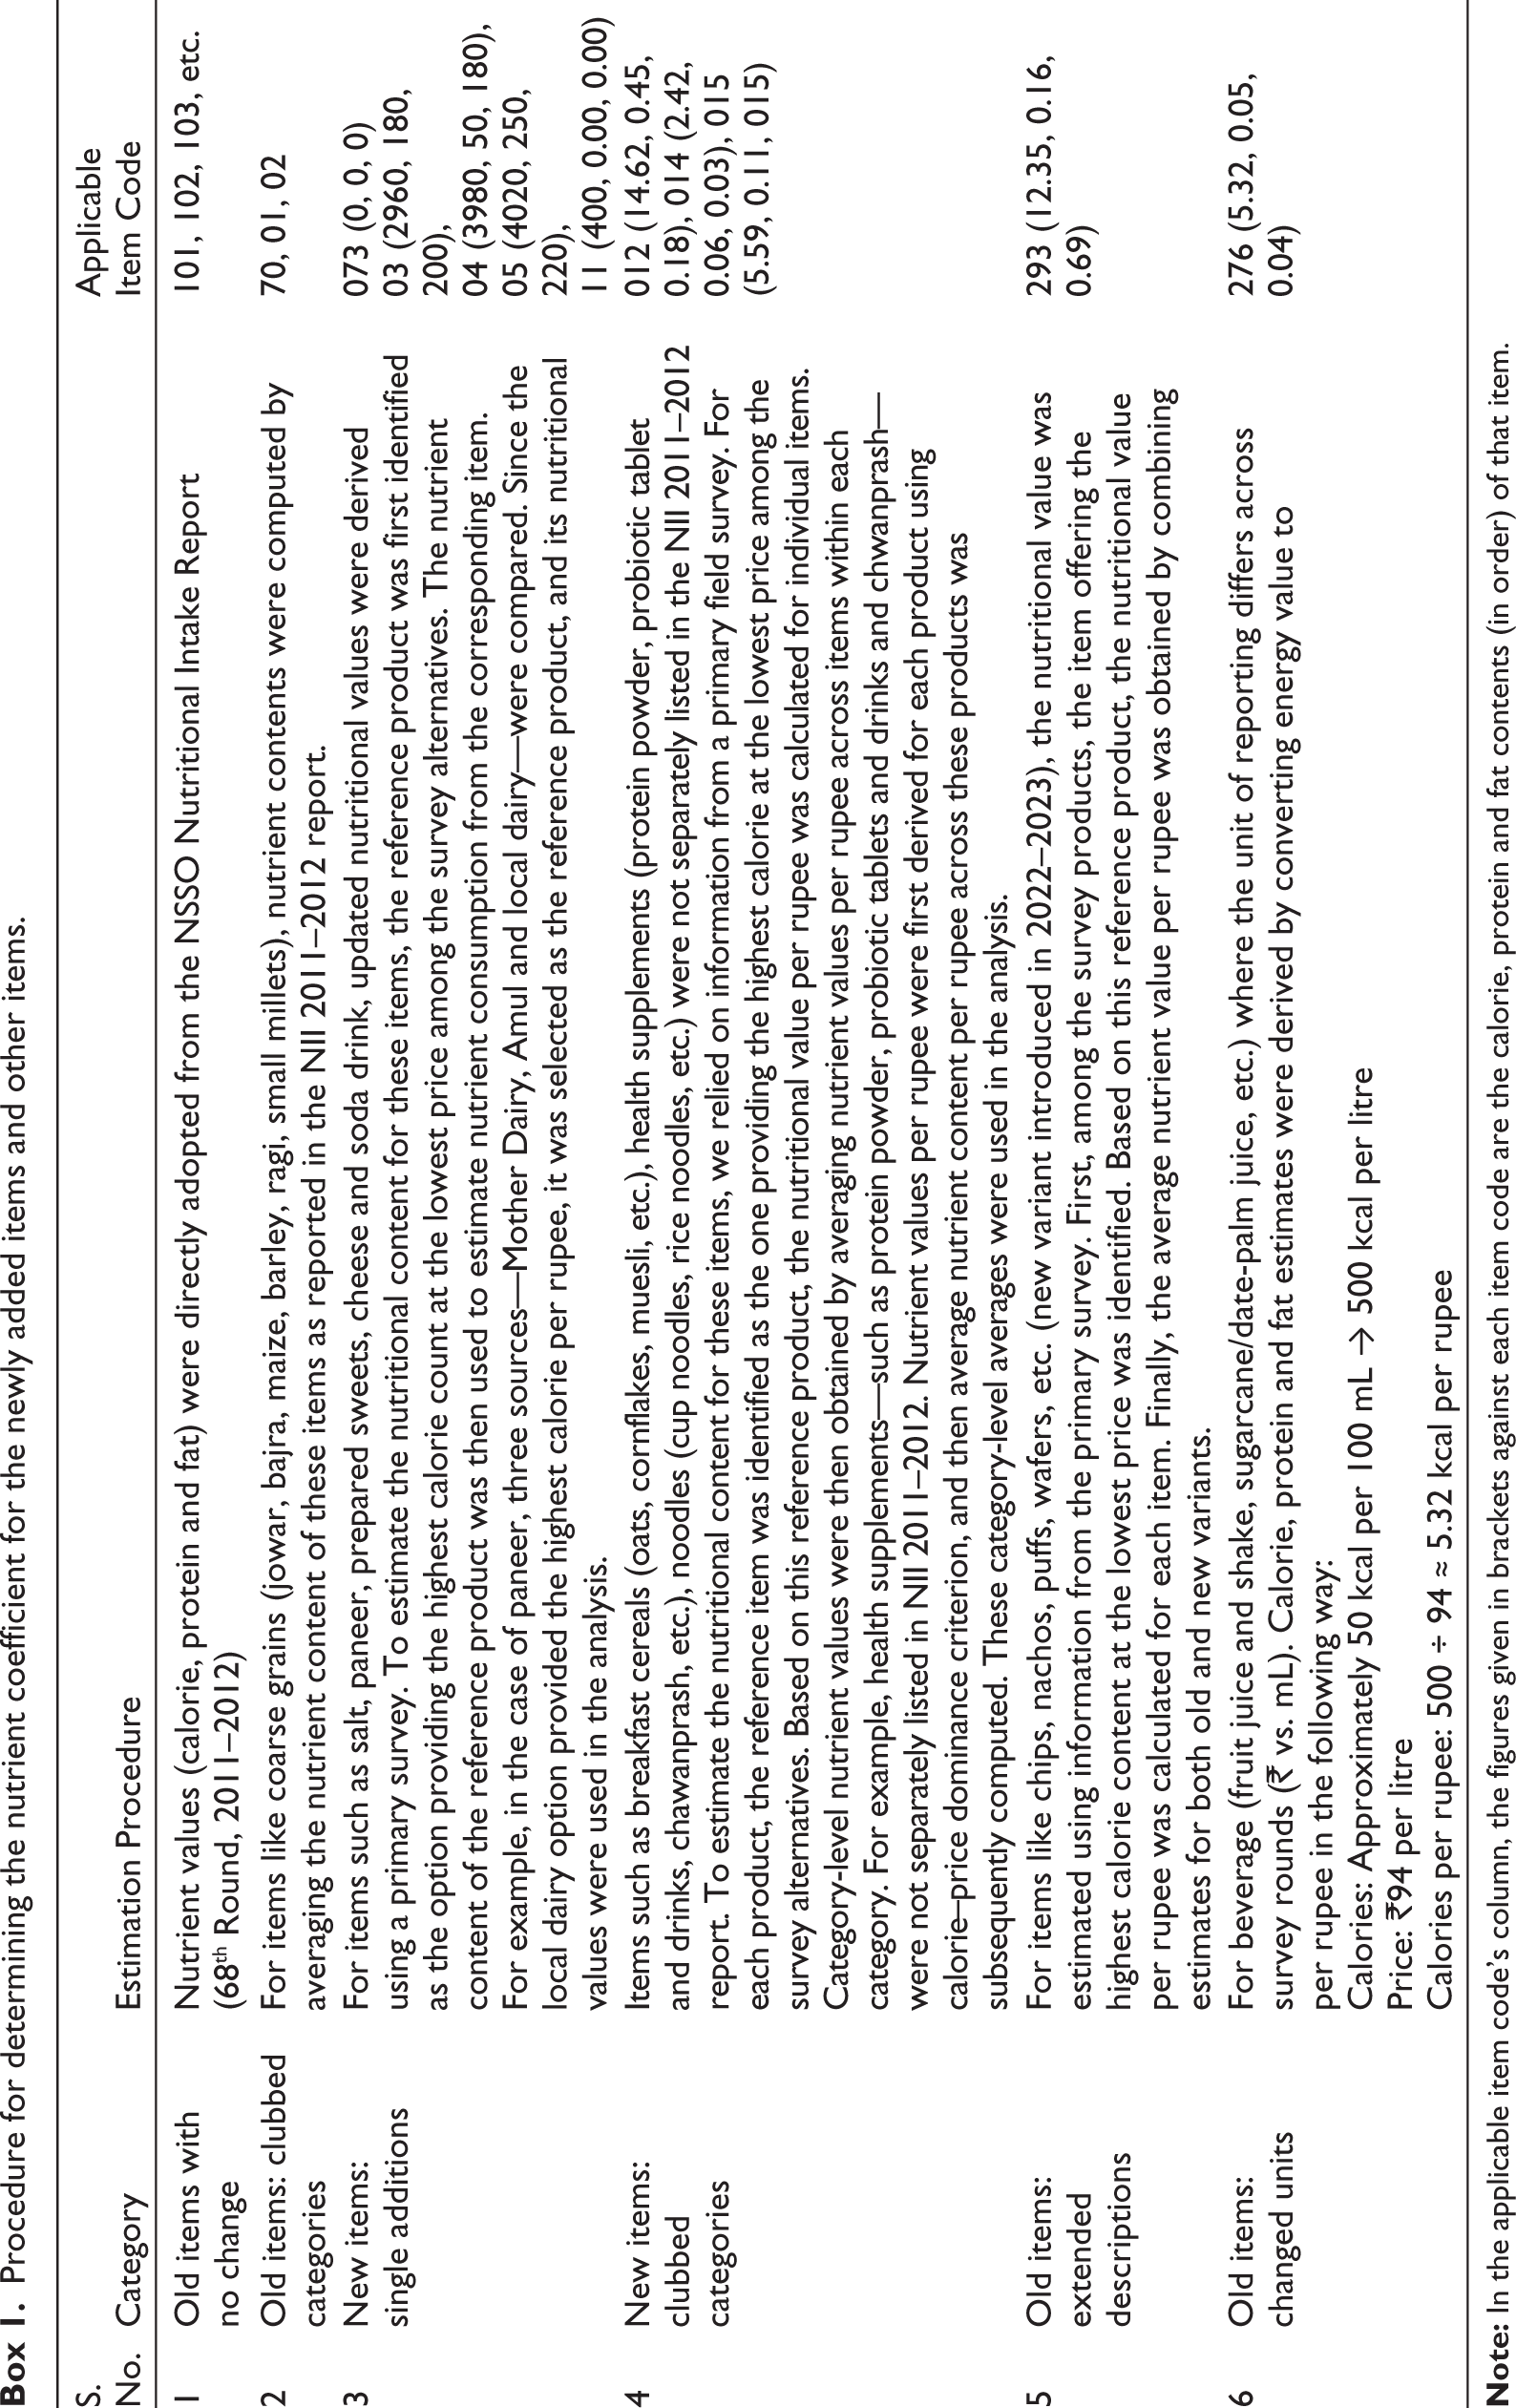
For the food items newly introduced in the 2022–2023 HCES and for those lacking nutrient coefficients in consistent units measured in the NII 2011–2012, we have estimated nutritional coefficient values by taking a representative sample of these products in each category from the local market. 2 For example, item code ‘014-health supplements’ (protein powder, probiotics, tablets and drinks, chawanprash, etc.) is a newly listed food item in the HCES 2022–2023, which does not have corresponding nutrient data in the NII 2011–2012. Similarly, item code 293 (chips, nachos, puffs, wafer, etc.) is reported only in monetary value (₹) terms in HCES 2022–2023, whereas the NII 2011–2012 provides its nutrient values in per unit weight (gram). The procedure for determining the nutrient coefficient for the newly added and other items is mentioned in Box 1.
Procedure for determining the nutrient coefficient for the newly added items and other items.
The Modified Mixed Reference Period is used for deriving monthly per capita expenditure at the household level for 2011–2012 and 2022–2023. However, due to differences in survey methodology, recall period and sampling design in HCES 2022–2023, concerns have been raised regarding its comparability with the 2011–2012 survey (Himanshu et al., 2025). 3 In addition to other issues related to non-comparability, the revised sampling strategy appears to have included a greater proportion of better-off households in both the rural and urban areas (Anand, 2024). Nevertheless, in the absence of any alternative or equivalent survey, we have used the available data, assuming that the change in methodology has no significant impact on the estimation of nutrient consumption.
To assess the role of PDS and PMGKAY in mitigating nutritional deficits, we employ both descriptive and econometric methods. The econometric analysis uses the propensity score weighting approach to estimate the impact of these programmes on nutritional intake. The propensity score is a way of aggregating multiple matching variables into a single measure, traditionally used in propensity score matching (PSM). The propensity score represents the predicted probability that a given observation receives the treatment.
The PSM is a widely used method for estimating treatment effects by constructing comparable treatment and control groups. By balancing treated and untreated households on observed characteristics, these methods reduce observable selection bias and provide a more credible assessment of programme effects (Surabhi & Viswanathan, 2025). However, recent methodological guidance cautions against relying on PSM as a default estimator and recommends weighting or other matching approaches in many applications (King & Nielsen, 2019). Huntington-Klein (2025) notes that propensity scores are particularly suited to inverse probability weighting, provided the sample is large and the propensity score is flexibly estimated.
We employ Stata’s teffects ipw command to estimate the inverse-probability-weighted treatment effect. The dependent variables are nutritional outcomes measured in per capita daily calorie, protein and fat consumption. The key explanatory variables capture programme participation: whether a household receives subsidized food (PDS), free food (PMGKAY/SSW), either PDS or free food, and both PDS and free food. All these variables are categorical variables.
In addition to these variables of interest, the model includes a comprehensive set of covariates, such as the logarithm of per capita expenditure, landholding, household amenities and ration card type, an indicator variable for Pradhan Mantri Garib Kalyan Yojana (PMGKY) 4 beneficiaries, sector and state dummies. The technical details of the method and estimation procedure are not provided here. Interested readers may refer to Wooldridge (2010) and Huntington-Klein (2025) for details.
Calorie, Protein and Fat Intake in India
Calorie, protein and fat intake are widely used indicators to assess the nutritional status of population cohorts. Specifically, calorie and protein consumption levels serve as a key measure of estimating nutrition, particularly in lower-middle income nations and among economically disadvantaged groups. This section provides estimates on various dimensions of nutrient intake—its average daily intake per person (per consumer unit) across various socio-economic groups and the contribution of different food items to it.
Figures 1 and 2 indicate that calorie consumption declined consistently until 2009–2010. This downward trend was reversed in 2011–2012 and showed an upward trajectory since then. The trend of protein consumption in rural areas followed a similar pattern, while in urban areas it remained steady until 2004–2005, dipped slightly in 2009–2010 and rebounded in 2011–2012. The fat consumption, by contrast, showed a steady upward trend throughout the period.
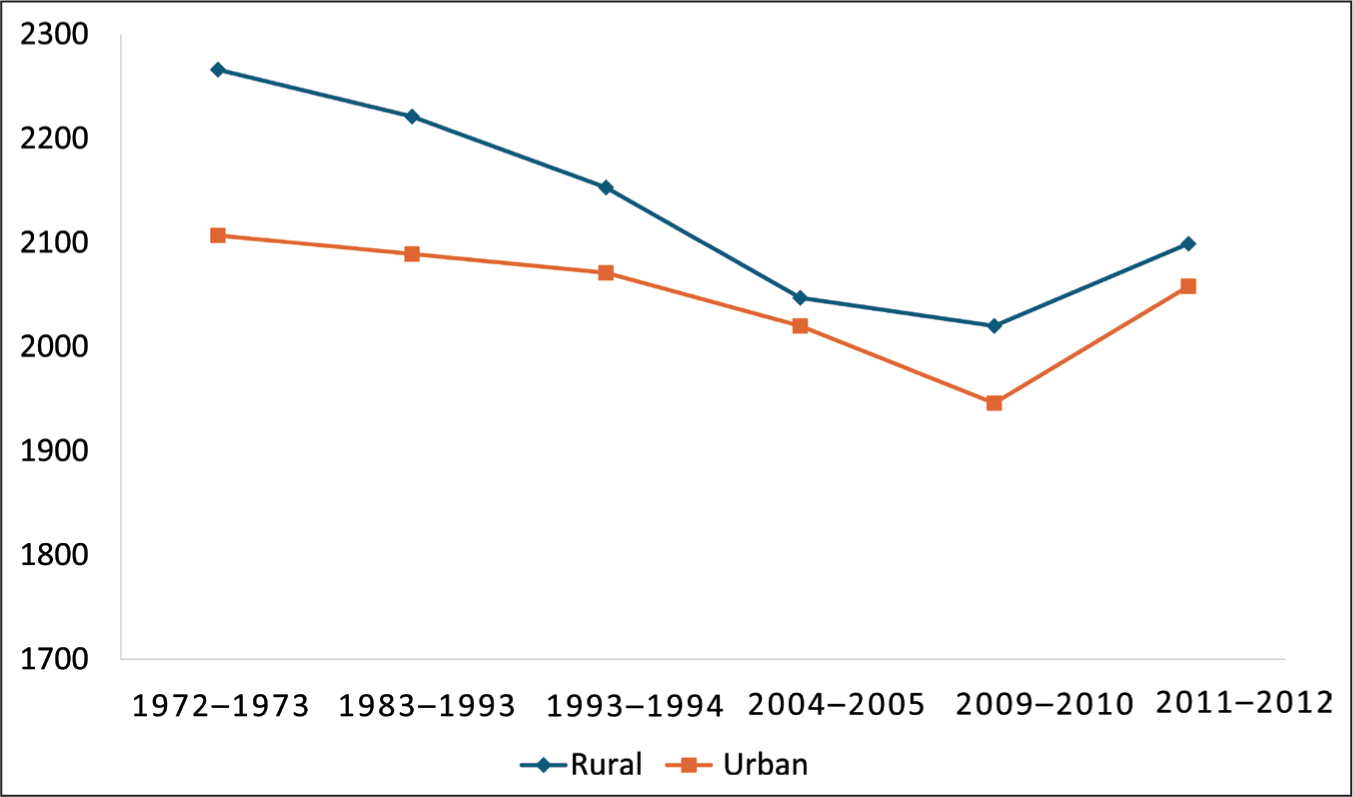
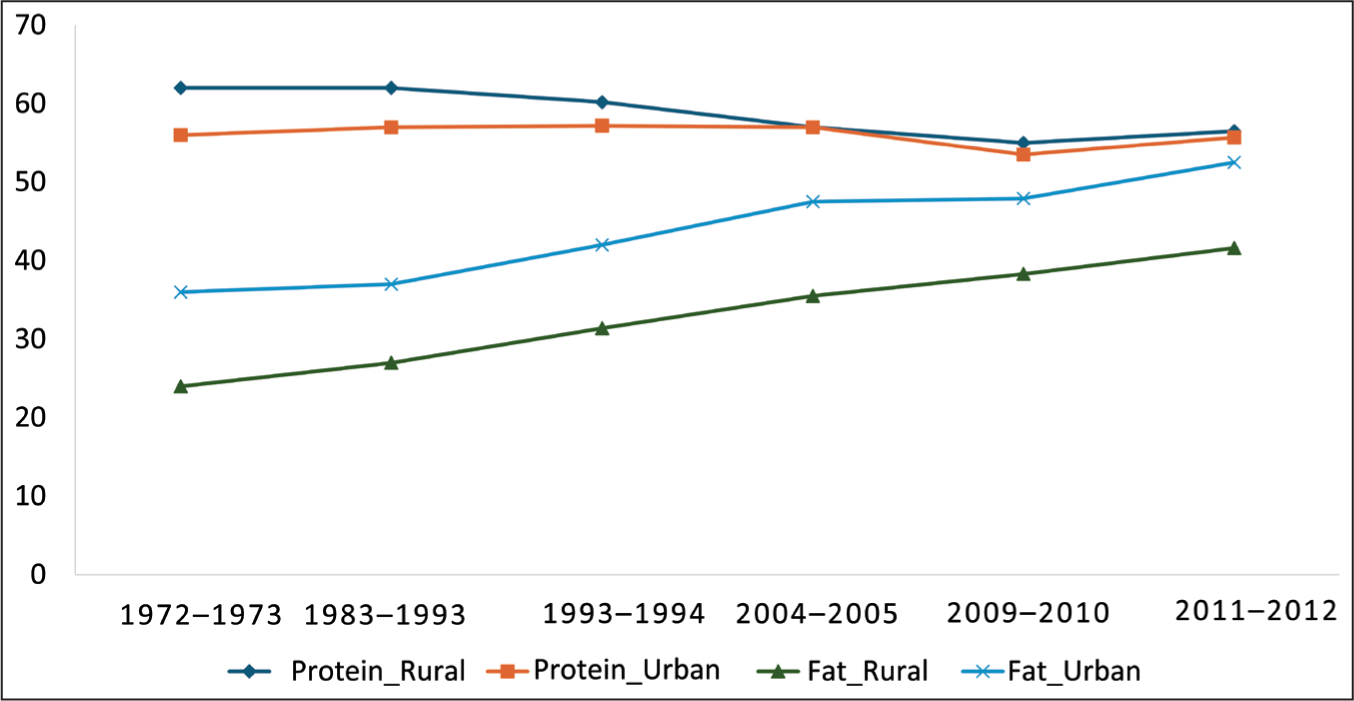
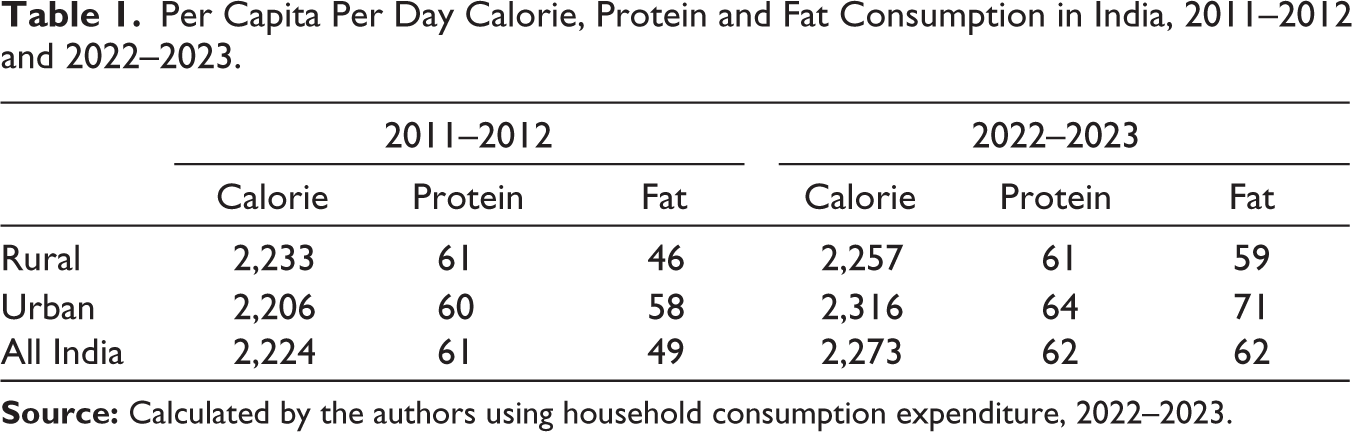
In 2022–2023, the per capita calorie consumption at the all-India level was approximately 2,273 kcal per day, which is about 50 kcal higher than that in 2011–2012. Notably, contrary to a pattern observed in the previous years, where per capita calorie intake was higher in rural areas, the calorie consumption is higher in urban areas in 2022–2023. A similar pattern is observed for protein and fat intake (see Table 1).
Per Capita Per Day Calorie, Protein and Fat Consumption in India, 2011–2012 and 2022–2023.
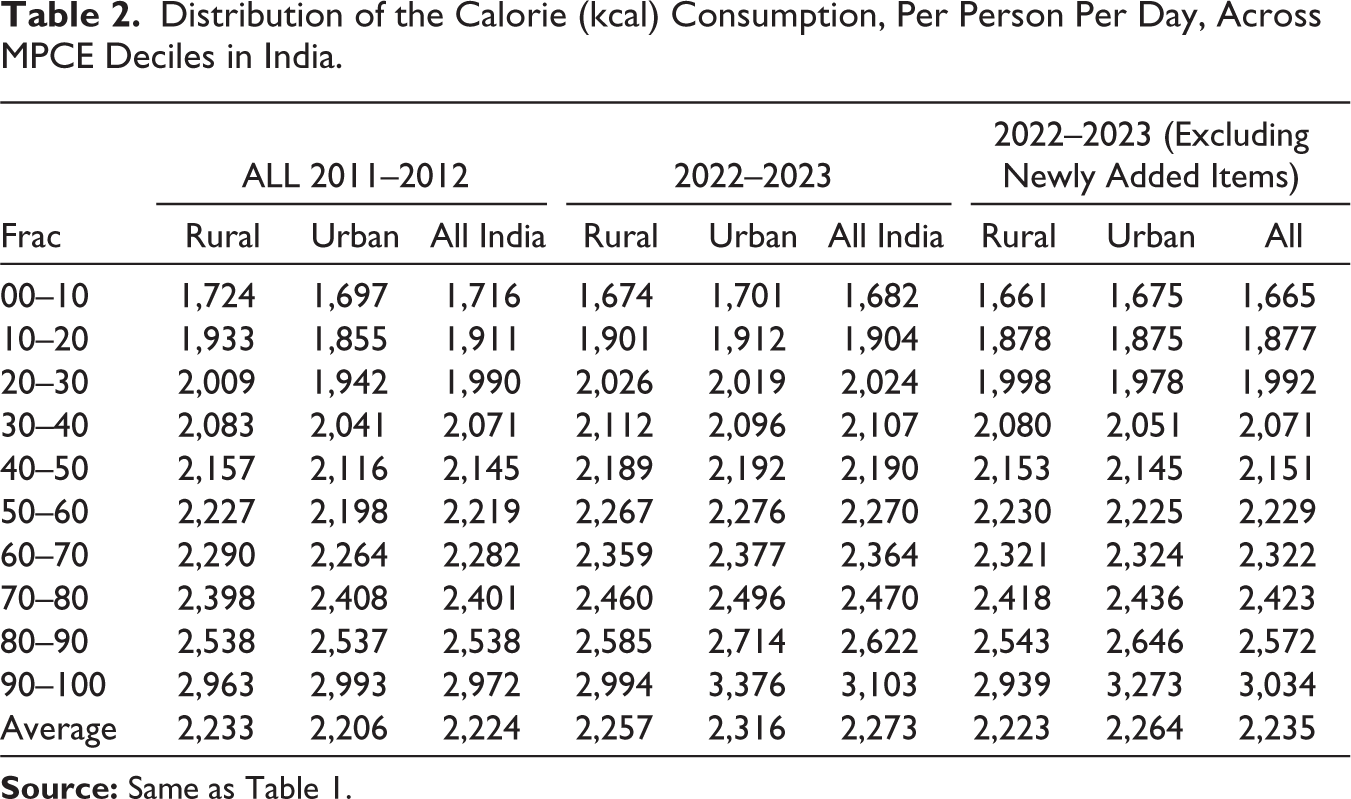
The distribution of per capita calorie consumption across MPCE deciles reveals that calorie consumption has gone up for all deciles in 2022–2023 except the bottom two deciles in rural areas (Table 2). This increase is more pronounced among the higher-income deciles in urban areas compared to their rural counterparts. In urban areas, a substantial rise in calorie consumption is evident across most deciles. The upper 50% of the urban population experienced an average increase of 168 kcal per person per day between 2011–2012 and 2022–2023, whereas the bottom 50% recorded a modest increase of 50 kcal per person per day. In rural areas, no average increase in calorie consumption was observed among the bottom 50%. However, the upper 50% experienced an increase of approximately 50 kcal per day, which was almost equal to the increase recorded by the bottom 50% in urban areas.
Distribution of the Calorie (kcal) Consumption, Per Person Per Day, Across MPCE Deciles in India.
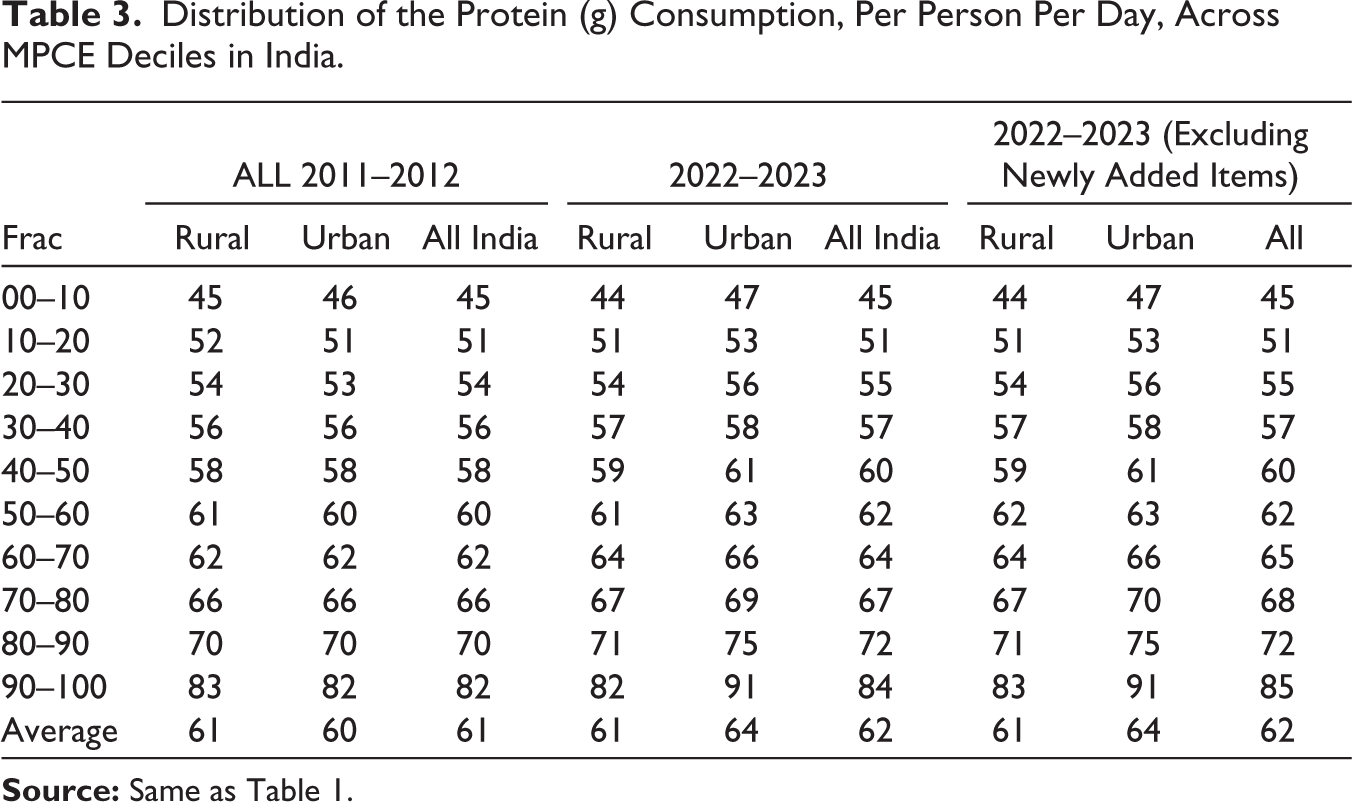
In the case of protein intake, people in urban areas consumed higher quantities than their rural counterparts in 2022–2023. A positive relationship is observed between income and protein consumption: Higher income is associated with greater protein consumption. This is largely attributed to diversification in food consumption and indicates a shift away from cereals towards a more protein-rich diet including fruits, eggs and meat. However, this relationship does not hold at the all-India level between 2011–2012 and 2022–2023. During this period, there was no increase in average protein intake in rural areas, while urban areas showed a marginal increase of only 4 grams per person per day. This stagnation recalls the well-known ‘calorie consumption puzzle’, where calorie intake was found to be positively related with income at a point in time, but showed a declining trend across all income deciles despite rising in real income over time in both rural and urban areas (Basu & Basole, 2012).
Although the protein consumption did not decline between 2011–2012 and 2022–2023, its stagnation despite the rising average per capita income in both rural and urban areas raises serious concern. Why have people not diversified their diet towards more protein-rich foods, especially given that studies have shown that protein intake plays a very significant role in supporting height, weight and cognitive development during early childhood (Bekelman et al., 2017; Hruby & Jacques, 2021; Moughan et al., 2024; Puentes et al., 2016)?
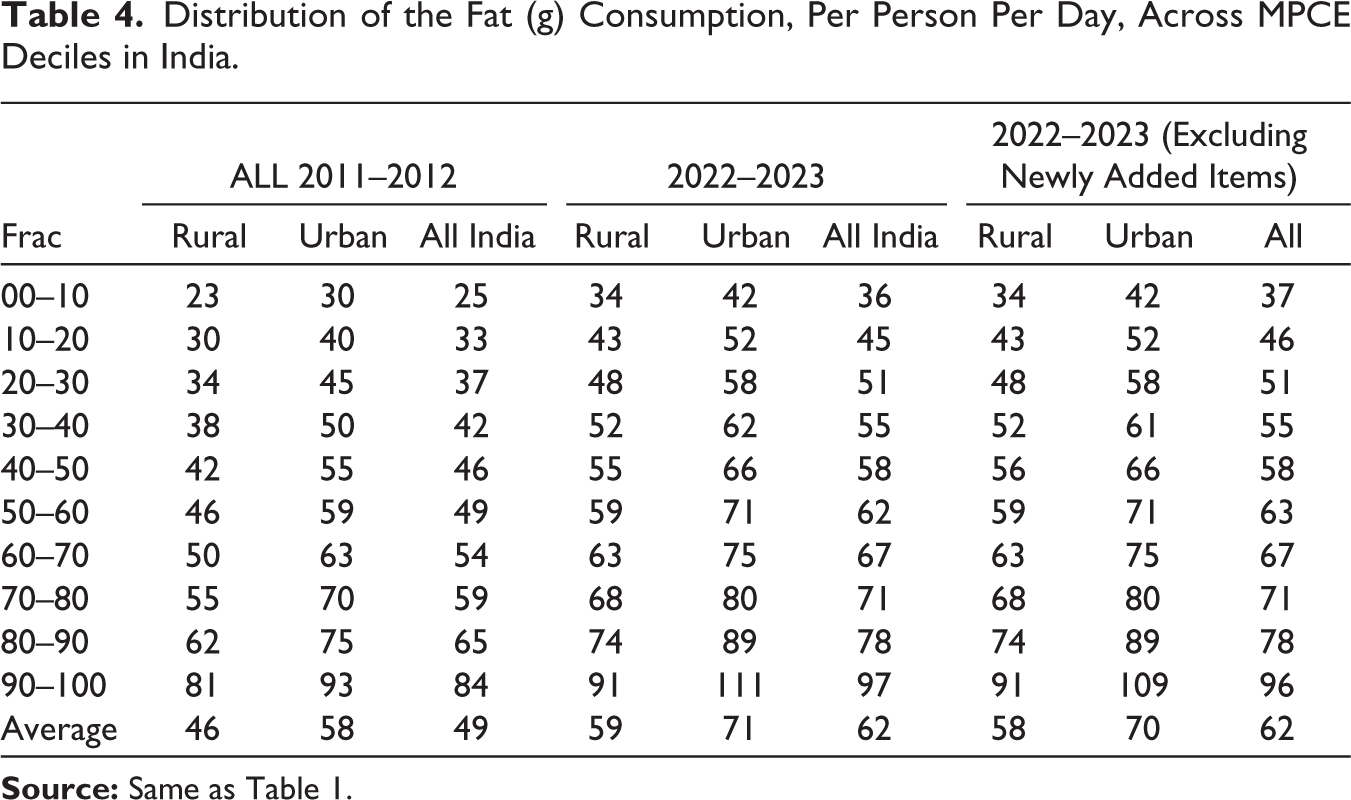
The 2022–2023 round includes some newly added items that were not part of the 2011–2012 round, which could inflate the 2022–2023 estimates and mechanically improve the outcome. Hence, we have also provided the calorie table without the newly added items for comparison. This becomes particularly important in light of our finding that a rise in calorie and protein consumption is larger for rich households, who tend to consume more of newly added items, such as health supplements, that were not included in the 2011–2012 round. The findings suggest that, on average, households with higher incomes derived higher quantities of calories from these newly added items in both rural and urban areas. Though the difference in calorie consumption without these newly added items is not substantial. In percentage terms, it varies from 0.76% to 1.83% of total calorie intake in rural areas and from 1.54% to 3.06% in urban areas. For protein and fat consumption, the difference is negligible, with a value of zero for most deciles and one gram for some deciles (Tables 3 and 4).
Distribution of the Protein (g) Consumption, Per Person Per Day, Across MPCE Deciles in India.
Distribution of the Fat (g) Consumption, Per Person Per Day, Across MPCE Deciles in India.
The decline in calorie and protein intake among the bottom 20% of the rural population, despite a marginal overall improvement, is primarily linked to stagnant or declining real wages in rural areas since 2014. Das and Usami (2023) and Surender and Pattanaik (2025) have documented a long-term trend of growth in both agricultural and non-agricultural wage rates from 1998 to 2023. Their studies have shown stagnant or declining real agricultural wage rates as well as stagnant or moderate non-agricultural real wages between 1998 and 2006. This was followed by strong or high growth rates of agricultural and non-agricultural real wage rates between 2006 and 2014. Since 2014, there were mid-to-flat agricultural and negative to near-zero non-agricultural occupational real wage rates growth. The stagnant nominal wages, coupled with persistent rural inflation, might have disproportionately reduced the real purchasing power of low-income households. As a result, even though the poorest receive larger calorie subsidies through the PDS and PMGKAY, their ability to supplement staples with market-purchased food remains severely constrained. This erosion of purchasing power helps explain why the poorest have not experienced the same rise in total calorie and protein intake as other groups, despite being the major beneficiaries of these food programmes.
Like calories and proteins, fats—particularly those derived from vegetable oils—are not only a source of energy but also provide essential fatty acids which perform vitamin-like functions in the body. However, excessive intake, especially of unhealthy fats, can lead to obesity and associated medical complications. Therefore, analysing fat intake is essential from the perspective of public health.
Table 4 presents the distribution of fat consumption across MPCE deciles. The data show that urban people, on average, consume a higher quantity of fat per day than their rural counterparts in both the years of 2011–2012 and 2022–2023 (an increase of 13 g in both the rural and urban areas). The rise is evident across all income deciles, indicating a broad-based increase in fat intake among Indians. Notably, fat consumption increased between 1990 and 2011, too. The persistent increase in fat consumption is a cause of concern, as fat intake exceeding the recommended dietary norms can contribute to the growing incidence of obesity, with serious implications for public health.
Trend of Calorie, Protein and Fat Consumption Across Social Categories and States in India
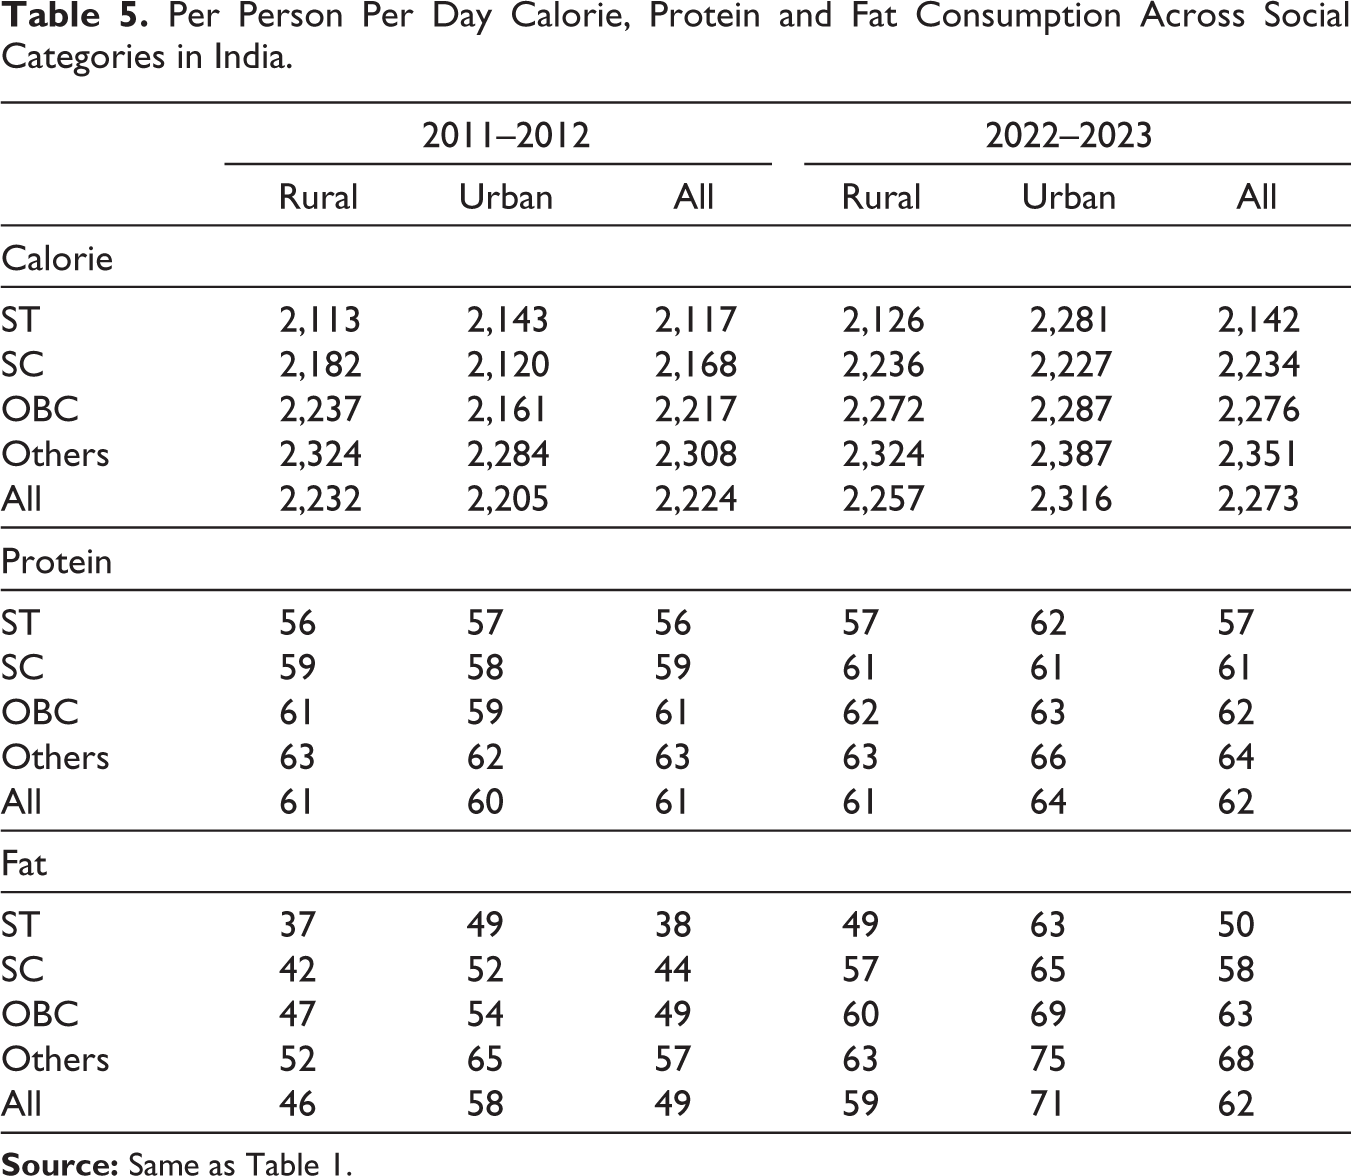
Table 5 presents the trends and patterns of calorie, protein and fat consumption across social categories in India. The data show that marginalized castes—Scheduled Castes (SCs) and Scheduled Tribes (STs)—consume fewer calories, on average, as compared to the Other Backward Classes (OBCs) and other castes in both rural and urban areas and in both the years. Understandably, one of the primary reasons for this lower consumption is low-income levels of these groups in comparison to OBCs and Others. In fact, a significant proportion of SCs and STs do not earn enough to meet even their basic needs, including minimum calorie requirement (Ram & Alha, 2025). What is particularly concerning is that SCs and STs are often engaged in more physically demanding and strenuous labour, which requires higher calorie intake for energy expenditure and physical recovery. 6 This nutritional shortfall is likely a contributor to the high prevalence of undernutrition in these communities. A similar pattern is evident in the consumption of protein and fat, with SCs and STs consuming significantly lower quantities of both nutrients compared to OBC and Others.
Per Person Per Day Calorie, Protein and Fat Consumption Across Social Categories in India.
In 2011–2012, approximately 19 states recorded per capita calorie consumption levels below the national average of 2,224 kcal per person per day. By 2022–2023, this number has declined to 13 states. At the same time, the calorie intake at the all-India level rose modestly to 2,273 kcal, reflecting an increase of about 47 kcal. In 2011–2012, several relatively affluent states, including Gujarat, Tamil Nadu, Goa, Kerala, Karnataka, Delhi and Chandigarh, reported average calorie intake below the national average, as did the poorer states such as Jharkhand, Chhattisgarh, West Bengal, Uttar Pradesh and Odisha. A decade later, only Tamil Nadu and Kerala among the affluent states remained below the national average, while the rest had moved above it (Table 6).
Per Person Per Day Calorie, Protein and Fat Intake Across Major States in India in 2011–2012 and 2022–2023.
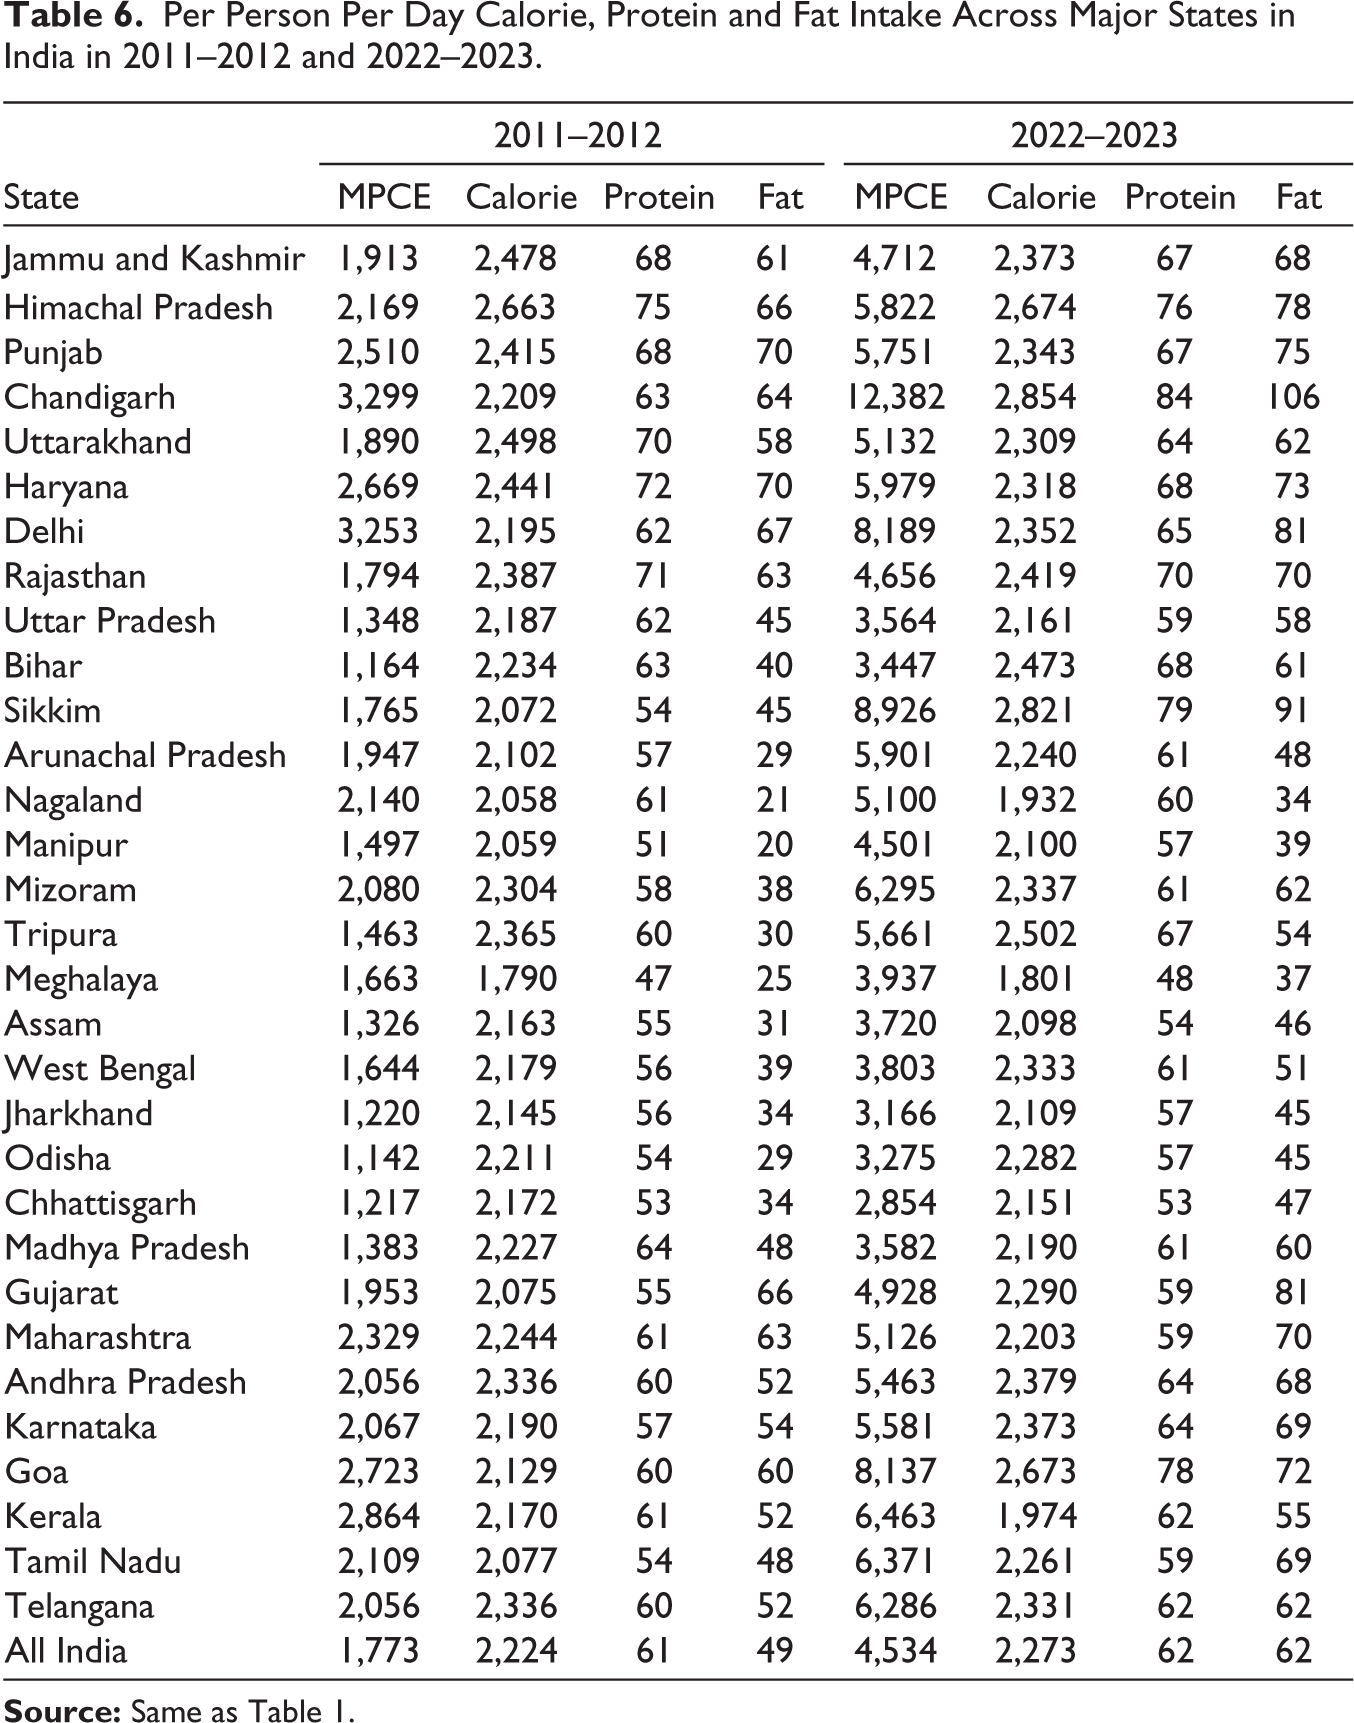
Some high-income states, such as Uttarakhand, Punjab, Haryana, Kerala, Jammu and Kashmir and Maharashtra, actually experienced a decline in average calorie intake between 2011–2012 and 2022–2023. A similar decline is observed in several low-income states: Madhya Pradesh, Uttar Pradesh, Chhattisgarh and Jharkhand. In the North-Eastern region, states such as Meghalaya, Nagaland, Manipur, Arunachal Pradesh and Assam recorded calorie consumption below the national average in 2011–2012. Alarmingly, Nagaland and Assam experienced further decline in 2022–2023 (Table 6).
Mapping calorie intake trends onto protein intake gives us a striking correspondence. High-income states that witnessed a decline in calorie consumption also registered a decline in protein intake in 2022–2023. Notable examples include Punjab, Haryana, Maharashtra and Jammu and Kashmir. Kerala stands out as the sole exception. It is the only state that experienced a modest increase in protein consumption despite a decline in calorie intake during the period. Among the poorer states, Madhya Pradesh, Uttar Pradesh, Chhattisgarh and Jharkhand recorded a similar decline in both calorie and protein intake, highlighting the persistent nutritional challenges faced by these states.
Sources of Calorie, Protein and Fat Intake in India
Examining the break-up of calorie consumption by food categories reveals that although the calorie share of cereals is on a decline, cereals continue to be the dominant source of calorie intake (Table 7). Between 2011–2012 and 2022–2023, the share of calories derived from cereals declined from 57% to 49% in rural areas and from 49% to 40% in urban areas.
Percentage Break-up of Calorie Intake over Food Groups in 2011–2012 and 2022–2023.
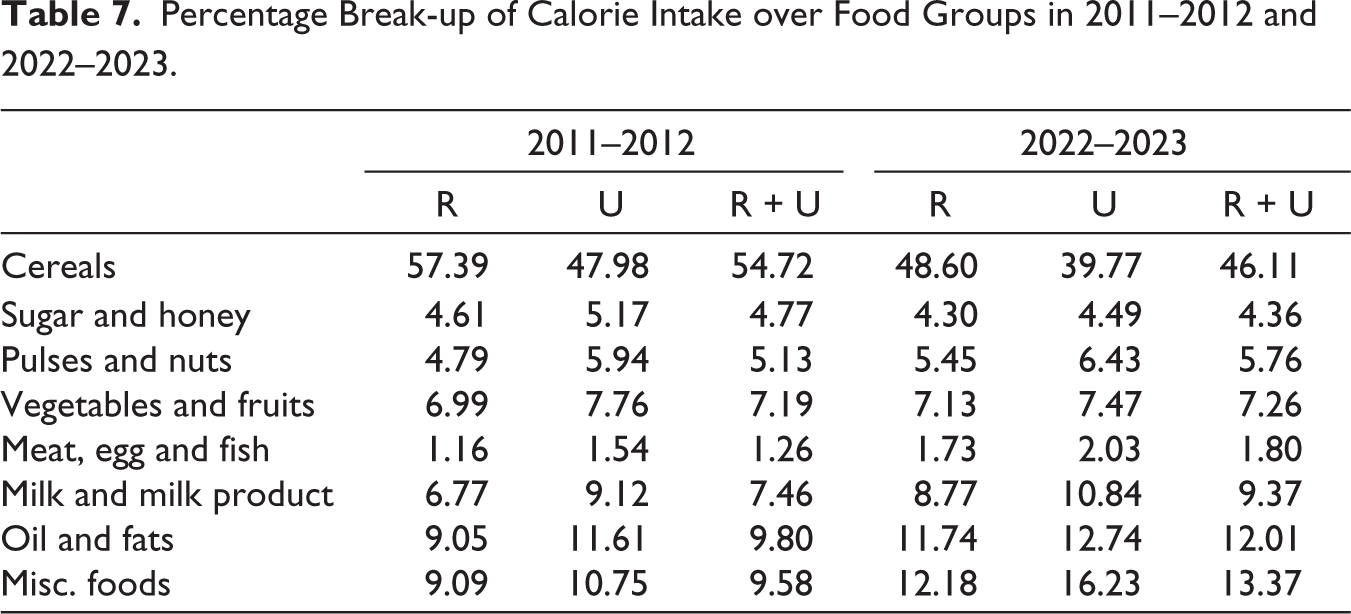
Following cereals, miscellaneous food items (spices, beverages, refreshment, processed foods, etc.) constitute the second-highest source of calorie consumption. Their share increased from 9% to 12% in rural areas and from 11% to 16% in urban areas over the period. Oils and fats occupy the third position, followed by milk and milk products. Both categories have seen an increase in their contribution to calorie intake in both rural and urban areas.
A very similar pattern can be observed in protein consumption. Cereals, in spite of their decline in consumption, continue to be the major source of protein intake in 2022–2023. They accounted for approximately 50% of the protein intake in rural areas and 40% in urban areas, accounting for nearly half of the protein share in the average consumption basket in India. Miscellaneous food items are the next most important source of protein after cereals. The share of milk and milk products in protein intake is around 12% in rural areas and 13% in urban areas (see Table 8). The declining share of cereals in both calorie and protein intake reflects a diversification in dietary pattern, with individuals increasingly consuming pulses, meat, oils and miscellaneous food products.
Percentage Break-up of Protein Intake over Food Groups in 2011–2012 and 2022–2023.
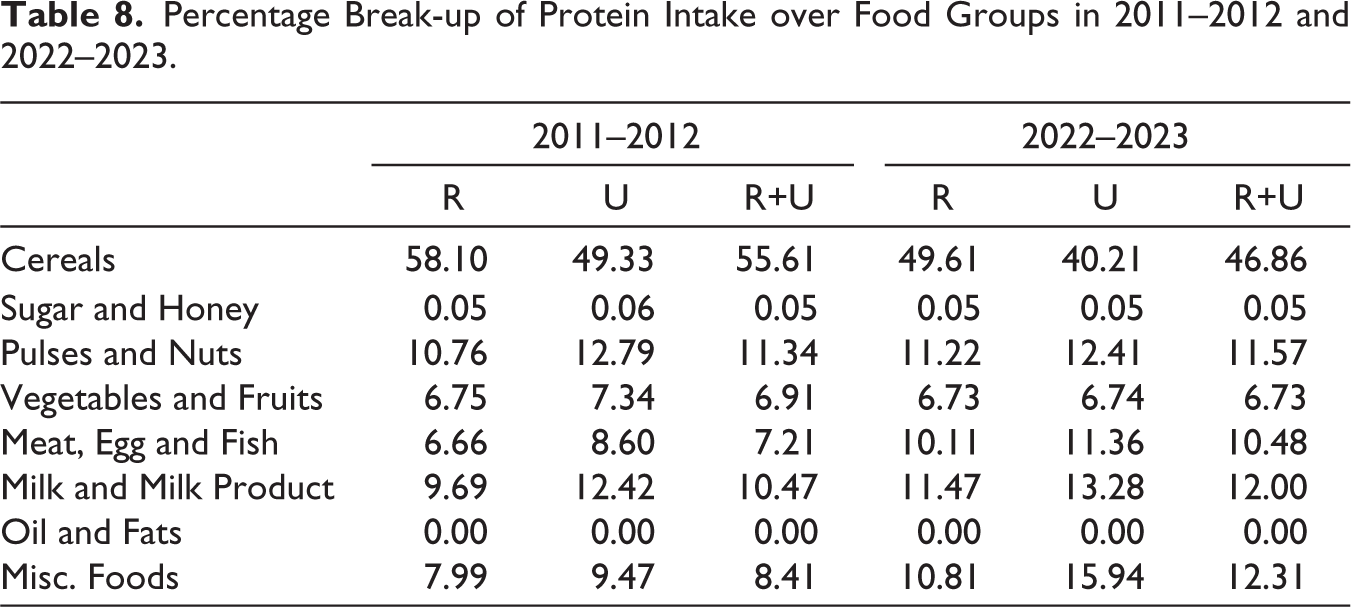
Table 9 presents the breakdown of fat intake by food groups for 2011–2012 and 2022–2023. The data show that oil and fats remain the largest source of dietary fat, accounting for 49% of the total fat intake, followed by milk and milk products, constituting 24%. Miscellaneous food items also make a noticeable contribution to fat intake, and their share increased from 9.70% in 2011–2012 to 11.44% in 2022–2023.
Percentage Break-up of Fat Intake over Food Groups in 2011–2012 and 2022–2023.
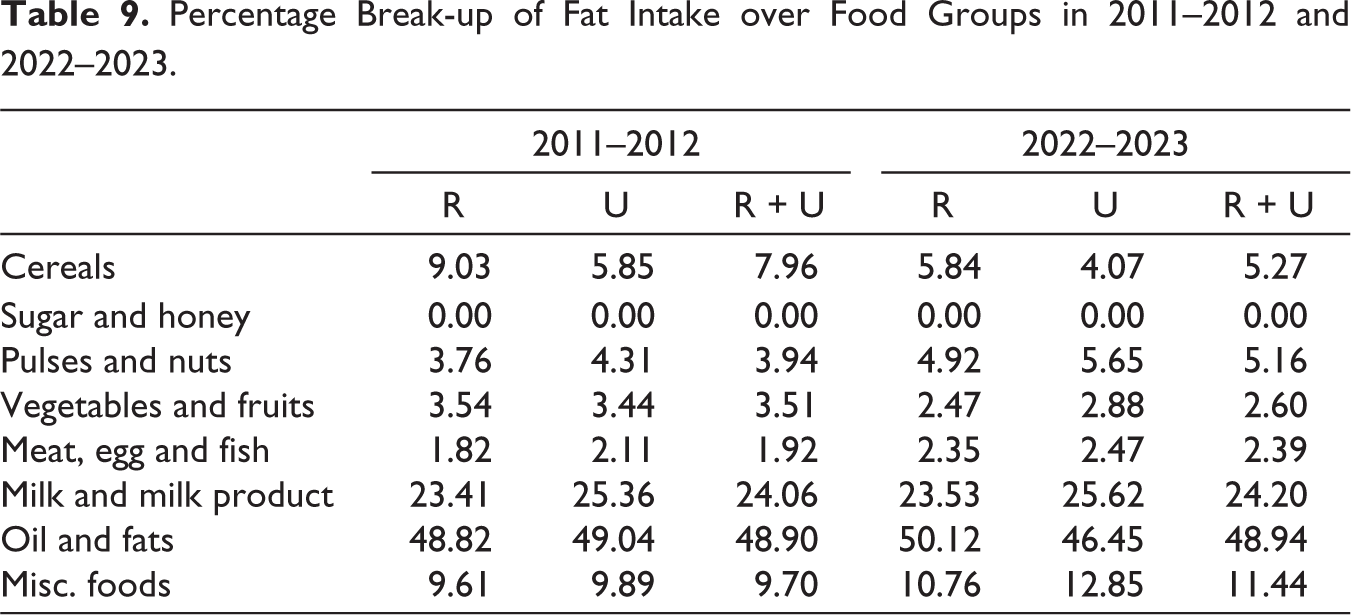
On the other hand, the share of vegetables and fruits in total fat intake has declined from 3.51% in 2011–2012 to 2.6% in 2022–2023. The share of meat, eggs and fish in fat intake witnessed a modest increase from 1.92% to 2.39% during the period. The share of fat from milk and milk products remained relatively stable, with a marginal change from 24.06% in 2011–2012 to 24.2% in 2022–2023.
Role of PDS and PMGKAY in Ensuring Food Security in India
Analysis of the sources contributing to the recent increase in nutrient consumption, particularly the calorie intake, reveals that a substantial portion of this increase stems from food items obtained either free of cost or at a highly subsidized rate. The NSSO provides the data across food consumed from the PDS, home-produced/grown items and food purchased from the market. Within the PDS category, two sub-categories exist: (a) food items mainly wheat, rice or pulses received free of cost by households under schemes like the PMGKAY and (b) food items received at subsidized prices under the National Food Security Act (NFSA). The PMGKAY, launched in April 2020, provides 5 kg of free food grains per month to the poor households, in addition to the already subsidized ration under NFSA at ₹ 2–3 per kg. This section presents the share of calorie intake derived from the free food, subsidized food through PDS and food from the market or home production.
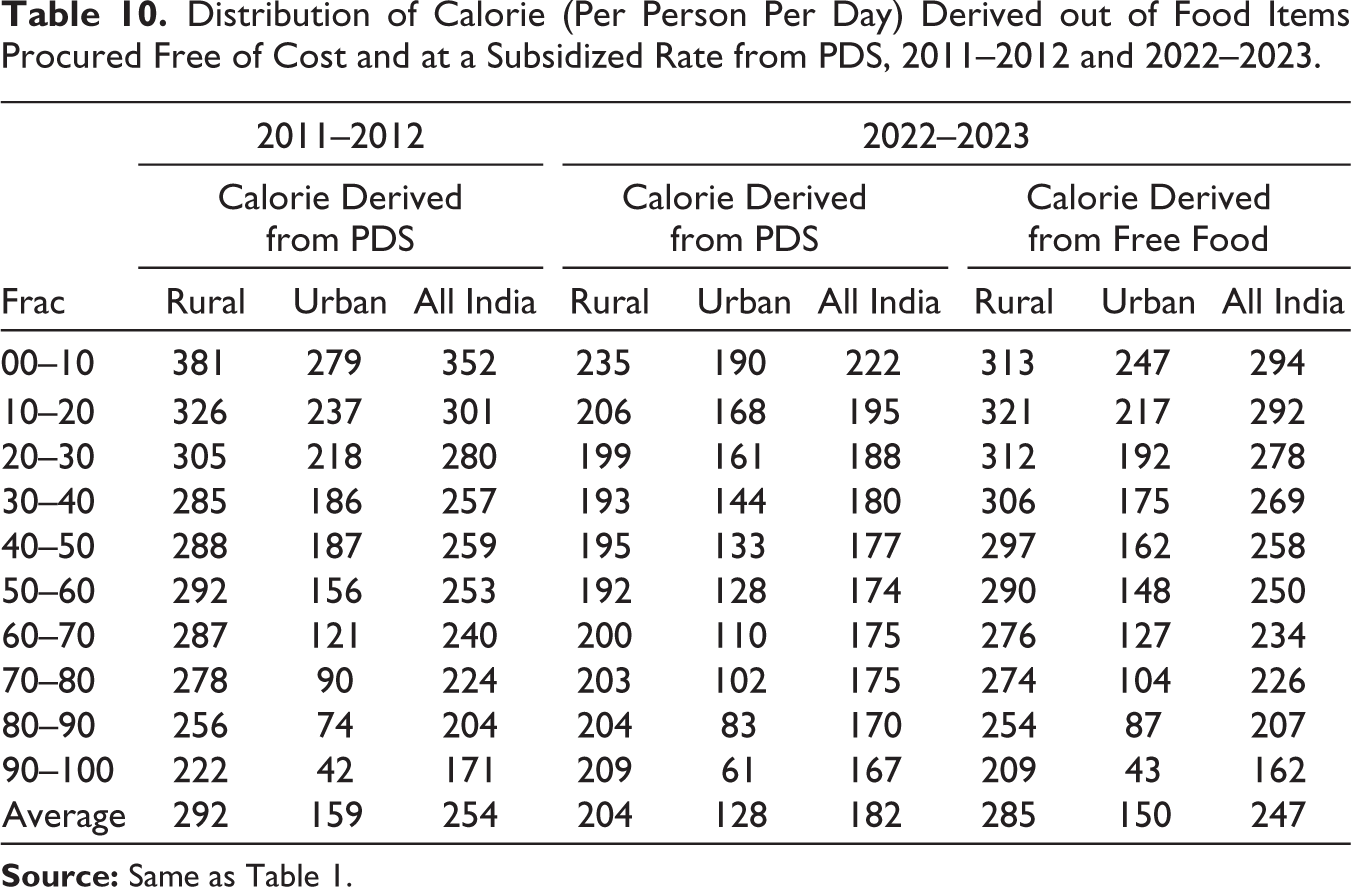
Table 10 shows that in 2011–2012, calorie consumption from the subsidized food obtained under the PDS provided around 204 kcal per person per day. By 2022–2023, this dropped to 175 kcal, a reduction observed across both the rural and urban areas, and across all MPCE deciles. This indicates that the volume of subsidized food distributed through PDS declined in 2022–2023 relative to 2011–2012. However, the calorie intake from free food under PMGKAY in 2022–2023 is roughly equivalent to the calorie intake from subsidized PDS food in 2011–2012. In essence, the calorie intake lost from a decline in subsidized food distribution has been compensated for by free food gains under PMGKAY. Altogether, about 20% of the total calorie intake at the all-India level in 2022–2023 was sourced from free or subsidized food. For the poorest households, this proportion is significantly higher—28% in the bottom two deciles in rural areas and around 20% in urban areas.
Distribution of Calorie (Per Person Per Day) Derived out of Food Items Procured Free of Cost and at a Subsidized Rate from PDS, 2011–2012 and 2022–2023.
The importance of these transfers is consistent with the wider international evidence on food-linked social protection. Evaluations of Mexico’s PROGRESA (Programme for Education, Health and Nutrition, now called Oportunidades) programme show that cash transfers, conditional on children’s regular school attendance and regular visits to health centres, increased food consumption and improved dietary quality. This was partly because beneficiary households were able to allocate additional resources towards more diverse foods (Fernald et al., 2008; Hoddinott & Skoufias, 2004). Reviews of conditional cash transfer programmes likewise find that improvements in nutritional outcomes are greatest when income support is combined with health, nutrition and dietary-diversity interventions (Leroy et al., 2009). India’s PDS and PMGKAY, by contrast, are predominantly cereal-based in-kind transfers. Their central contribution is therefore to protect a calorie floor and ease household food-budget constraints. However, their limitation is that they cannot, on their own, fully address protein adequacy or dietary quality.
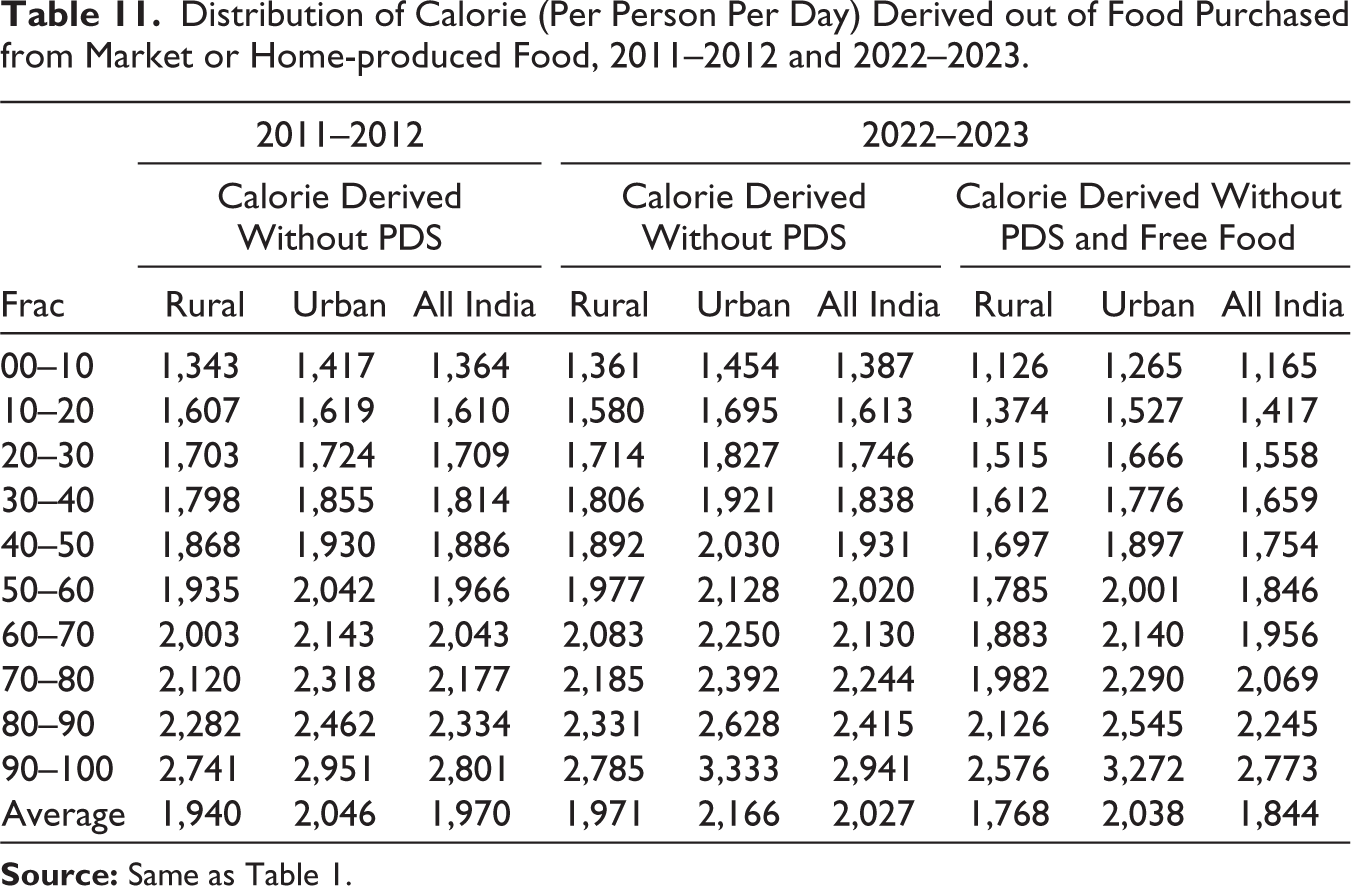
Calorie intake from the market purchases and home-grown food items declined between 2011–2012 and 2022–2023, reflecting the increased availability of free food. Table 11 shows that in the absence of PDS and free food, all households in rural areas and the bottom 80% of households in urban areas would have actually consumed fewer calories in 2022–2023 than in 2011–2012. The decline was more pronounced in rural areas, particularly among the lower deciles, which experienced the largest reduction in calorie consumption. This highlights the importance of PDS and PMGKAY in ensuring food security in the country.
Distribution of Calorie (Per Person Per Day) Derived out of Food Purchased from Market or Home-produced Food, 2011–2012 and 2022–2023.
As cereals remain the biggest source of both calorie and protein intake in the typical Indian diet, it is essential to assess the implications of food subsidies on protein adequacy. In 2022–2023, cereals accounted for 47% of total protein intake nationally. Our decomposition analysis shows that protein trends closely mirror calorie patterns. When we net out the protein received from the subsidized cereals received under PDS and PMGKAY, the per capita protein intake in 2022–2023 falls below the 2011–2012 levels. This decline is observed across all expenditure deciles in rural areas and the bottom five deciles in urban areas (Table 12).
Distribution of Protein (Per Person Per Day) Derived out of Food Purchased from Market or Home-produced Food, 2011–2012 and 2022–2023.
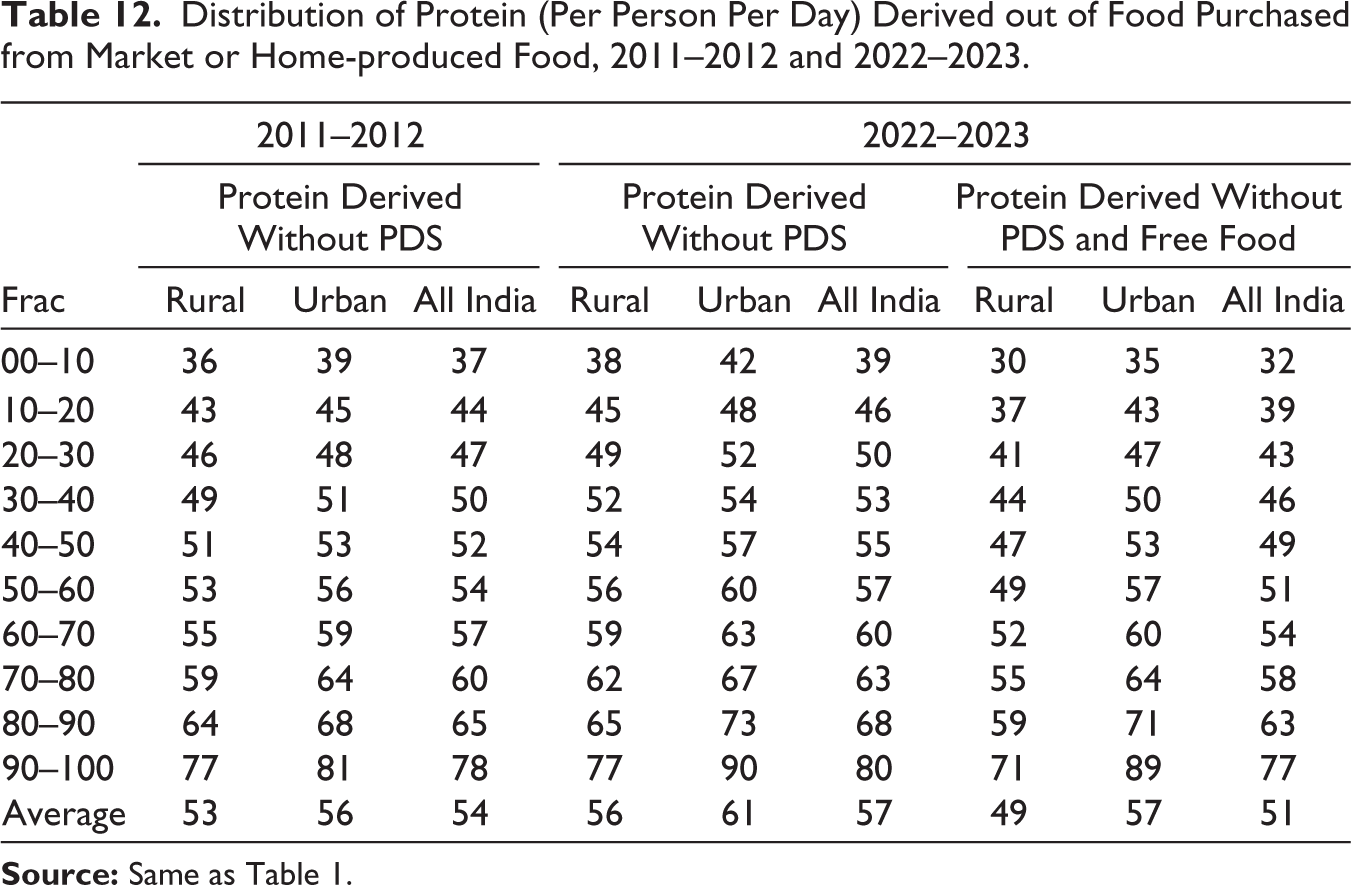
In other words, the apparent rise in total calorie and protein consumption over the decade is largely driven by safety-net programmes. Without these interventions, most households would be consuming fewer calories and protein today than a decade ago, despite higher real income.
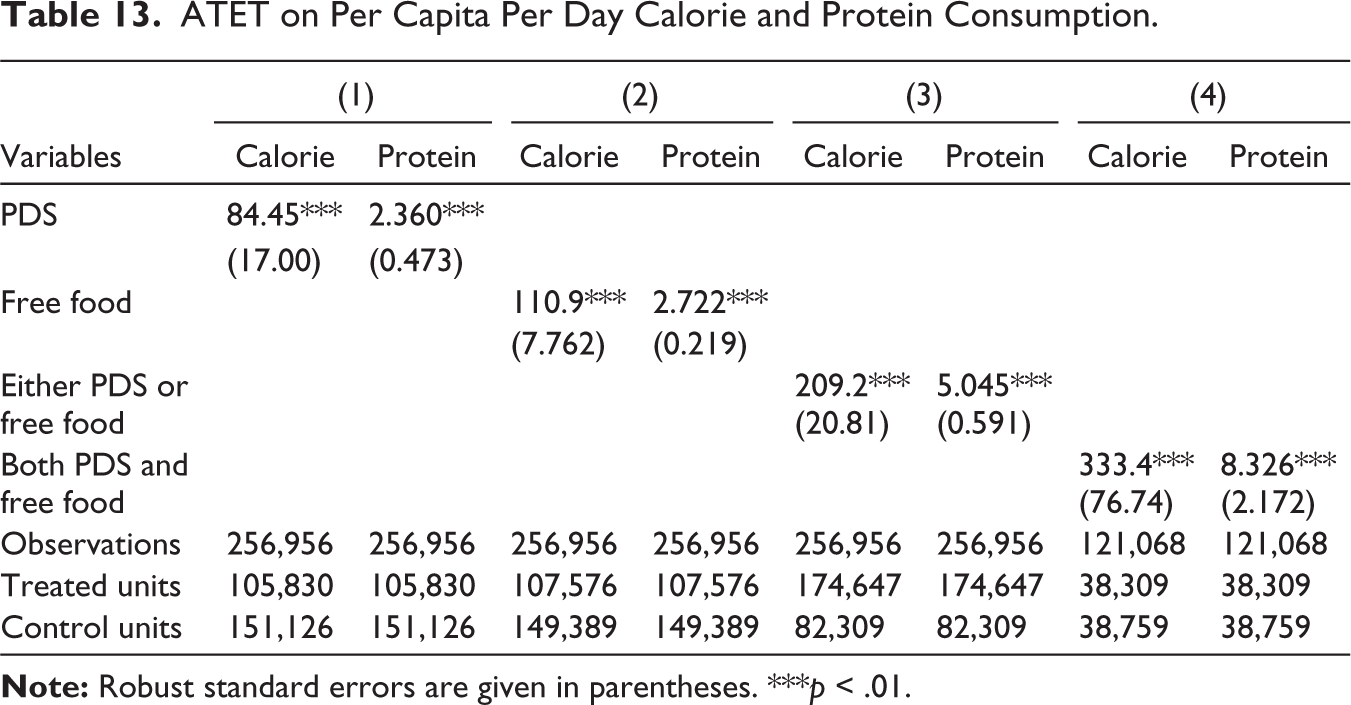
To support the above analysis, and to avoid the selection bias problem in assessing the impact of PDS and PMGKAY, the average treatment effect on treated (ATET) for per capita per day calorie and protein consumption is estimated using the IPW method while controlling for important covariates. The robust standard errors are used in the estimation.
Table 13 reveals that a household receiving subsidized food through PDS, on average, consumes 84.45 kcal more and 2.36 g more protein per person per day compared to non-PDS beneficiary households. 7 Similarly, a household receiving free food through PMGKAY consumes, on average, 111 kcal more calories and 2.72 g more protein per person per day than a household that is not a beneficiary of free food. Households receiving either benefit consume 209 kcal more calories and 5.04 g more protein than households receiving neither. More importantly, households receiving both PDS and free food consume around 333 kcal more calories and 8.36 g more protein per person per day than households receiving neither benefit. All the coefficient values reported in the table are significant at the 1% level of significance.
ATET on Per Capita Per Day Calorie and Protein Consumption.
The above finding is corroborated by a few other recent studies, too. Himanshu et al. (2025) document a marked decline in the growth rate of real monthly per capita expenditure (MPCE) between 2011–2012 and 2022–2023, compared to the earlier period of 2004–2005 to 2011–2012. Similarly, GDP growth declined from an annual average of 6.9% between 2004–2005 and 2011–2012 to 5.7% during 2011–2012 and 2022–2023.
Wage growth also fell across major occupational categories during 2011–2012 and 2022–2023. According to Himanshu et al. (2025), the growth rate of real wage for agricultural as well as rural workers, casual labour, self-employed individuals and regular wage earners slowed down after 2011–2012. For instance, the real wage of field labourer grew at 5.94% annually between 2004–2005 and 2011–2012, but this dropped to just 1.3% between 2011–2012 and 2022–2023. Similarly, the real wage growth of agriculture occupations such as ploughing and harvesting, as well as for unskilled rural workers, also declined from 4.13% to 2.3% per year during the two time periods (Wage Rate of Rural India data). The NSSO surveys reinforce this trend, showing real wage growth rate of all paid workers falling from 4.8% in the earlier to just 1.1% per annum in the post 2011–2012 period (Wage Rate of Rural India data, p. 40).
The income of agricultural workers also witnessed a sharp slowdown. Using NITI Aayog’s methodology and National Accounts Statistics data, Himanshu et al. (2025) report a decline in agricultural household’s income growth from 7.5% to 1.2%. Alternative data from the NSSO’s Situational Assessment Survey of Agricultural Households show growth of income from cultivation falling from 4% in the pre-2011–2012 period to −1.25% in the subsequent period. Even after including livestock income, the total agriculture income growth rate declined from 5.4% to just 0.86% during the two time periods. This decline is not limited to the rural areas. Earnings in self-employment activities in urban areas in the non-agriculture sector also declined more sharply than in rural areas (Himanshu et al., 2025).
Overall, a wide range of official and other data sources confirm a broad-based slowdown in income growth across all categories of workers. In most cases, real wage or earnings growth has been negligible or even negative after 2011–2012. In the sectors where growth persisted, it has been significantly lower than the same in preceding decades. These trends reinforce the counterfactual that, without subsidized foodgrains transfer via PDS and PMGKAY, calorie and protein consumption would have declined substantially, despite rising per capita income.
Conclusion
The study reveals a significant shift in dietary patterns in India, with increases in the consumption of pulses and nuts, vegetables and fruits, meat and eggs and miscellaneous food items, while cereals are decreasing.
The decline in the share of cereals in calorie and protein intake reflects a diversification of diets away from cereals. At the same time, government schemes such as the PDS and PMGKAY—which primarily provide cereals—played an enabling role in this diversification. By supplying cereals at subsidized or zero prices, these programmes ease household food budget constraints. This budgetary relief allowed households to allocate more funds to other food items (such as pulses, milk, eggs and vegetables), thereby increasing overall calorie and protein intake, even as the share of cereals within that intake declined. In other words, subsidized cereal provision freed up resources for diversification.
The PDS and PMGKAY have played a critical role in sustaining adequate calorie and protein intake. These schemes have helped to maintain calorie and protein intake across all income groups in rural areas and the bottom 80% of the population in urban areas. Without these schemes, the average calorie and protein intake for these households would have declined in 2022–2023, emphasizing the importance of these schemes in promoting nutritional well-being.
At the same time, it is important to acknowledge the limitations associated with the comparability issue of HCES 2022–2023 with earlier consumption expenditure surveys. Concerns have been raised that the revised sampling strategy may have included a higher proportion of better-off households in both rural and urban areas. If so, this change could result in an upward bias in consumption and nutritional estimates, thereby overstating improvement relative to earlier rounds. While this limitation warrants caution in interpreting intertemporal changes in absolute levels of consumption, it does not undermine the central finding regarding the protective role of the PDS and PMGKAY in preventing decline in calorie and protein intake among vulnerable households.
Furthermore, the findings indicate that the decline in calorie consumption observed until 2009–2010 was not a voluntary adjustment resulting from reduced energy requirements due to mechanization and automation of work. Instead, it was primarily driven by a decline in the real income of the masses. If reduced physical effort was the main factor, the subsequent increase in calorie consumption observed in later years should not have occurred.
These findings strongly support the ‘income deflation’ and ‘budget squeeze’ arguments as a key driver behind the decline in calorie intake up to 2009–2010. Moreover, these factors continue to exert influence even in the counterfactual present, further affirming the critical importance of targeted food-security interventions such as PDS and PMGKAY in sustaining nutritional welfare.
India’s experience both resembles and diverges from the nutrition-transition patterns documented in China, Brazil, Mexico and other lower-middle income economies. The decline in cereal shares and the rise in fat and non-cereal food consumption are consistent with the broader shift towards diversified diets described in Popkin (2003) and Du et al. (2004). However, in India, the recovery in calorie and protein intake depends substantially on public food transfers, rather than income growth alone. This suggests that, under conditions of slow real-income growth and persistent undernutrition, cereal-based transfers can prevent a decline in nutritional intake. At the same time, a more diversified food-security architecture is needed to address protein and micronutrient deficiencies.
Overall, the study underscores the need for continued efforts to address food insecurity and nutritional disparities in India. It is imperative that economic growth translates into improved nutritional outcomes for all segments of the population, particularly the most vulnerable groups.
Footnotes
Declaration of Conflicting Interests
The authors declared no potential conflicts of interest with respect to the research, authorship and/or publication of this article.
Funding
The authors received no financial support for the research, authorship and/or publication of this article.