






Abstract
Abstract
We briefly review the current trend in handling the neonatal baby weight, gestational age, and other related categorical and continuous variable data, through both robust and outlier-based methods. Graphs are generally presented as smooth curves which give a wrong visual impression and totally hide the actual variability of the data, robust methods are applied without considering that they may certainly be affected by asymmetrical contamination, and the outlier-based methods are incorrectly applied without ascertaining if the individual data arrays are normally distributed, free from discordant observations.
Aim: To demonstrate our new procedure for handling of neonatal baby data from two case studies.
Methodology: The univariate data were handled through the application of discordancy tests in the light of new precise and accurate critical values, and significance tests were applied to both original and discordant outlier-free data arrays. The bivariate data were also handled from identifying and separating discordant outliers and reporting the quality of the coefficients in terms of standard errors. Finally, the supervised multivariate technique of linear discriminant and canonical analysis is successfully applied.
Results: The results of significance tests for some cases varied from the use of all data versus censored data. The identification and separation of bivariate discordant outliers drastically improved the quality of regression lines. Linear discriminant and canonical analysis provided high success values for laboratory-controlled experiments.
Conclusion: The need of obtaining both central tendency and dispersion parameters in all medical data is established. The reporting of regression coefficients with individual errors is recommended.
Keywords
Introduction
The relationship and statistical treatment of neonatal baby birth weight and other characteristics with gestational age and other explanatory factors has been the subject of research at least since 19001-4 and is so even today.5-8 The emphasis of such studies has been on charts of birth weights and gestational age as well as graphs of actual and smooth percentile curves.8-20 The central tendency and dispersion parameters were often represented by the mean and standard deviation, respectively, without any prior statistical treatment of the data.3, 4, 6, 11-14, 19-27 Linear and polynomial regression equations were also reported in some studies.3, 4, 6, 14, 26, 27 Diagrams showing bivariate relationships were presented without reporting any regression equations.5, 15, 16, 18-24, 28 Statistical tests, such as the t test, were applied in some studies to draw inferences.14, 17, 23, 24
The main deficiency concerning the statistical treatment of these data seems to be the lack of application of modern discordancy tests29-37 in the handling of univariate, bivariate, or multivariate data, because no commercial software is available for this purpose. However, appropriate software, such as UDASys2 (Univariate Data Analysis System version 2), 34 UDASys3 (Univariate Data Analysis System version 3), 35 BIDASys (Bivariate Data Analysis System), 36 and DOMuDaF (Discordant Outliers from Multivariate Data from the F test of w), 37 have been recently developed and published to facilitate these applications.
Not only the mean and standard deviation values are affected by the presence of discordant outliers but also the so-called robust parameters such as the median, including the percentiles, are prone to them.34, 35, 38-40 In one study, 11 outlying observations were identified but not from the modern tests based on new precise and accurate critical values and those having the best performance (highest power of test and lowest masking and swamping effects).29, 33-40
The other problem is with the reporting of regression equations, in which the coefficients are dealt with as constants, i.e., without any error or uncertainty.3, 4, 6, 14, 26, 27 Commercial software, such as Statistica, and freely available programs, such as BiDASys, 36 can provide the standard errors or uncertainties on these coefficients.
In this work, we briefly comment on the computer programs available at the web portal
Recent Advances in Statistical Handling of Data
We emphasize that the univariate data are not being handled correctly, because the outlier-based central tendency (mean) and dispersion (standard deviation) parameters are used, without considering the fact that the mean and standard deviation belong to the category of outlier-based methods and are highly influenced by the presence of outlying observations.29, 39, 40 The application of the significance tests (F, t, and analysis of variance [ANOVA]) also requires that the individual statistical samples under evaluation be normally distributed, free from discordant observations. It is of utmost importance that discordant observations be objectively identified and separated by appropriate statistical procedures. 29 The reasons for discordancy should be sought for.
Both versions of a computer program UDASys (UDASys2 34 and UDASys3 35 ) apply recursive tests41-43 with prior application of single-outlier discordancy tests,29, 44, 45 all with new, precise, and accurate critical values.34, 35, 46-49 The application of significance tests (F, t, and ANOVA) also requires the normality of the statistical samples, which can be achieved through discordancy tests from any of the 2 versions of UDASys, prior to the inference about similarities or differences between or among statistical samples. Thus, the discordancy tests can be applied to samples of sizes as large as 30,000 and significance tests to the number of sample groups as large as 30. The main difference between the 2 versions of UDASys is that UDASys3 is more automatized than UDASys2 for the handling of multivariate data of geochemical reference materials.
Bivariate data can be adequately handled from the online program BiDASys. 36 This program provides an innovation through the identification and separation of bivariate outliers 29 for bivariate data arrays as large as 1,000 and the provision of uncertainty-weighted linear regression (UWLR), although the latter can be applied only when errors on the individual data are available. Unfortunately, this is not the case in most studies in medical research because individual errors or uncertainties are seldom reported.
The handling of multivariate data could also be benefitted from the validity of the assumption of multinormality, 50 which can be achieved from DOMuDaF 37 in sample sizes up to 30,000.
We will highlight the use of these programs in 2 case studies. To reduce type I error, all tests will be applied at the high confidence level of 99%,34, 35 rather than the commonly used 95%. 51
The First Case Study
The North Carolina medical data were downloaded from the website
Univariate Data
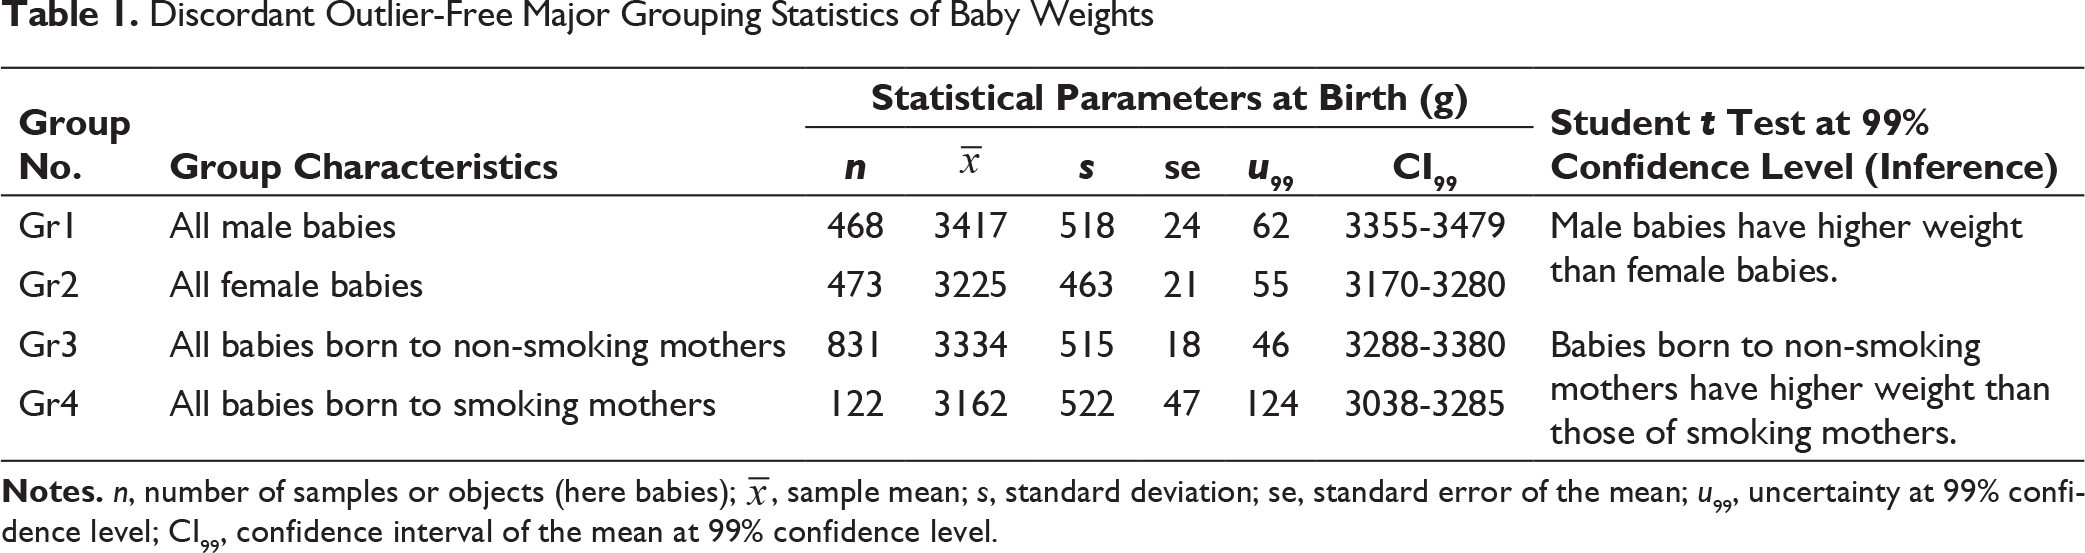
We divided the database into 2 sets, each of 2 groups (Gr1-Gr2 and Gr3-Gr4; Table 1) and then used UDASys to interpret the data. Univariate outlying observations were identified and separated from each group and the remaining censored outlier-free data (nmale = 468; nfemale = 473; Table 1) were processed in UDASys. The mean
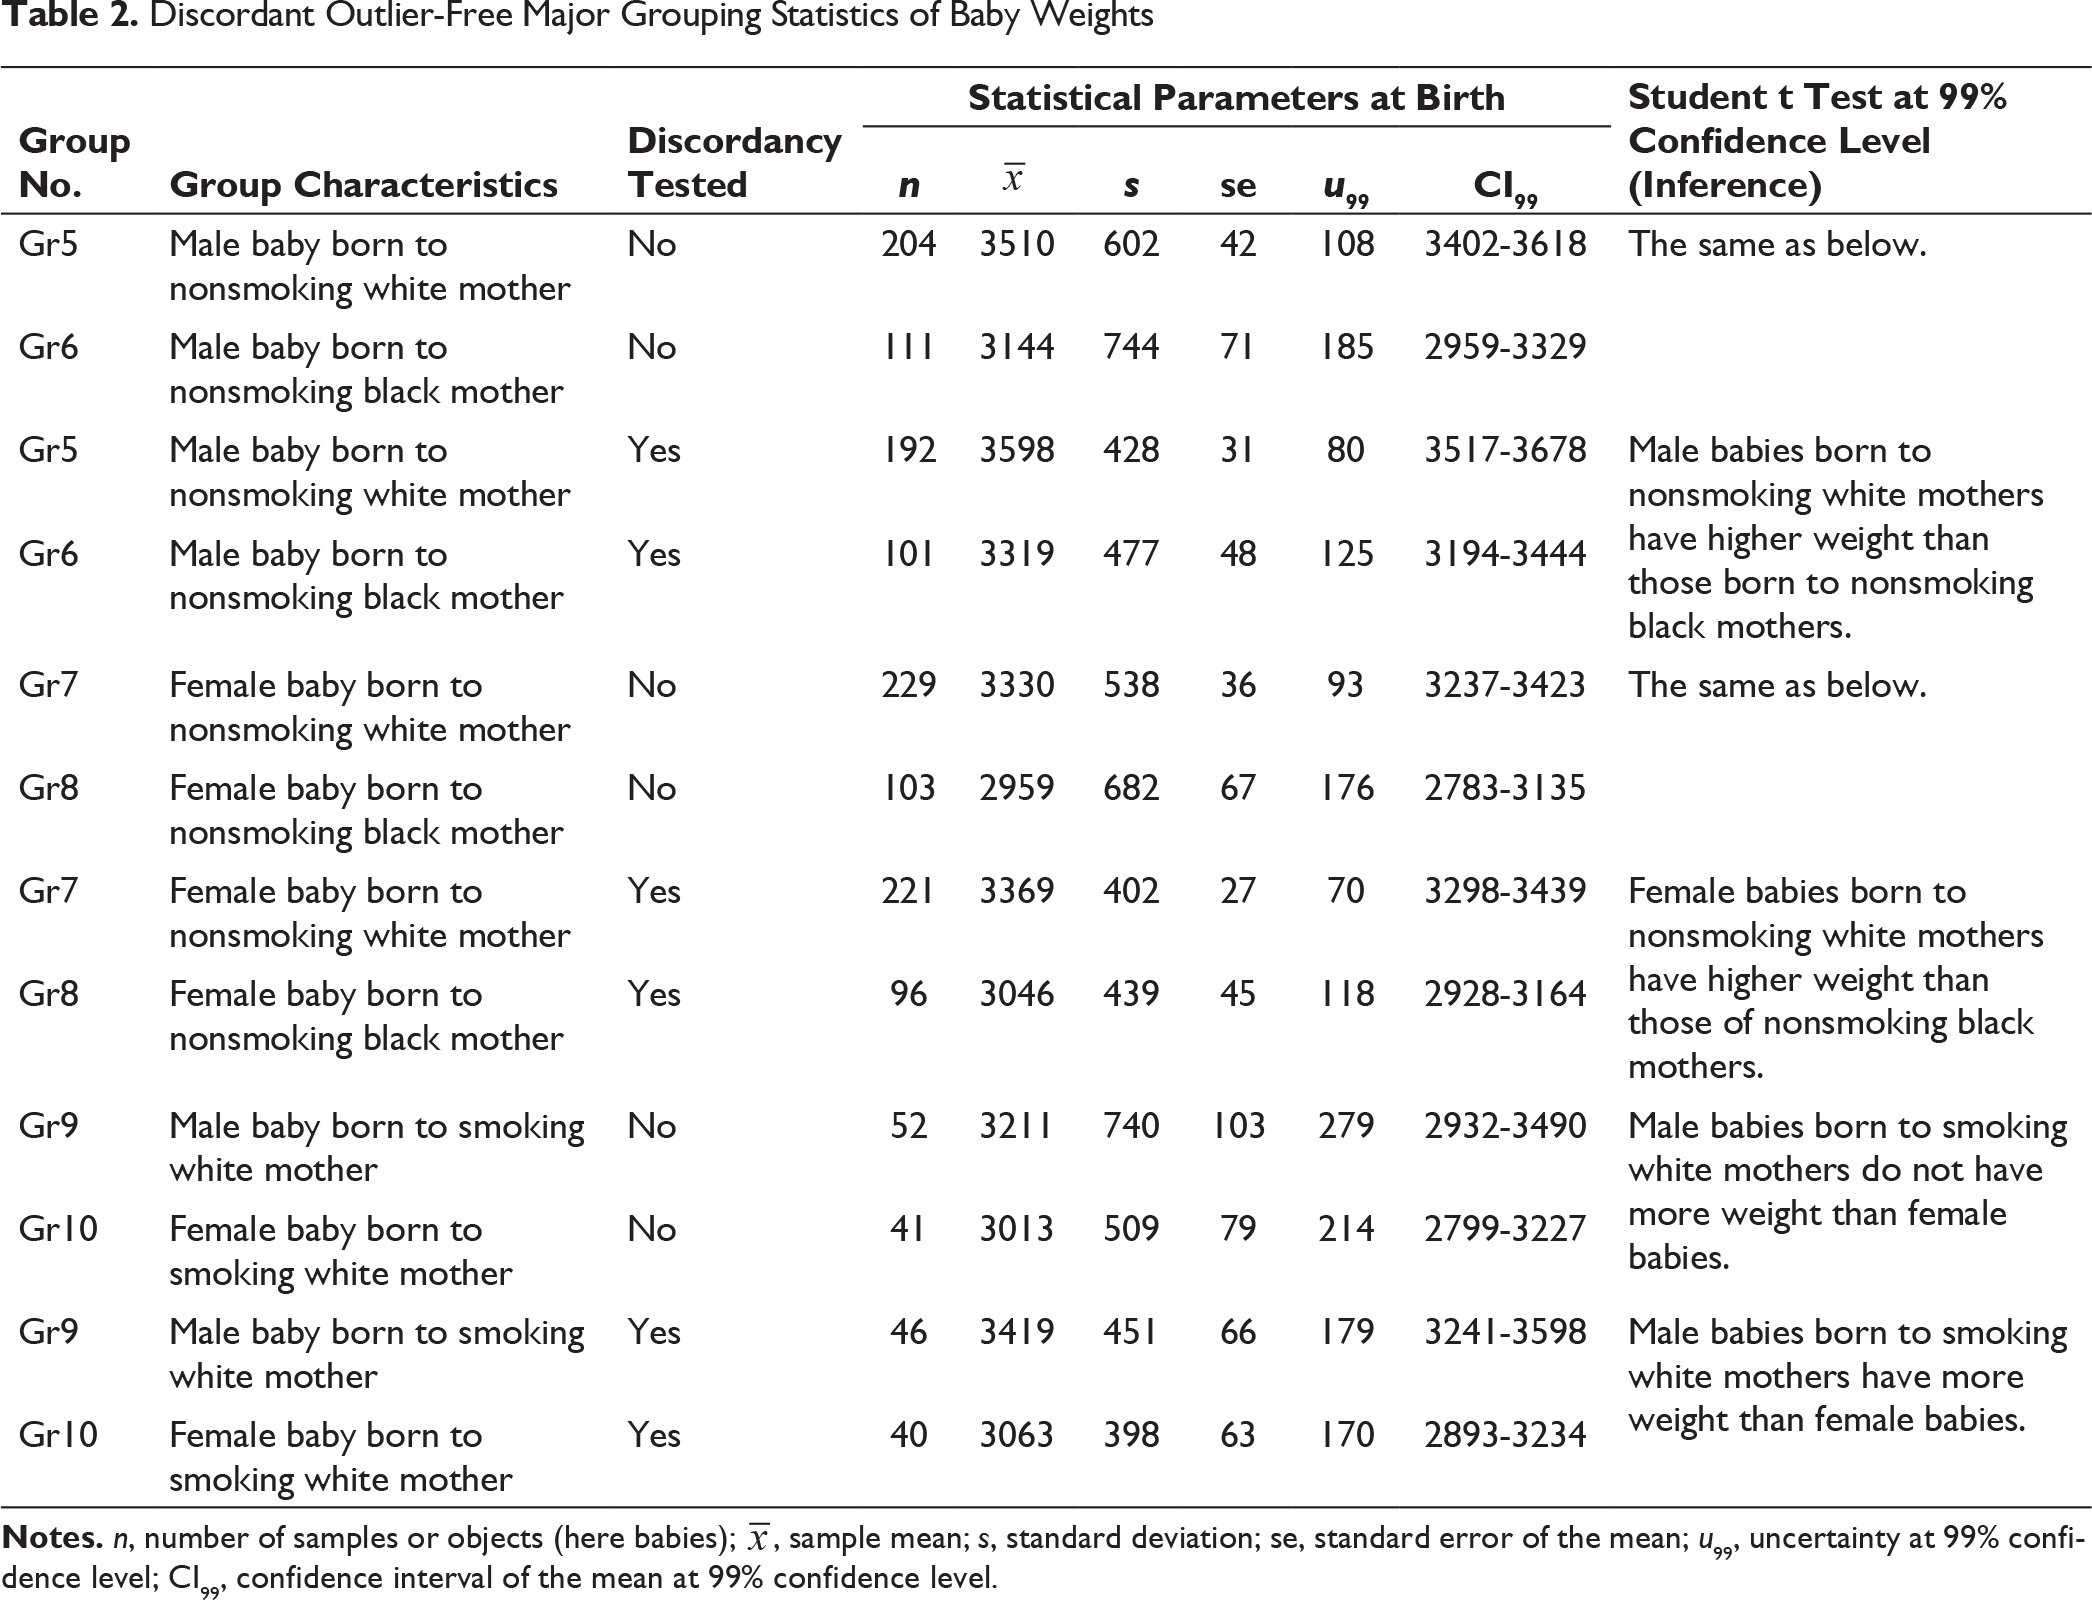
We then subdivided the data into 6 groups (Gr5 to Gr10) and processed them in UDASys (Table 2). We decided to process both sets of data (original and discordant outlier-free data) to highlight the importance of discordancy or fulfillment of the normality assumption. The following inferences were drawn from Student t test (Table 2): Gr5 to Gr6 male babies born to nonsmoking white mothers have higher weight than those born to nonsmoking black mothers, for both sets; Gr7 to Gr8 female babies born to nonsmoking white mothers have higher weight than those born to nonsmoking black mothers, for both sets; Gr9 to Gr10 male babies born to smoking white mothers have more weight than female babies for discordant outlier-free data but not for the original data. Thus, the fulfillment of the assumption of normality changed the inference of the t test for the group pair Gr9 to Gr10.
Other combinations of tests are also possible, eg, Gr5 can be compared with other groups Gr7 to Gr10 and statistical inference can be drawn. For example, Gr5 to Gr7 would show that male babies born to nonsmoking white mothers have higher weight than female babies born to nonsmoking white mothers, from both sets (original and censored).
Discordant Outlier-Free Major Grouping Statistics of Baby Weights
Discordant Outlier-Free Major Grouping Statistics of Baby Weights
Bivariate Data
The errors or uncertainties on any of the individual data (gestational age, mother or father age, and baby weight) are not traditionally reported, eg, gestational age at baby birth traditionally reported cannot be an integer number in weeks; besides, it may not have zero error or uncertainty because the exact date of the last menstruation may not have been known to all mothers. Therefore, we can only evaluate the data from the ordinary least-squares linear regression (OLR) model.
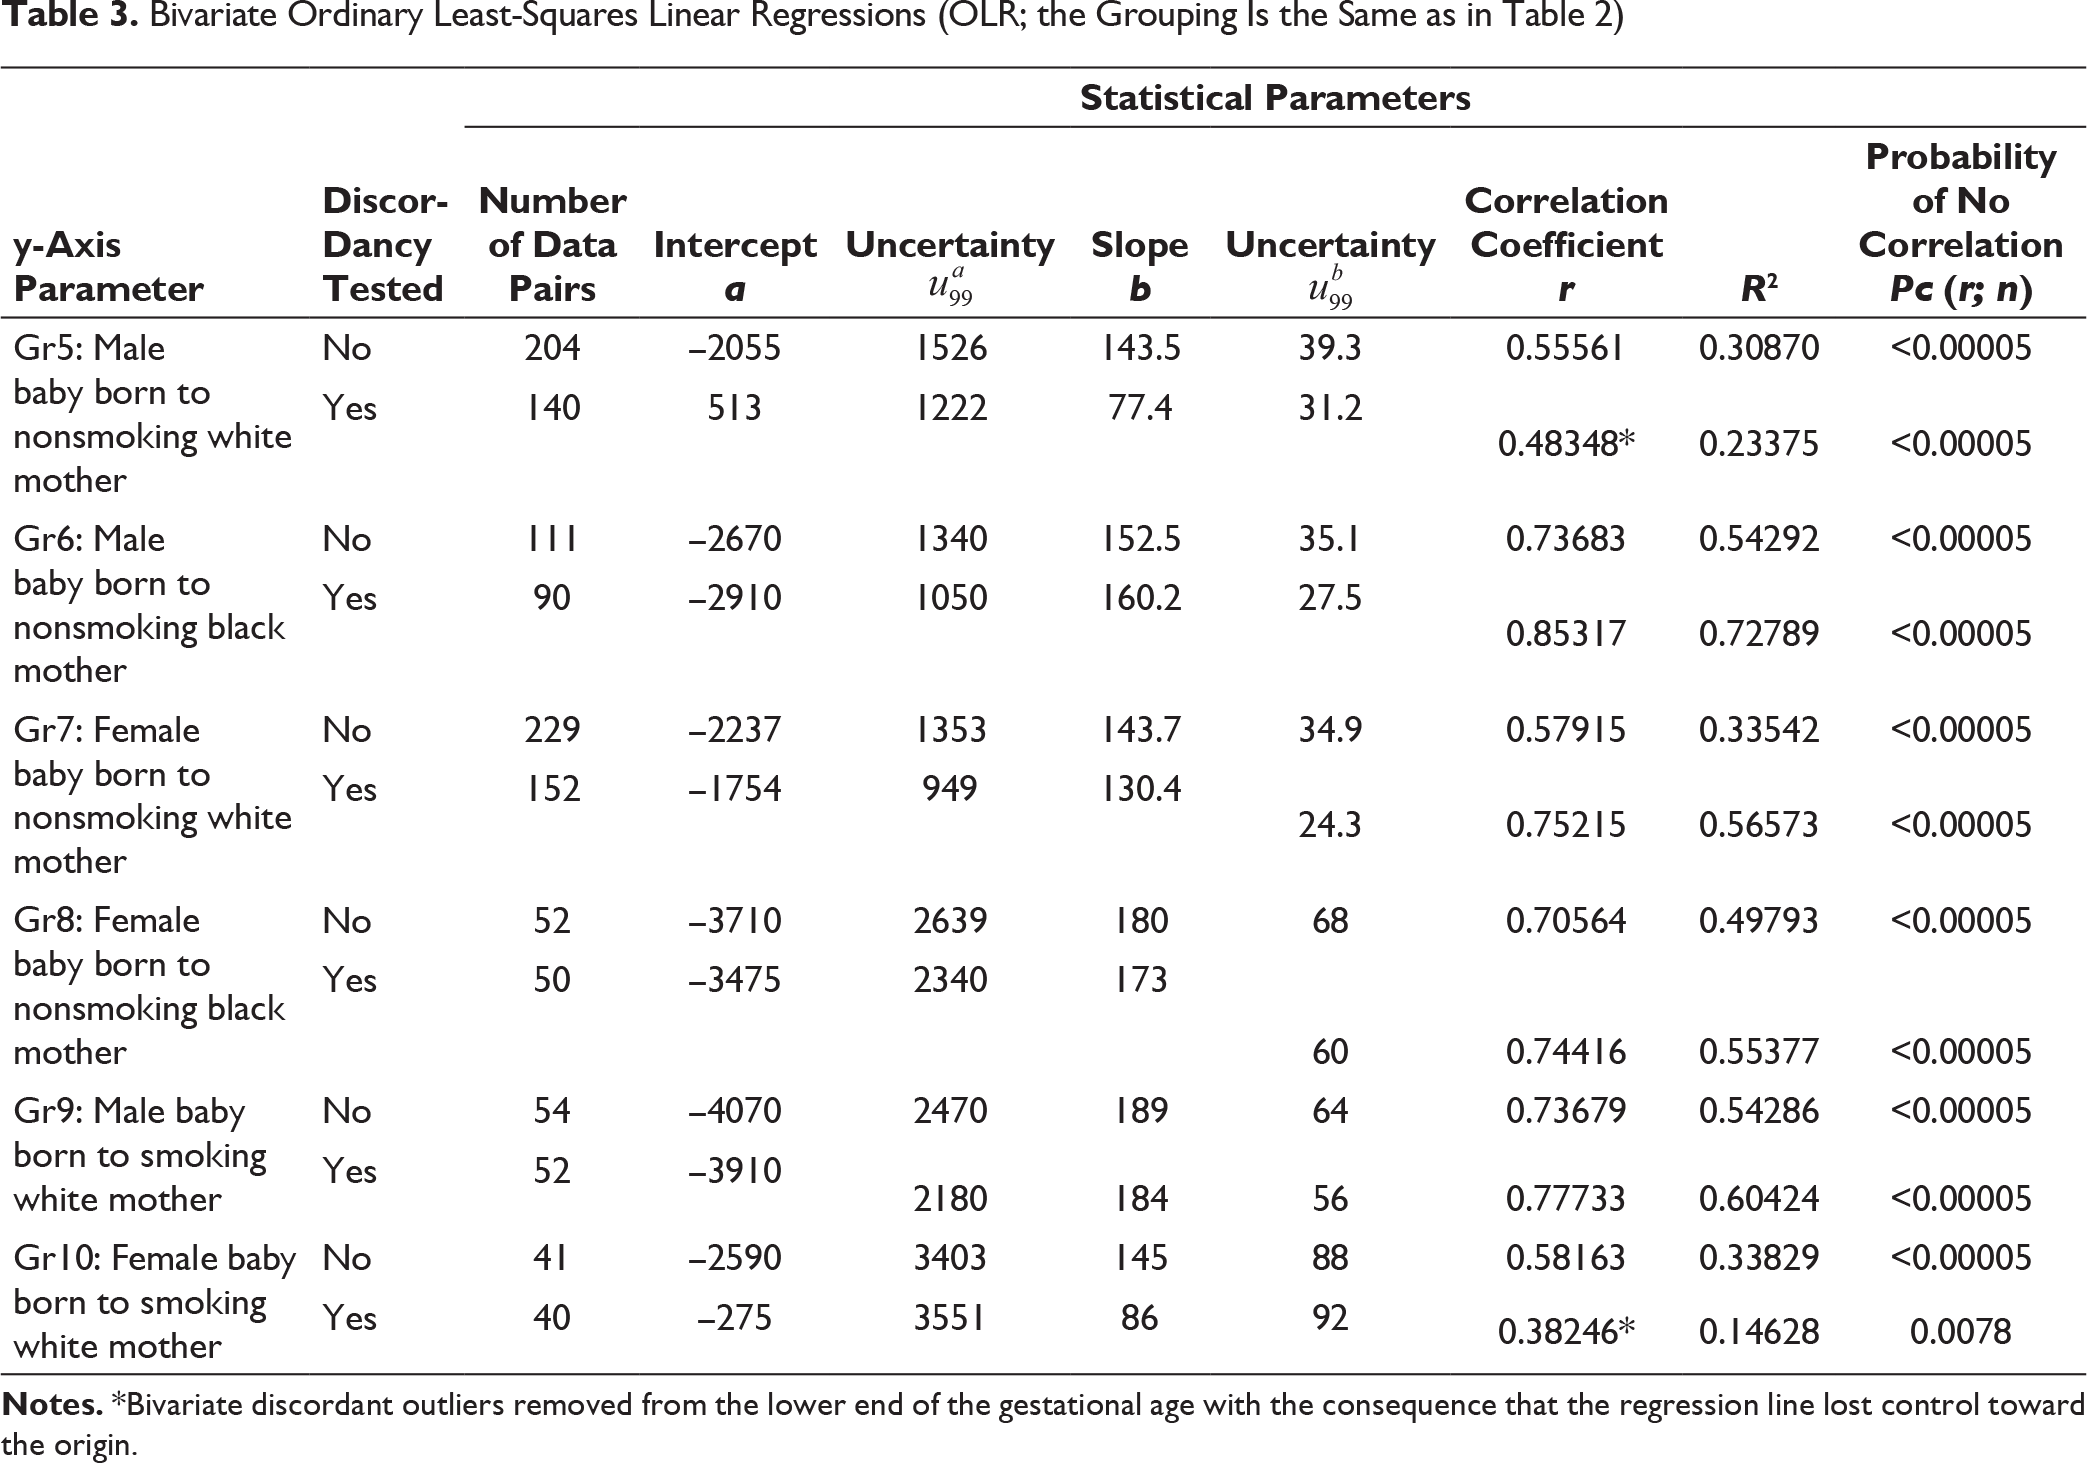
We explored the purely bivariate relationships of gestational age (Gage) and baby weight (Wbaby) for different sets of data in Gr5 to Gr10. All regressions from both the original and the censored data are statistically significant at the 99% confidence level (Table 3).
For example, the original complete data for Gr5 “male babies born to nonsmoking white mothers” BiDASys gave the following valid regression equation with statistically significant
52
linear correlation coefficient r = 0.55561:
The discordant outlier-free data for Gr5 provided the following regression equation (r = 0.48348):
Note the unusual result of lower r value in Equation (2) as compared to Equation (1). The examination of discordant observations showed that they were preferentially removed from the lower gestational age values. Consequently, the regression equation (Equation [2]) lost control on the lower end of the line toward the origin, making the r values lower than the original dataset. This situation also existed with the data of Gr10. In any case, the Gage as the x-variable will lack data from the lowest Gage value to the origin.
For the other 4 groups (Gr6 to Gr9), the bivariate discordancy tests increased the r values (as expected) and reduced the uncertainty of both intercept and slope variables (Table 3). These 4 groups, after separating the discordant bivariate data, showed higher r values (0.74416-0.85317; Table 3) than Gr5 and Gr10.
Bivariate Ordinary Least-Squares Linear Regressions (OLR; the Grouping Is the Same as in Table 2)
Multiple Linear Regression
We used commercial software Statistica® (Tibco Software, Inc., USA, since May 15, 2017;
As an example, we obtained the following equation for Gr5 data (multiple
Of the 5 explanatory variables, only 1 (
As another example, the multiple linear regression to the data for Gr6 showed that the highest multiple r was obtained from 4 explanatory variables (without
In this example also, only 1 variable (
Multiple Polynomial Regression
As done for the multiple linear regression, polynomial regression could be applied to the data of this case study. As an example, we applied polynomial regression to Gr6 (Table 3) and observed that the highest multiple r was obtained from 4 (not 5) explanatory variables, according to the following equation (multiple
Only one variable (
Linear Discriminant Analysis
The complete multivariate data were processed in the linear discriminant analysis (LDA) module of Statistica. Our aim for illustration purposes was to find out if a linear discriminant function could be proposed that will predict if the mother of a singleton baby was a nonsmoker or smoker. We evaluated all 6 explanatory variables (
Because the LDA assumes multinormality, the 4 variables for individual groups were processed in DOMuDAF to test multinormality and identify multivariate discordant outliers. The discordant outlier-free data were used once again for the LDA and canonical analysis. The overall success increased as compared to the use of the original data (to about 63.4% versus 62.0%). The corresponding discriminant function was as follows:
Because of the generally low success values in this case study, we will not consider the result for future applications.
The Second Case Study
Original hand measurement data at birth for babies born in a hospital in Lille, France, were reported for 2 groups (Gr11 and Gr12) of estimated gestational ages in weeks (EGA or
Now, because the number of samples in each group was very small (only 25 and 36 in Gr11 and Gr12, respectively; a total of 61), we did not separate the male and female babies for this analysis, although it should always be done when the number of samples is sufficiently large.
From the experimental point of view, we emphasize that the individual hand measurements (7 variables; Table 4) should be repeated several times, preferably by different individuals, and both central tendency and dispersion parameters should be reported. Baby weights should also be determined more than once. Here also, UDASys could be of immense help for obtaining central tendency and dispersion estimates of the initial variables, free from the discordant observations.
Univariate Data
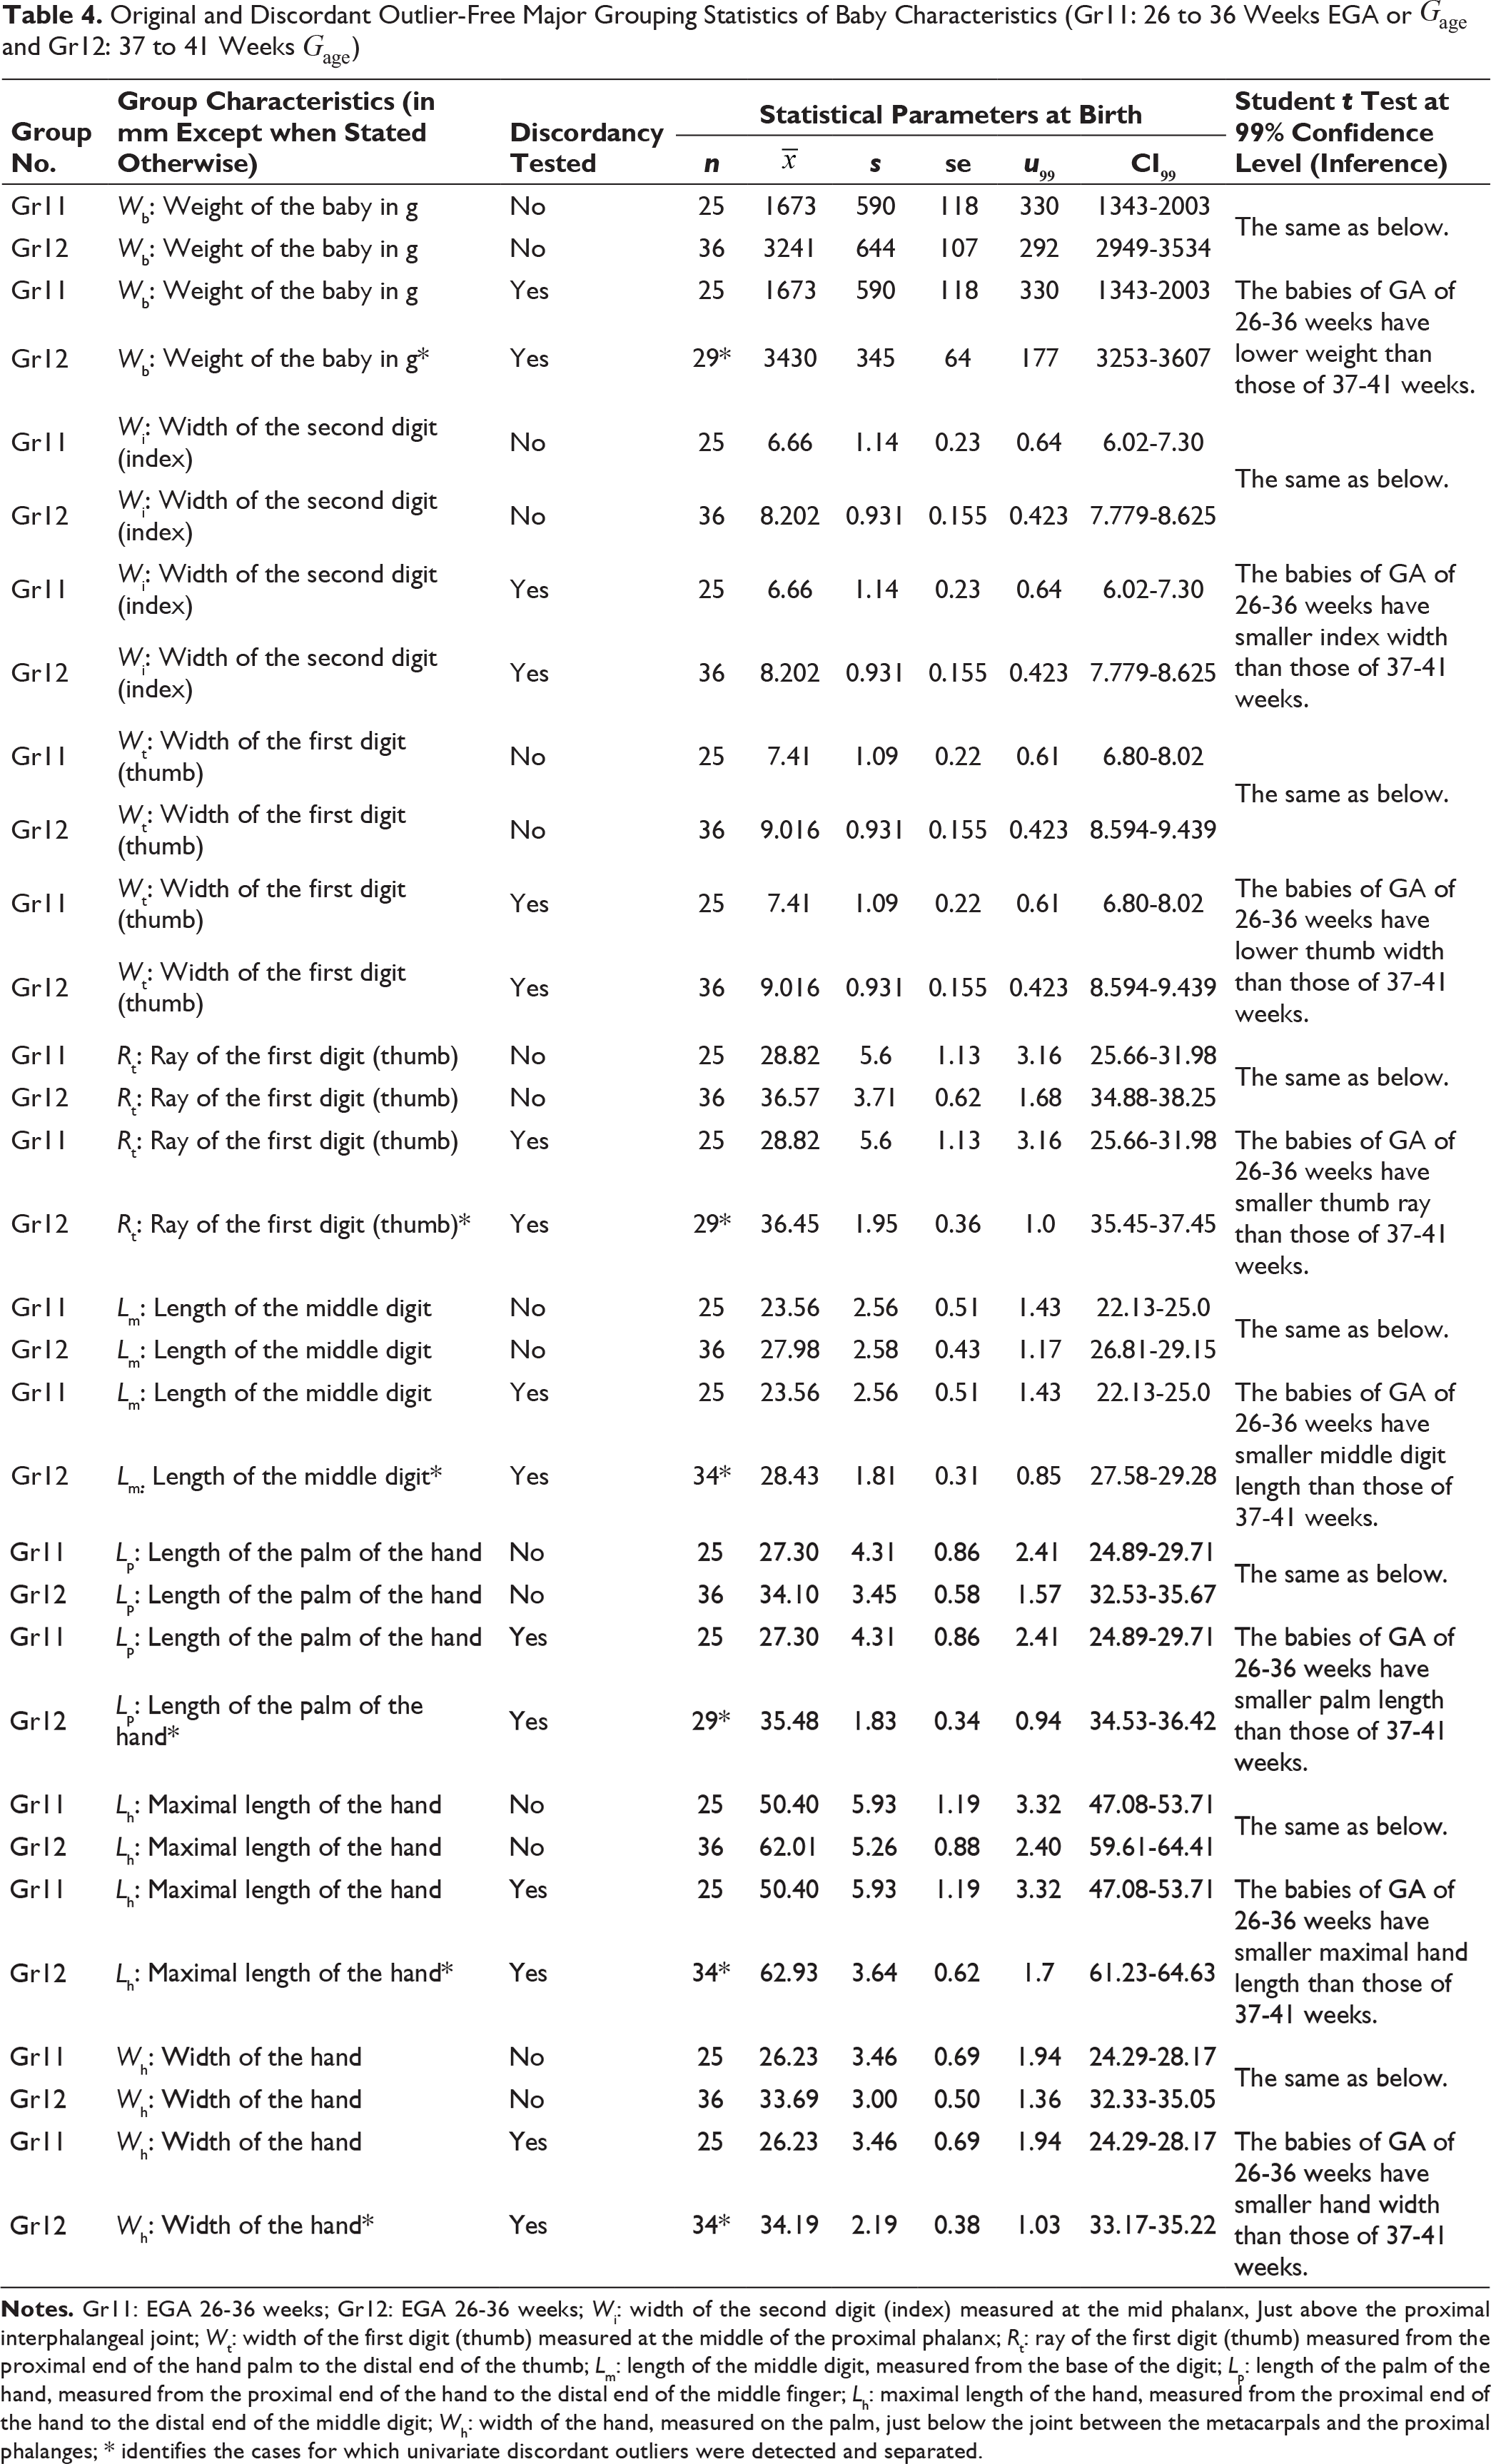
UDASys was used to process the baby characteristics (1 weight and 7 different hand measurements) as univariate data for both sets (before and after of the application of discordancy tests; Table 4). Gr11 did not show any discordant outliers for any of the 8 variables, whereas Gr12 showed them for 6 out of 8 variables (identified by an asterisk in Table 4), for which the mean values changed (decreased or increased) and the dispersion parameters significantly decreased as compared to the original data.
Original and Discordant Outlier-Free Major Grouping Statistics of Baby Characteristics (Gr11: 26 to 36 Weeks EGA or
and Gr12: 37 to 41 Weeks
)
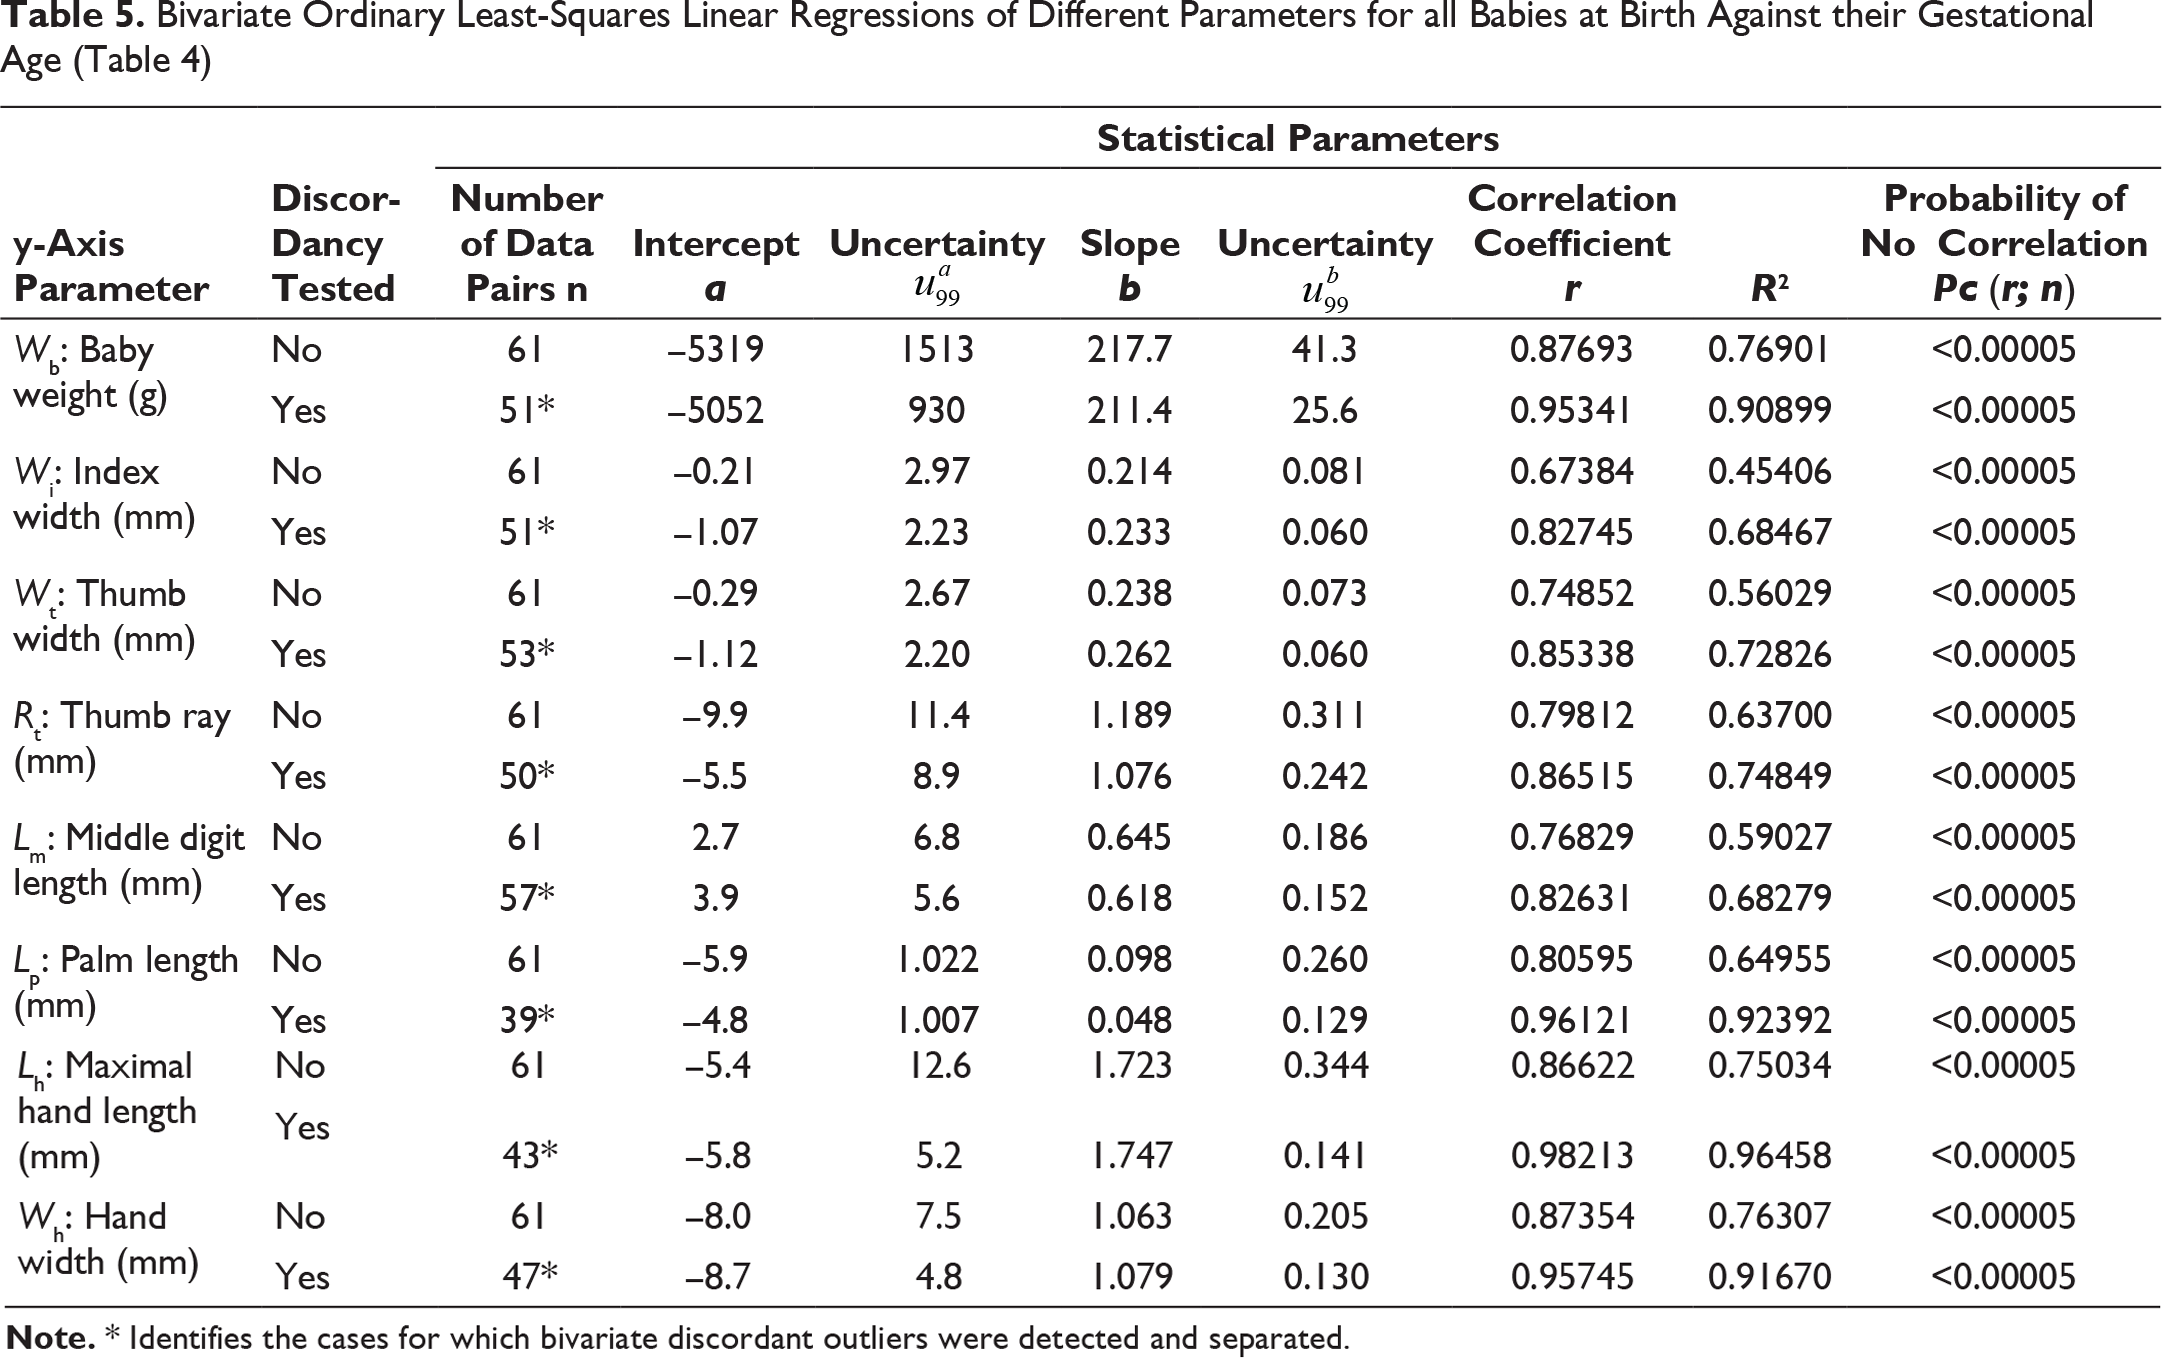
Bivariate Ordinary Least-Squares Linear Regressions of Different Parameters for all Babies at Birth Against their Gestational Age (Table 4)
Bivariate Data
The OLR model was used to evaluate bivariate relationships of the 8 variables (1 weight and 7 hand measurements) with
Multiple Linear Regression
If we were to explore the relationship (or dependence) of baby weight with other continuous variables, this case study is not useful, because only one explanatory variable (
Polynomial Regression
As an example, the linear and polynomial regressions (Equations [7] and [8]) for the baby weight (
The inclusion of a square term increased the
Linear Discriminant Analysis
The LDA and canonical analysis were applied through Statistica to the complete dataset with the
From 6 explanatory variables (Wb, Wi, Wt, Rt, Lm, and Wh), the percent success values (correct classification) for the 2 groups Gr11 and Gr12 (Table 4) were 96% (24 correctly classified out of 25) for the first group (Gr11) and 86% (31 correctly classified out of 36) for the second group (Gr12). Because the individual groups should be multinormally distributed in the space of these 6 variables (Wb, Wi, Wt, Rt, Lm, and Wh), DOMuDAF was used to evaluate multinormality. The results showed that the complete dataset complied with multinormality, ie, there were no discordant outliers. Therefore, the above-mentioned results are statistically valid. The canonical analysis provided the following discriminant function
The discriminant scores (
Nevertheless, we clarify that we have only traced the methodology through which statistical interpretation and inferences could be achieved. The results would be much more useful if the database were representative of the problem at hand.
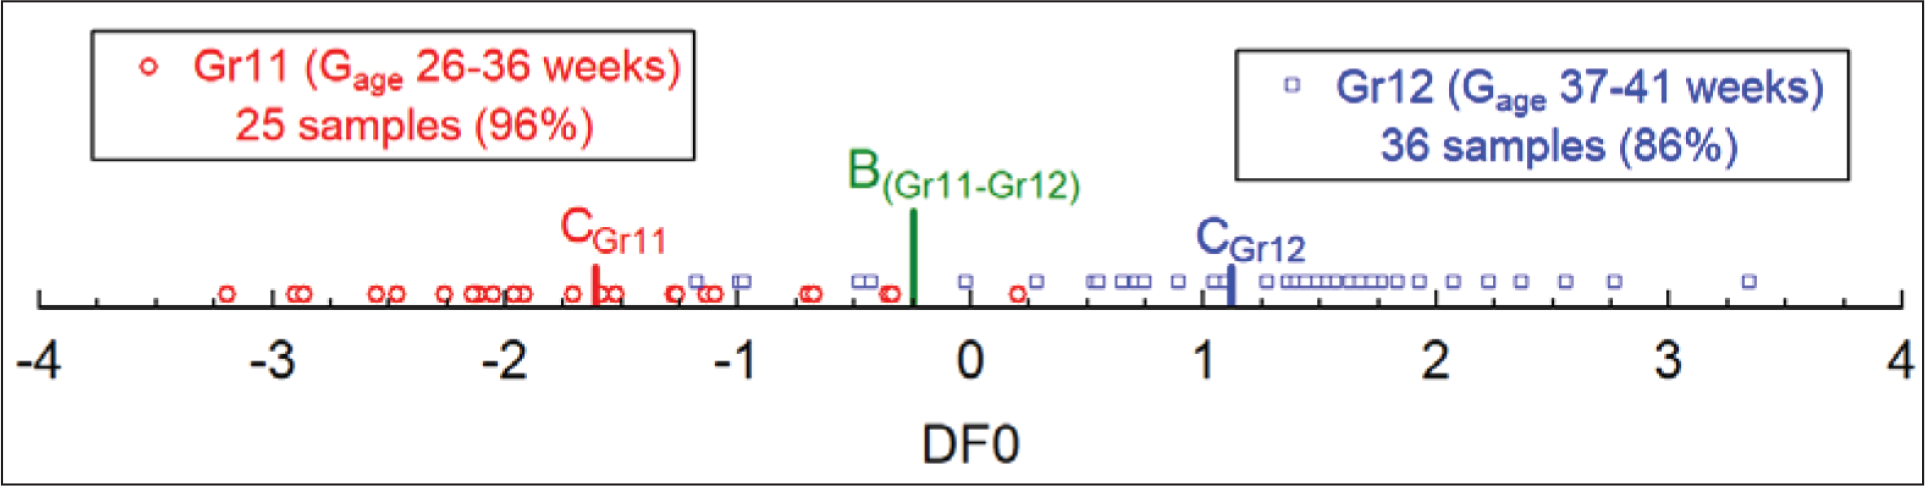
One-Axis Discriminant Function Diagram (DF0) for the Discrimination of Samples of the Second Case Study (Gr11 and Gr12). Gage: gestational age; CGr11: Gr11 centroid (–1.61376); CGr12: Gr12 centroid (1.12066); and B(Gr11-Gr12): probability-based boundary (–0.246546) dividing the two fields Gr11 and Gr12.
Discussion and Conclusion
It is generally believed that robust parameters are superior to the outlier-based methods, because the former can cope with or are immune to the presence of outlying observations. 55 However, recent precise and accurate experiment-compatible Monte Carlo simulations have shown that all robust parameters are affected by asymmetrical contamination, and outlier-based parameters, when correctly used from the application of appropriate discordancy tests (combination of single-outlier and recursive tests), and may provide better results (closer to the “truth,” which is fortunately known from the Monte Carlo simulations) than the robust parameters.29, 34, 35, 38-40, 49, 54
For the data summarized in Table 2, the mean values increased by about 1.2% to 6.5%, whereas the standard deviation and uncertainty values decreased by about 22% to 39% and 21% to 36%, respectively. Similarly, for the data of Table 4, the mean values changed from –0.3% to +5.8%, whereas the standard deviation and uncertainty decreased by about 27% to 47% and 24% to 40%, respectively.
Therefore, the use of mean and standard deviation (or uncertainty) parameters to express the central tendency and dispersion estimates is recommended only after the application of appropriate discordancy tests. Appropriate freely available computer programs (UDASys2 34 and UDASys3 35 ) were mentioned and used to illustrate the statistical methods.
For handling of the bivariate data, only the OLR could be used, although 2 types of regressions (OLR and UWLR) were mentioned in this article (see also BiDASys 36 ). For the UWLR, errors or uncertainty values are required for each bivariate data pair, which are not reported in any such medical study. However, the OLR method also assumes that the errors are only on the y-axis, the x-axis is error-free, and all errors are homoscedastic. 36 It is likely that none of these assumptions is fulfilled in the medical data interpreted in this article. Therefore, an attempt should be made to estimate errors on individual datum, which will enable us to eventually apply the recommended UWLR model.36, 54 Furthermore, this procedure will also allow us to design better experiments to reduce the errors and thus obtain valid inferences in future.
The multivariate data can be handled for multiple linear and polynomial regressions through commercial software, but the multivariate discordant outliers cannot be evaluated from modern discordancy tests in such software. Therefore, appropriate software for doing the combined job (multiple regressions and discordancy of residuals) is still required to be developed. Nevertheless, most evaluations showed that only the gestational age was statistically significant to explain the baby weight, although the use of all variables provided higher R2 value than the bivariate regression.
The LDA and canonical analysis constitute a powerful supervised multivariate statistical technique to put forth discriminant functions that can be used for future decisions or applications. Appropriate multivariate data are required on representative samples. In the first case study, the quality of individual data is not precisely known. Nevertheless, it is likely that the poor quality and associated high errors or uncertainties of these variables probably resulted in low success values, although the randomly chosen samples may certainly represent the human population of North Carolina.
The high success values provided in the second case study are interesting, but the small sample sizes are probably not representative of the population, not even in a single hospital in France. The second study, on the other hand, presented better controlled hand measurement experimental variables appropriate for the LDA and canonical analysis. Finally, we also stress that the multinormality assumption inherent to the LDA, and that canonical analysis can be easily fulfilled from the freely available computer program DOMuDAF. 37
Footnotes
Acknowledgements
This work was developed when the second author had a summer internship in Mexico at the Instituto de Energías Renovables of the Universidad Nacional Autónoma de México. She is thankful to her family for providing support for her stay in Mexico.
Declaration of Conflicting Interests
The authors declared no potential conflicts of interest with respect to the research, authorship, and/or publication of this article.
Funding
The authors received no financial support for the research, authorship, and/or publication of this article.
