
Abstract
Exclusive breastfeeding (EBF) is recommended for all infants, but its effect on the growth and neurodevelopment of very low birth weight (VLBW) preterm infants is still debated. This retrospective cohort study examined 82 VLBW infants (27-33 weeks’ gestational age or birth weight <1,500 g) enrolled in follow-up care at a tertiary hospital in Northeast Brazil to explore the impact of EBF during the first 6 months of life. The infants were classified into EBF or non-EBF (mixed or formula) feeding groups. Serial anthropometric measurements were converted into z-scores to evaluate growth trajectories, and developmental status was monitored up to 12 months of corrected age. Twenty-two infants were exclusively breastfed, and 60 received alternative feeding. Early advantages in head circumference and length were observed among EBF infants between 2 and 3 months, but these differences disappeared by midinfancy. At 1 year, neuropsychomotor outcomes and catch-up growth were similar across groups. These results are applicable specifically to infants born at 27-33 weeks’ gestational age or birth weight <1,500 g receiving structured postdischarge follow-up care. These findings suggest that, when infants receive structured postdischarge follow-up, EBF is sufficient to ensure appropriate growth and development in VLBW infants, while specialized formulas remain a valid alternative when EBF is not feasible. However, efforts should be prioritized to optimize EBF before considering formula supplementation. Further prospective research is needed to clarify how early nutrition interacts with socio-economic and environmental factors in shaping long-term outcomes.
Introduction
Neuropsychomotor development (NPD) encompasses the progressive maturation of motor, cognitive, behavioral, and social capacities throughout early childhood. In infants born preterm, especially those with very low birth weight (VLBW, <1,500 g), this trajectory unfolds under the burden of nutritional insufficiency, organ immaturity, and the physiological demands of intensive neonatal care. Given this heightened vulnerability, early nutritional support is considered among the most influential modifiable determinants of developmental outcomes.1, 2
VLBW infants, those weighing under 1,500 g at birth, whether preterm or otherwise, face a compounded vulnerability arising from a chronic energy imbalance driven by prematurity-related stressors such as hypoxia, sepsis, painful procedures, and invasive interventions.3, 4 These vulnerabilities underscore the need for effective strategies to support early development in this population.
Both the World Health Organization (WHO) and the American Academy of Pediatrics endorse breastfeeding as the optimal nutritional approach during the first 6 months of life.5, 6 Beyond its macronutrient profile, human milk is rich in bioactive molecules and long-chain polyunsaturated fatty acids, including docosahexaenoic acid, that actively promote cerebral maturation.7, 8 Furthermore, the breastfeeding experience fosters secure mother–infant attachment and supports the maturation of emotional and behavioral self-regulation. 9
Despite these advantages, sustaining exclusive breastfeeding (EBF) in preterm infants poses substantial practical challenges. Workplace obligations, cultural norms, inadequate lactation support, and infant-related feeding difficulties frequently drive the early transition to formula or mixed feeding. Whether EBF confers measurable benefits on neurodevelopment and somatic recovery in VLBW infants is a matter of ongoing debate.5, 7 Prior investigations have frequently been constrained by modest sample sizes, heterogeneous outcome measures, and inadequate adjustment for confounding variables.10-12 To optimize care for this high-risk group, it is essential to identify modifiable factors, particularly nutritional ones, that influence NPD in early life.
Against this background, the present study investigated whether EBF during the first 6 months of life was associated with improved neurodevelopmental status or catch-up growth at 12 months of corrected age (CA) in a cohort of VLBW infants.
Methods
Study Design
This retrospective cohort study was conducted at a high-complexity maternity hospital in Northeast Brazil, using data from the discontinued multicenter study, “ABRACE—How do VLBW preterm infants grow after discharge in Brazil?” The study included infants born between January 2019 and February 2020. Data were extracted from electronic medical records, including birth, hospitalization, and follow-up information.
Because this study was derived from a retrospective cohort based on an existing multicenter dataset (ABRACE study), no a priori sample size calculation was performed. The study sample, therefore, represents all eligible infants followed during the study period.
Study Outcomes
The study evaluated two primary outcomes: (a) NPD status at 12 months of CA, and (b) growth patterns during the first year of life, assessed through anthropometric z-score trajectories and catch-up growth (weight, length, and head circumference (HC)).
Growth outcomes included changes in z-scores from birth to discharge (extrauterine growth restriction (EUGR)), sequential z-score changes during follow-up visits, and qualitative catch-up growth, defined as an increase in z-score ≥+1 between consecutive assessments.
Eligibility Criteria
Infants with a gestational age (GA) of 27-33 weeks or birth weight <1,500 g, admitted to the neonatal intensive care unit (NICU) of the participating hospital, were eligible. GA was determined using first-trimester ultrasound, last menstrual period, or the Ballard scoring. 13 Infants with GA <27 weeks were excluded, and infants with GA <27 weeks transferred from other institutions after 24 h of life were also excluded. Infants were excluded if they had congenital malformations, chromosomal abnormalities, or metabolic disorders. The final cohort, therefore, represents infants born at 27-33 weeks GA or with birth weight <1,500 g, and results are limited to this population. Participants were grouped based on feeding type during the first 6 months: (a) EBF and (b) non-EBF (breast milk with formula or formula only).
Data Collection and Analysis
Data included birth characteristics, NICU length of stay, and outpatient follow-up through 12 months of CA (12 months CA). Because the follow-up period overlapped with the COVID-19 pandemic, it is important to note that the high-risk infant outpatient clinic remained operational during the study period. All follow-up visits were conducted through in-person clinical assessments, and anthropometric measurements (weight, length, and HC) were obtained by trained healthcare professionals using standardized equipment. Telemedicine was not used for anthropometric measurements, ensuring consistency in data collection throughout the study period.
Dropouts and loss to follow-up: Of the 82 infants enrolled and discharged from the NICU during the study period, all were available for the follow-up assessment at 12 months of CA. No infants were lost to follow-up during the study period, resulting in a 100% follow-up rate. Anthropometric variables (weight, length, HC) and their z-scores were recorded at birth, discharge, and follow-up visits.
Growth Variables and Catch-up Growth Definition
The growth outcomes examined included: (a) change in weight z-score from birth to discharge (a marker of EUGR); (b) changes in z-scores between consecutive follow-up visits; and (c) catch-up growth trajectories across three anthropometric parameters (weight, length, and HC). These parameters were continuously monitored during outpatient visits up to 12 months of CA.
Comparative analyses of mean weight, length, and HC z-scores between the two groups were conducted across predefined CA intervals aligned with scheduled outpatient visits during the first year of follow-up. Patients were categorized into nine CA intervals: (a) ≥0 to <1 month, (b) ≥1 to <2 months, (c) ≥2 to <3 months, (d) ≥3 to <4 months, (e) ≥4 to <5 months, (f) ≥5 to <6 months, (g) ≥6 to <8 months, (h) ≥8 to <10 months, and (i) ≥10 to ≤12 months CA. Growth trajectories were analyzed using z-scores computed according to INTERGROWTH-21st (birth to 64 weeks postmenstrual age) and WHO standards (65 weeks onward).
Catch-up growth was defined as an increase in weight z-score ≥+1 between sequential assessments, per established pediatric criteria, whereas a difference of <+1 was categorized as no catch-up. This criterion is consistent with international pediatric growth guidelines, including those established by INTERGROWTH-21st 14 and the WHO.5, 7, 8 Qualitative catch-up growth was categorized as “Yes” (presence of catch-up, defined by a z-score change ≥+1) or “No” (z-score change <+1).
Complementary Feeding Guidelines
Following WHO recommendations 15 and the Clinical Protocol and Therapeutic Guidelines of the Brazilian Ministry of Health, 16 complementary feeding was introduced at approximately 6 months of CA for both groups. Structured guidance was provided to parents/caregivers regarding age-appropriate foods, consistency, frequency, and micronutrient content. All infants received standardized nutritional counseling and monitoring during scheduled follow-up visits to ensure adequate dietary intake and growth progression.
NPD was evaluated using developmental milestones recorded in the Brazilian Ministry of Health Child Health Booklet, a nationally standardized instrument used for routine developmental surveillance in pediatric follow-up within the Brazilian public health system. Assessments were performed at 40 weeks postmenstrual age and at 3-, 6-, 9-, and 12-months CA. 17 Infants with suspected developmental delay underwent additional clinical evaluation as recommended. Developmental status was classified as adequate or inadequate according to the attainment of age-appropriate milestones recorded during follow-up visits.
Participants were grouped based on feeding type during the first 6 months of life: (a) EBF, defined as the receipt of only human milk (with or without fortifier) and no other liquids or solids; and (b) non-EBF, comprising infants who received either mixed feeding (human milk plus formula) or exclusive formula feeding. This dichotomous classification was adopted due to the limited sample size and the primary objective of evaluating the impact of exclusive human milk exposure, consistent with the WHO recommendations and prior cohort studies in preterm populations.1-3 However, it is acknowledged that this grouping may obscure potential dose-response relationships between partial human milk intake and developmental outcomes, a limitation that warrants the consideration of separate analysis of mixed-feed versus formula-only groups in future larger studies.
Statistical Analysis
The Shapiro–Wilk test was applied to assess the distributional normality of continuous variables. Normally distributed variables were expressed as mean ± standard deviation (mean ± SD); nonnormally distributed variables were reported as median with the interquartile range (25th-75th percentiles). An independent-samples Student’s t-test was used to compare normally distributed continuous variables across groups, with Levene’s test used to assess variance homogeneity. Where heteroscedasticity was identified, Welch’s t-test was applied instead. The Mann–Whitney U test serves for nonparametric comparisons of nonnormally distributed variables. Within-group changes in quantitative catch-up z-scores between birth/discharge and ≥3 to <4 months CA were assessed using paired t-tests for each feeding group. Cohen’s d was calculated for comparisons reaching statistical significance, categorized as small (≤0.20), moderate (0.20-0.79), or large (≥0.80) per Cohen’s criteriath–75th. 18 For categorical variables, absolute and relative frequencies were calculated, and chi-square tests were used to examine the relationship between feeding pattern and NPD outcomes at 6-12 months CA. Post hoc statistical power was estimated for the primary between-group comparisons using the pwr package in R. A significance level of 5% was adopted for all analyses. Bar and line graphs were generated for the visual representation of results. Statistical analyses were conducted using Statistical Package for the Social Sciences, version 28 (IBM Corp., Chicago, USA).
Results
A total of 82 infants met the inclusion criteria: 22 in the EBF group and 60 in the non-EBF group (Table 1). It was observed that the two feeding groups were well balanced at baseline on all key perinatal characteristics. No significant differences were observed between EBF and non-EBF groups regarding GA (P = .867), birth weight (P = .542), or growth classification status (small for GA (SGA), P = .713; fetal growth restriction (FGR), P = .991). The proportion of FGR was similar between groups (4.5% in EBF vs. 5.0% in non-EBF). These baseline comparisons confirm that potential confounding by perinatal factors is minimized in the analysis of feeding effects.
Sample Characteristics and Baseline Comparison Between EBF and Non-EBF Groups (n = 82).
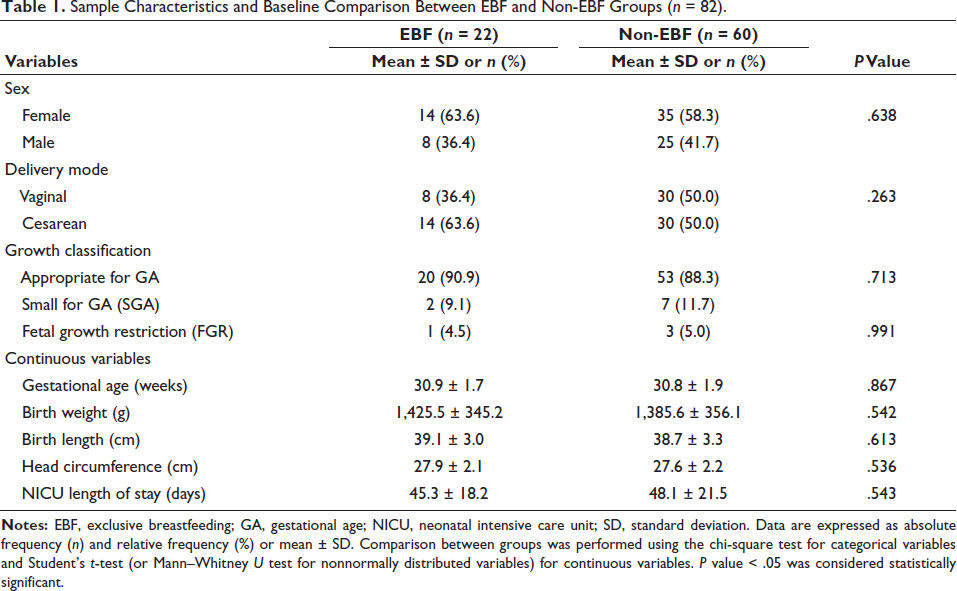
Baseline Characteristics and Group Comparison
The two groups were compared regarding baseline characteristics. The proportion of SGA infants, mean birth weight, and GA were examined to assess potential confounding (Table 1). FGR status was documented when clinically indicated.
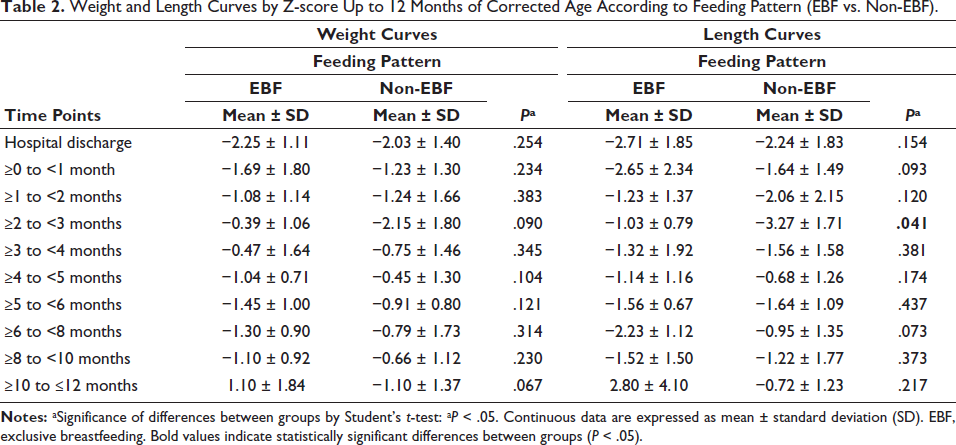
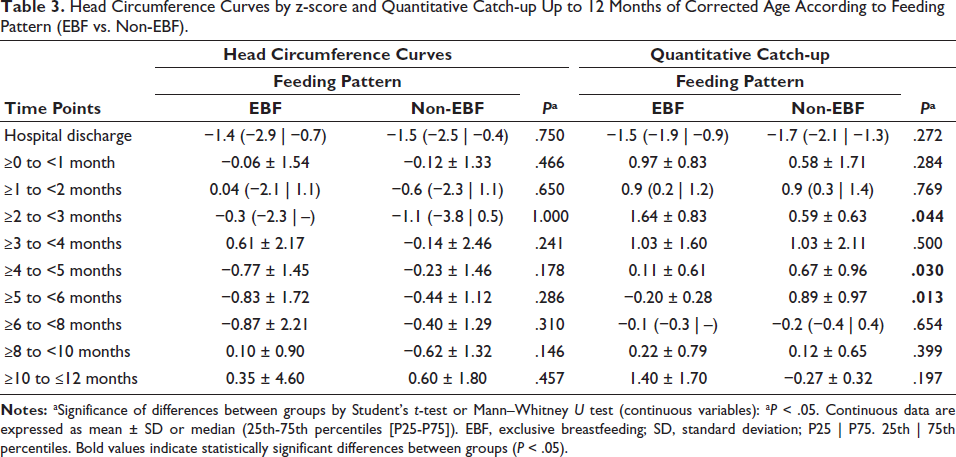
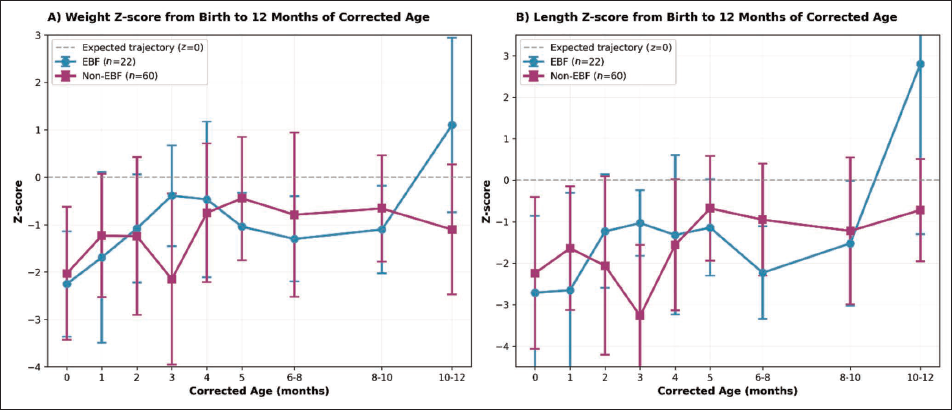
Anthropometric evaluations were analyzed in the two groups (Tables 2 and 3). No significant differences were found between groups in catch-up growth or anthropometric z-scores at 12 months CA. A higher length z-score was observed at 2-3 months CA in the EBF group (P = .041), and a higher catch-up z-score in HC was also noted at that time (P = .044). However, these differences did not persist in later months. The NPD outcomes did not significantly differ between groups (P = .443). The trajectories of these curves are depicted in Figure 1.
Weight and Length Curves by Z-score Up to 12 Months of Corrected Age According to Feeding Pattern (EBF vs. Non-EBF).
Head Circumference Curves by z-score and Quantitative Catch-up Up to 12 Months of Corrected Age According to Feeding Pattern (EBF vs. Non-EBF).
Growth Trajectory Analysis and Z-score Changes
All three anthropometric parameters (weight, length, and HC) were analyzed together for a comprehensive assessment of growth patterns. Changes in z-scores from birth to discharge were documented as markers of EUGR. Sequential changes between follow-up visits were also calculated to assess catch-up growth dynamics across the entire study period.
Additionally, a higher mean catch-up z-score was documented in the EBF group (1.64 ± 0.83) compared to the non-EBF group (0.59 ± 0.63) at a CA of ≥2 to <3 months. This difference was also statistically significant, with a mean difference of 1.05 (95% CI: −0.21 to 2.30; t(6) = 2.04, P = .044; Cohen’s d = 0.70 [moderate effect]) (Table 3).
Conversely, a lower mean catch-up z-score was noted in the EBF group (0.11 ± 0.61) compared to the non-EBF group (0.67 ± 0.96) at a CA of ≥4 to <5 months. This difference was statistically significant, with a mean difference of −0.56 (95% CI: −1.15 to 0.03; t(23) = −1.97, P = .030; Cohen’s d = 0.88 [large effect]) (Table 3).
Similarly, a lower mean catch-up z-score was observed in the EBF group (−0.20 ± 0.28) compared to the non-EBF group (0.89 ± 0.97) at a CA of ≥5 to <6 months. This difference was statistically significant, with a mean difference of −1.09 (95% CI: −2.03 to −0.15; t(17) = −2.44, P = .013; Cohen’s d = 0.86 [large effect]) (Table 3). The trajectories of these curves are illustrated in Figure 2.
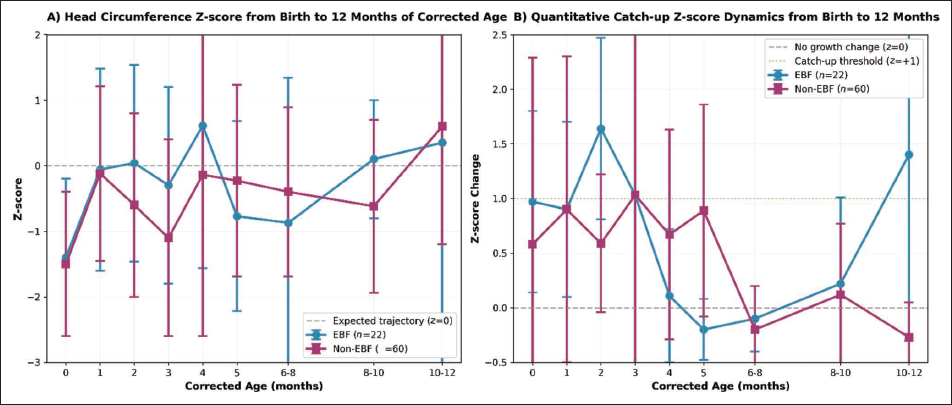
Post hoc power calculations for the main between-group comparisons (n1 = 22 vs. n2 = 60) yielded the following estimates (α = 0.05): for the catch-up HC z-score at 2-3 months (Cohen’s d = 0.70), the power was 79.2%; for the difference at 4-5 months (d = 0.88), the power was 93.7%; and for the difference at 5-6 months (d = 0.86), the power was 92.6%. The study was adequately powered to detect large effect sizes but had only borderline power for moderate effects, limiting our ability to detect subtle differences in growth patterns.
Qualitative Catch-up Growth Analysis
Qualitative catch-up growth was defined as “Yes” when a z-score increase ≥+1 was observed between sequential assessments, or “No” when the z-score change was <+1. Figure 3 presents the distribution of qualitative catch-up at each evaluated time point, while Supplementary Figure S1 illustrates this distribution by feeding groups (EBF vs. non-EBF).
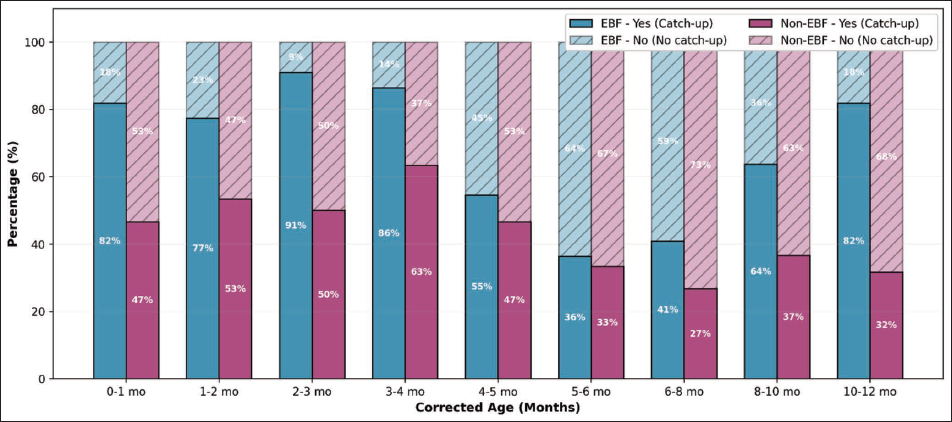
NPD between 6 and 12 months of CA was similar across feeding patterns. Among infants who were exclusively breastfed, 81.8% presented adequate NPD, compared with 88.3% among those receiving non-EBF (mixed or formula feeding). The proportion of infants with inadequate NPD was 18.2% in the EBF group and 11.7% in the non-EBF group. No statistically significant association was observed between feeding pattern and NPD (χ2 test, P = .443), indicating comparable neurodevelopmental performance between groups during this period.
Discussion
The present study found that EBF during the first 6 months of life did not result in superior outcomes in NPD or overall catch-up growth at 12 months of CA in VLBW preterm infants born at 27-33 weeks of GA or with a birth weight <1,500 g. Although modest differences in HC and length were observed at early follow-ups, these were not sustained beyond midinfancy. Taking together, the results suggest that EBF can provide adequate nutritional support for VLBW infants when close postdischarge monitoring is available, but its developmental advantage compared to formula or mixed feeding is not clearly demonstrated in the first year of life.
As a retrospective study with a convenience sample enrolled over a defined time period, this study has important limitations that must be clearly acknowledged. The sample size of 82 infants (22 in the EBF group and 60 in the non-EBF group) represents a relatively small cohort. While post hoc power analysis indicated adequate power (>90%) for detecting large effect sizes, the study had only a borderline power (~79%) for detecting moderate effects. This limited statistical power increases the risk of a Type II error, meaning that subtle but clinically meaningful differences between feeding groups may not have been detected. Therefore, null findings regarding catch-up growth and developmental outcomes should be interpreted with caution. Prospective studies with larger sample sizes are needed to confirm these preliminary findings.
Within this cohort, 26.8% of infants achieved EBF through 6 months, a rate that exceeds what is often reported in middle-income settings.19, 20 This relatively high adherence highlights the feasibility of supporting exclusive human milk feeding, even in vulnerable preterm populations. However, the subsequent convergence of growth trajectories after the introduction of complementary foods underscores how dietary practices may diminish initial differences.21, 22 Gastrointestinal maturation during the second half of infancy and structured guidance on complementary feeding (see “Methods” section for specific guidelines used in this study) likely further contributed to aligning the nutritional outcomes between the groups.
The structured and well-defined complementary feeding guidelines followed in this study included age-appropriate introduction at 6 months of CA, with standardized recommendations regarding food consistency, frequency, and micronutrient content based on the WHO and Programa de Controle da Desnutrição e da Terapia protocols. The apparent convergence of growth trajectories between EBF and non-EBF groups after complementary food introduction suggests that the quality and consistency of dietary guidance had a substantial impact on the equalization of growth outcomes. In future studies, detailed documentation of complementary feeding adherence and dietary intake would provide greater insight into this critical developmental period.
These findings are consistent with other longitudinal studies, showing similar evolution of weight, length, and HC among preterm infants, regardless of whether they were breastfed or fed with fortified formula.22-24 The progressive narrowing of anthropometric differences underscores the critical role of close nutritional and clinical oversight during the first months of life, the period when the immune-modulatory and neuroprotective properties of human milk are most active.6, 9
The authors acknowledge that grouping mixed-fed and exclusively formula-fed infants into a single “non-EBF” category may have obscured important dose-response relationships. Specifically, while many infants in the mixed-feed group received breast milk in addition to formula, the retrospective study design precluded the accurate measurement of breast milk volume or frequency. The proportion of breast milk versus formula in mixed-fed infants varied considerably and could not be quantified from the available records. Therefore, it is not possible to determine whether partial breastfeeding (mixed feeding) provides intermediate benefits between exclusive formula feeding and EBF. Future prospective studies with detailed feeding diaries or volumetric data are essential to characterize these relationships.
The relationship between somatic growth and neurodevelopment is well established, especially in children born preterm. Adequate catch-up growth is linked to improved brain development, yet both insufficient and excessive growth carry risks for adverse cognitive or behavioral outcomes.25, 26 By the second year of life, the brain attains approximately 80%-90% of its adult volume, a period of intense structural growth that demands uninterrupted nutritional input.27, 28 Successful catch-up growth has been linked to favorable metabolic trajectories and better cognitive functioning.26, 29 The absence of differences in NPD in this study may reflect that both groups were closely monitored and supported clinically, resulting in overall satisfactory developmental progress. This finding reinforces the notion that social and environmental influences, alongside nutrition, play a crucial role in shaping developmental trajectories.
Importantly, neurodevelopmental outcomes in preterm infants are strongly influenced by a complex interplay of biological, familial, and socio-economic factors, beyond feeding modality alone. Parental education, household income, access to early stimulation, quality of caregiver–infant interactions, and home learning environment are well-documented determinants of cognitive and motor development in early childhood.27, 28 In our retrospective study, we were unable to account for these potential confounders due to the absence of structured sociodemographic or environmental assessments in the medical records. It is plausible that unmeasured differences in maternal education, parental engagement, socio-economic status, or access to developmental resources may have attenuated or masked any true effect of EBF on neurodevelopment. Without adjustment for these variables, residual confounding remains a significant limitation, and caution is warranted in attributing developmental outcomes solely to feeding practices.
The lack of significant intergroup differences may also be explained by the composition of modern preterm formulas, which are fortified with nutrients that mimic breast milk. 2 Thus, while breast milk remains the optimal source of nutrition, formula feeding, when properly administered, may support comparable growth and developmental outcomes within the first year of CA. 8 The structured follow-up system adopted in this cohort likely mitigated risks, ensuring timely identification and correction of growth faltering regardless of feeding modality.
From a clinical perspective, the results underline the importance of prioritizing efforts to promote and support EBF as the first-line nutritional strategy for VLBW infants, consistent with WHO guidelines and best-practice recommendations. 7 Simultaneously, the findings support the use of specialized preterm formulas as a clinically sound alternative when EBF cannot be maintained, particularly in settings with limited resources. 3 Health systems should implement comprehensive lactation support programs, including trained lactation consultants, adequate maternal counseling, and psychosocial support, to optimize EBF success rates before considering formula supplementation as the primary strategy. Multidisciplinary follow-up should remain a cornerstone of care, given that early growth monitoring provides an opportunity to detect deviations and implement interventions with long-term benefits for health and development.
Several limitations must be acknowledged. The relatively small sample size reduced statistical power to detect subtle effects of feeding modality. Post hoc analysis showed adequate power to detect large effects (≈93%), but only borderline power for moderate effects (≈79%). Thus, significant findings with large effect sizes are likely robust, while null results for smaller effects should be interpreted cautiously. Replication in larger cohorts is needed, given the risk of effect size inflation in small samples.
The retrospective design limited the ability to control for potential confounding influences, such as socio-economic status, parental education, levels of environmental stimulation, and maternal mental health, all of which are robust predictors of early neurodevelopment in preterm populations. The reliance on medical records may also have introduced variability in data recording. In addition, NPD was assessed using developmental milestones from the Brazilian Ministry of Health Child Health Booklet, which is widely used for routine developmental surveillance in Brazil. However, internationally standardized developmental assessment tools, such as the Bayley Scales of Infant Development or the Denver Developmental Screening Test, were not used, which may limit direct comparability with studies conducted in other settings. Furthermore, clinical heterogeneity among infants may have obscured potential group differences. Nonetheless, the use of standardized growth charts and systematic developmental follow-up strengthens the reliability of the present findings.
Another limitation concerns the grouping of mixed-fed and formula-fed infants into a single “non-EBF” category. While this decision was driven by sample size constraints and our focus on the effect of EBF, it is possible that the inclusion of infants receiving partial human milk diluted potential differences between feeding modalities. Future studies with larger cohorts should examine these subgroups separately to isolate better the dose-response relationship between human milk intake and developmental outcomes.
Conclusions
EBF for the first 6 months provided adequate support for growth and neurodevelopment in VLBW infants born at 27-33 weeks of GA or with a birth weight <1,500 g, and these results should not be extrapolated to infants with a GA <27 weeks. However, it did not demonstrate clear superiority over alternative feeding strategies within the first year of CA in this cohort receiving structured postdischarge follow-up care. These results highlight two practical implications: first, health systems should prioritize comprehensive support for EBF as the optimal nutrition source, with formula feeding as a validated alternative when EBF is not feasible; second, structured postdischarge follow-up is essential to detect early growth deviations and safeguard developmental outcomes.
Key questions remain unanswered, including the long-term impact of feeding modality beyond infancy and the extent to which socio-economic context, parental engagement, and early intervention programs modify these trajectories. Addressing these gaps requires larger, prospective studies that integrate biological, nutritional, and environmental determinants of child development.
Footnotes
Acknowledgments
The authors are grateful to the Maternity Hospital-School Januário Cicco (MEJC) and to the Brazilian Company of Hospital Services (Ebserh) for providing the facilities for the conduction of the research.
Authors’ Contribution
RAGGC: Conceptualization, methodology, formal analysis, writing – original draft. JDASC: Conceptualization, software, data curation, formal analysis, supervision, writing – original draft. SFC: Conceptualization, methodology, software, data curation, investigation, writing – review and editing. AKCB: Resources, supervision, writing – review and editing. RCAS: Methodology, validation, writing – review and editing. CLF: Investigation, supervision, writing – review and editing. CAF: Data curation, software, formal analysis, writing – review and editing. RNC: Methodology, supervision, validation, writing – review and editing. NMRA: Conceptualization, supervision, project administration, writing – review and editing. CRSM: Conceptualization, methodology, supervision, validation, writing – review and editing.
Declaration of Conflict of Interests
The authors declared no conflict of interest with respect to the research, authorship, and/or publication of this article.
Ethical Approval and Informed Consent
This study was conducted in accordance with national and international ethical guidelines for research involving human subjects. The protocol was reviewed and approved by a certified Institutional Review Board/Ethics Committee (approval number: 97359518.7.1001.5327). Written informed consent was obtained from the parents or legal guardians of all participating infants prior to their inclusion in the study.
Funding
The authors received no financial support for the research, authorship, and/or publication of this article.
Supplementary Material
References
Supplementary Material
Please find the following supplemental material available below.
For Open Access articles published under a Creative Commons License, all supplemental material carries the same license as the article it is associated with.
For non-Open Access articles published, all supplemental material carries a non-exclusive license, and permission requests for re-use of supplemental material or any part of supplemental material shall be sent directly to the copyright owner as specified in the copyright notice associated with the article.