
Abstract
Media economics investigations of the international flow of media such as films reveal the importance of domestic consumer spending on films. Television penetration is seen as a threat to this. In this article, the effect of television penetration on the annual number of theatrical admissions, the annual number of films produced and the number of screens was examined using time series data from the introduction of television until the year 2005. This was examined in the context of the five major film producing countries: US, UK, France, Germany and Japan. Statistically, India fits the international pattern of a significant negative effect of television penetration on aggregate and per capita theatrical film admissions. Further, television penetration had a negative but non-significant effect on the number of films produced and on the number of screens. Descriptive data show that India’s persistent aggregate admissions appear to be more an artifact of the population size rather than a higher frequency in visits to the theatres. Since 74 per cent of Indian film industry revenues come from theatrical admissions, these results may interest policy makers in view of the fact that India is the only country in the world other than the US where domestic films have approximately 93 per cent market share.
The Economic Effects of Television on the Indian Film Market
Cultural imperialism scholarship (Beltran 1978; Guback 1969; Mattelart 1973; Nordenstreng and Varis 1974; Schiller 1969) has drawn attention to media flows around the world, arguing that former colonial powers dominated the flow of media and culture. Media economic analysis of these flows shows that the international media trade is affected by economic variables such as the size of the economy and the size of the population. These variables affect consumer spending on media products; thus domestic media markets that are larger and wealthier are able to produce more expensively produced media products. If we assume that audiences prefer more expensively produced media products (and anecdotal evidence suggests that there is support for this assumption) then these expensively produced media products have an advantage both in their own domestic market as well as in the international market (Hoskins & Mirus 1988; Waterman 1988; Wildman & Siwek 1988). Empirical research has by and large supported this position (see Waterman 2005; Waterman and Jayakar 2000).
Since consumer spending is a determining factor of quality and variety of films produced in a market and therefore the position of a country’s film industry in the international trade in films, factors that affect consumer spending on films merit research attention. The availability of competing technologies such as television is one such factor. This article focuses on this issue and asks the research question, ‘What is the economic effect of television penetration on the Indian film industry?’ Empirical evidence from the early years of television in India is examined in this article. Additionally, data from five of the world’s largest theatrical film markets—USA, Japan, UK, France, and Germany—was also examined, to provide an international context. These markets were chosen because they collectively earned more than 70 per cent of the world’s domestic theatrical revenues in 2005 (Screen Digest 2006).
The Effect of Television
As expected from a competing technology, the direct and immediate effect of television has been a decline in theatrical admissions (Sorlin 1996; Spraos 1962; Stuart 1982; Waterman 2005). However, as markets mature, television penetration also brings with it multiple means of segmenting audiences and generating revenue streams through transmission of films on various forms of television such as cable and broadcast, as well as through sales and rental of films on various video formats such as VHS and DVD. Empirical studies show that revenues from all these streams can eventually stimulate theatrical admissions through the production of larger and more attractive films (Waterman 2005; Waterman and Jayakar 2000).
Film Revenues in India
Television began to spread in India a few decades after the other major film producing countries. Trade sources report that currently, Indian film revenues come mainly from theatrical exhibition. In 2005, the Federation of Indian Chambers of Commerce and Industry (FICCI) estimated that the bulk of Indian film industry revenues, about 74 per cent, continued to come from the domestic box-office while other sources including the overseas box-office, cable/satellite television and home video contributed to the remaining 26 per cent (FICCI 2009). This reliance on theatrical revenues differentiates India from other film producing countries.
The appropriate measure to examine the economic effect of a new technology on the film market is revenue data from theatrical exhibition, video, pay cable, basic cable and broadcast sectors. However, it is well-known that film revenue data in India is neither collected nor reported by any official agency. Some general estimates are available. However they are too general for our purposes. Since revenue figures are unavailable, the next best approximation, that is, theatrical admissions data, television penetration data and two supplementary measures—film production output and the number of theatrical screens—are used in this study. As the first study of its kind that examines the economic effect of television on India’s film industry, this study relies on measures that have been used in early studies of television’s effect on the film industry in Britain (Spraos 1962) and the USA (Stuart 1982).
Method
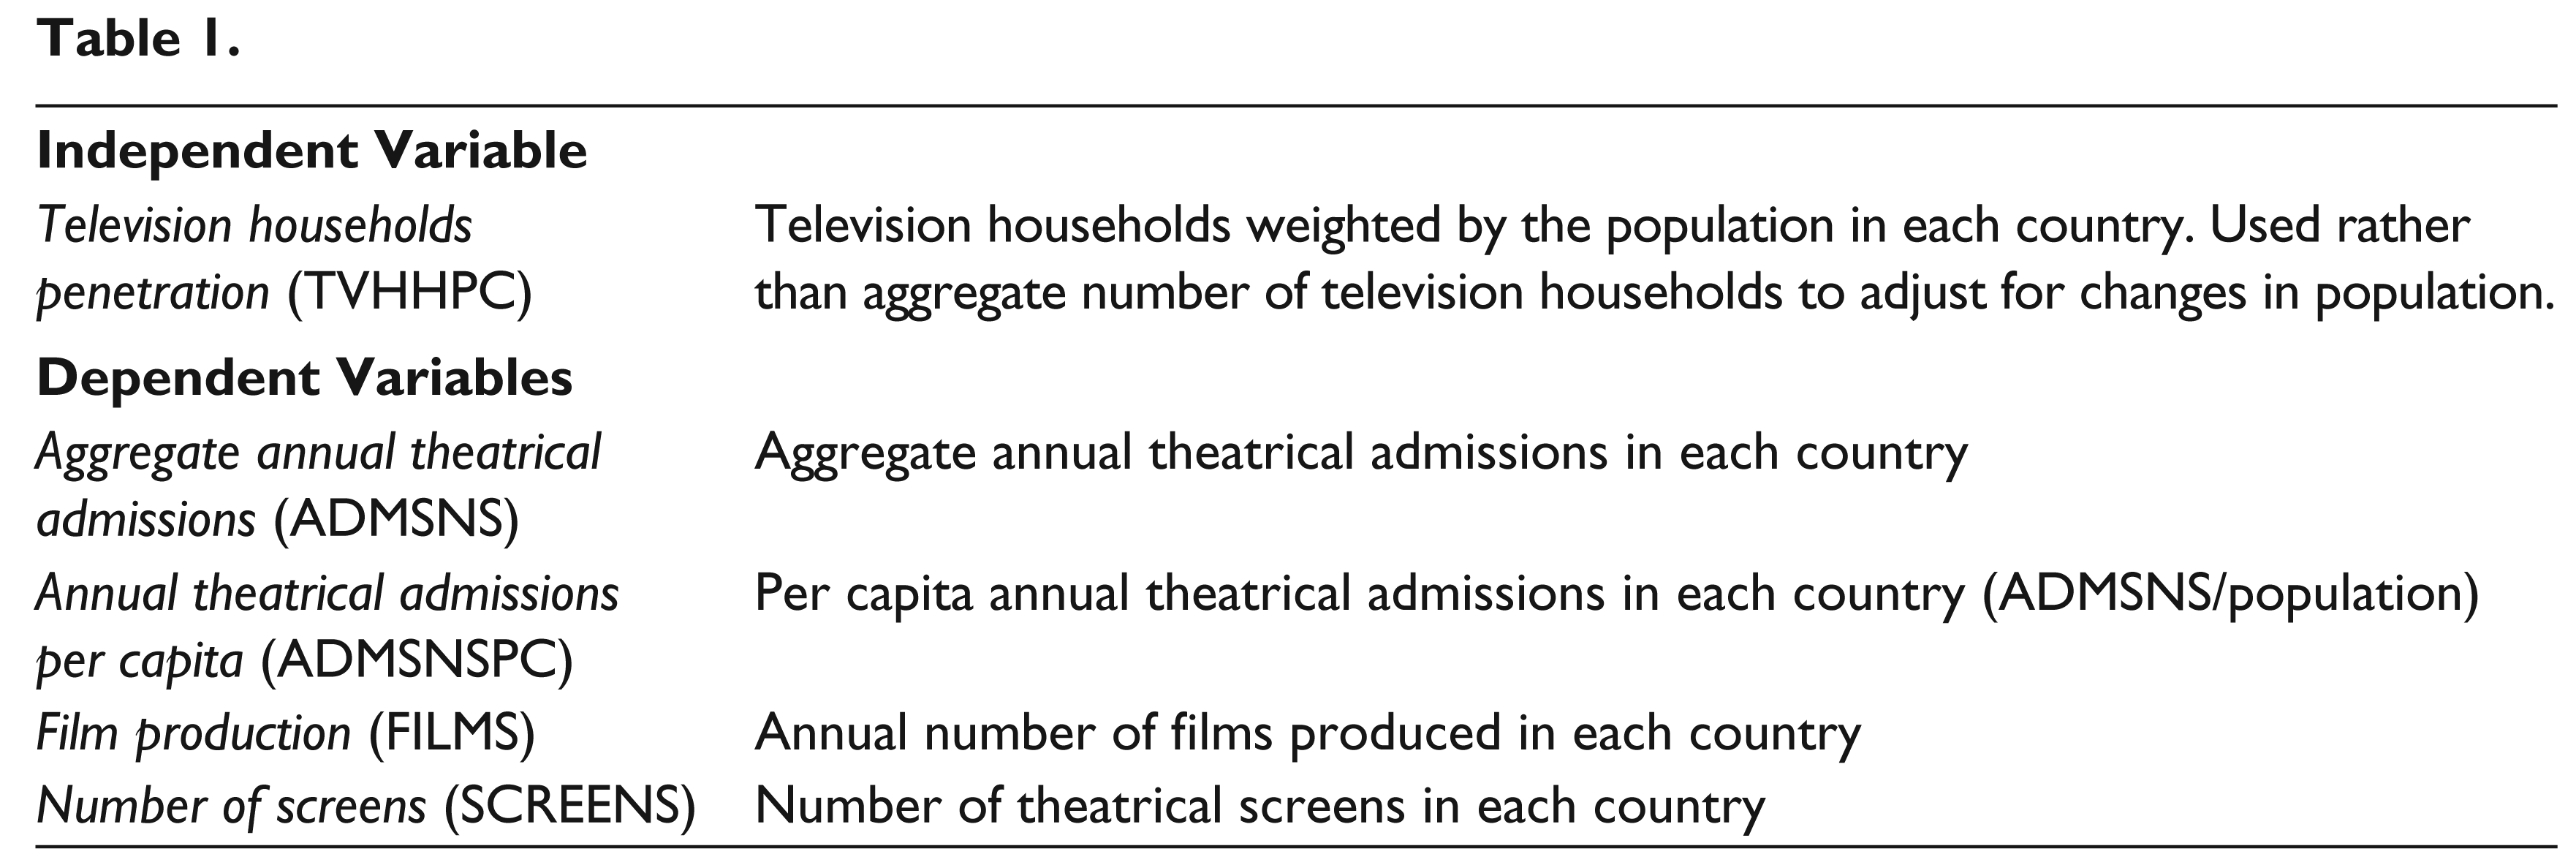
The aim of this study is to examine the economic effect of competing technologies on the film industry. This is done by examining the effect of the diffusion of television on film admissions, number of films produced and theatrical screens through an econometric model. The independent variable used in this study is television penetration and it is measured by the number of television households per capita. This measure adjusts for the population size in each country. The dependent variables are theatrical admissions at the aggregate and per capita level, the number of films produced and the number of theatrical screens. A detailed table of the definitions of variables is included in a later section on the empirical models.
Theatrical admissions data is examined both at the aggregate and per capita level in this study. The aggregate annual number of admissions in a country gives the broad view of admissions, while admissions per capita is a finer measure of the popularity of film-going, which adjusts for the size of the total population in a country. In addition to these two measures of theatrical admissions, the number of films produced and the number of theatrical screens are used in this study. These measures are used here as supplementary measures. While the number of films produced may not provide any information on the revenue earning potential of the films, it provides some general information about the health of the film industry. Larger markets produce more films (Wildman and Siwek 1988). Similarly, while the number of screens does not tell us about the number of seats that each screen caters to (older single screen theatres were increasingly replaced by multiplexes which increased the number of screens without increasing the total number of seats, as reported in Waterman, 2005). However when taken in conjunction with admissions measures, the number of screens provides some additional insights into the ability of the film industry to attract audiences.
Secondary Data
Secondary data used in this chapter was compiled from a variety of sources. The main source of data in these series was the UNESCO’s annual statistical yearbooks which provided time series data for the 30 year period from 1955 to 1984 for the annual number of film admissions, number of theatre screens and number of films produced in the USA, UK, France, Germany, Japan and India. The European Audiovisual Observatory provided information for the 16 year period from 1985 to 2000. Further data was obtained from reports released by European Union media research organizations such as Mediasalles. This was supplemented with data from statistical yearbooks of individual countries. The length of the series in the dataset varies from country to country.
Historical data was sourced from the records of film industry bodies in these countries including the Motion Picture Association of America (MPAA), the British Film Institute (BFI), the Motion Picture Producers Association of Japan, and the Spitzenorganisation der Filmwirtschaft (SPIO, Germany). Archival issues of the Quigley’s Almanac were used to supplement film industry data for the US for the years before the arrival of television.
Data related to the number of films produced in India come from the Annual Reports (for the years 1982–2005) of the Central Board of Film Certification at Mumbai, India. Film production statistics for the years 1931–1981 were sourced from Rajadhyaksha and Willemen’s (1999) Encyclopedia of Indian Cinema. Data on the number of Indian theatre screens was sourced from Pendakur (2003) and Chakravarty (2004).
Data on the number of television households was obtained from the abovementioned sources as well as from the International Telecommunications Union. Some recent figures were obtained from the trade journal Screen Digest. In spite of extensive efforts, there are still a few gaps in the series that remain and these were filled by estimating values as averages of adjacent values. A full list of all sources is included in the appendix.
Descriptive Data Analysis: Time Trends
Time trends were graphed for television households and aggregate film admissions, per capita film admissions, the number of films and screens in each country. Examining the data this way allows us to see the broad patterns of the trends in all countries. Some observations can be made on the basis of these graphs.
Aggregate Film Admissions and Television Households
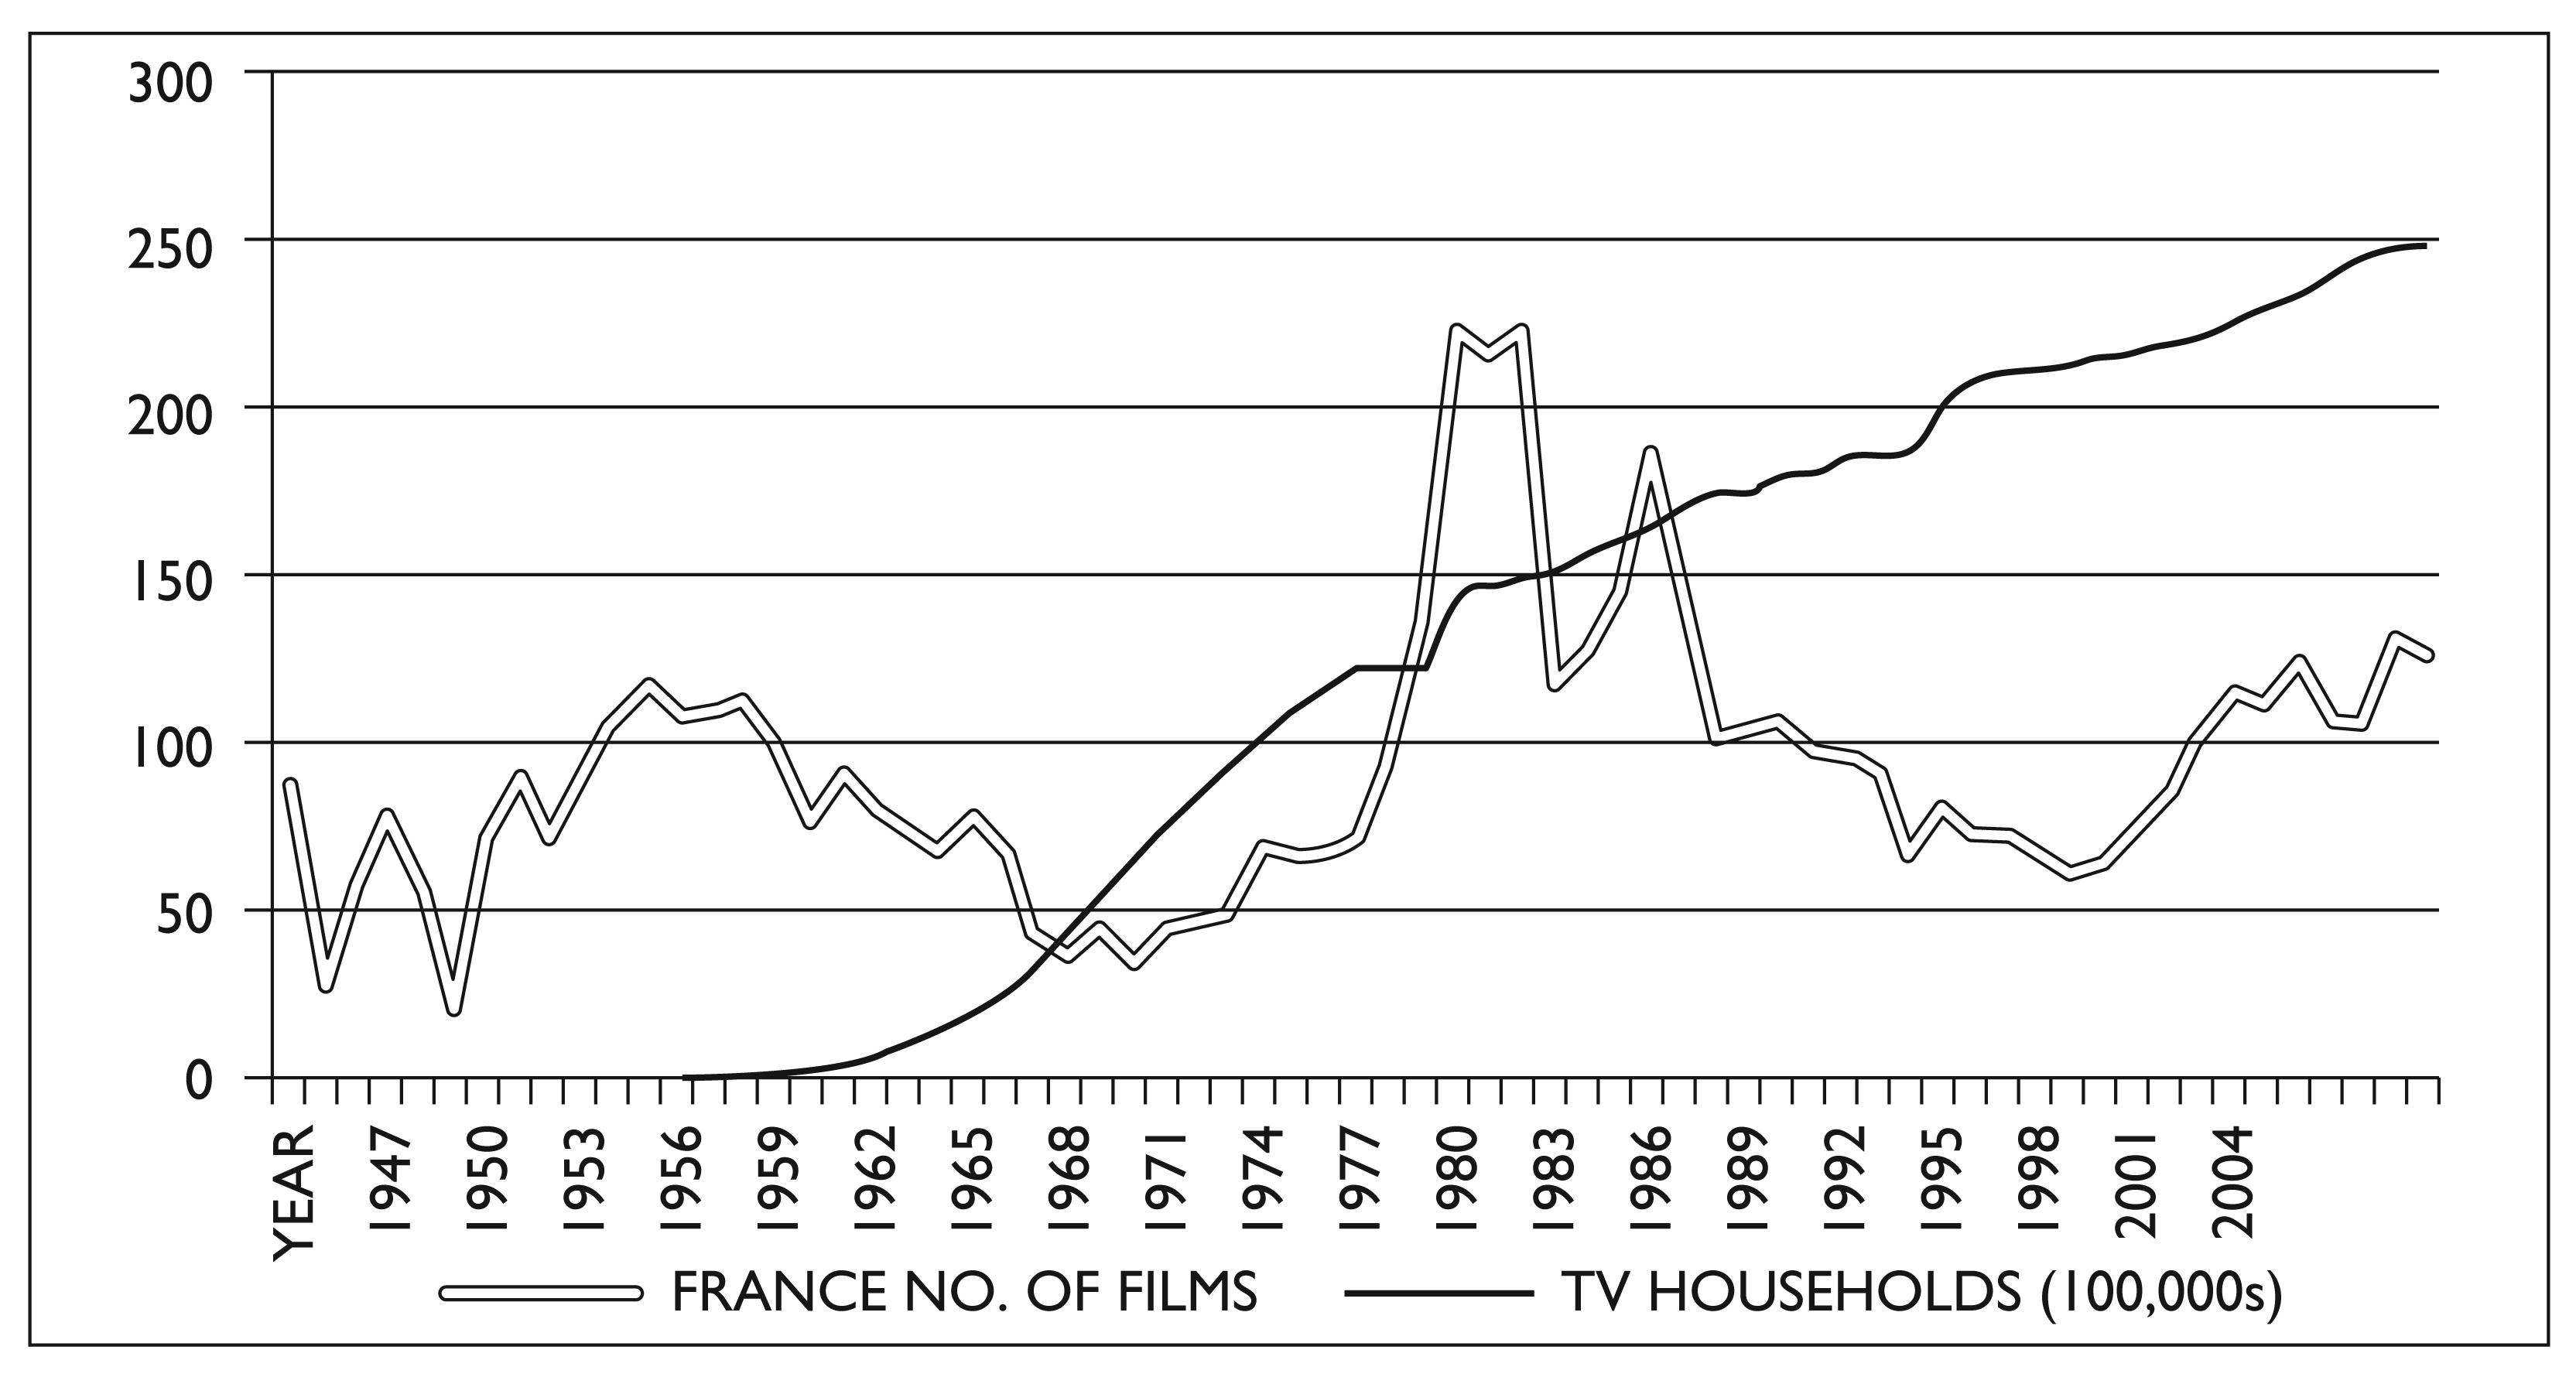
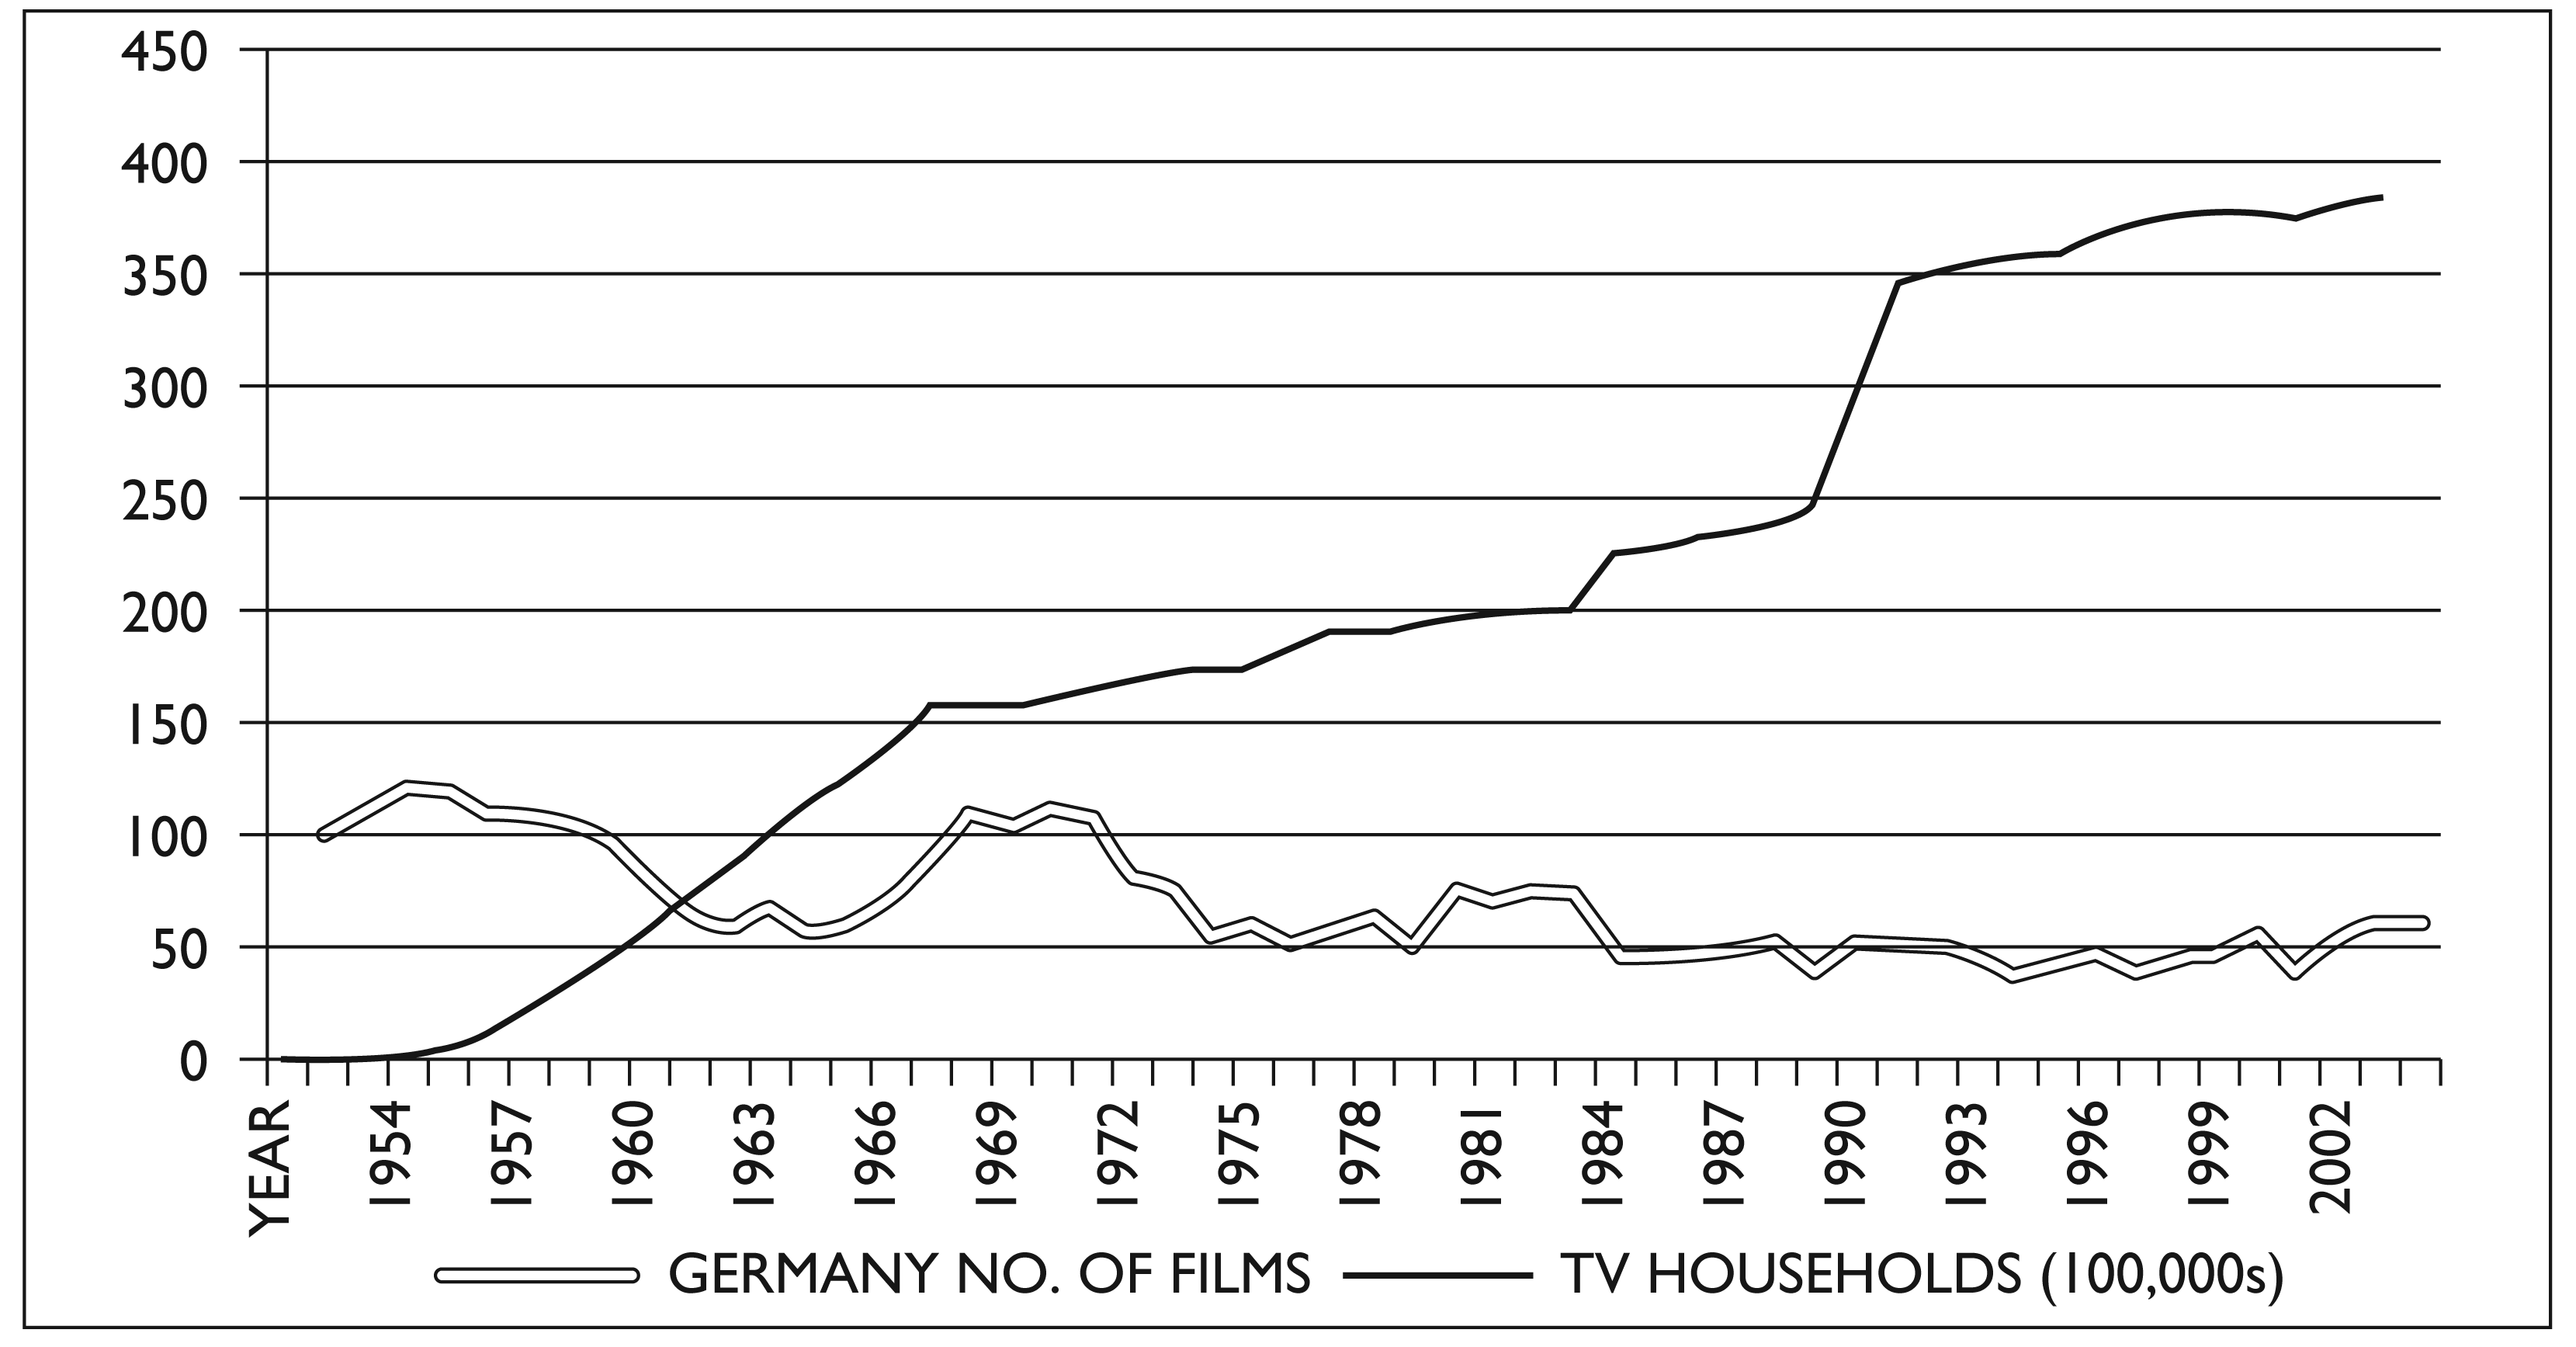
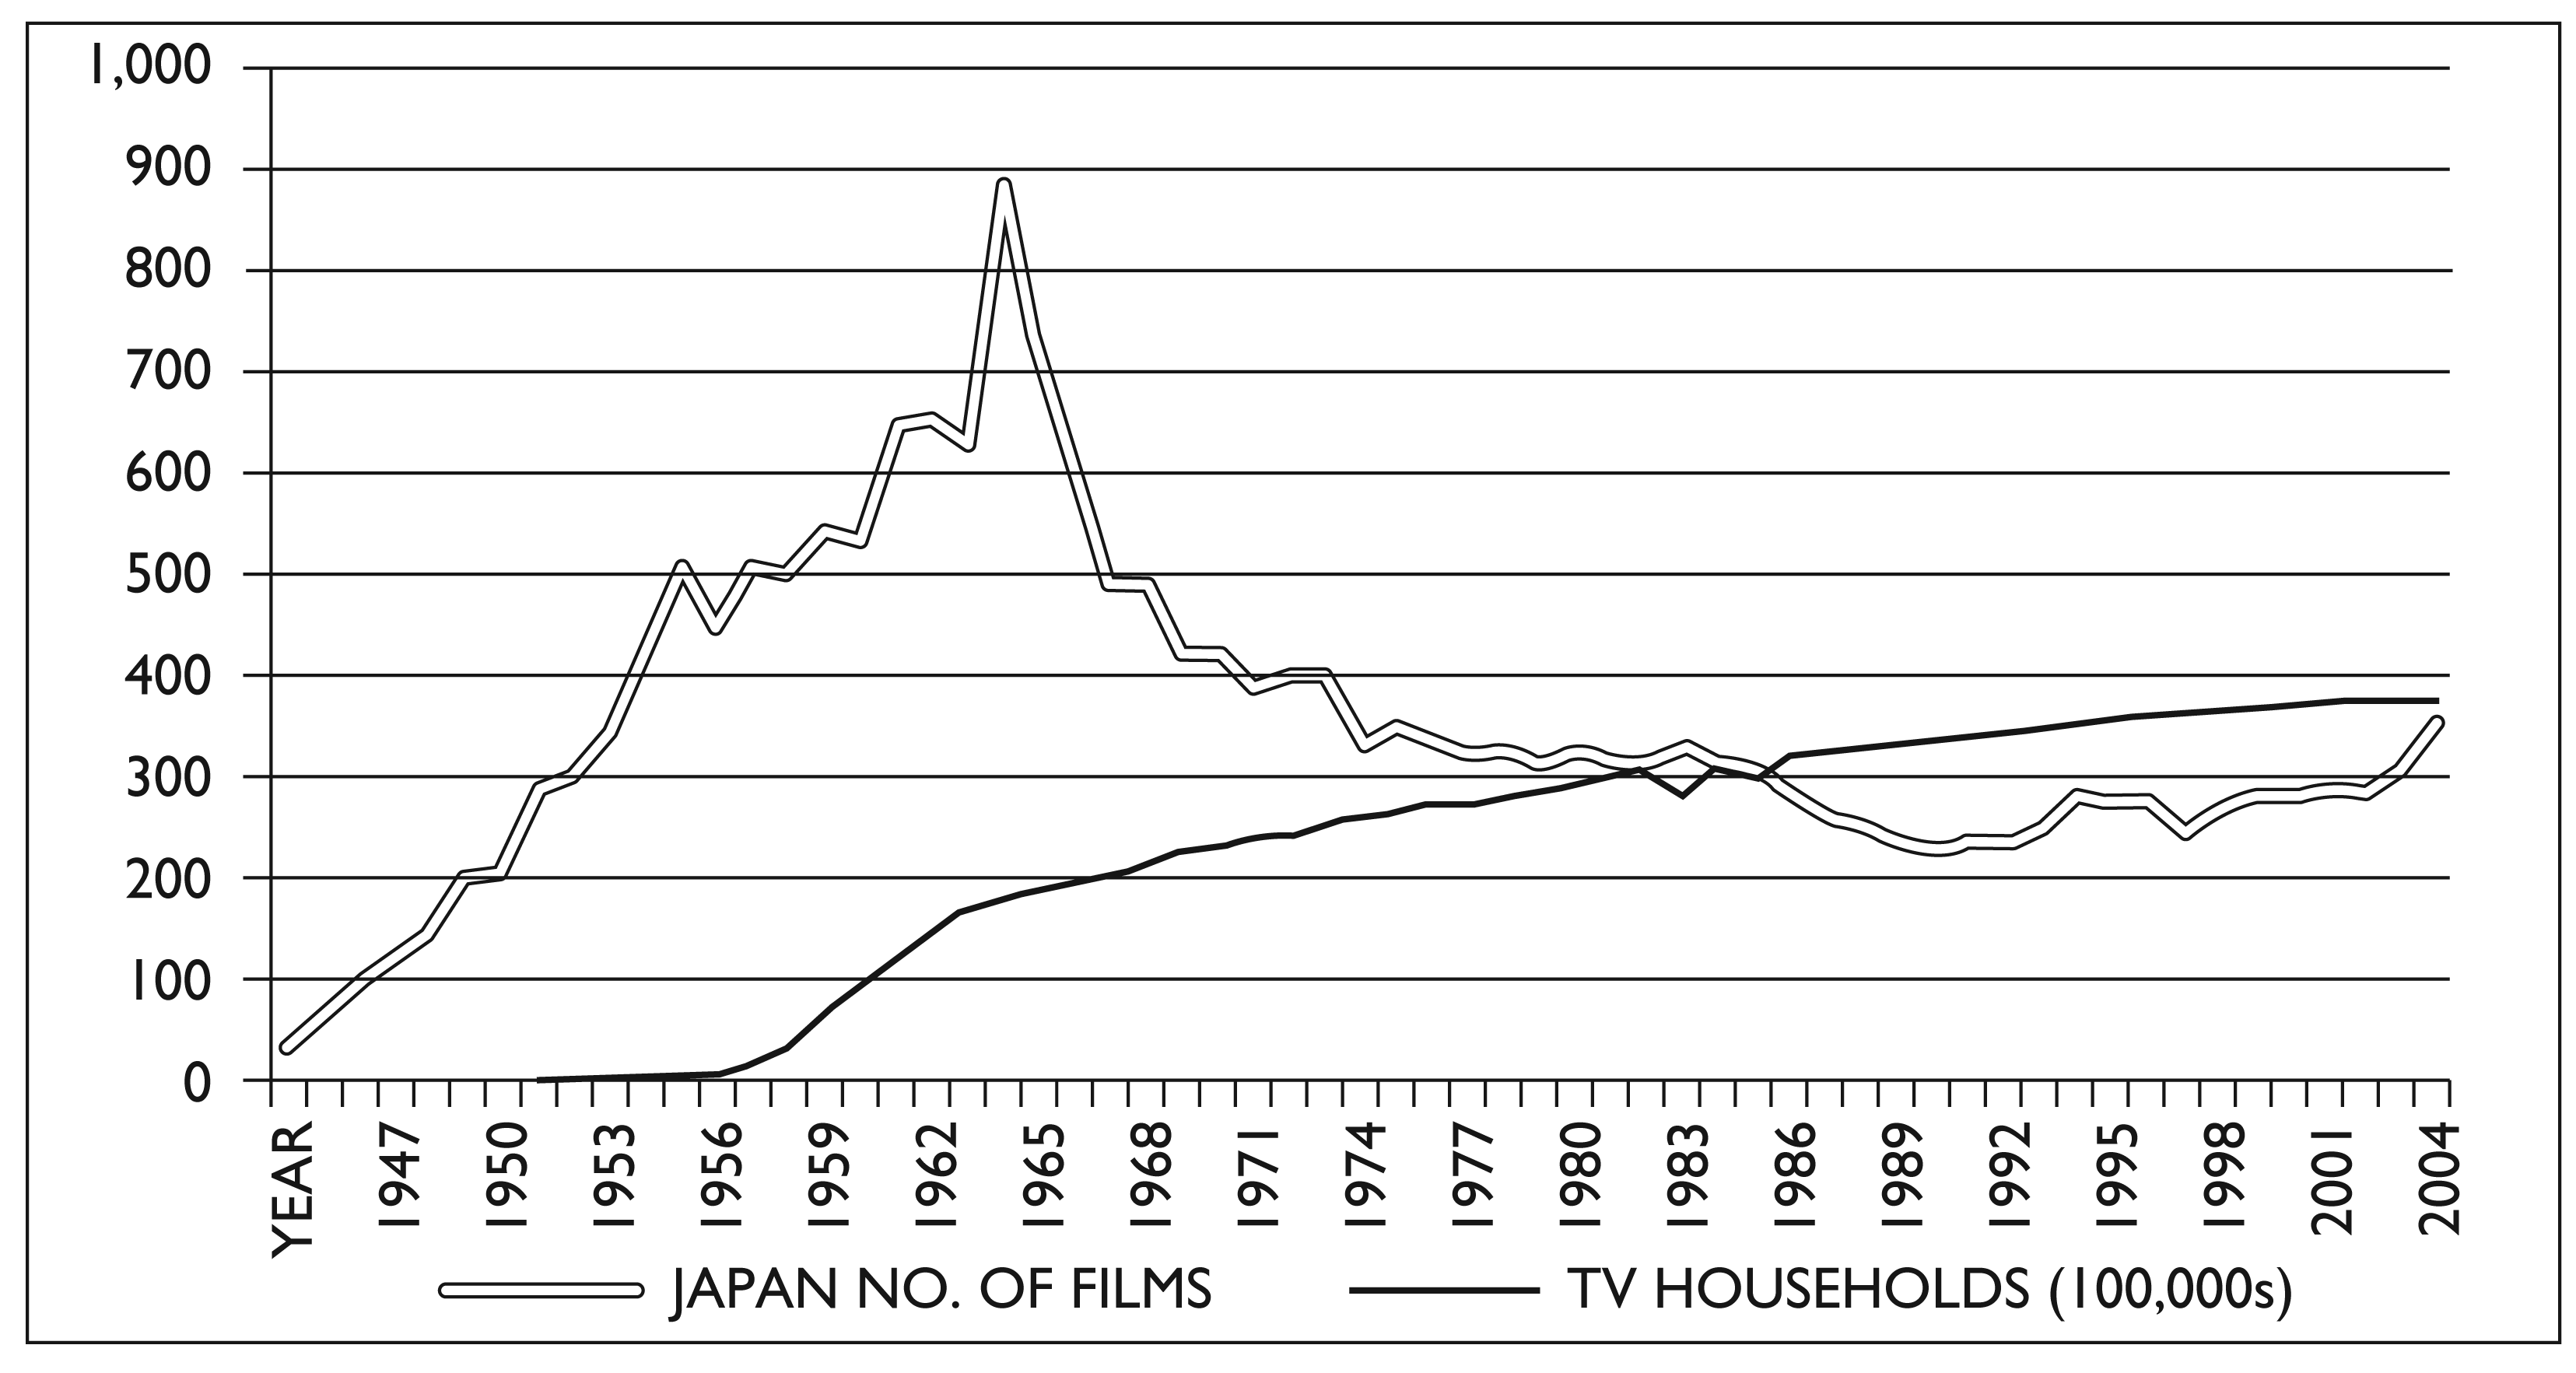
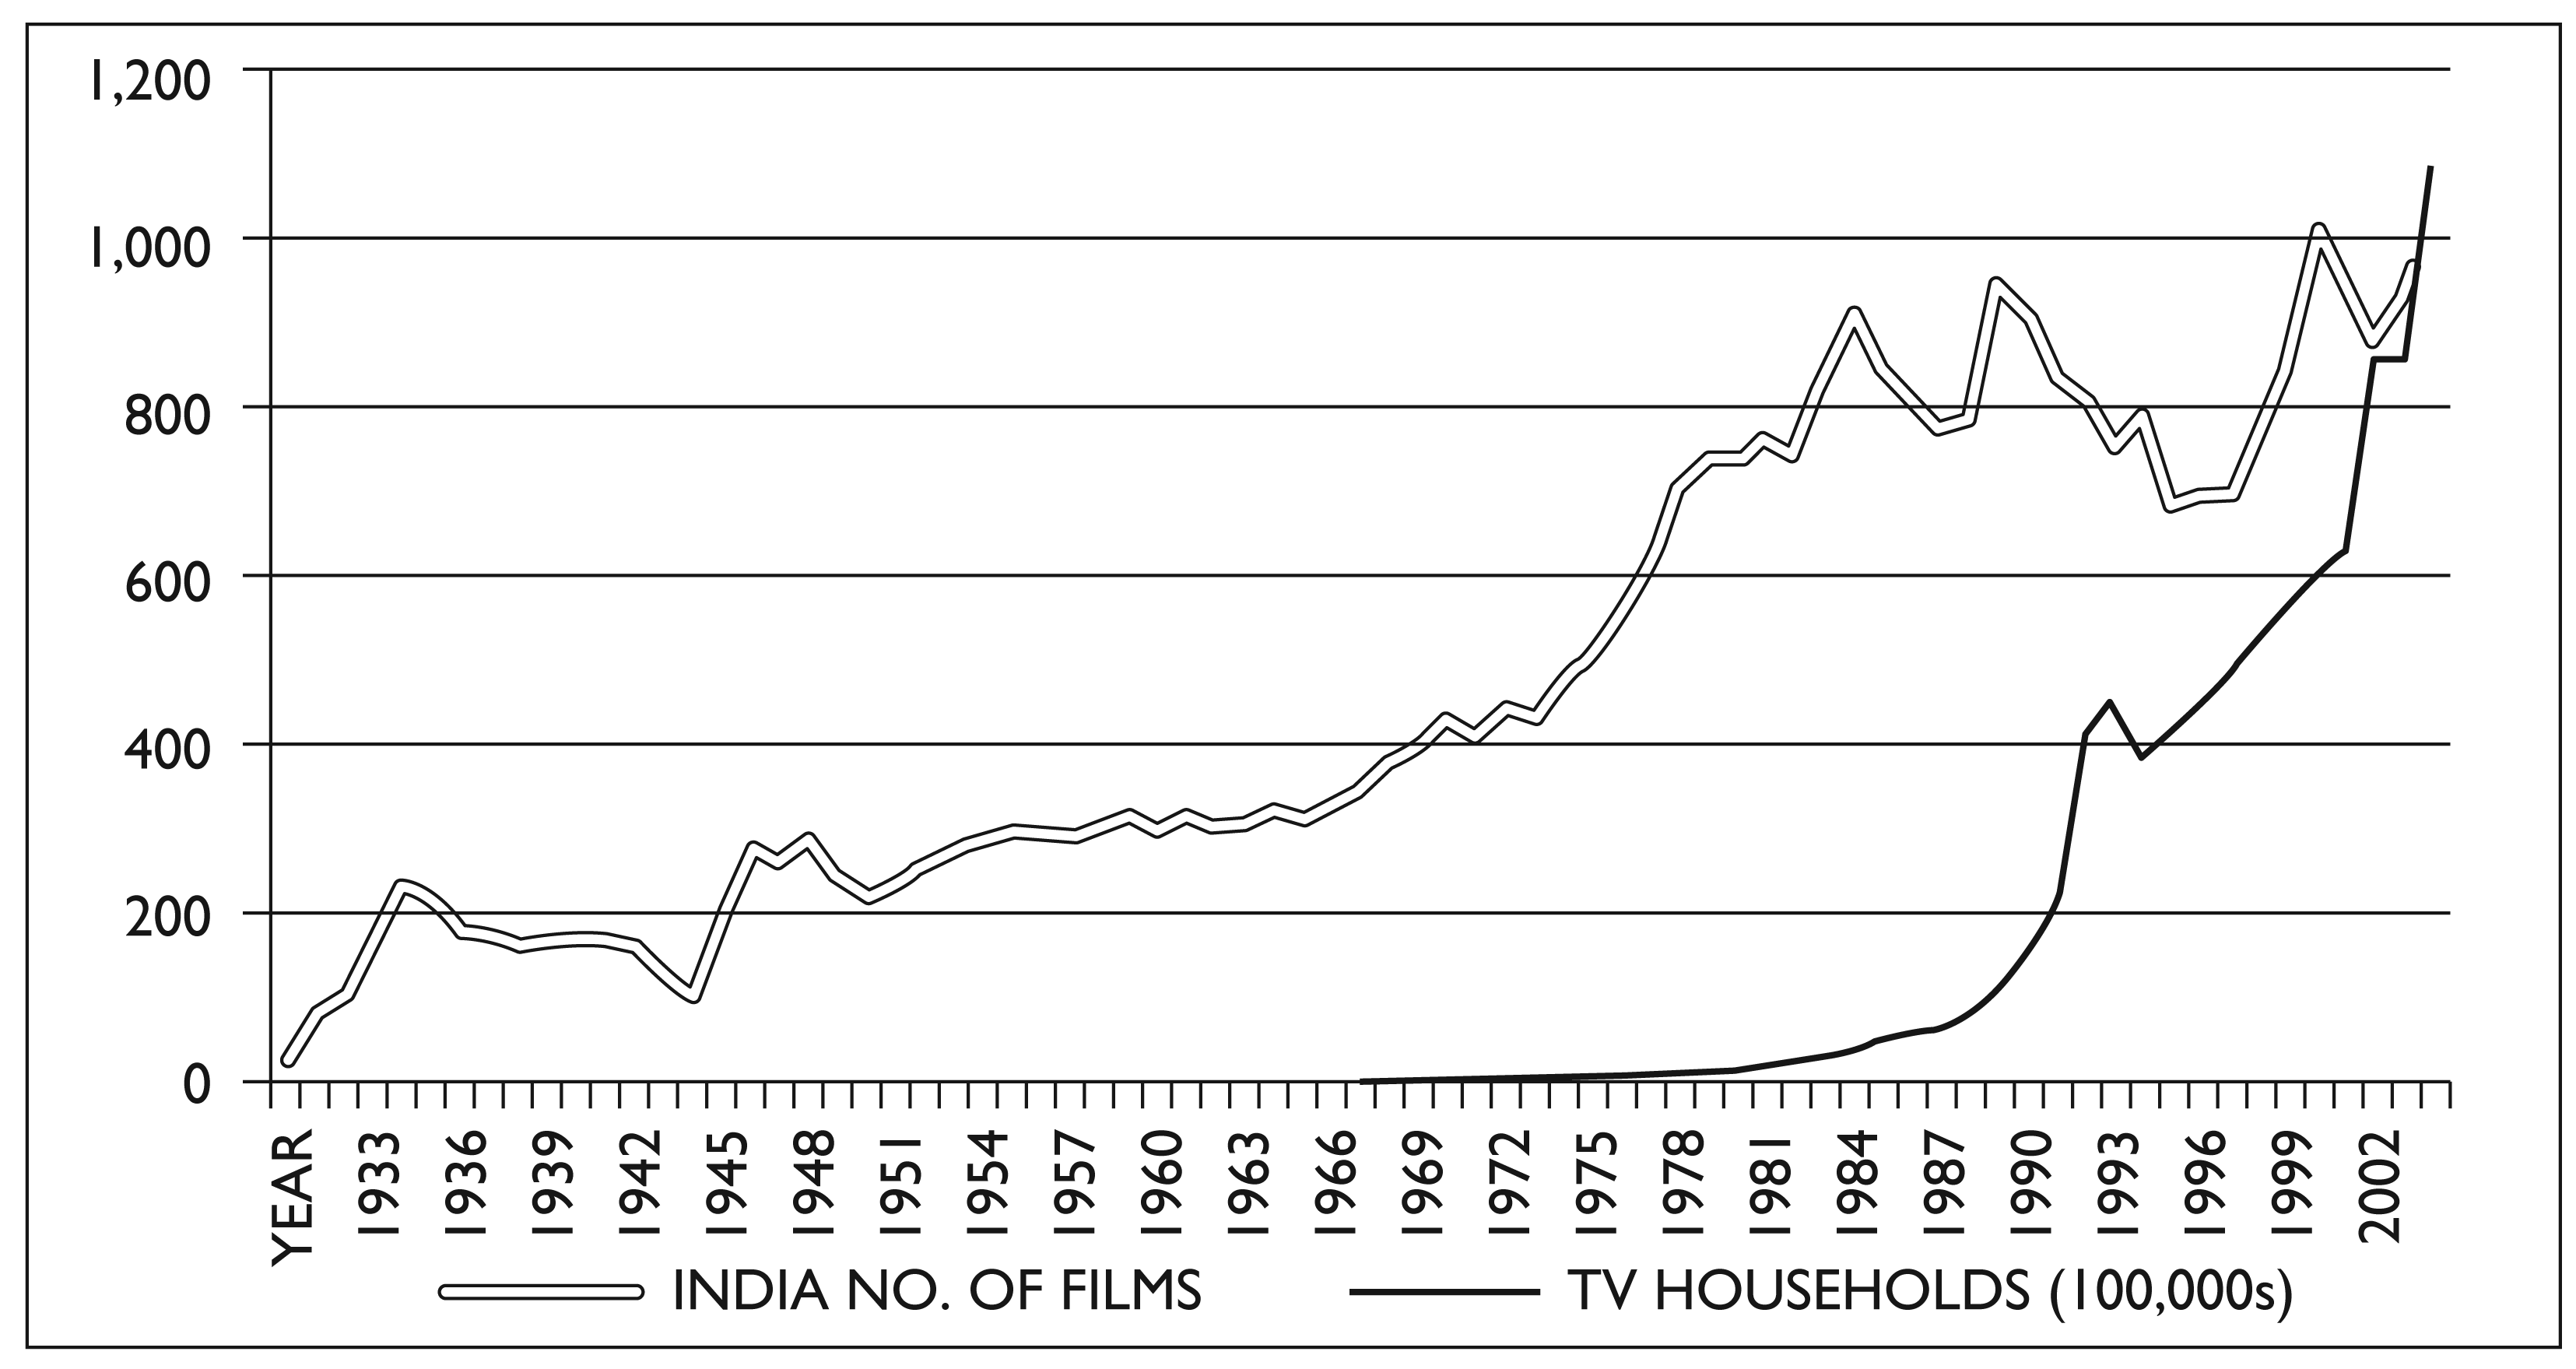
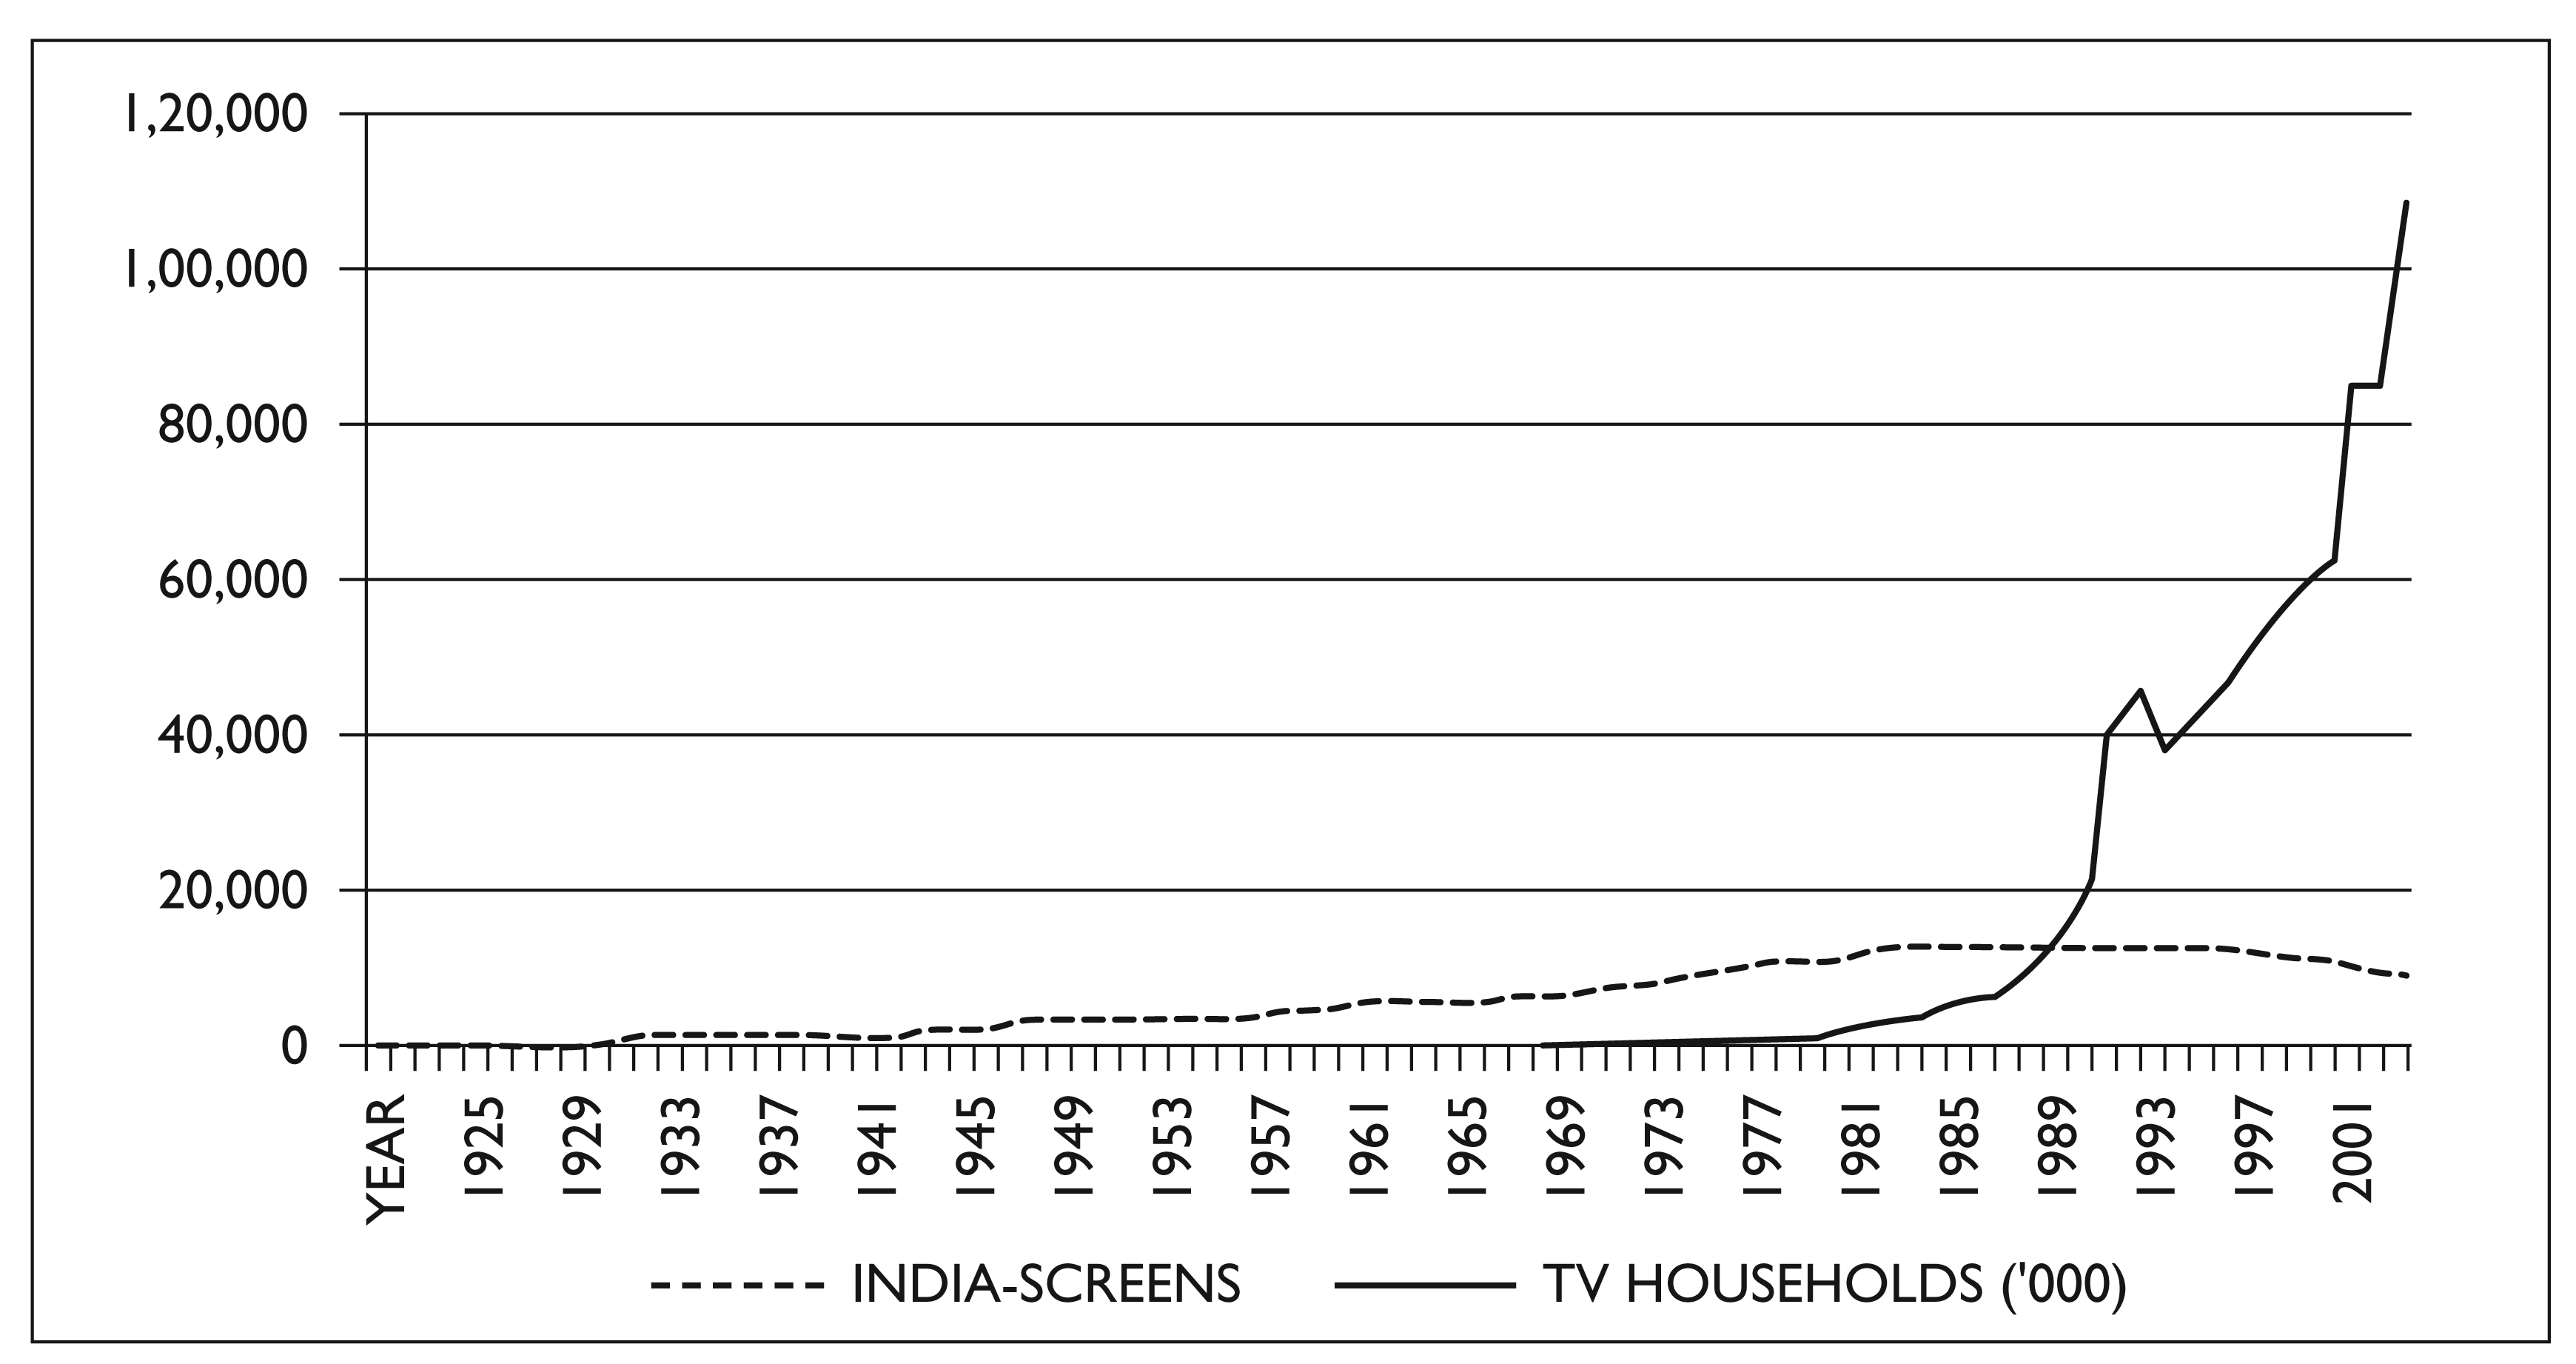
First, we notice almost immediately that television diffusion in India is at a very different stage than in the USA, UK, France, Germany and Japan (see Figures 1–6). While television households have reached a plateau in all these countries, television households in India are still steeply increasing.
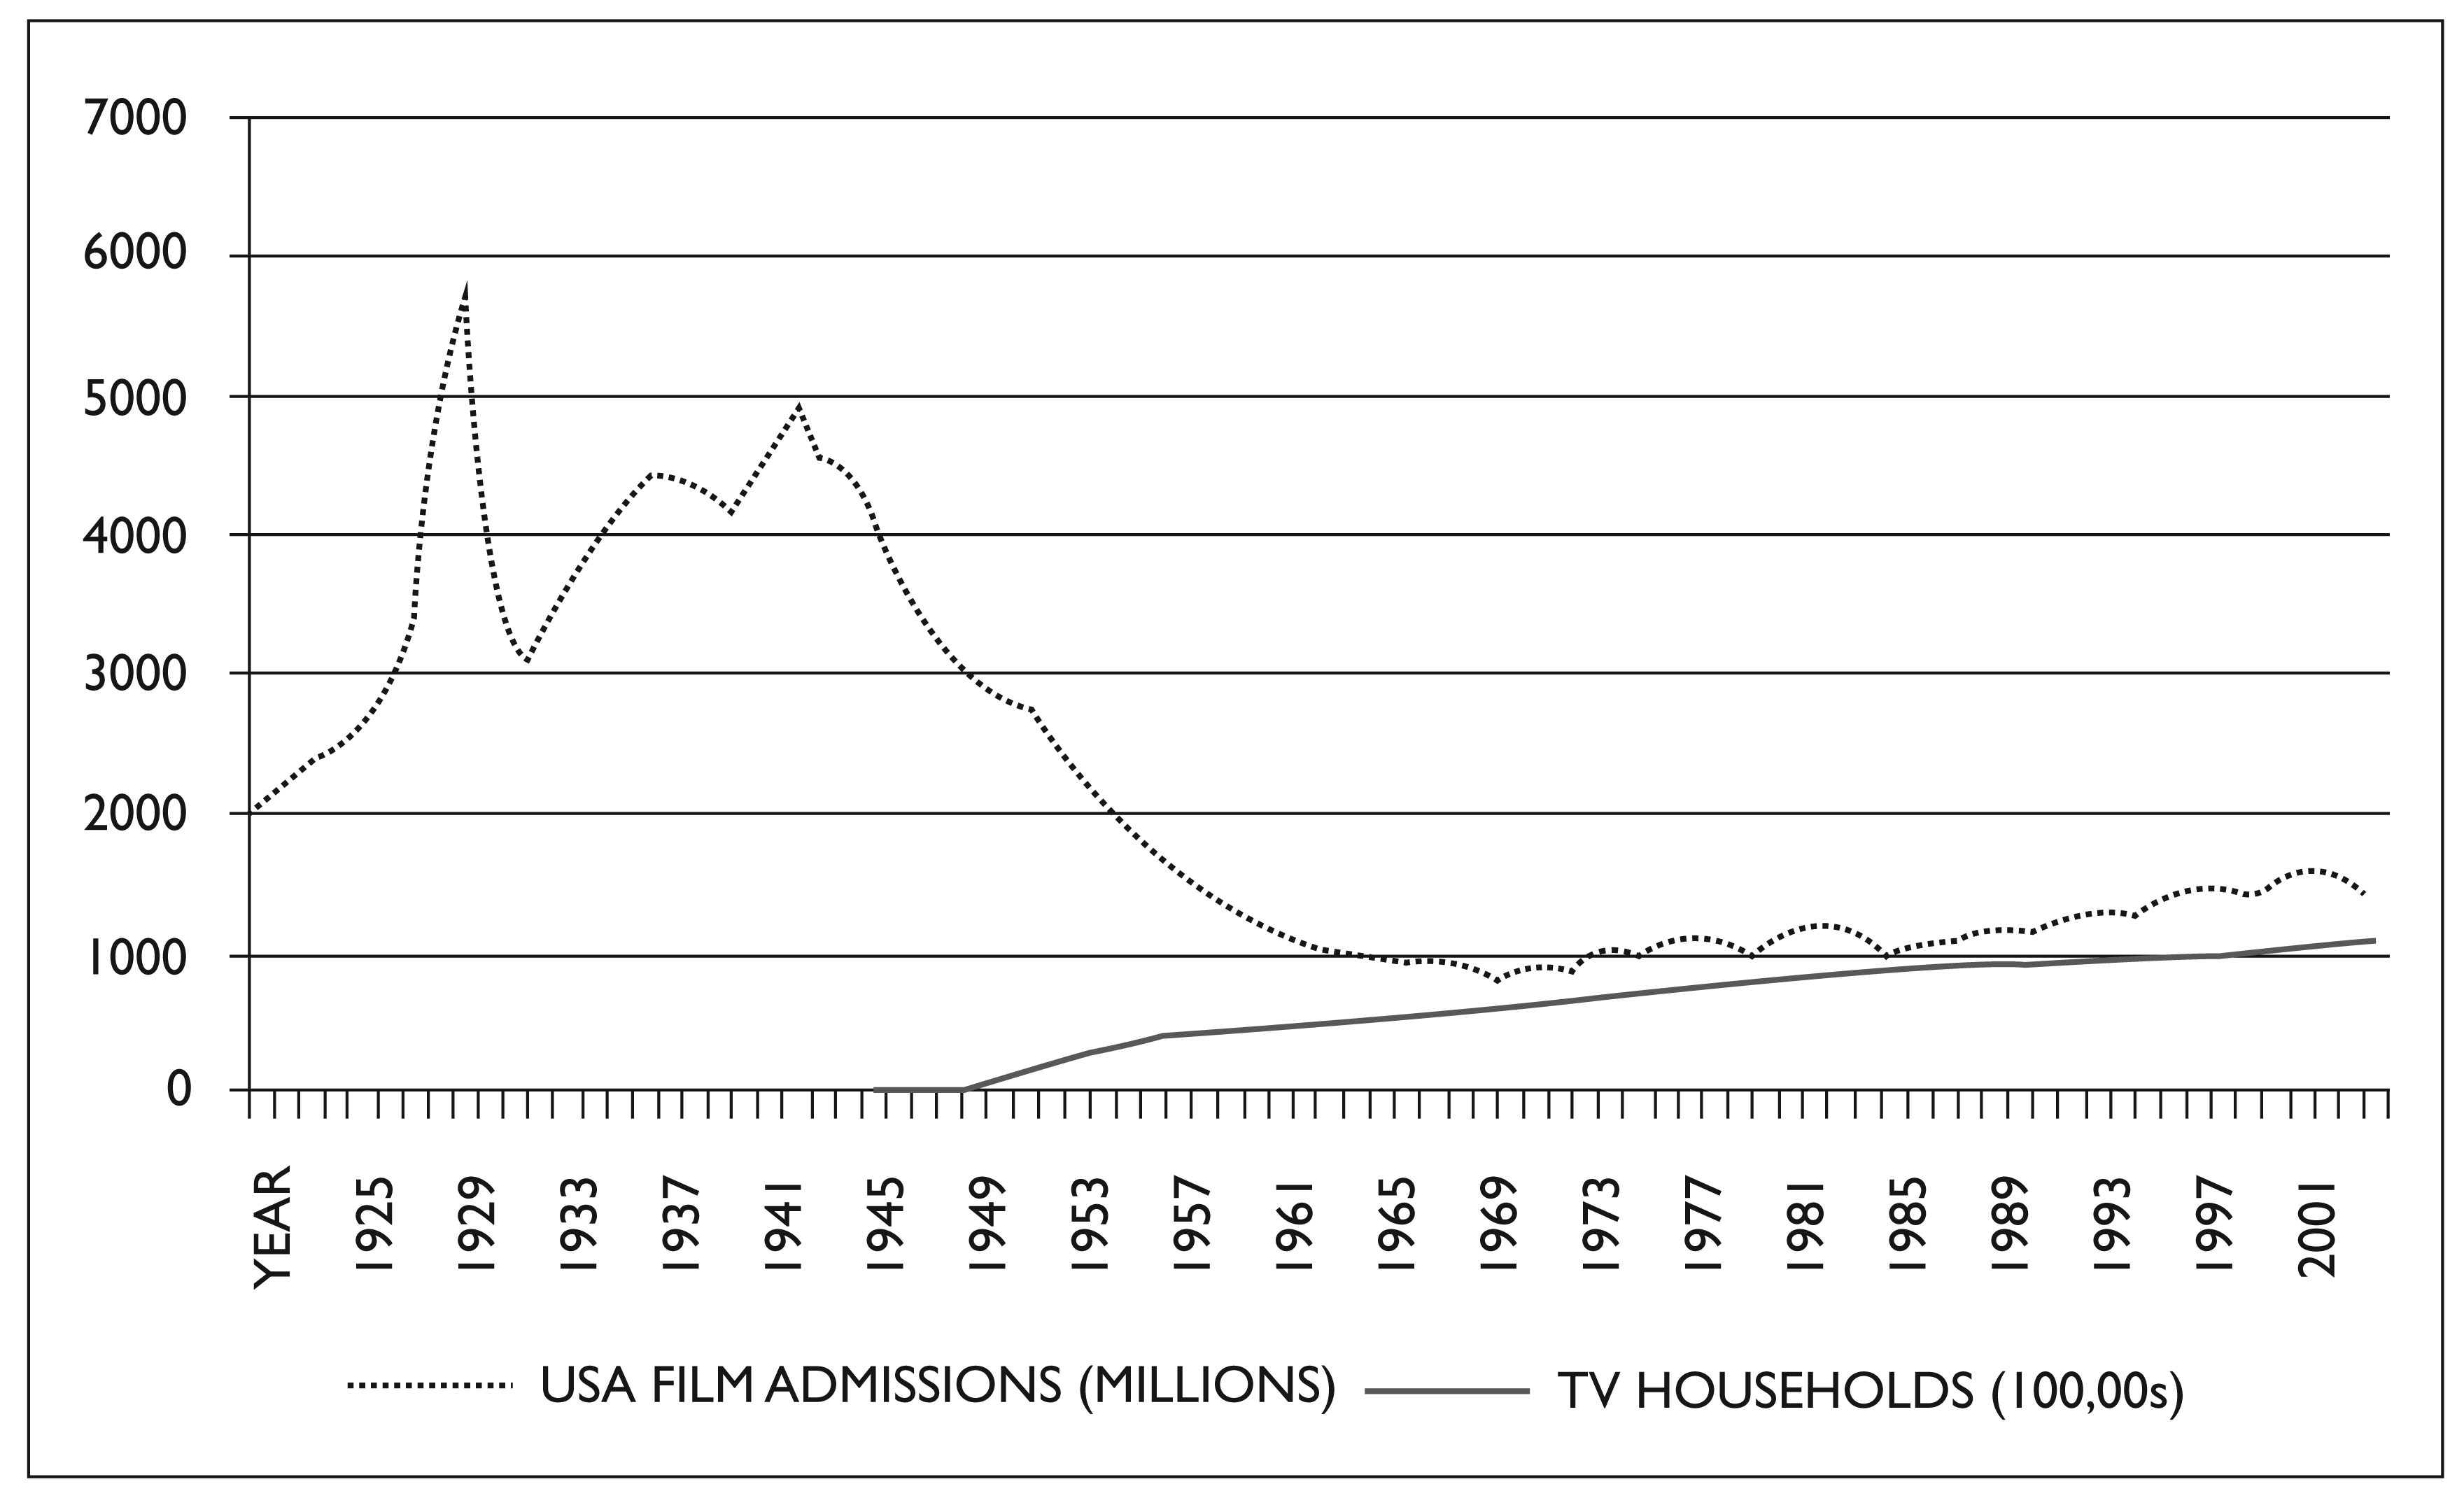
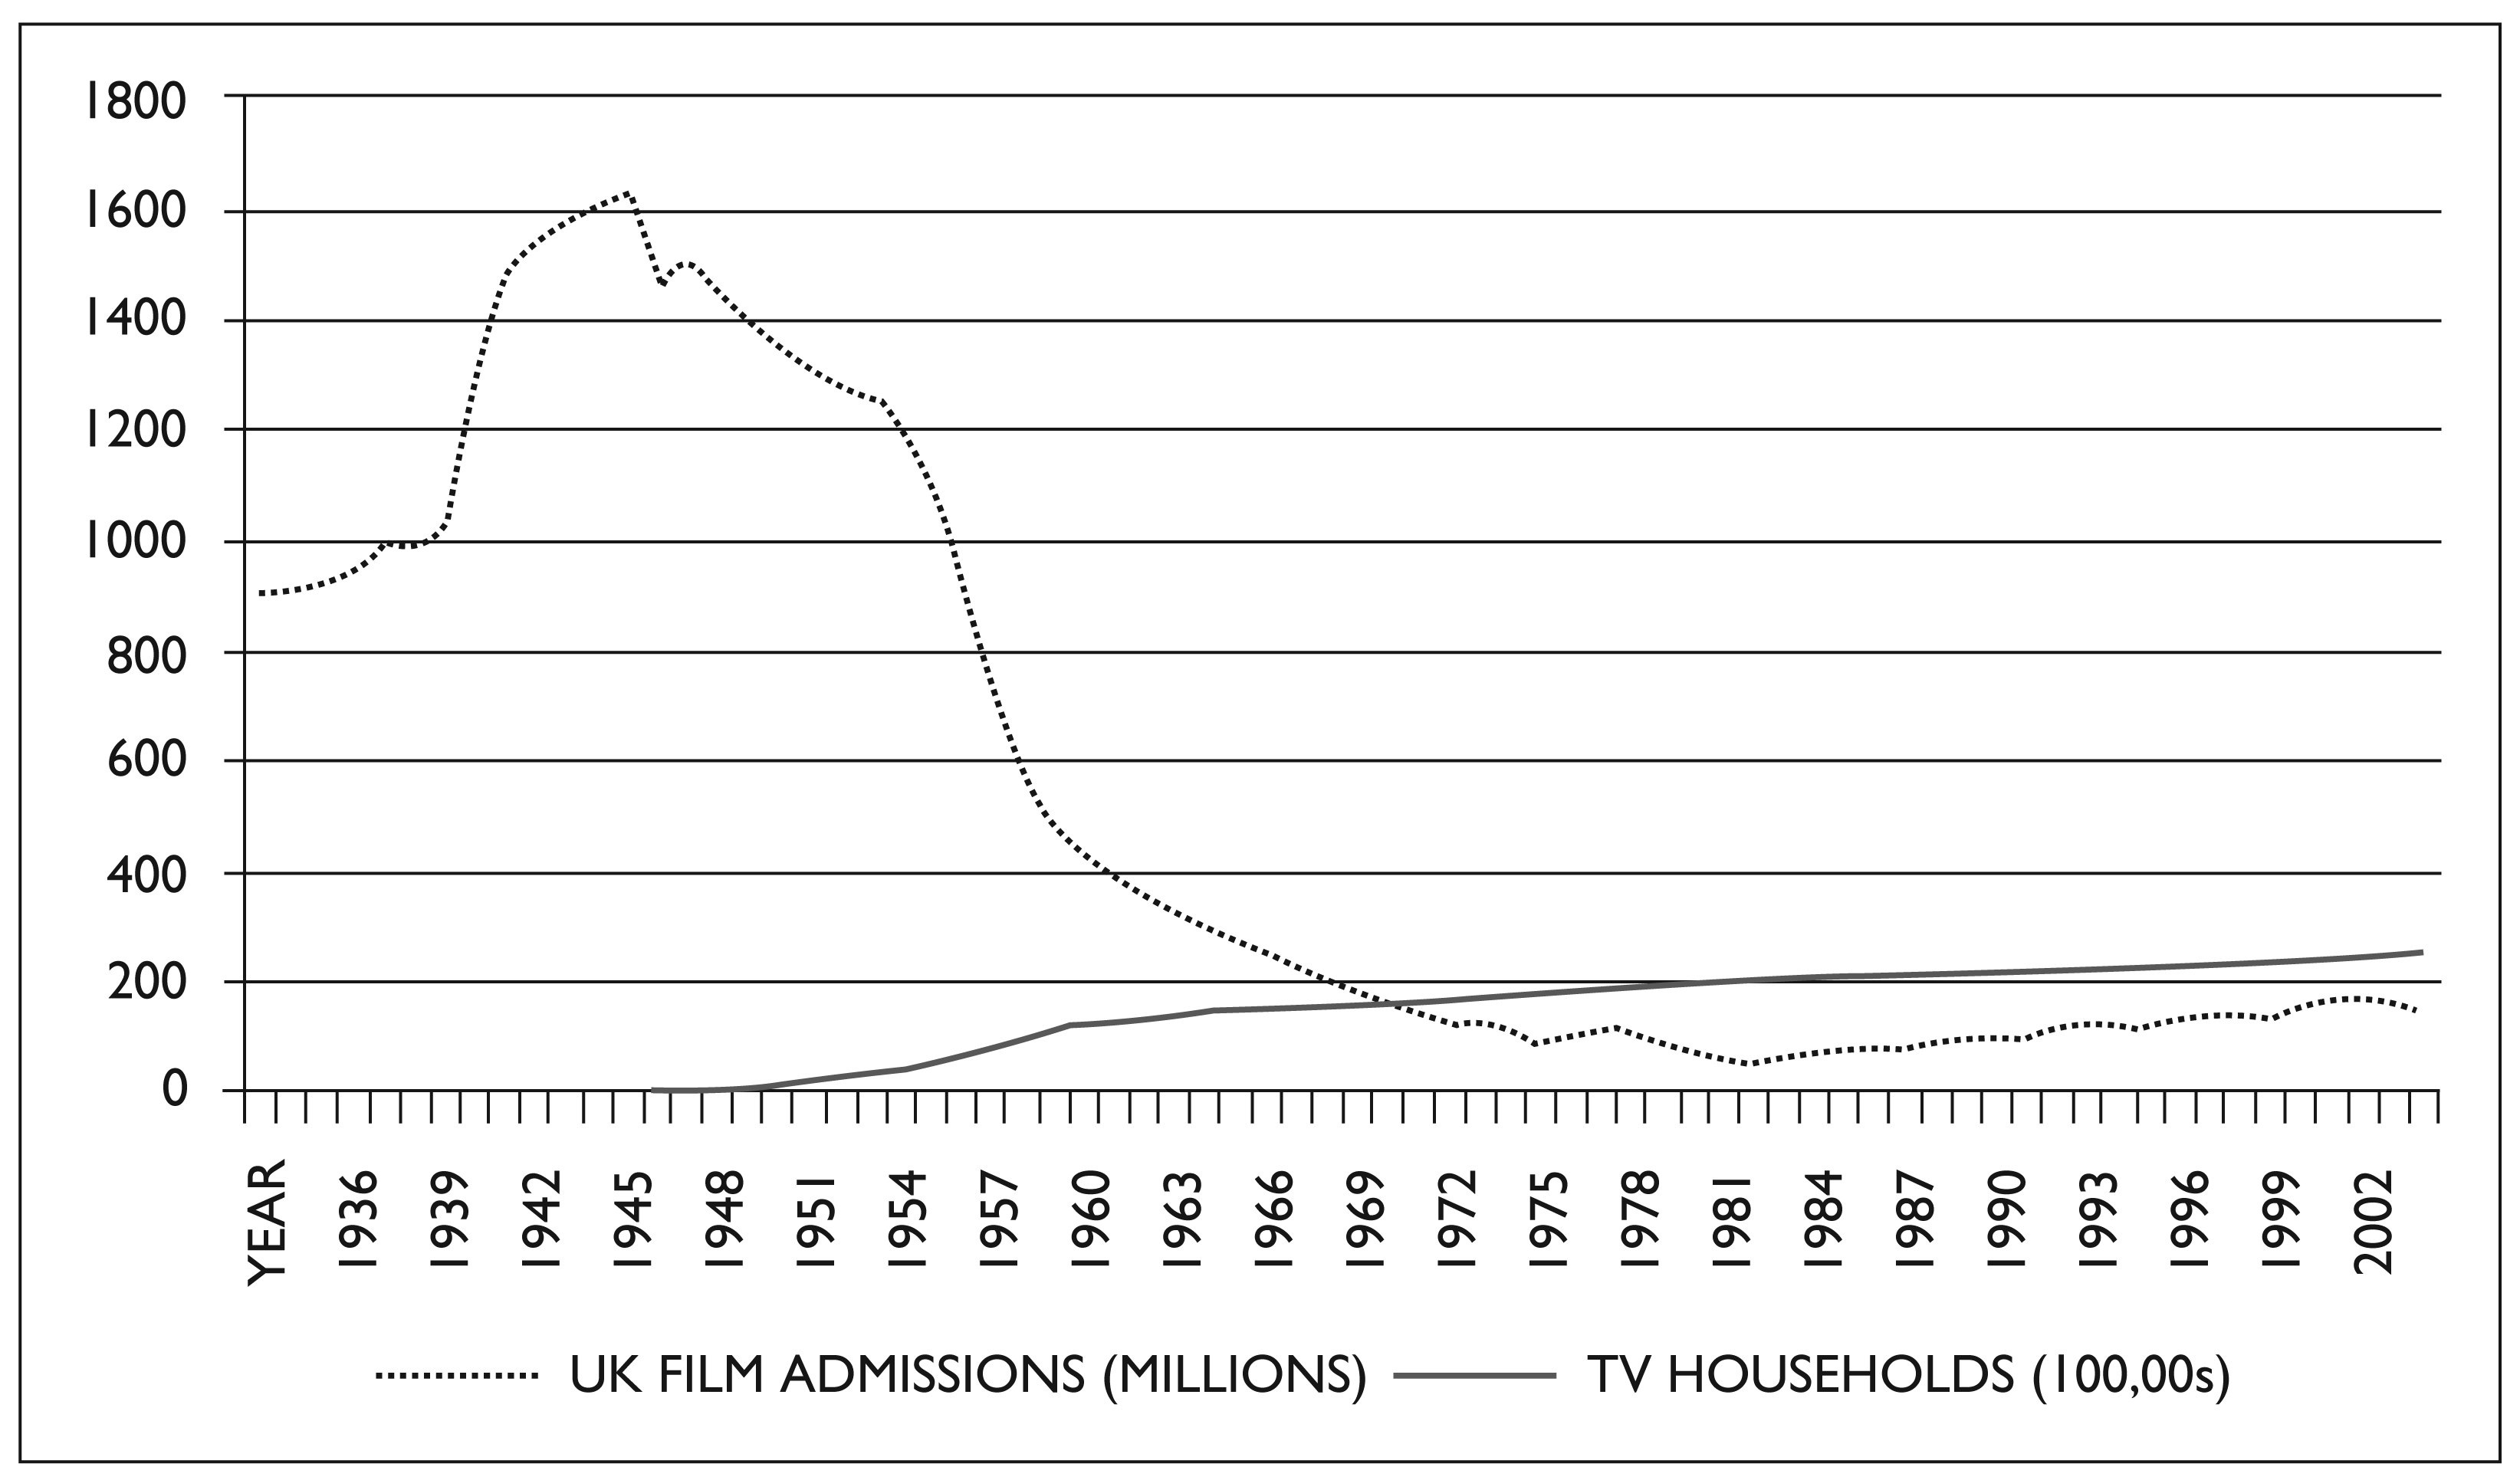
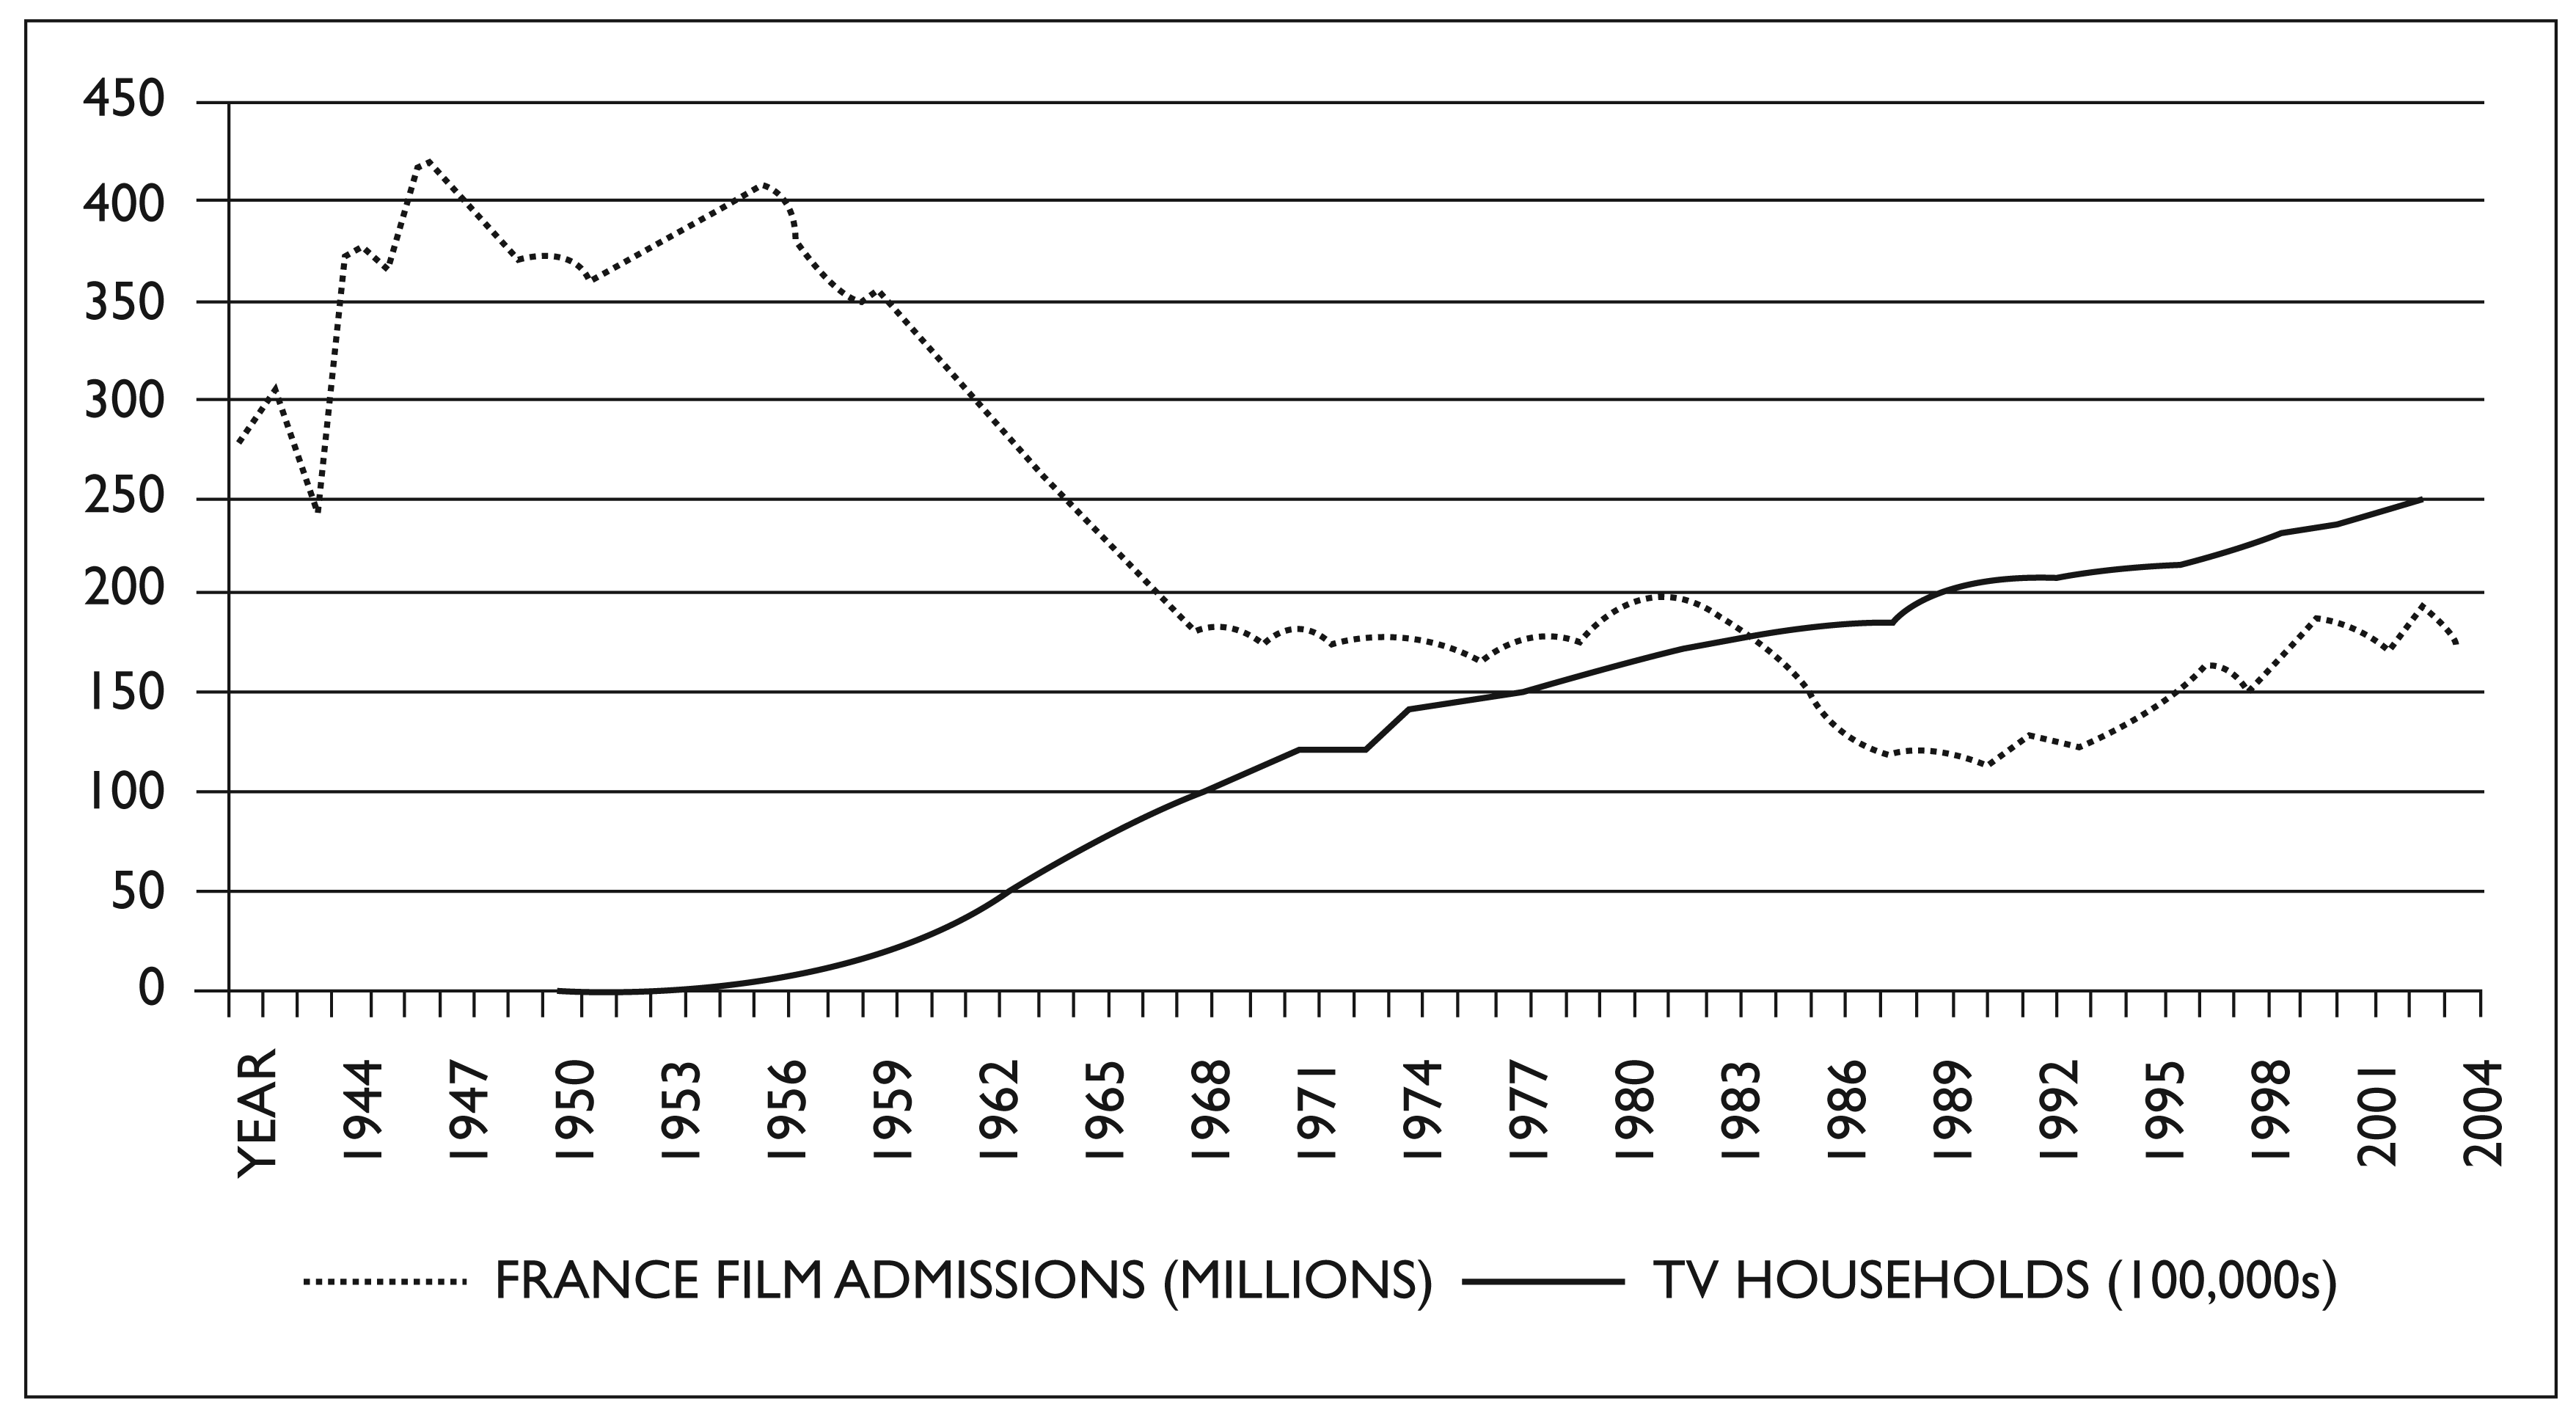
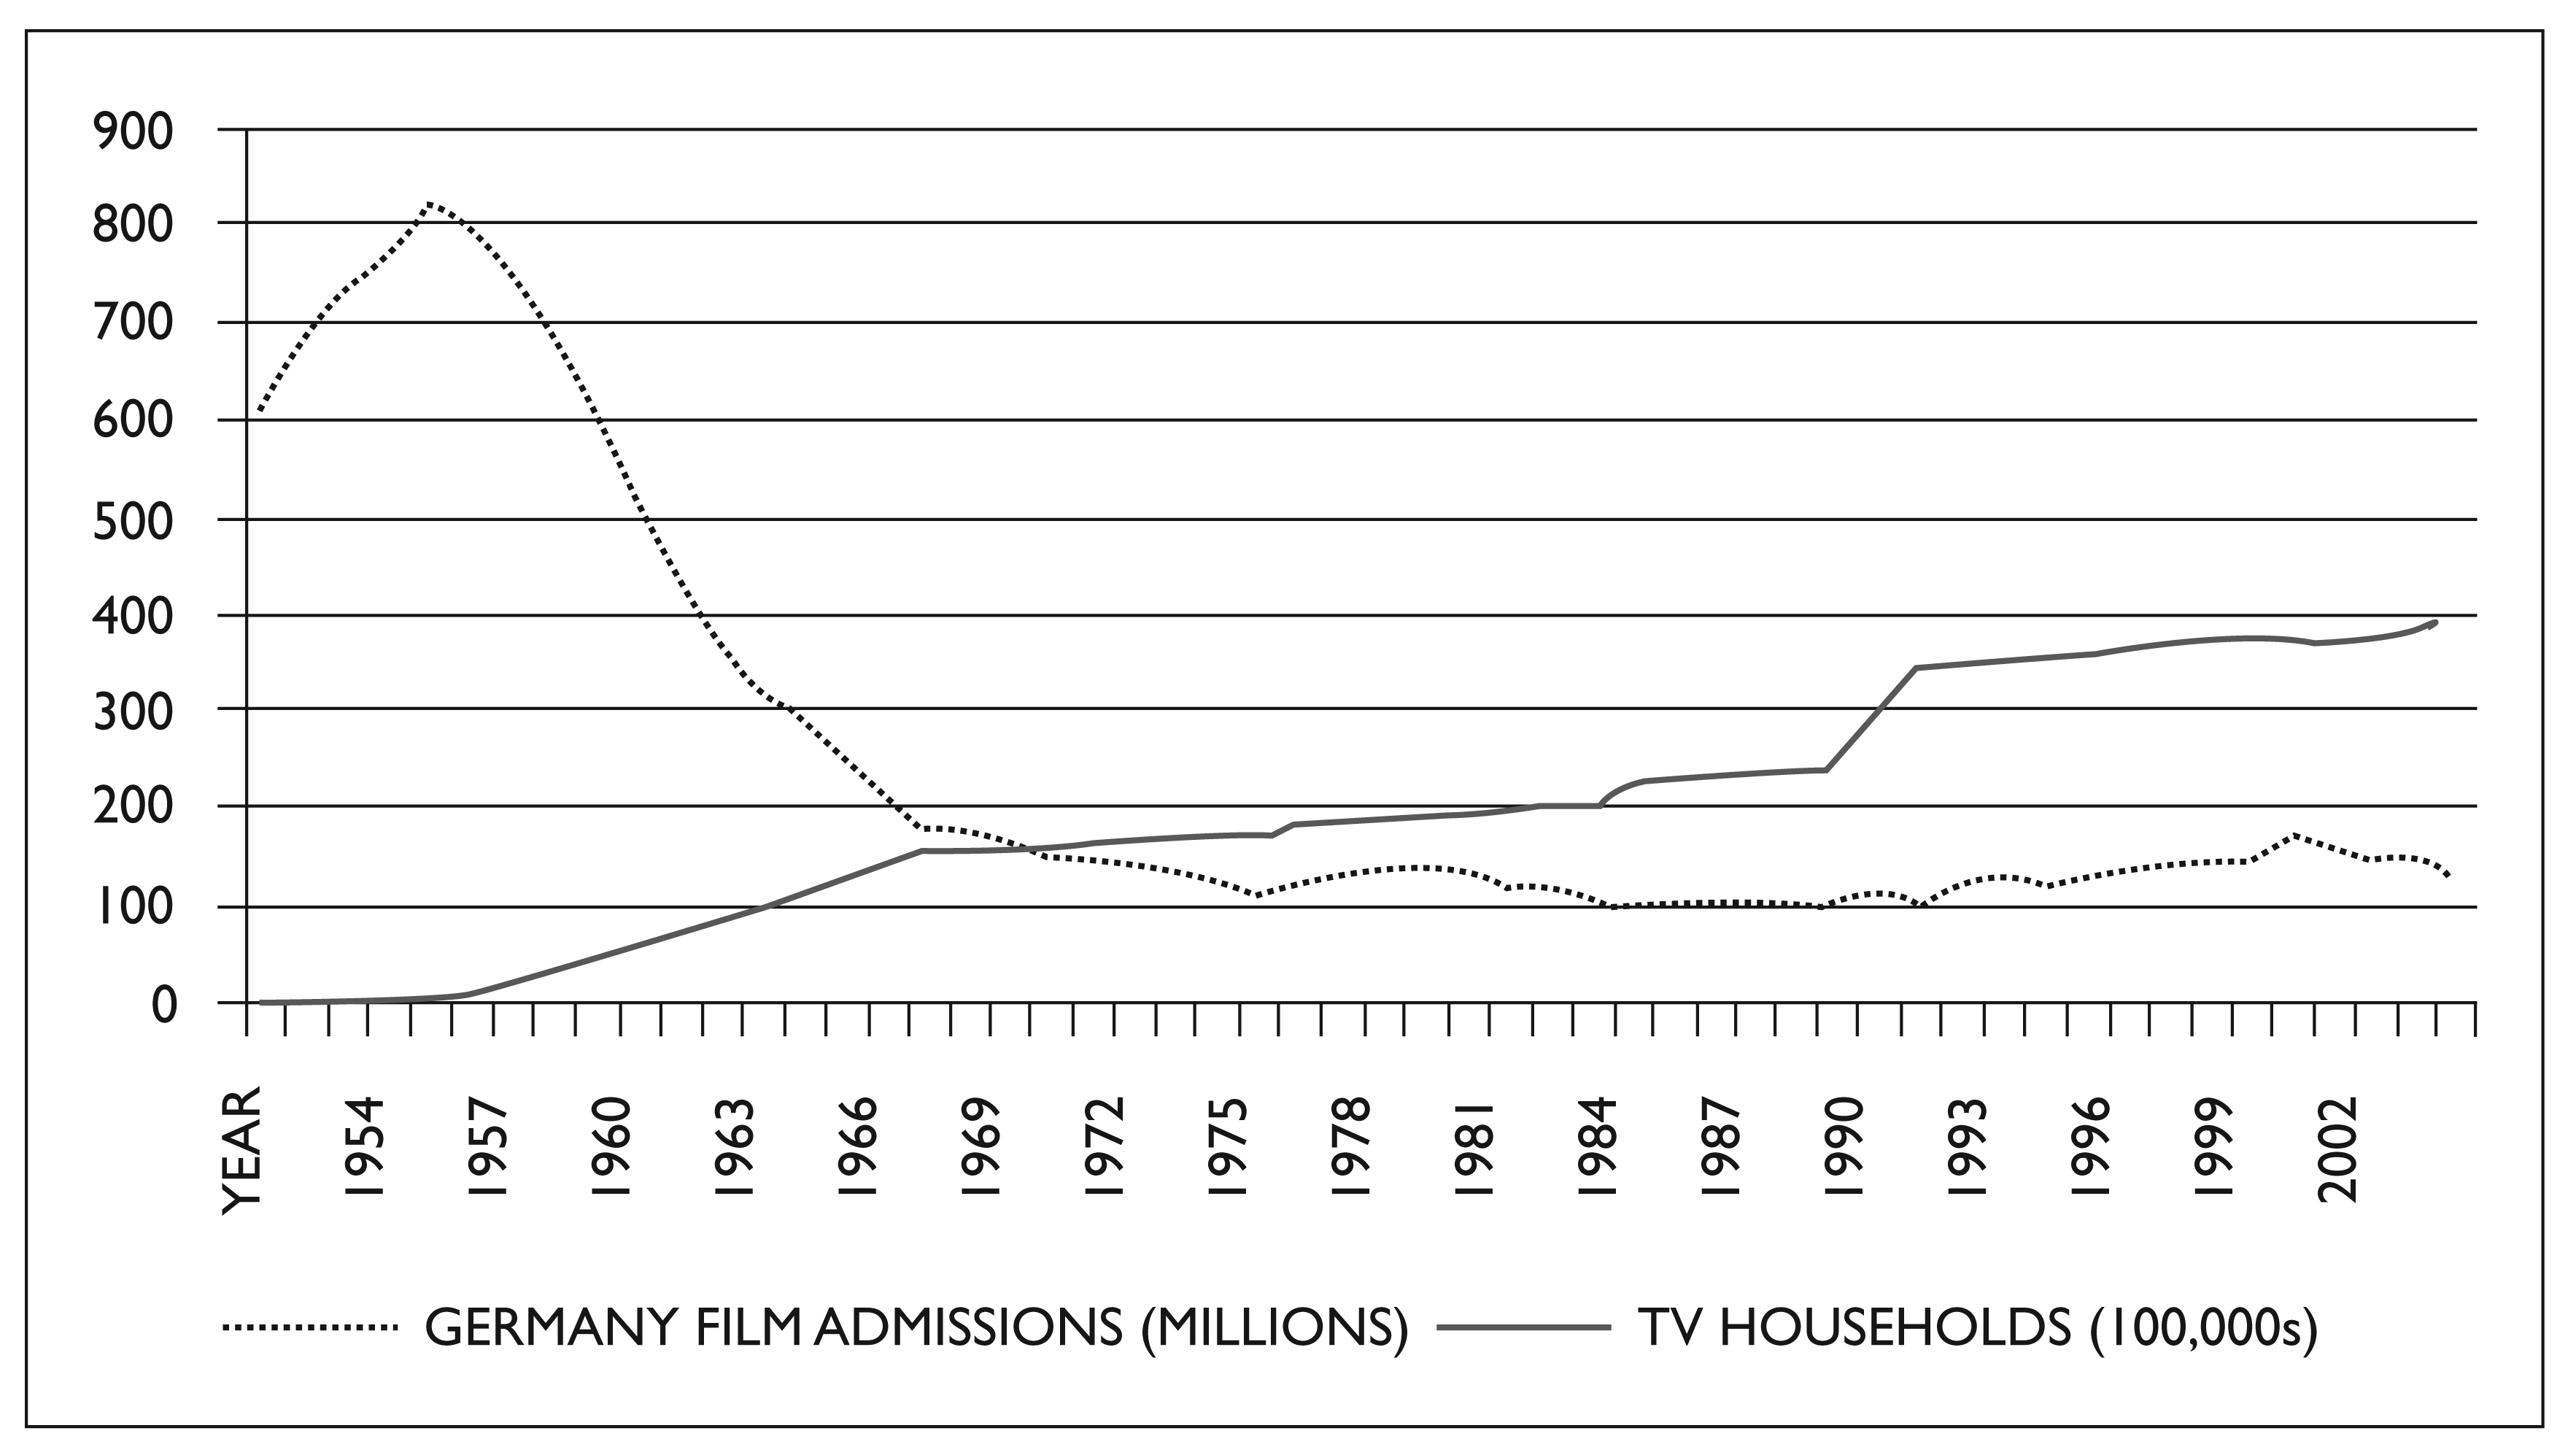
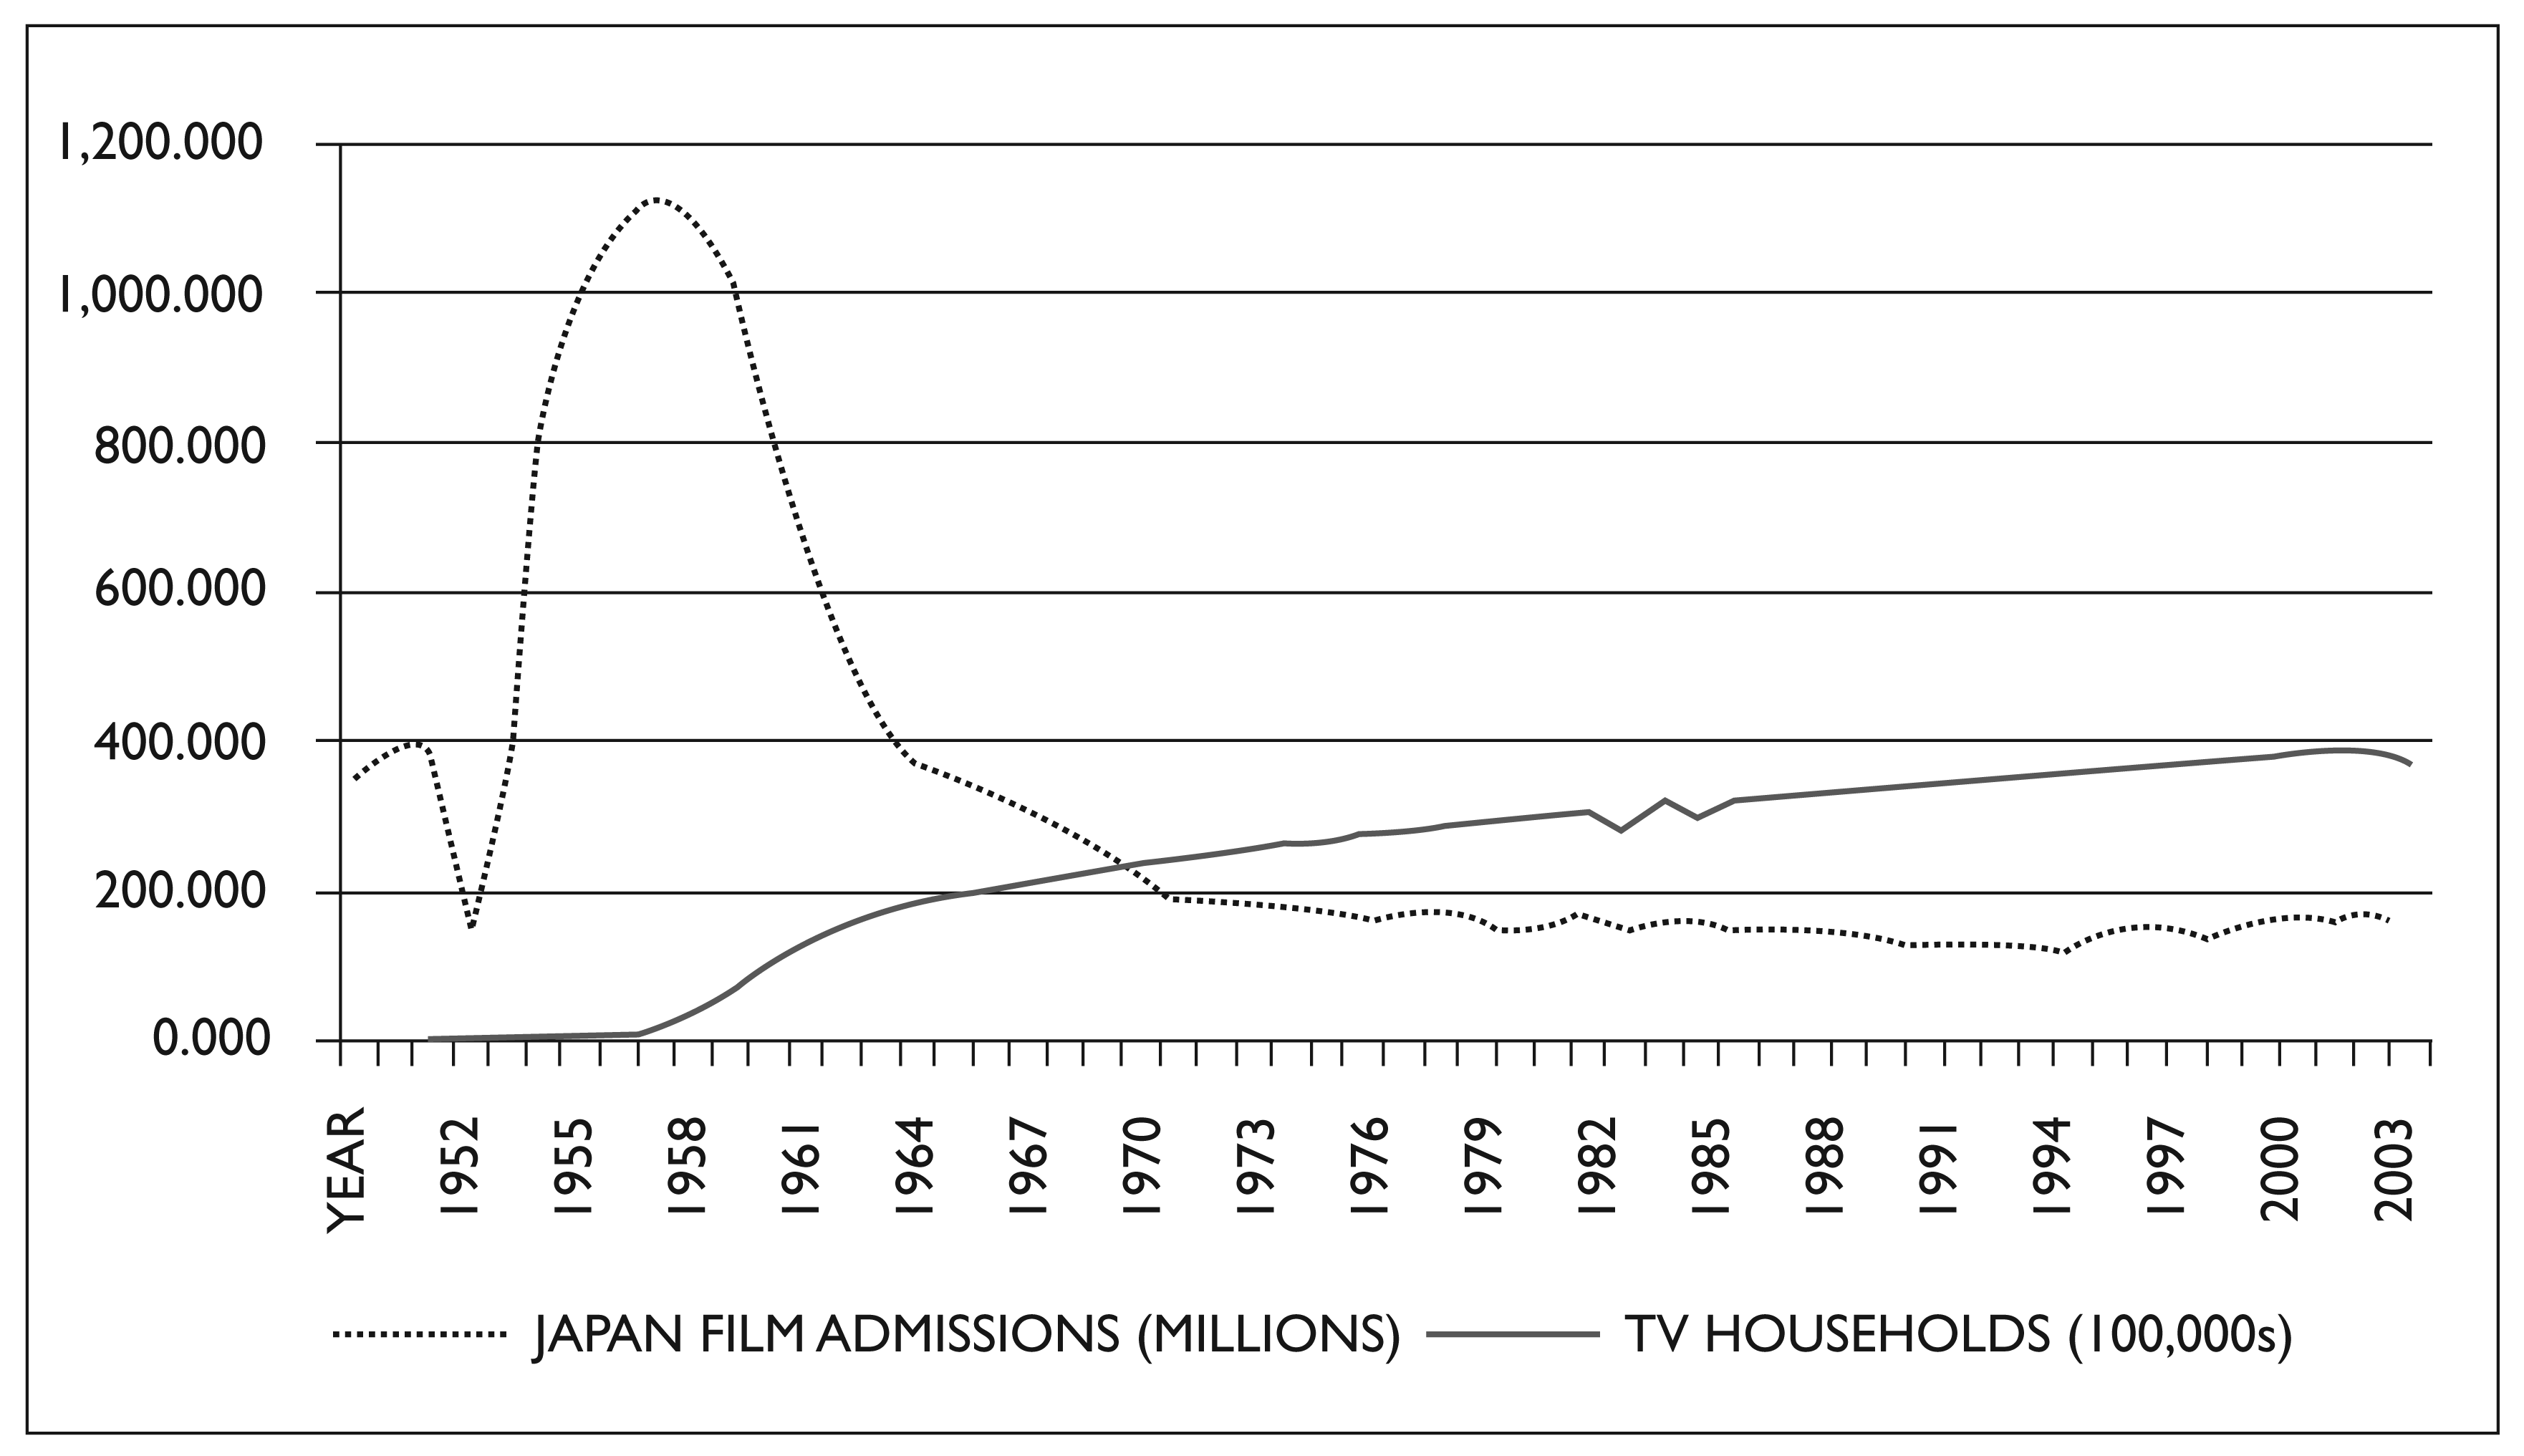
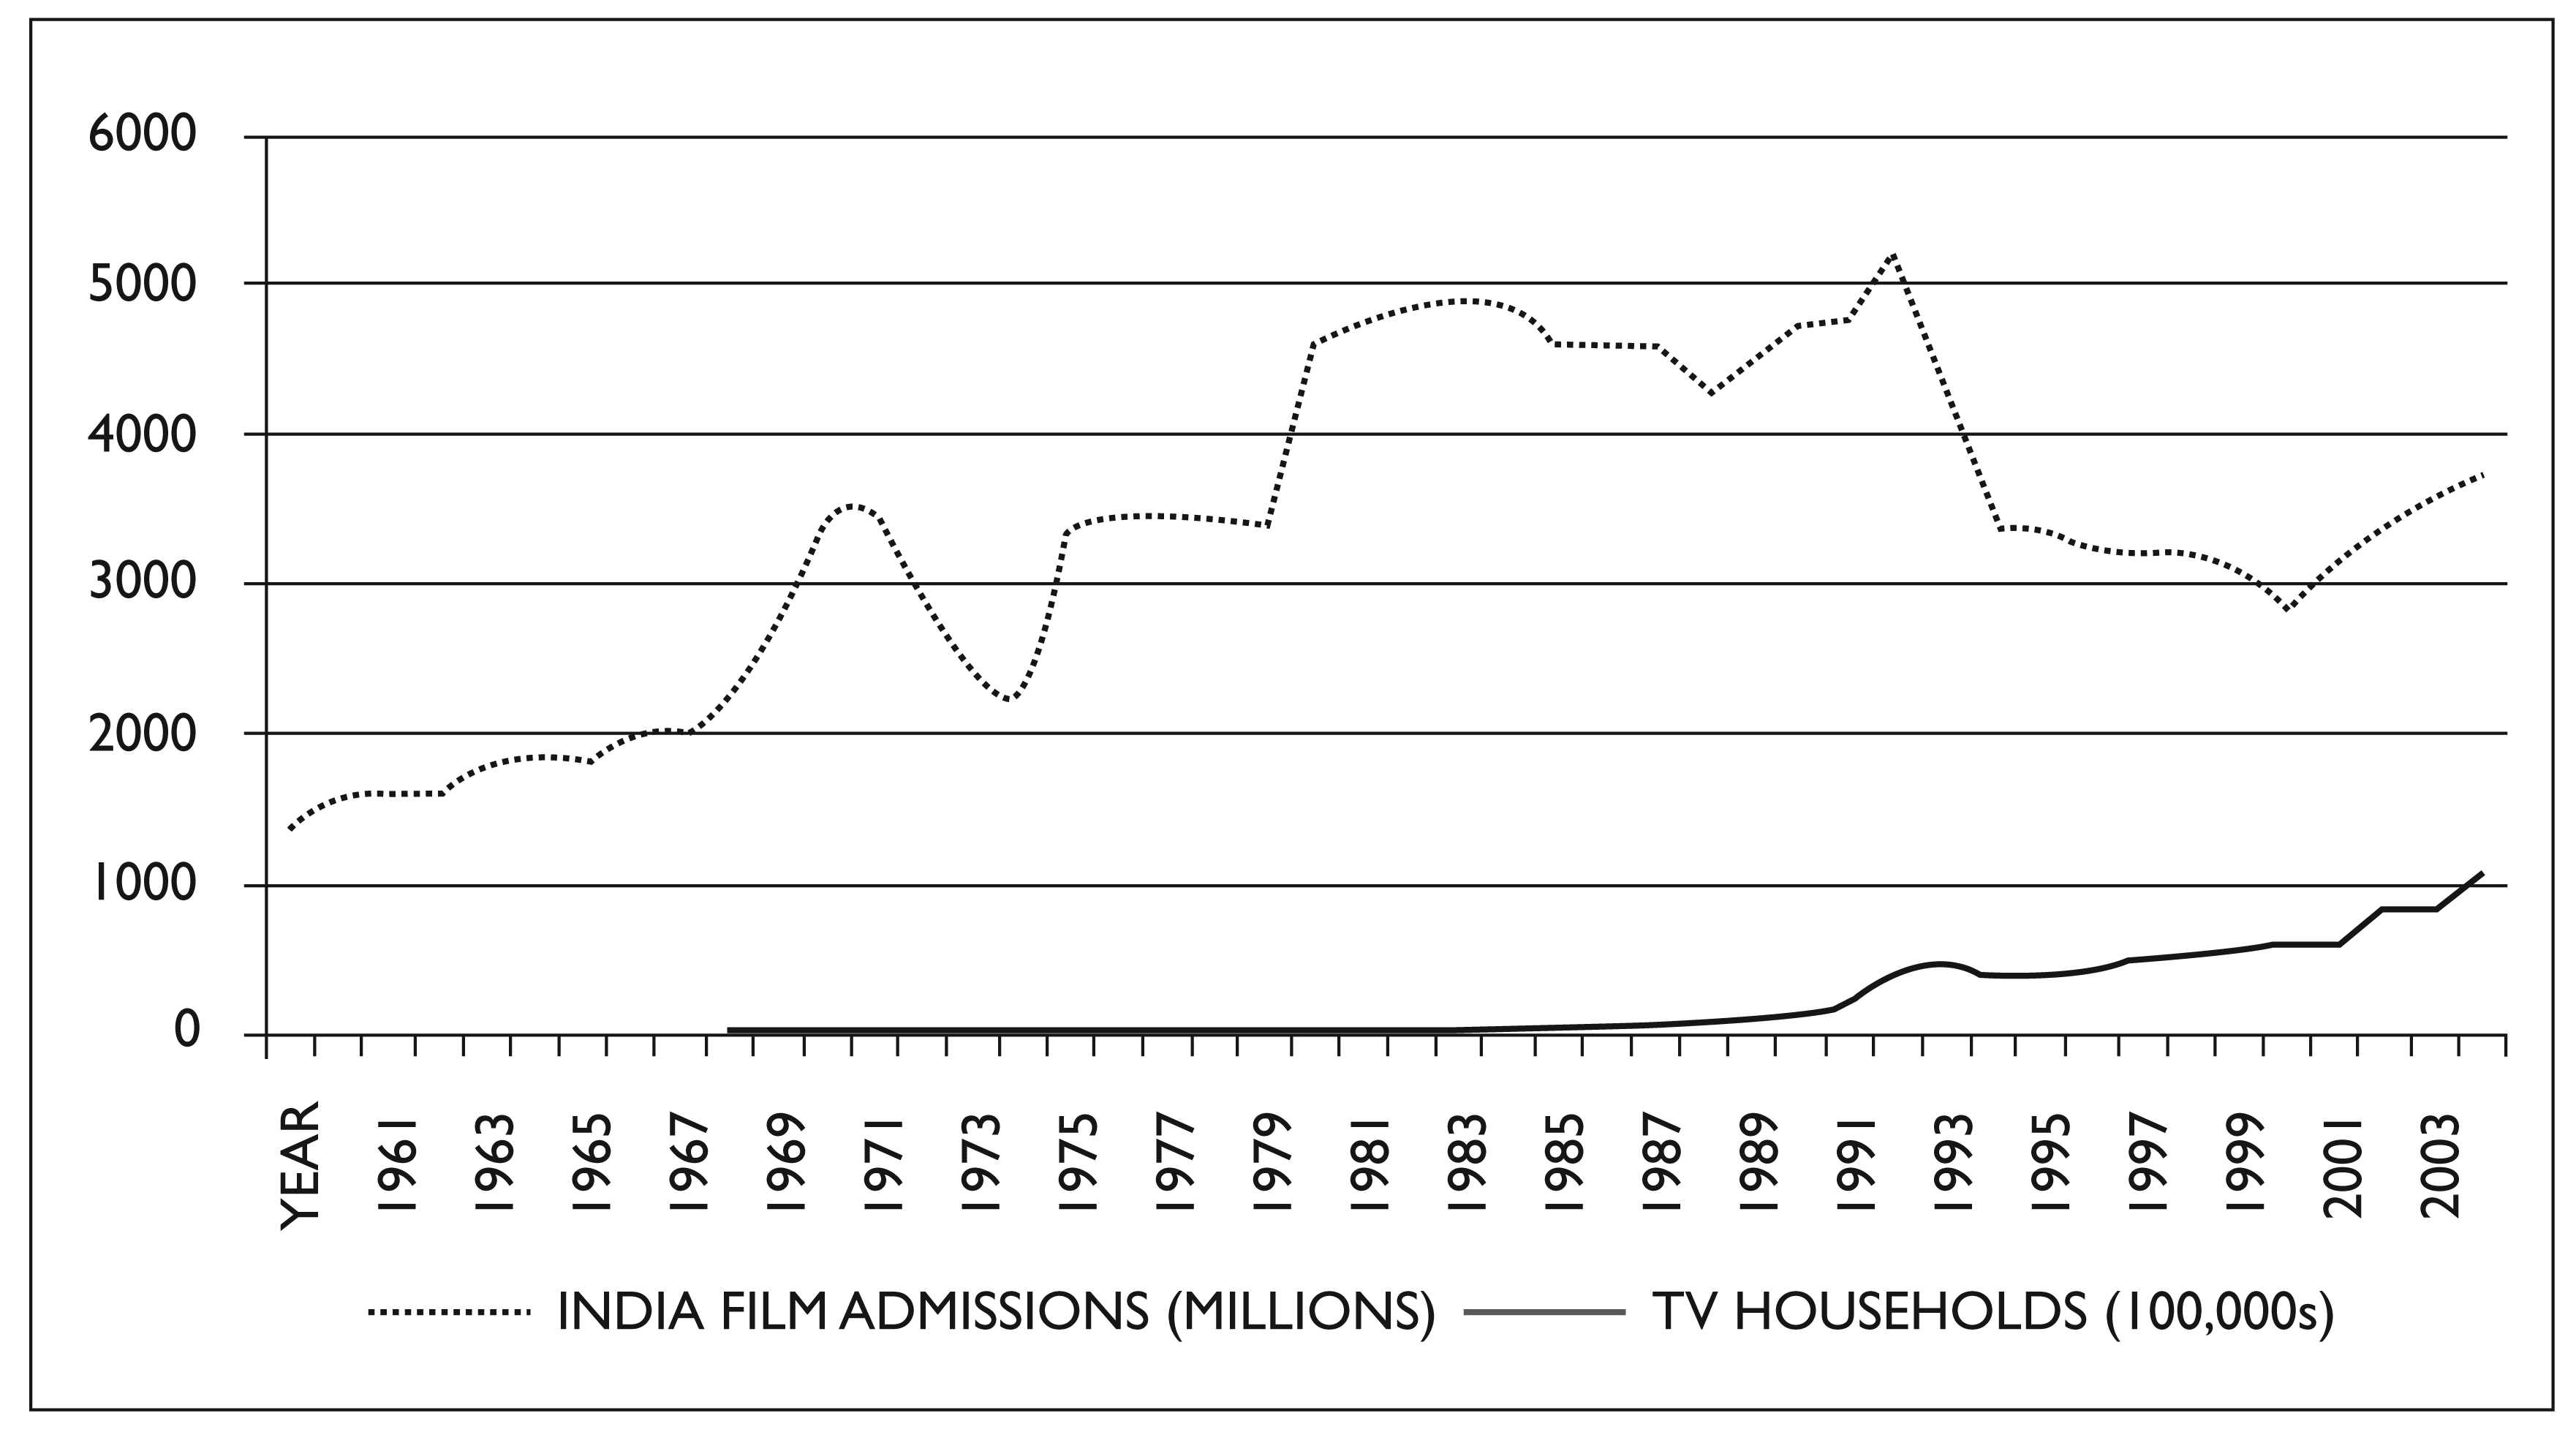
Second, we see the precipitous decline in aggregate film admissions along with the increase in television households in all countries except in India. Indian film admissions appear to decline slightly with the arrival of television but seem to persist compared to film admissions in the other countries.
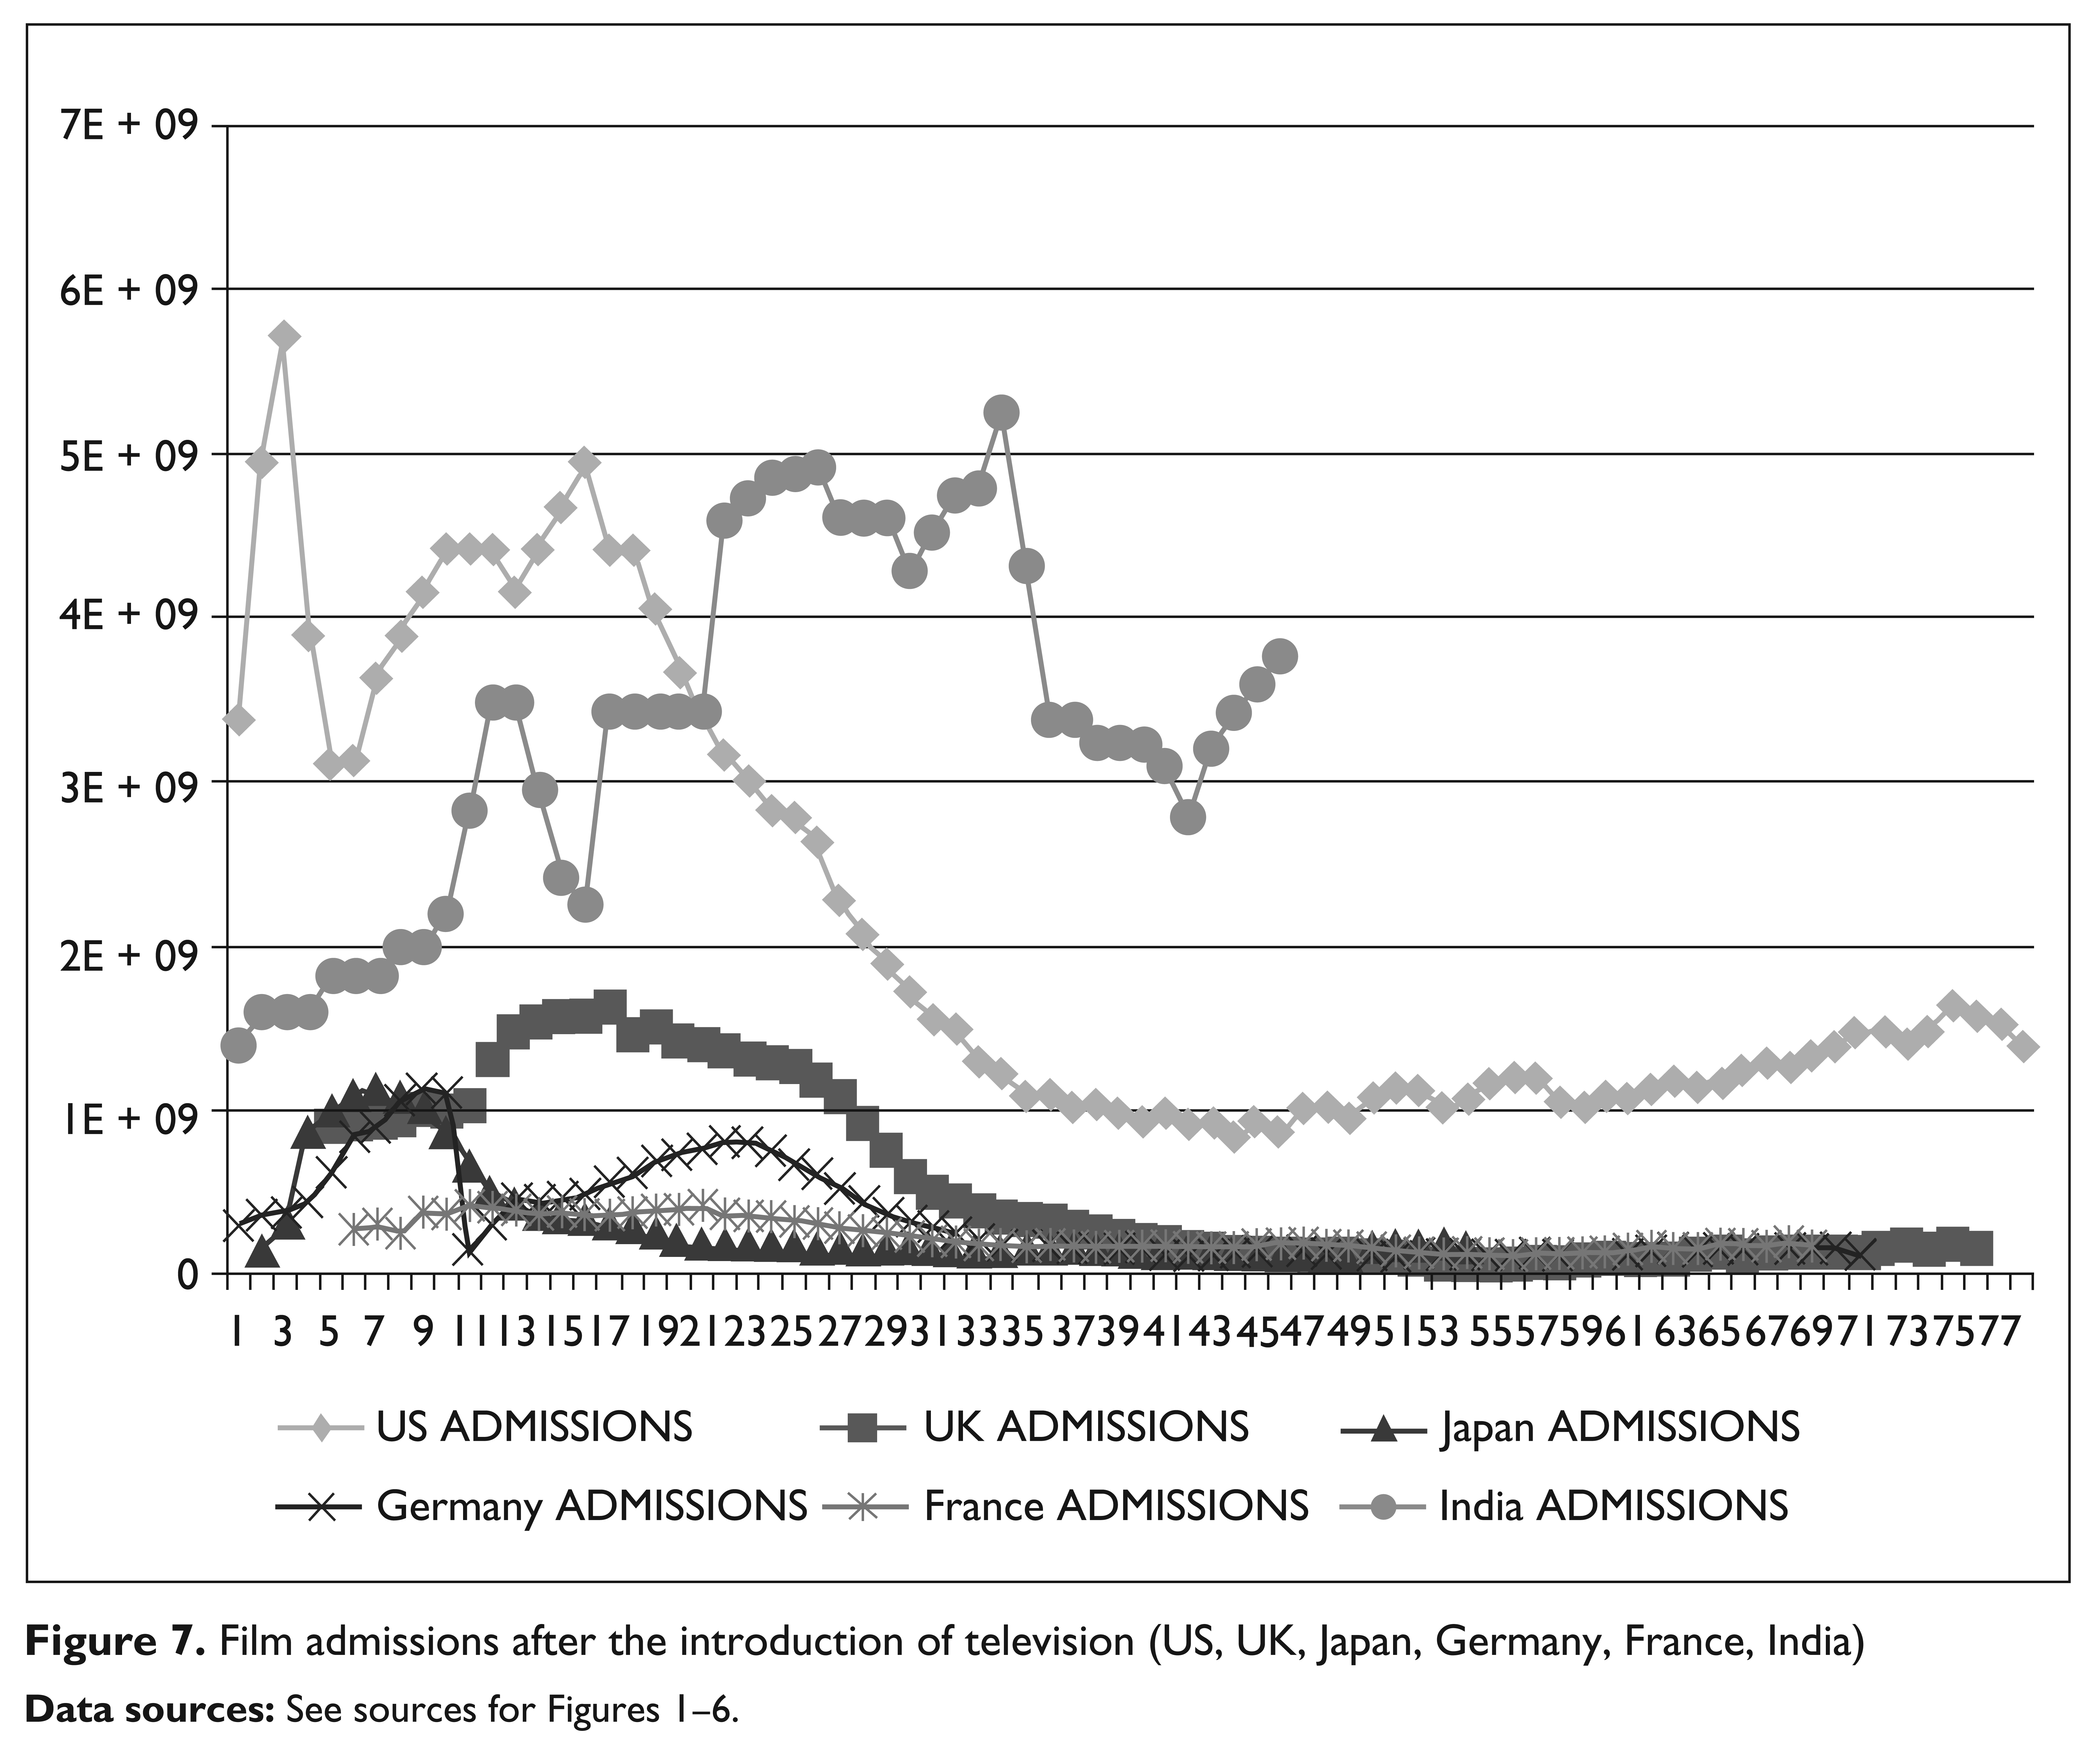
Trend lines for all countries show similar patterns—the decline of admissions as the diffusion of television increases. Television was introduced in these countries at different years. To compare patterns closely, film admissions in all countries were graphed together starting with the year that television was introduced in that country. Figure 7 shows the picture that emerges. It is startlingly evident that aggregate Indian film admissions follow a very different pattern from the USA, UK, France, Germany and Japan. Within two decades of the introduction of television, admissions in all these countries were rapidly declining, whereas Indian admissions continued to increase well into the third decade of the introduction of television.
Per Capita Film Admissions and Television Households
For graphing convenience, the per capita television household figure was multiplied by 100, since otherwise it was difficult to fit both the trend lines in the same figure. In Figures 8–13, we see that per capita admissions have declined just as precipitously as did aggregate admissions in the USA, UK, France, Germany and Japan as television penetration increased. Indian per capita admissions have also declined, but not quite as much as in other countries.
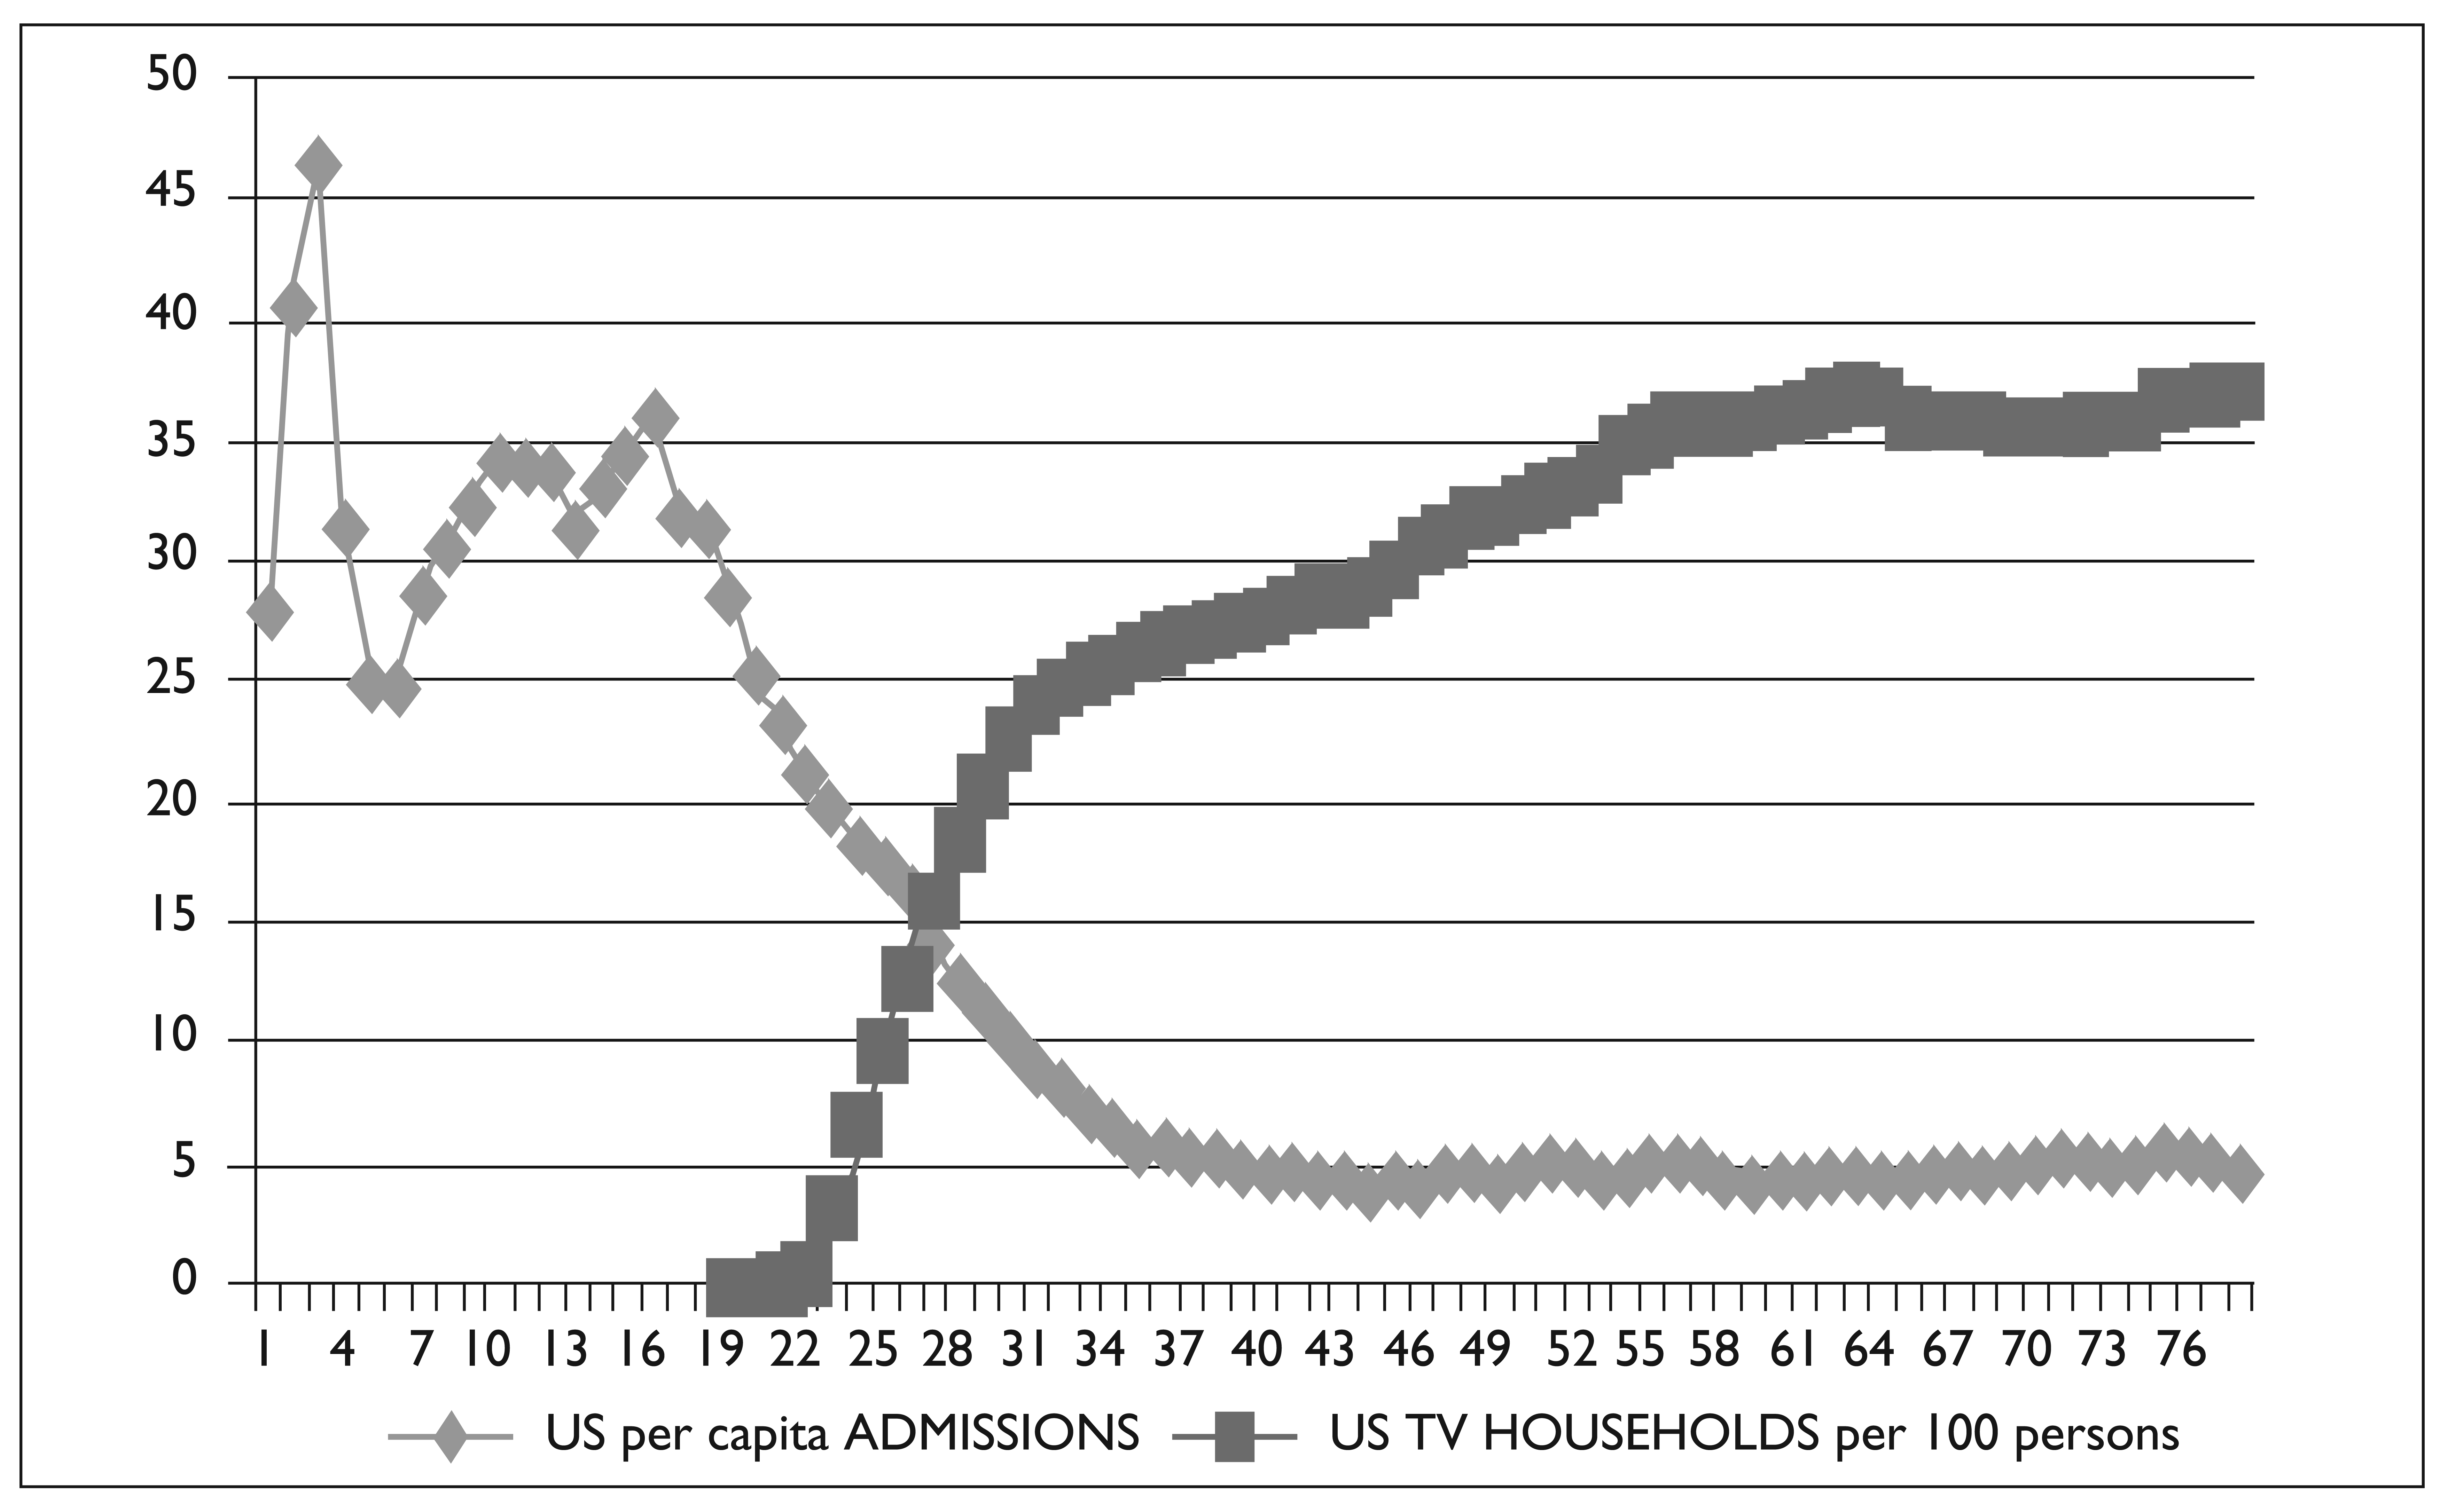
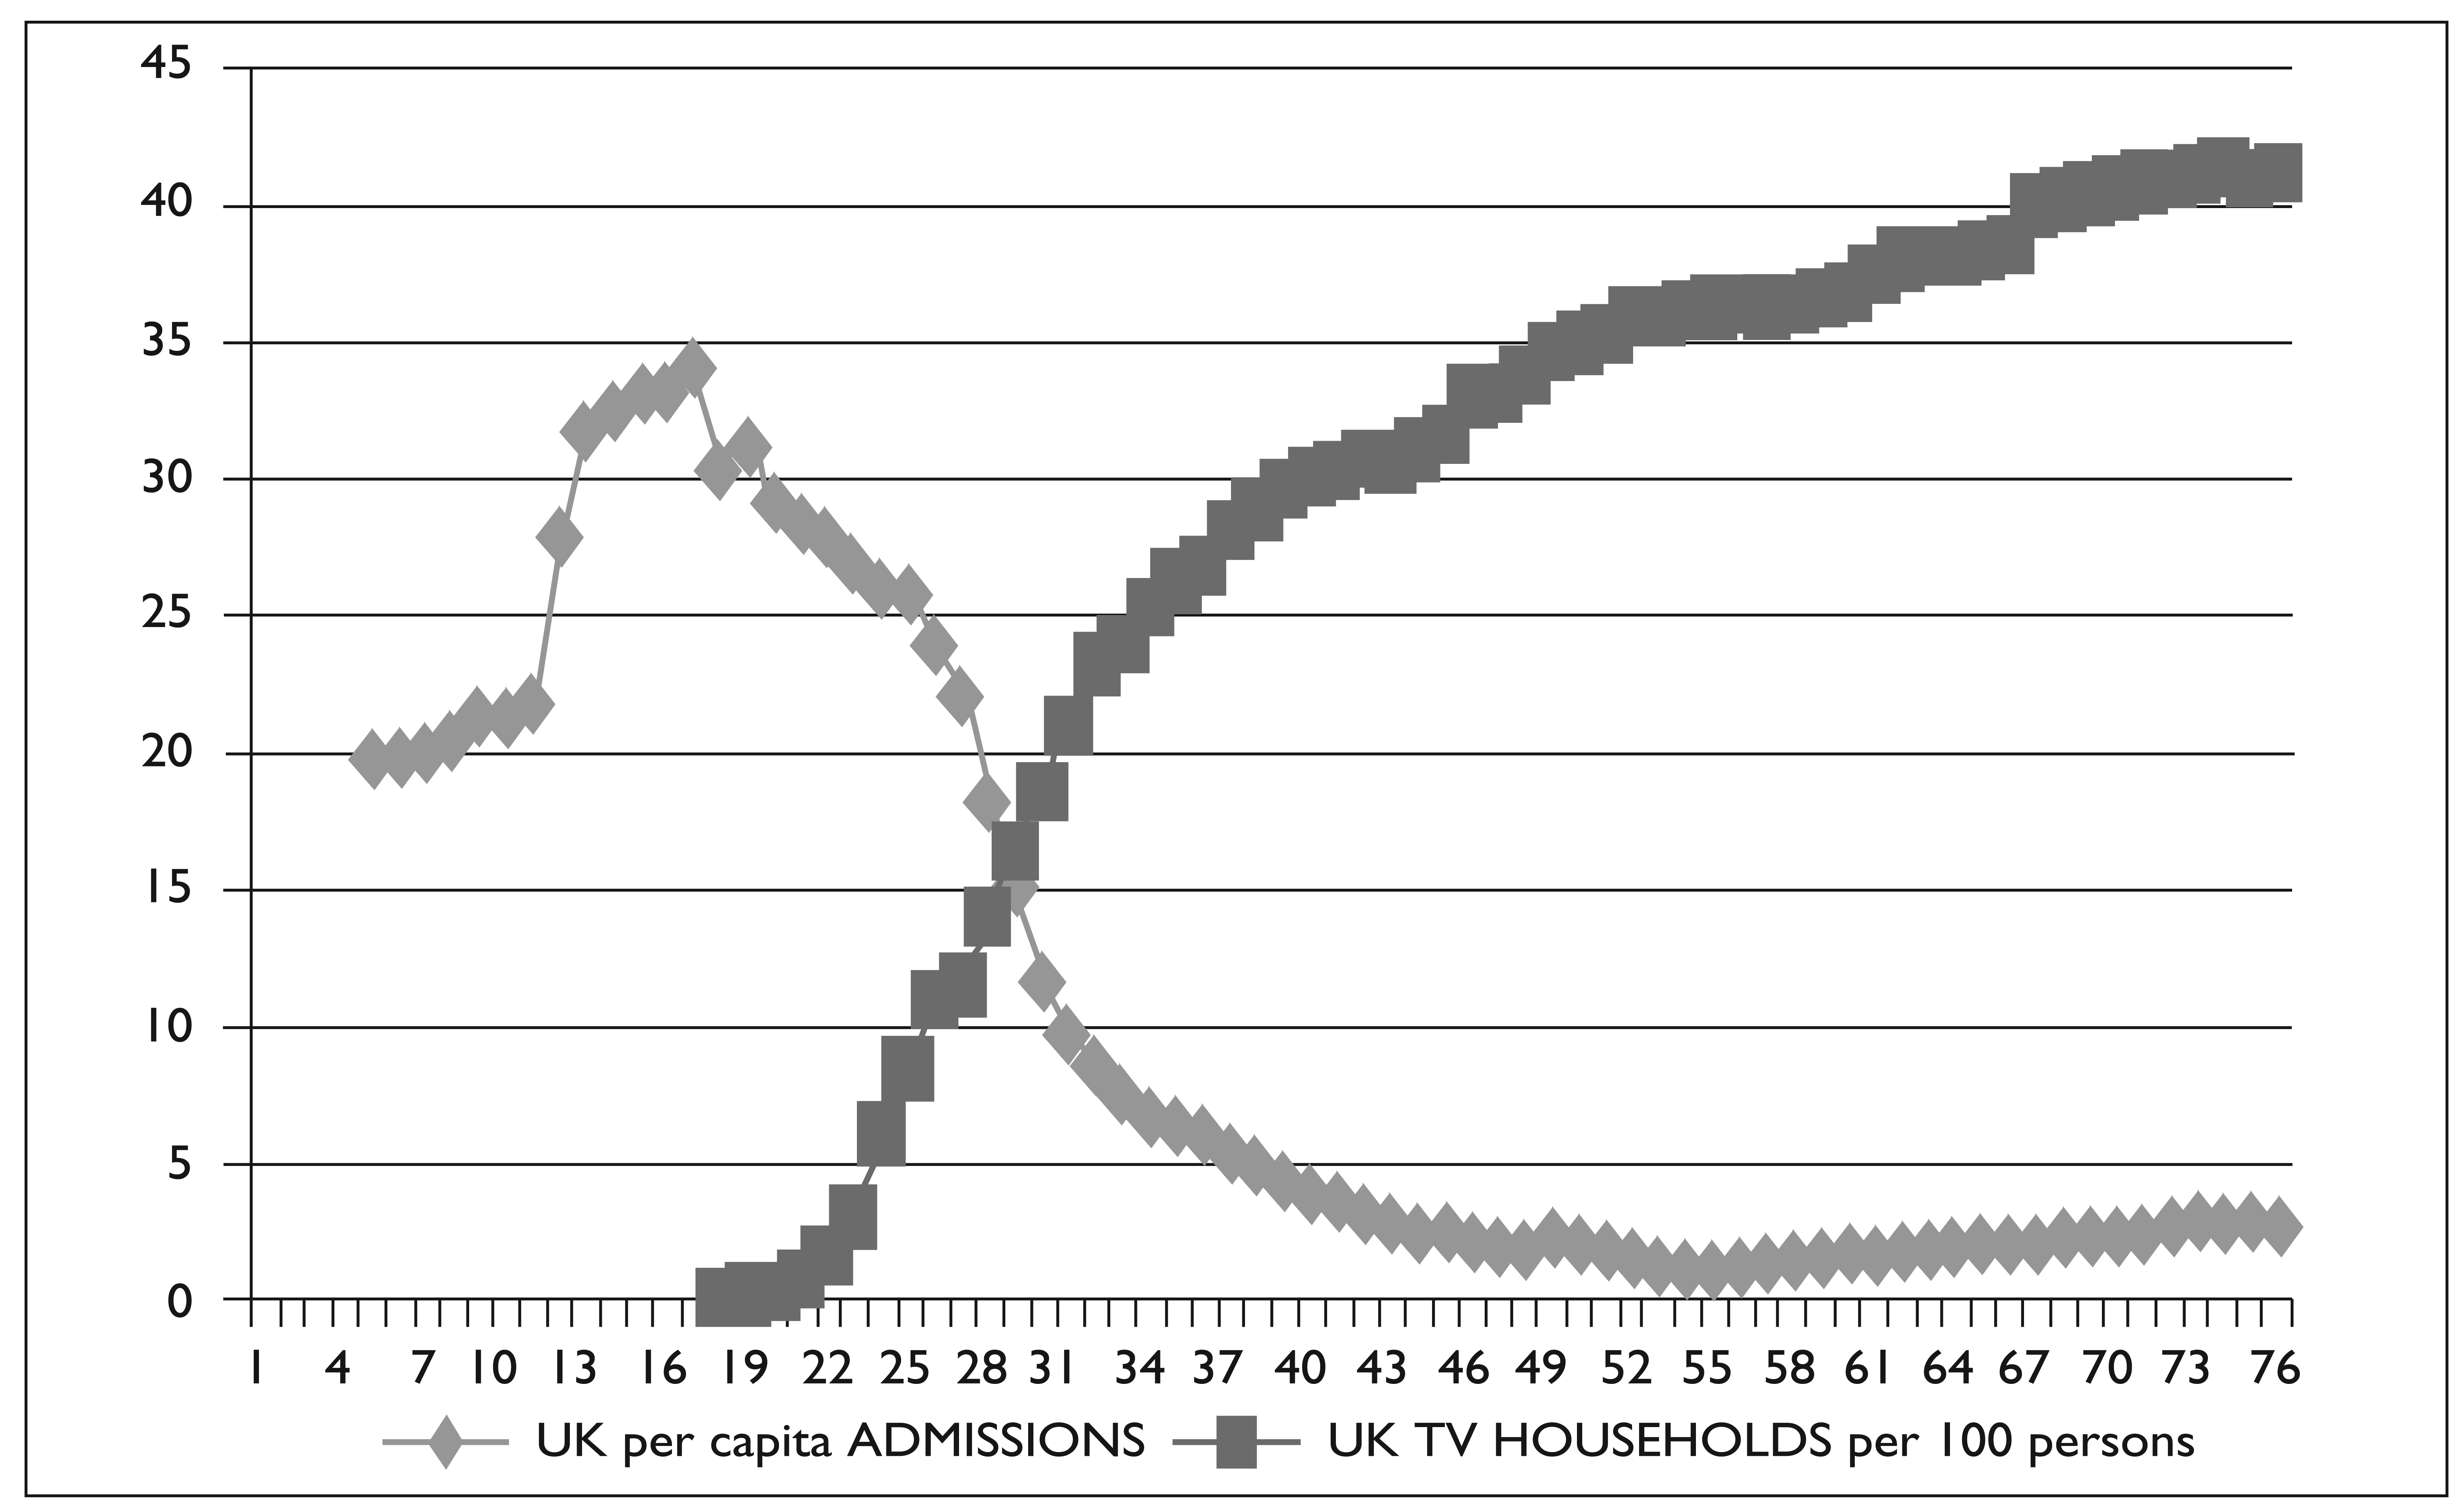
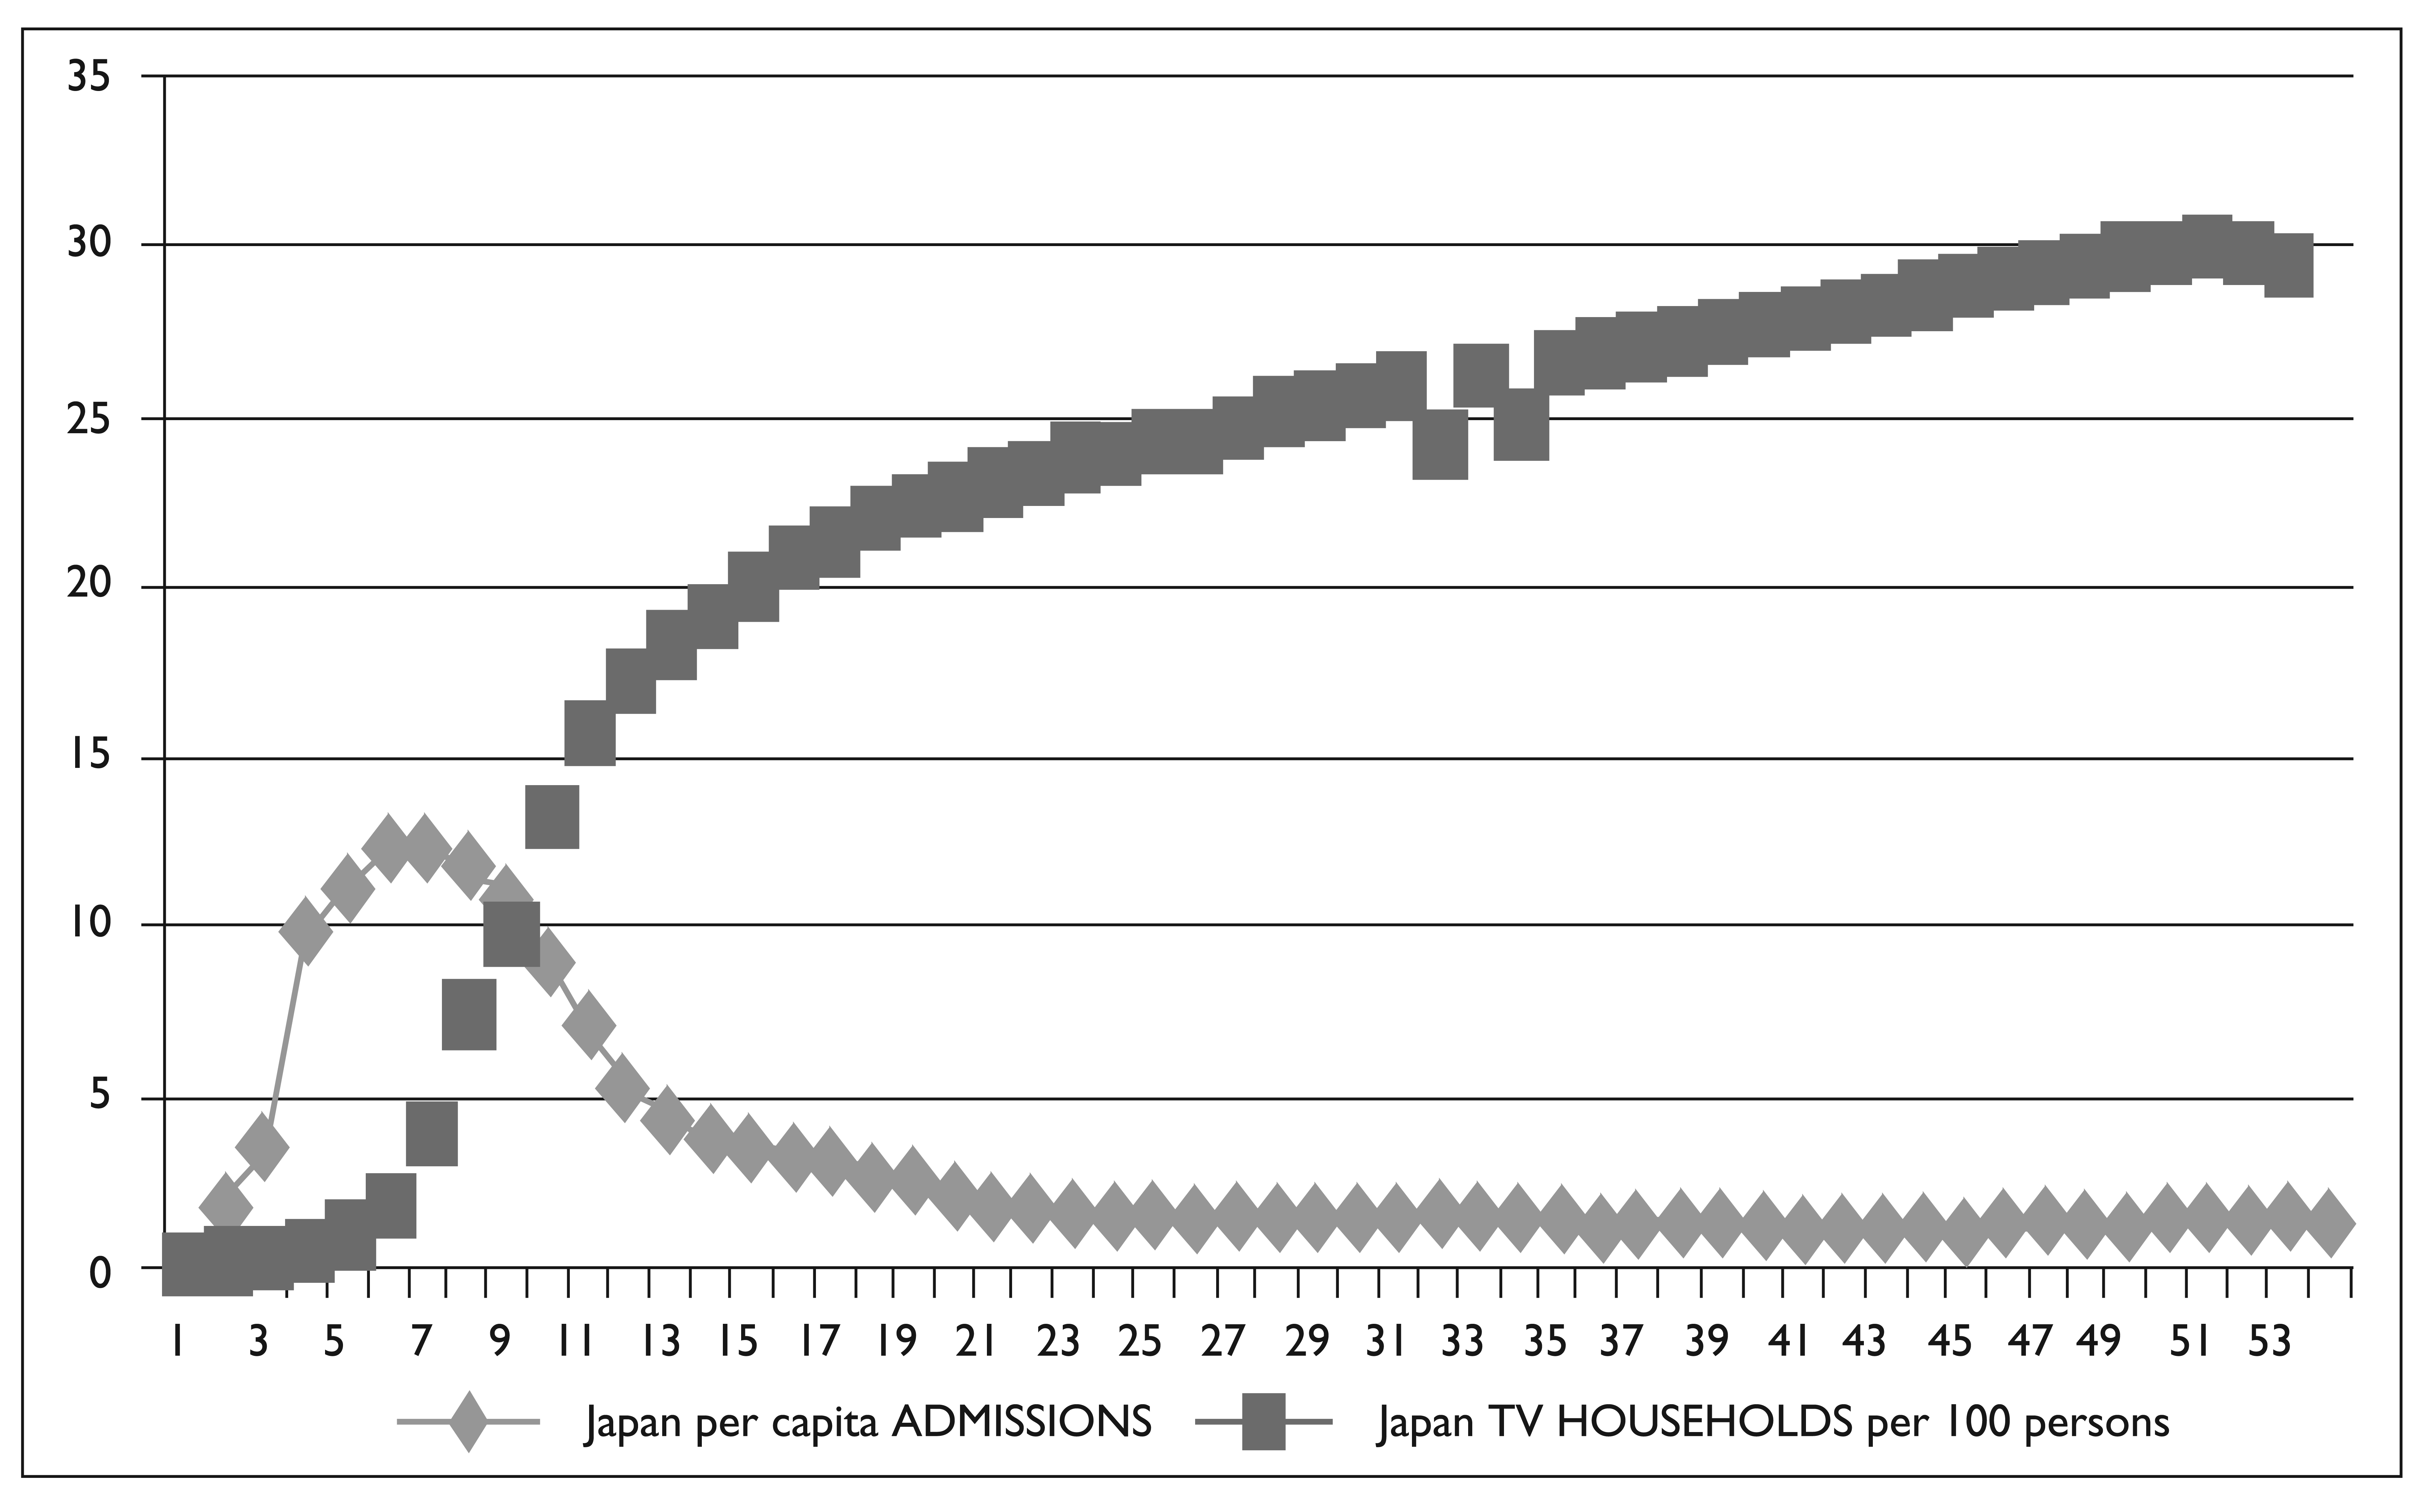
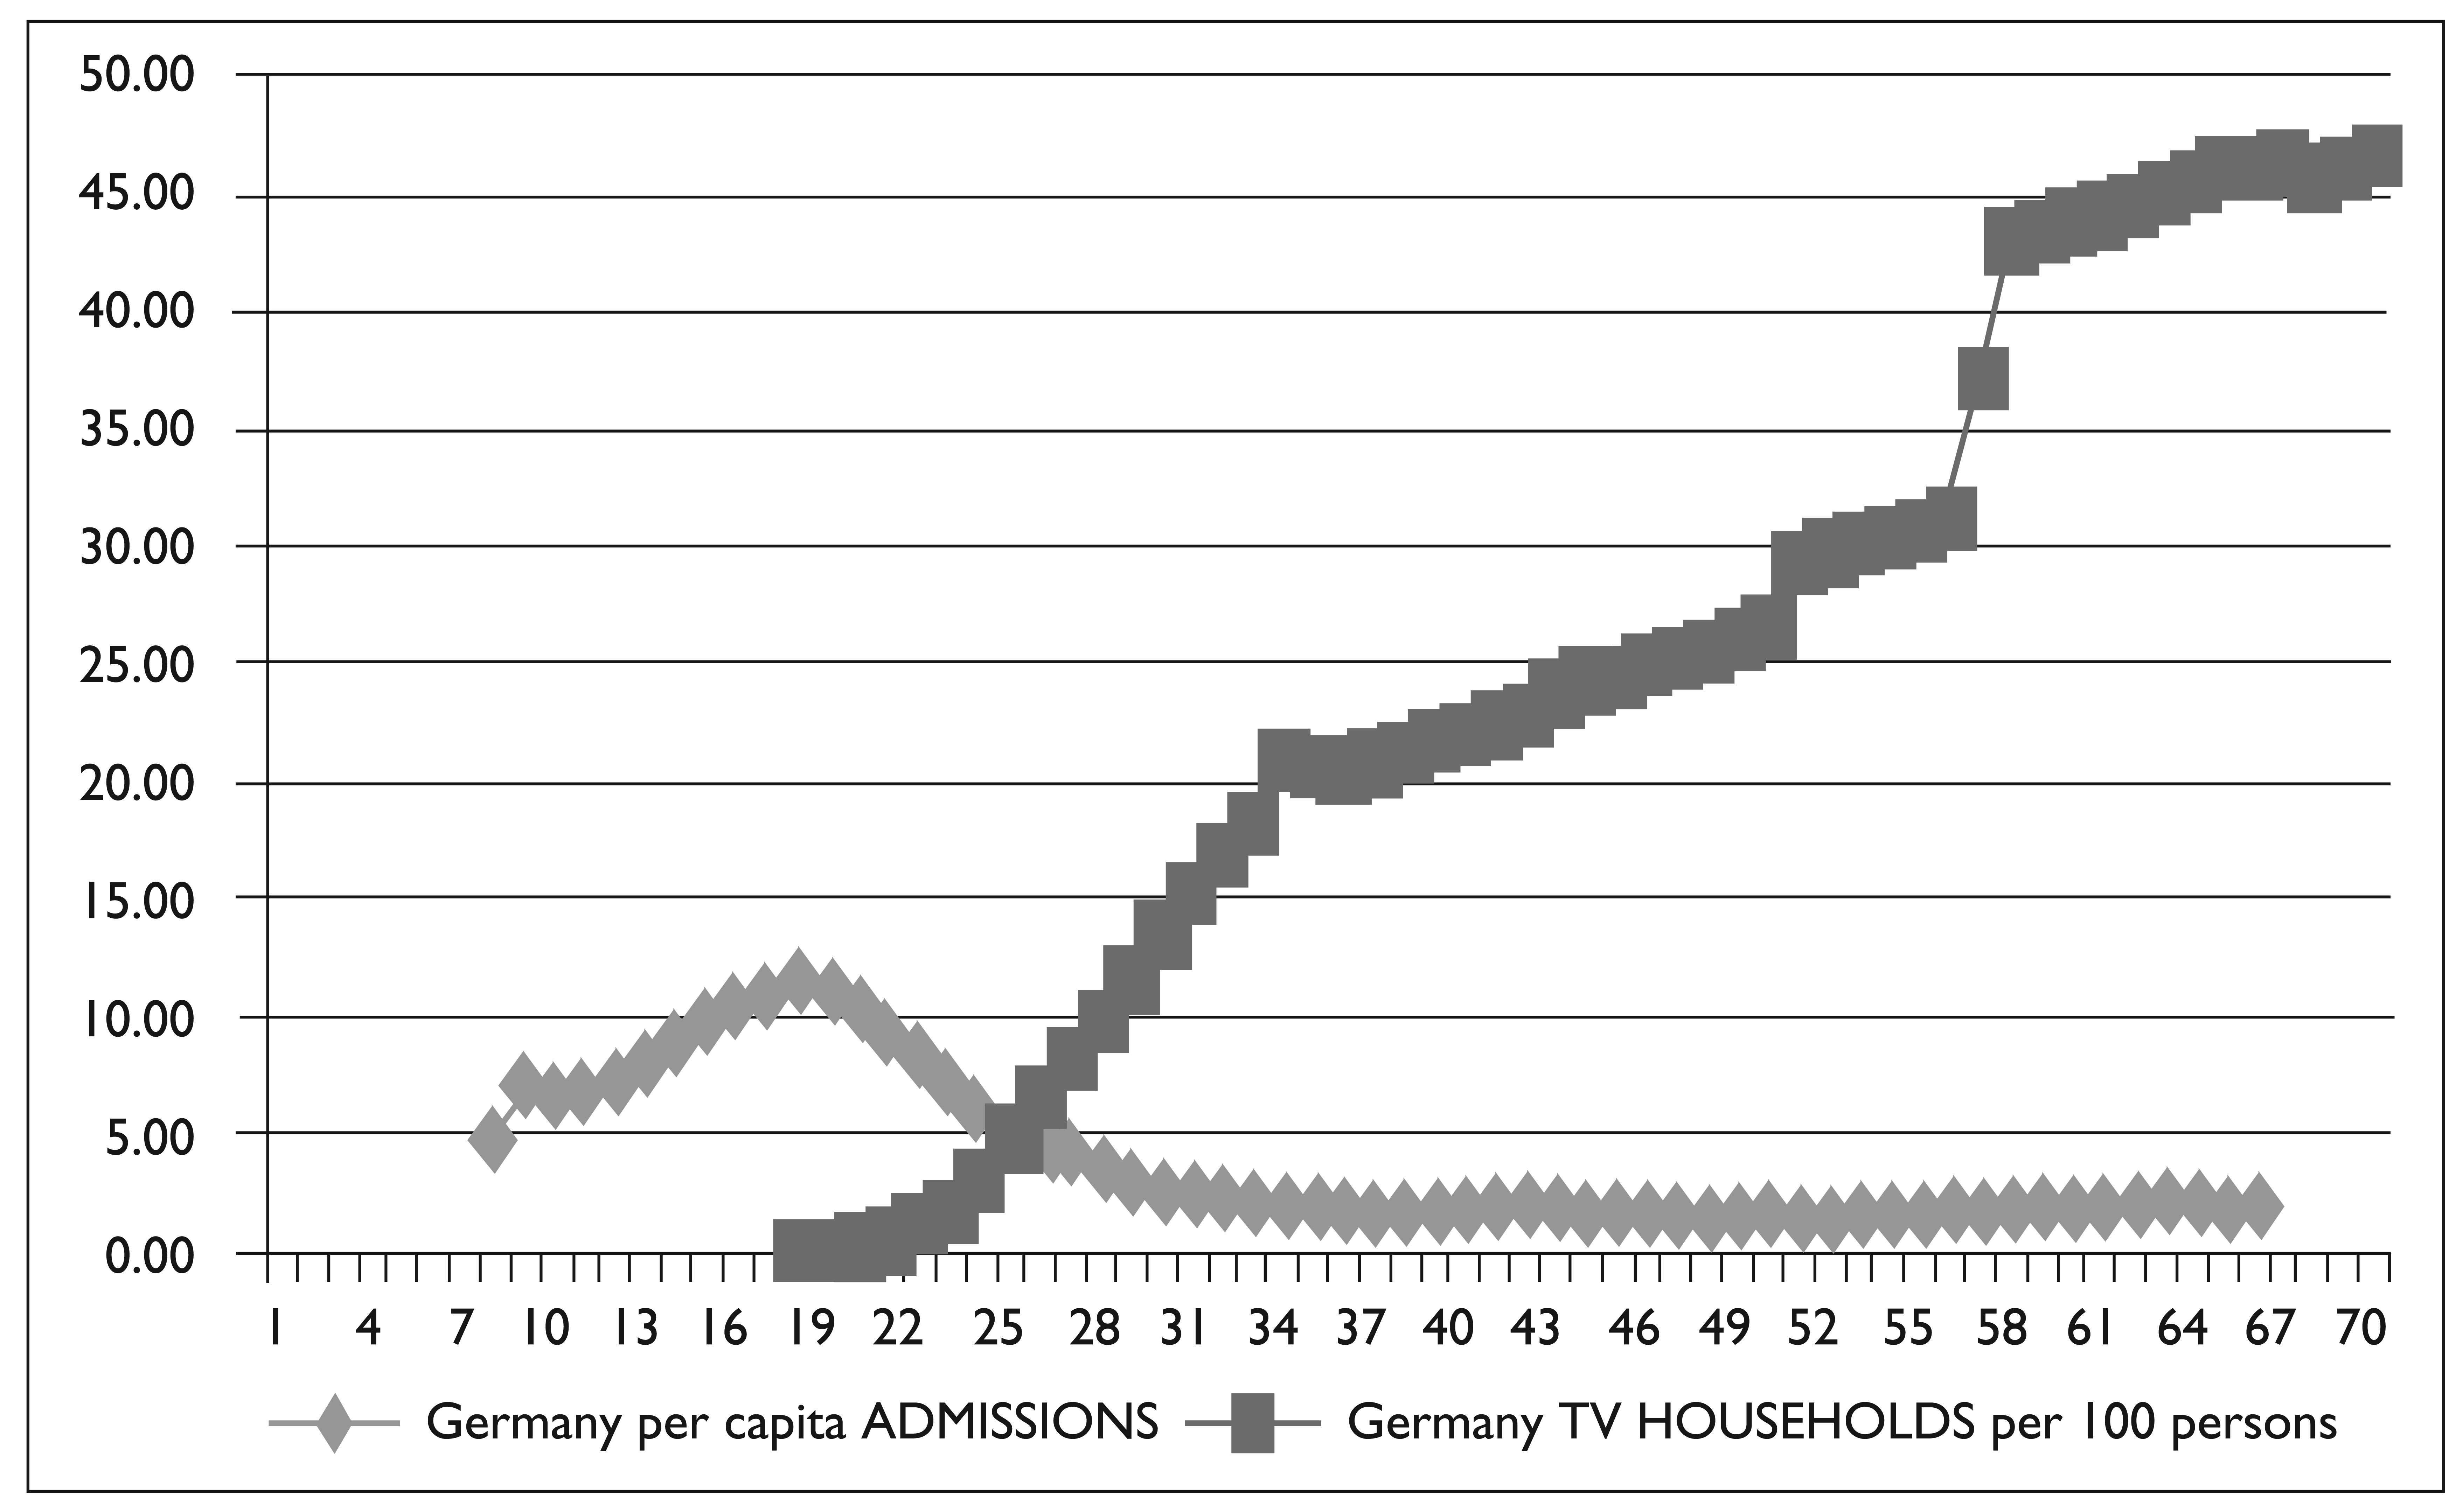
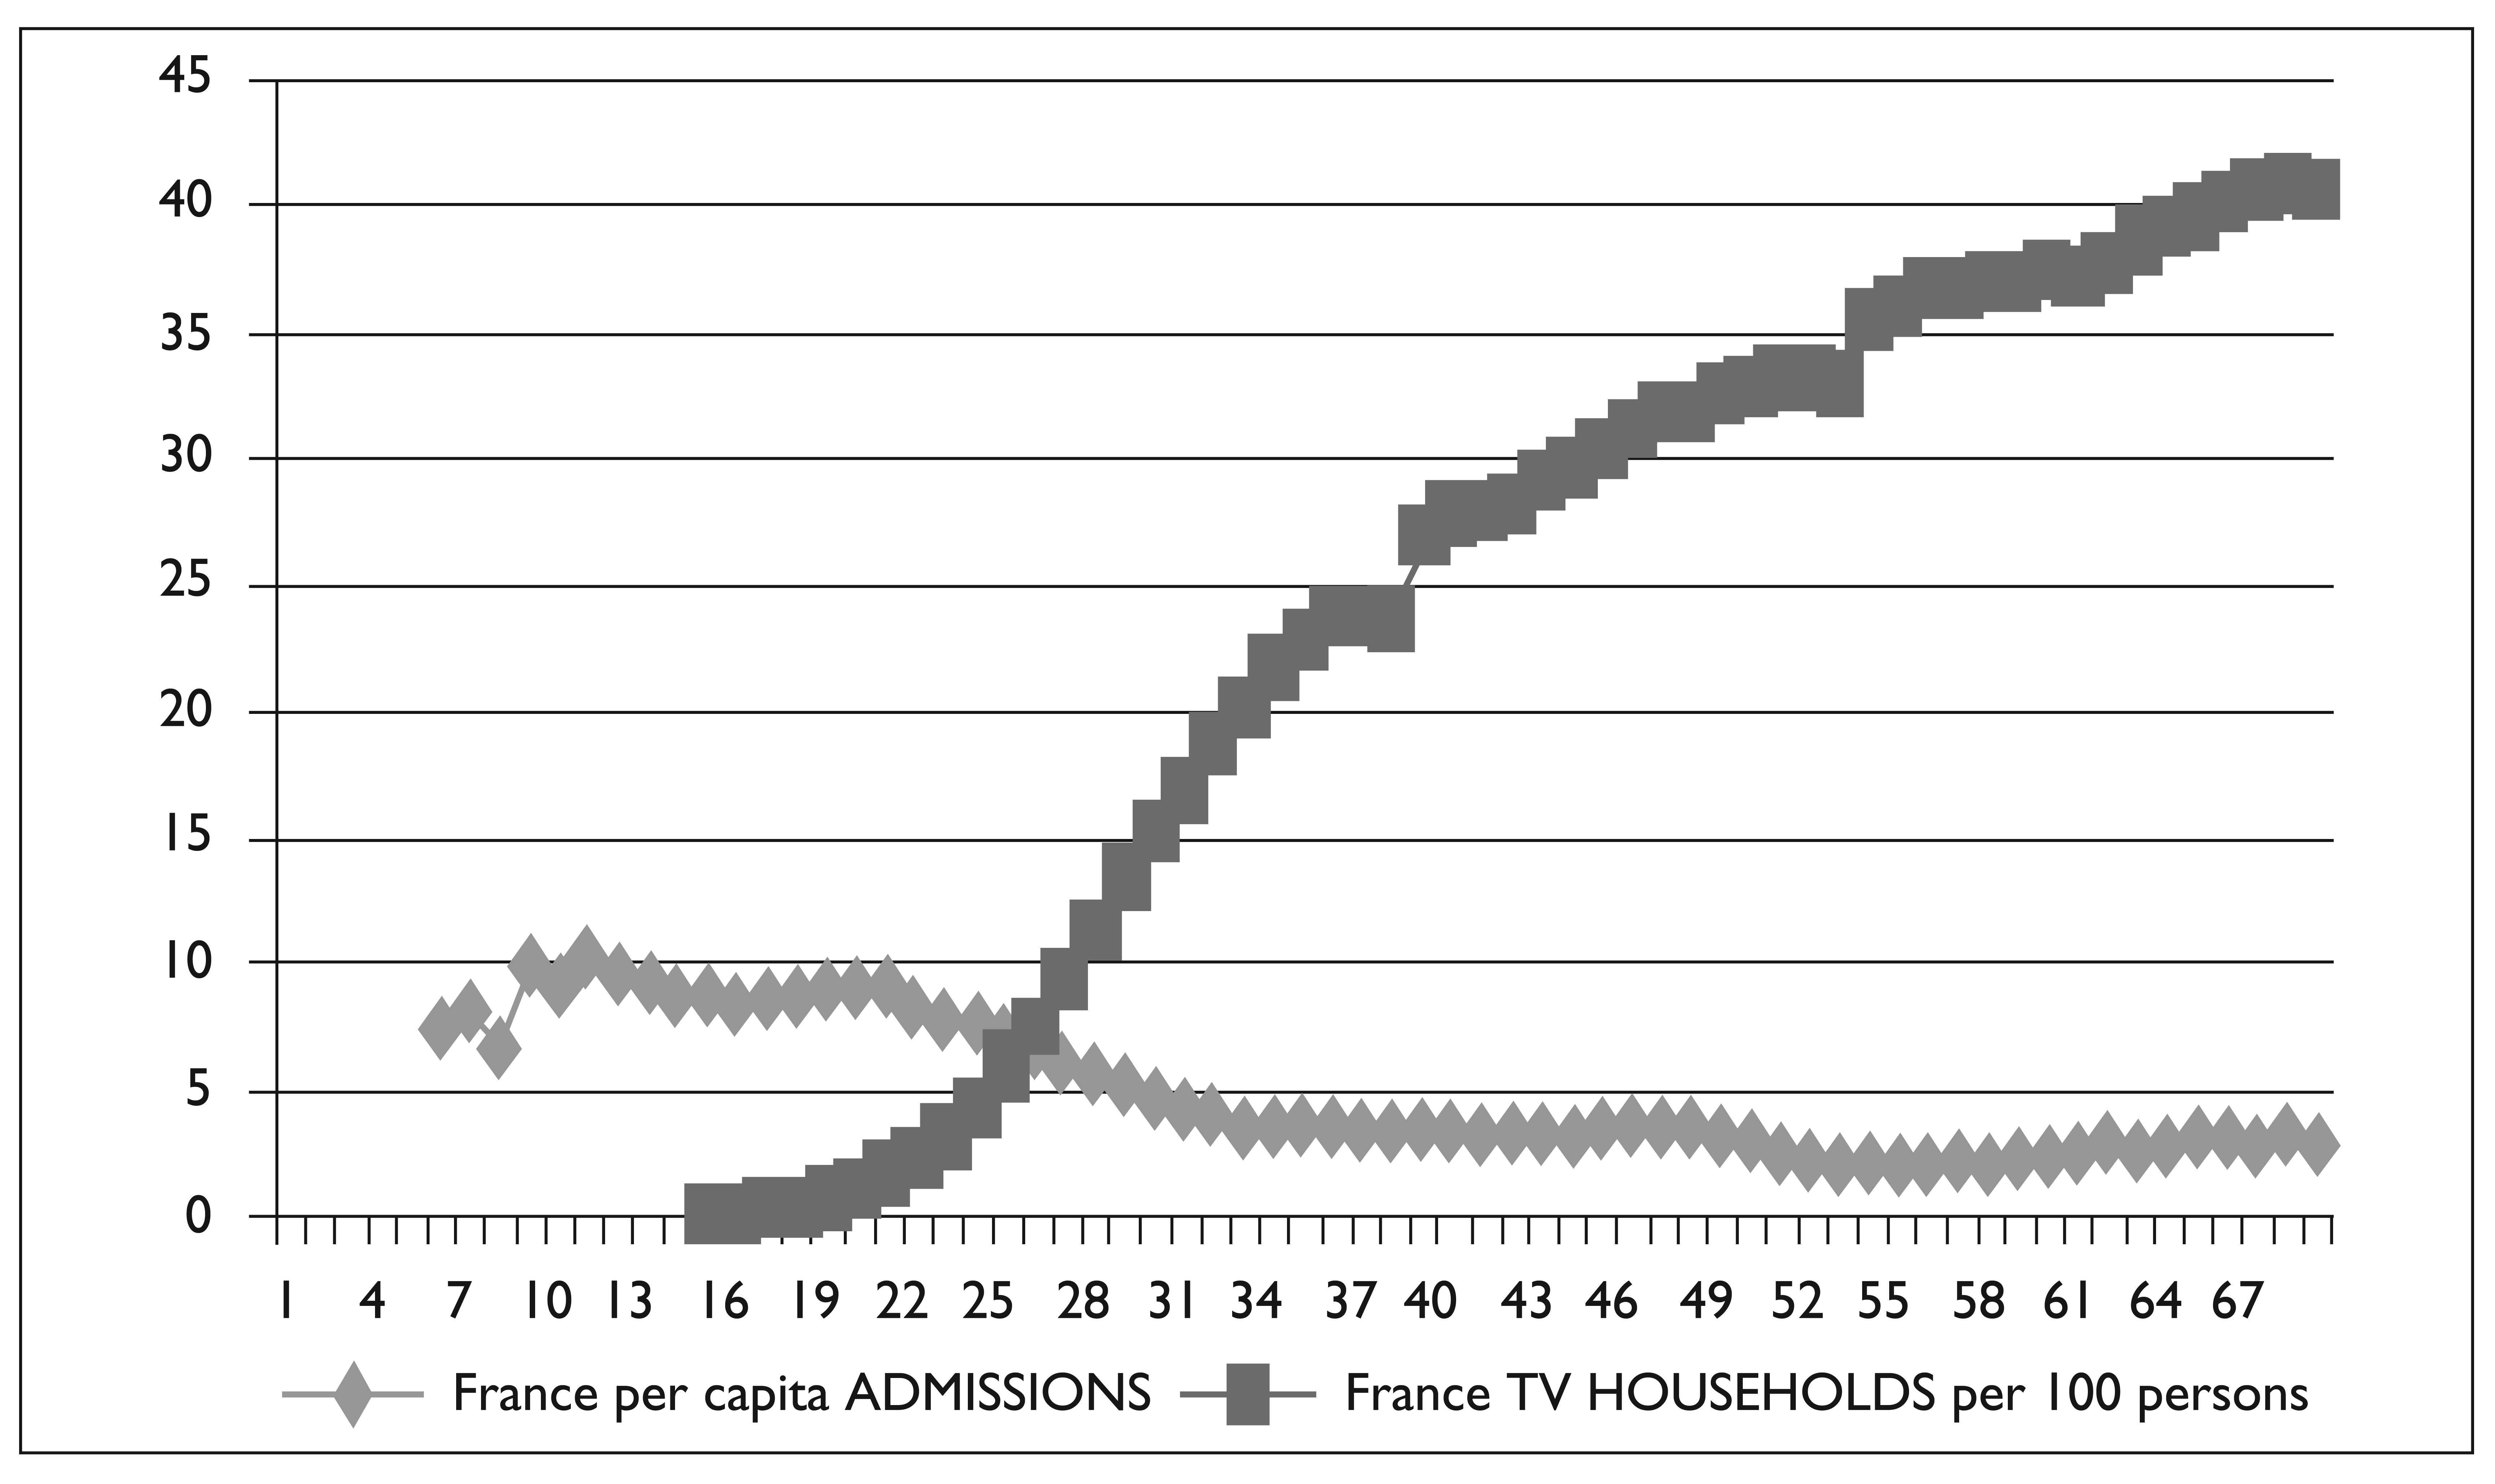
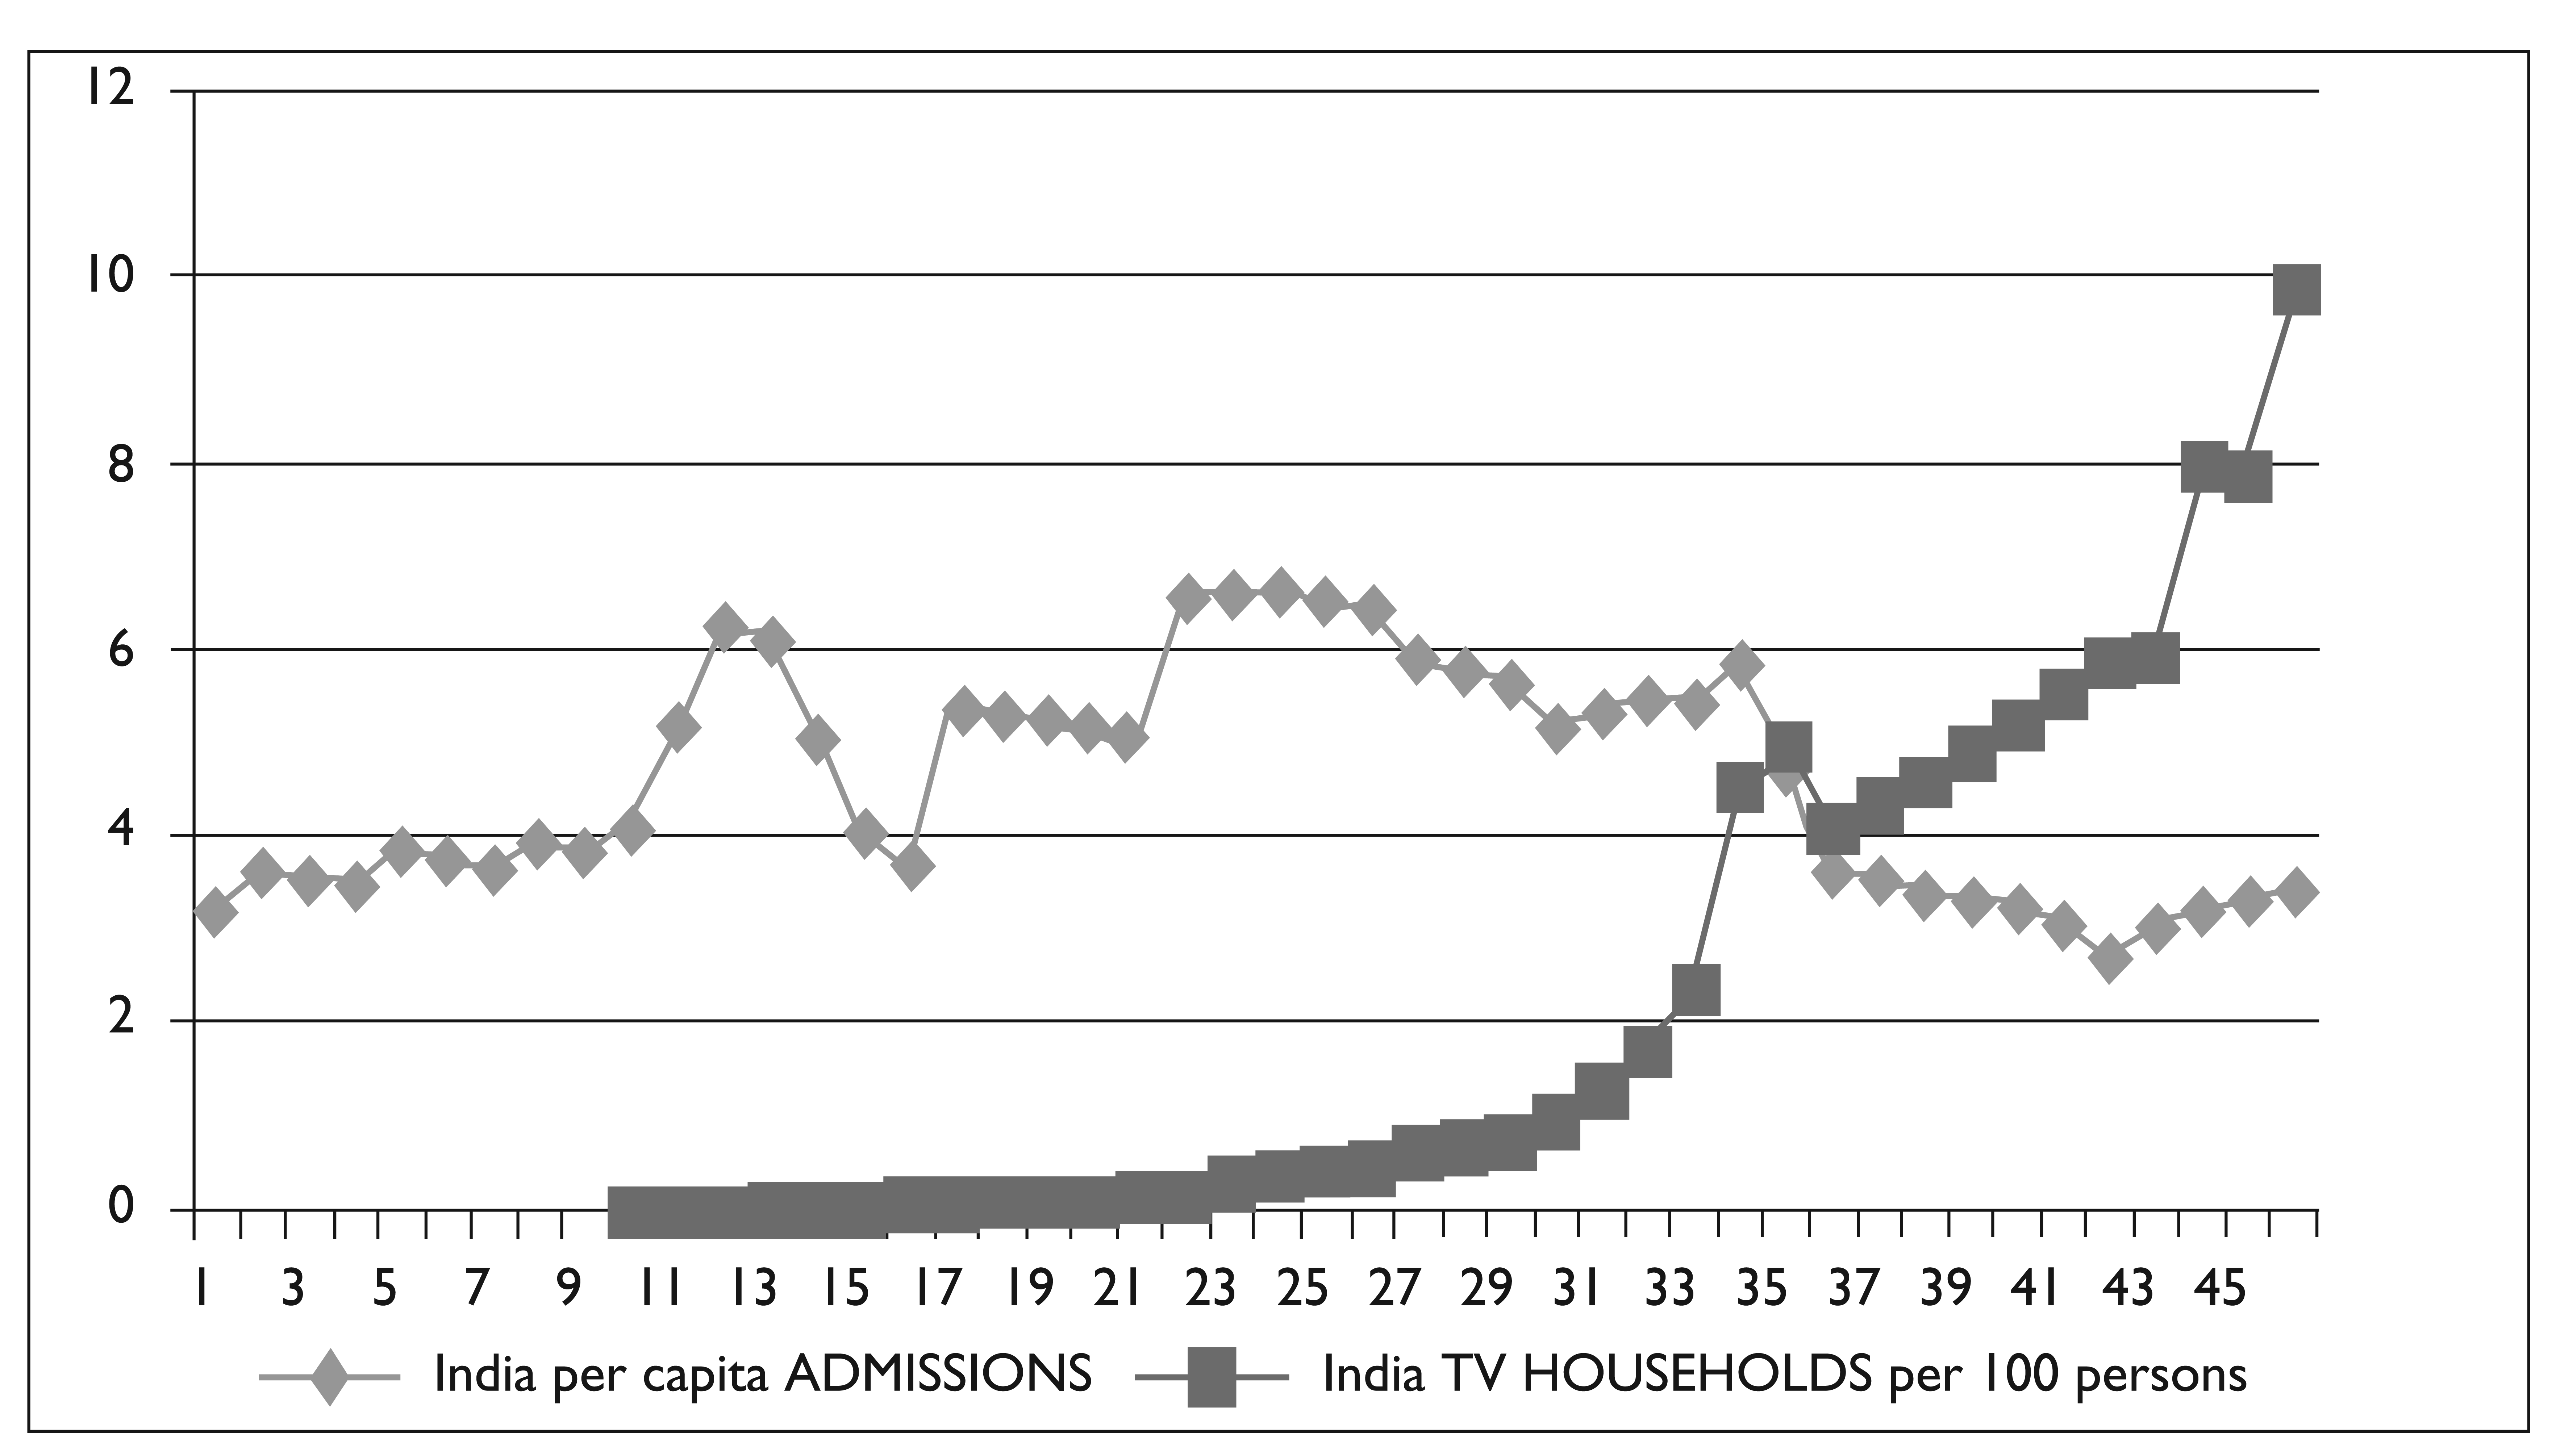
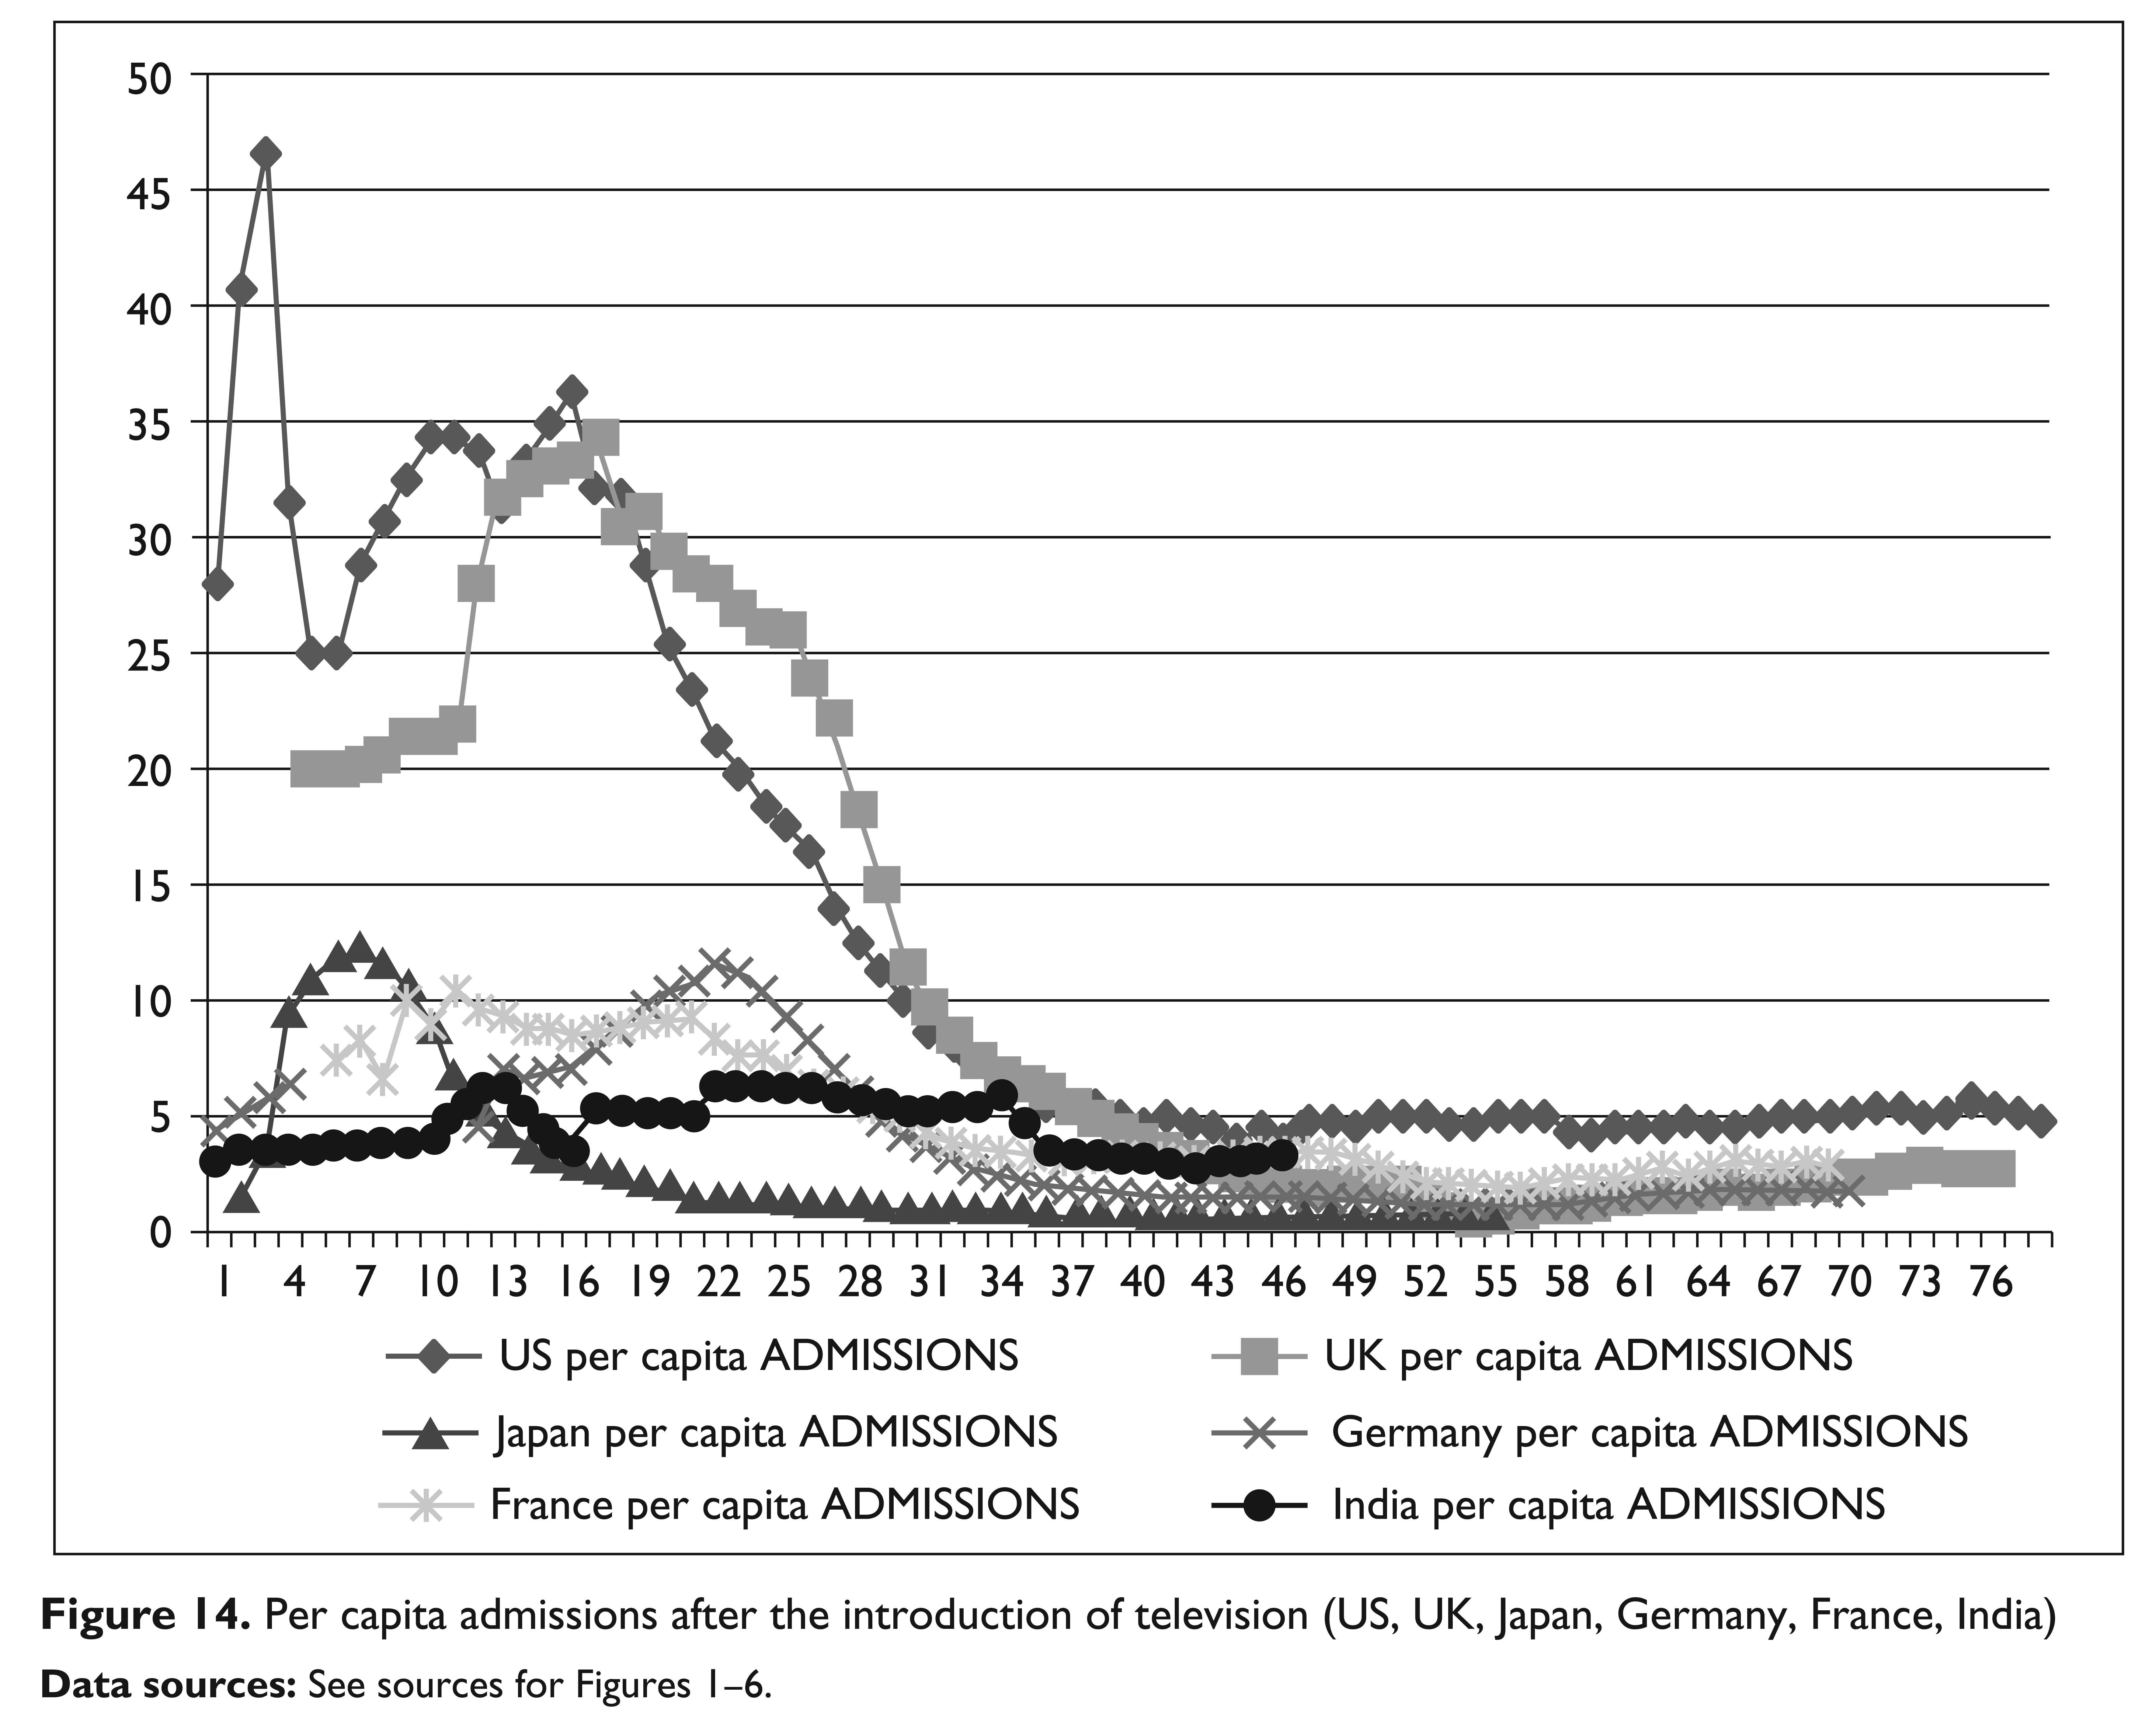
As before, time series from all six countries were graphed together to examine if they follow the same pattern in per capita admissions. While per capita admissions show a steep decline in the USA and the UK, they show a much more moderate decline in other countries such as France, Germany and Japan. Admissions per capita were never high to begin with in India; in fact they were the lowest compared to all other countries, at under five film admissions per capita when television arrived in India. After a brief rise they have declined to a little over three film admissions per capita. In comparison, American and British admissions fell steeply from their all time peaks of over 45 and 35 admissions per capita to their present value of fewer than five admissions per capita (see Figure 14).
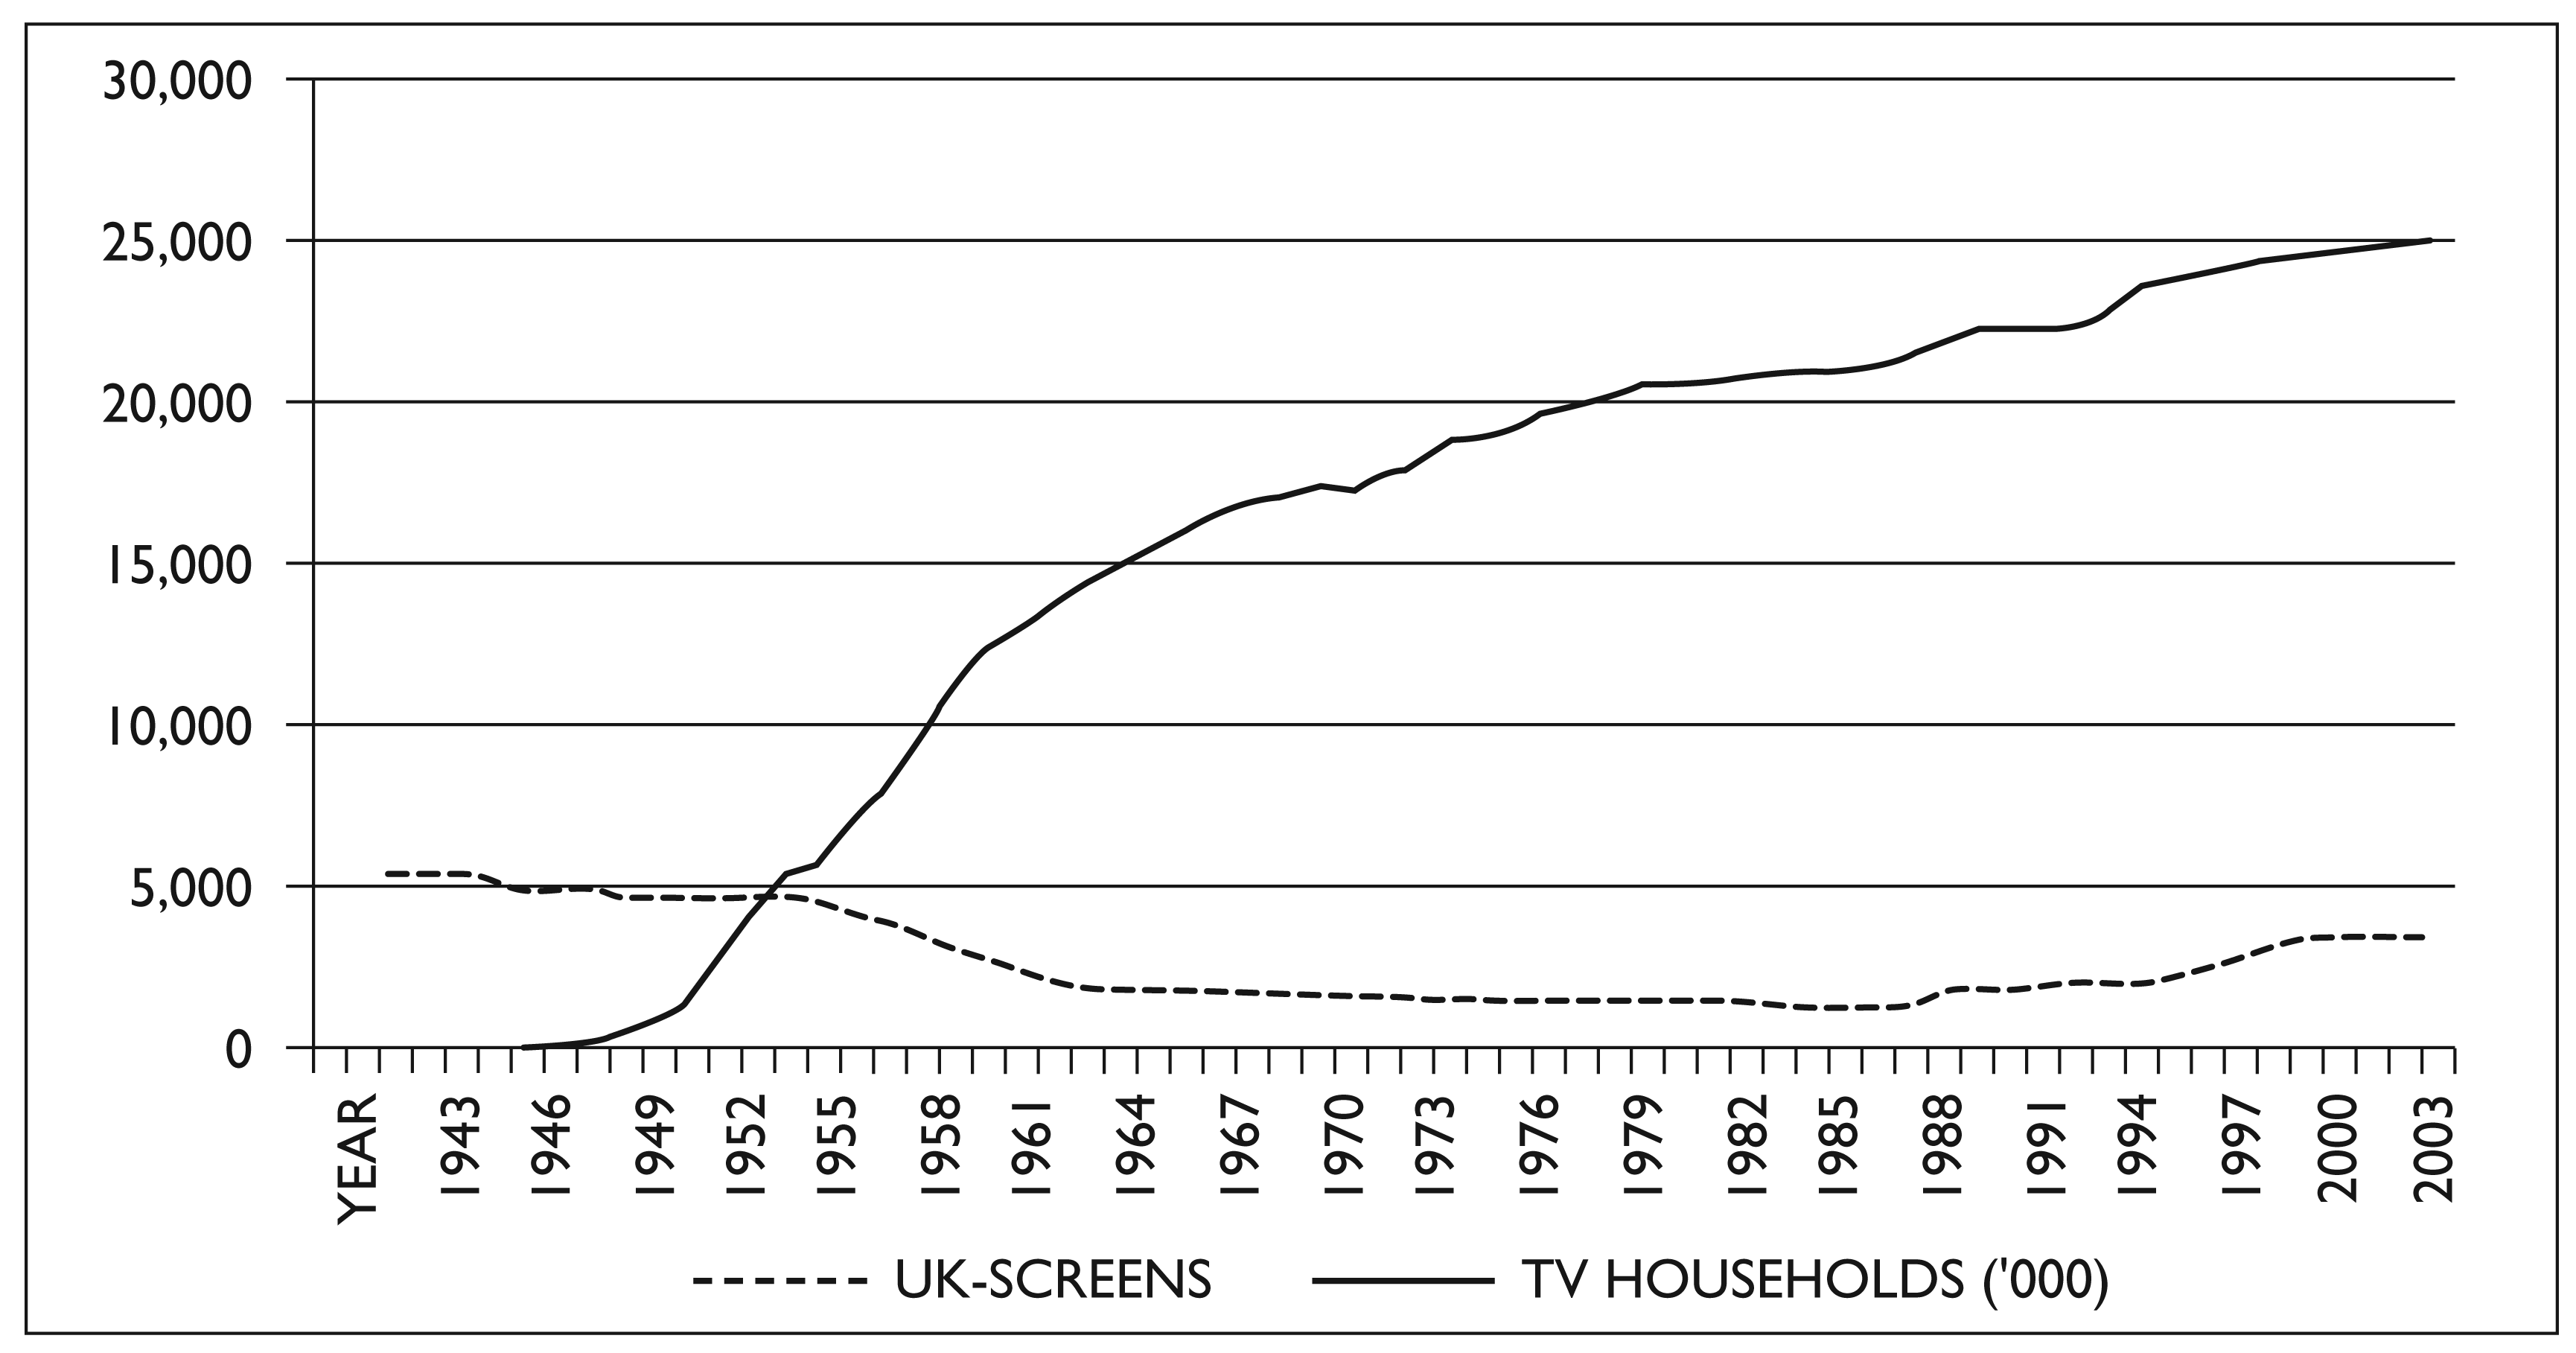
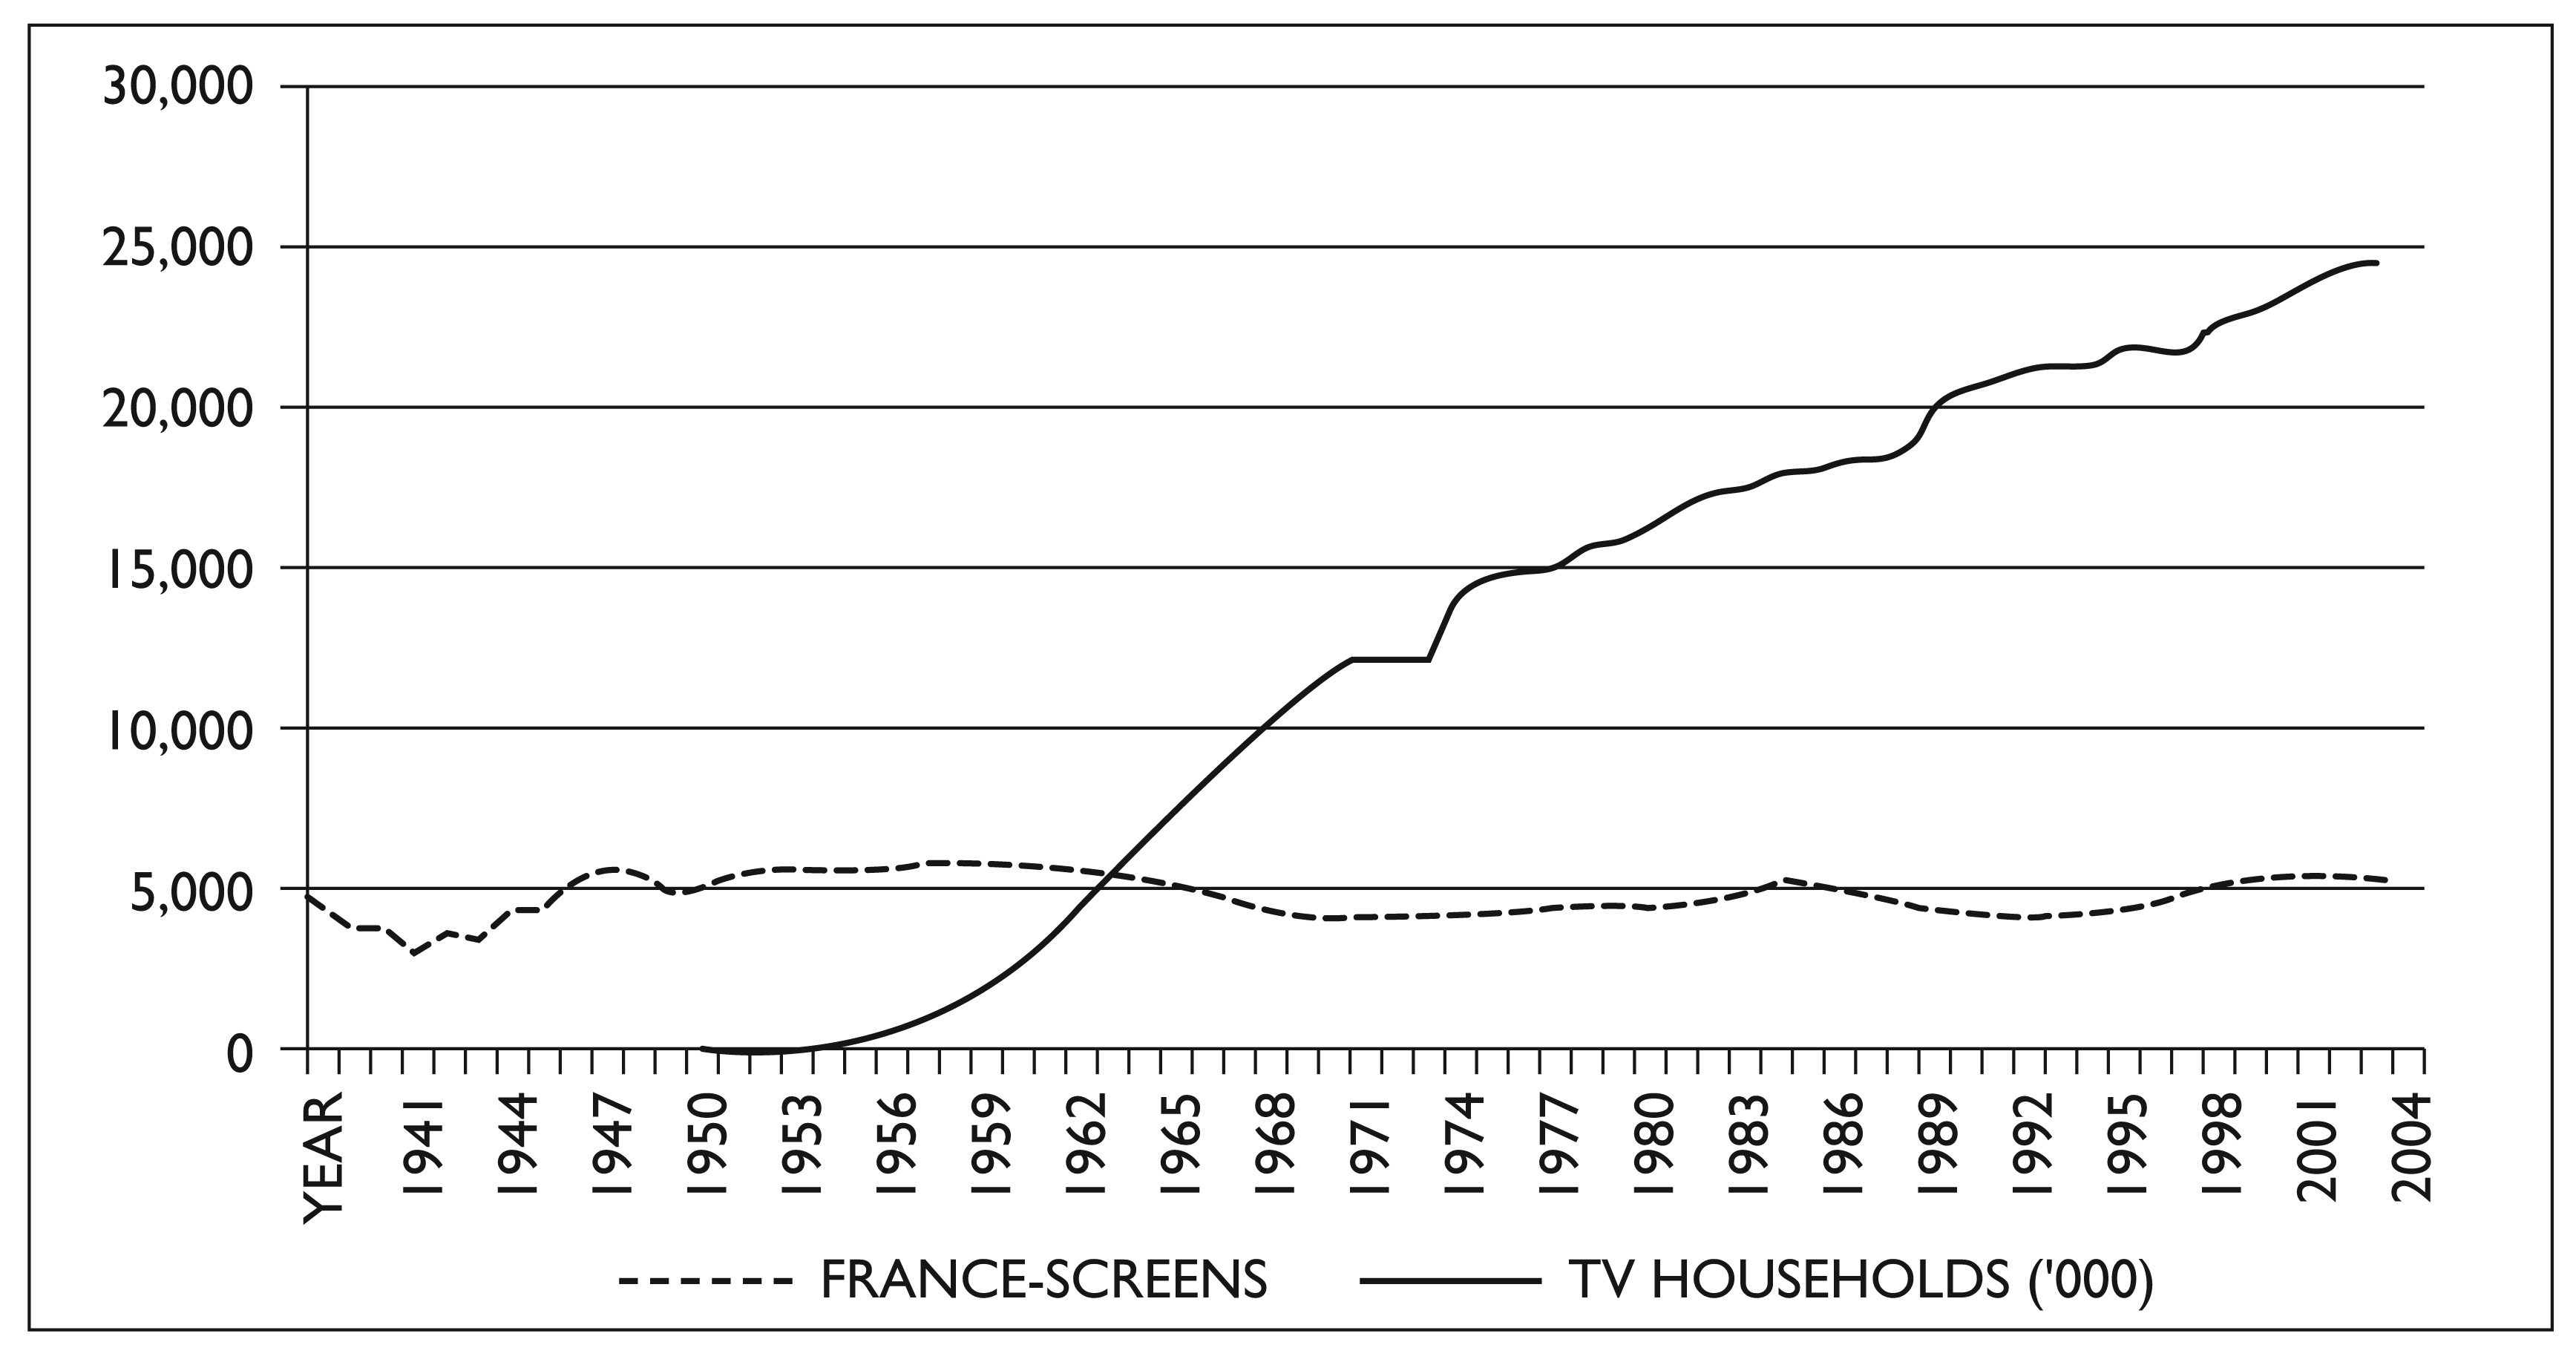
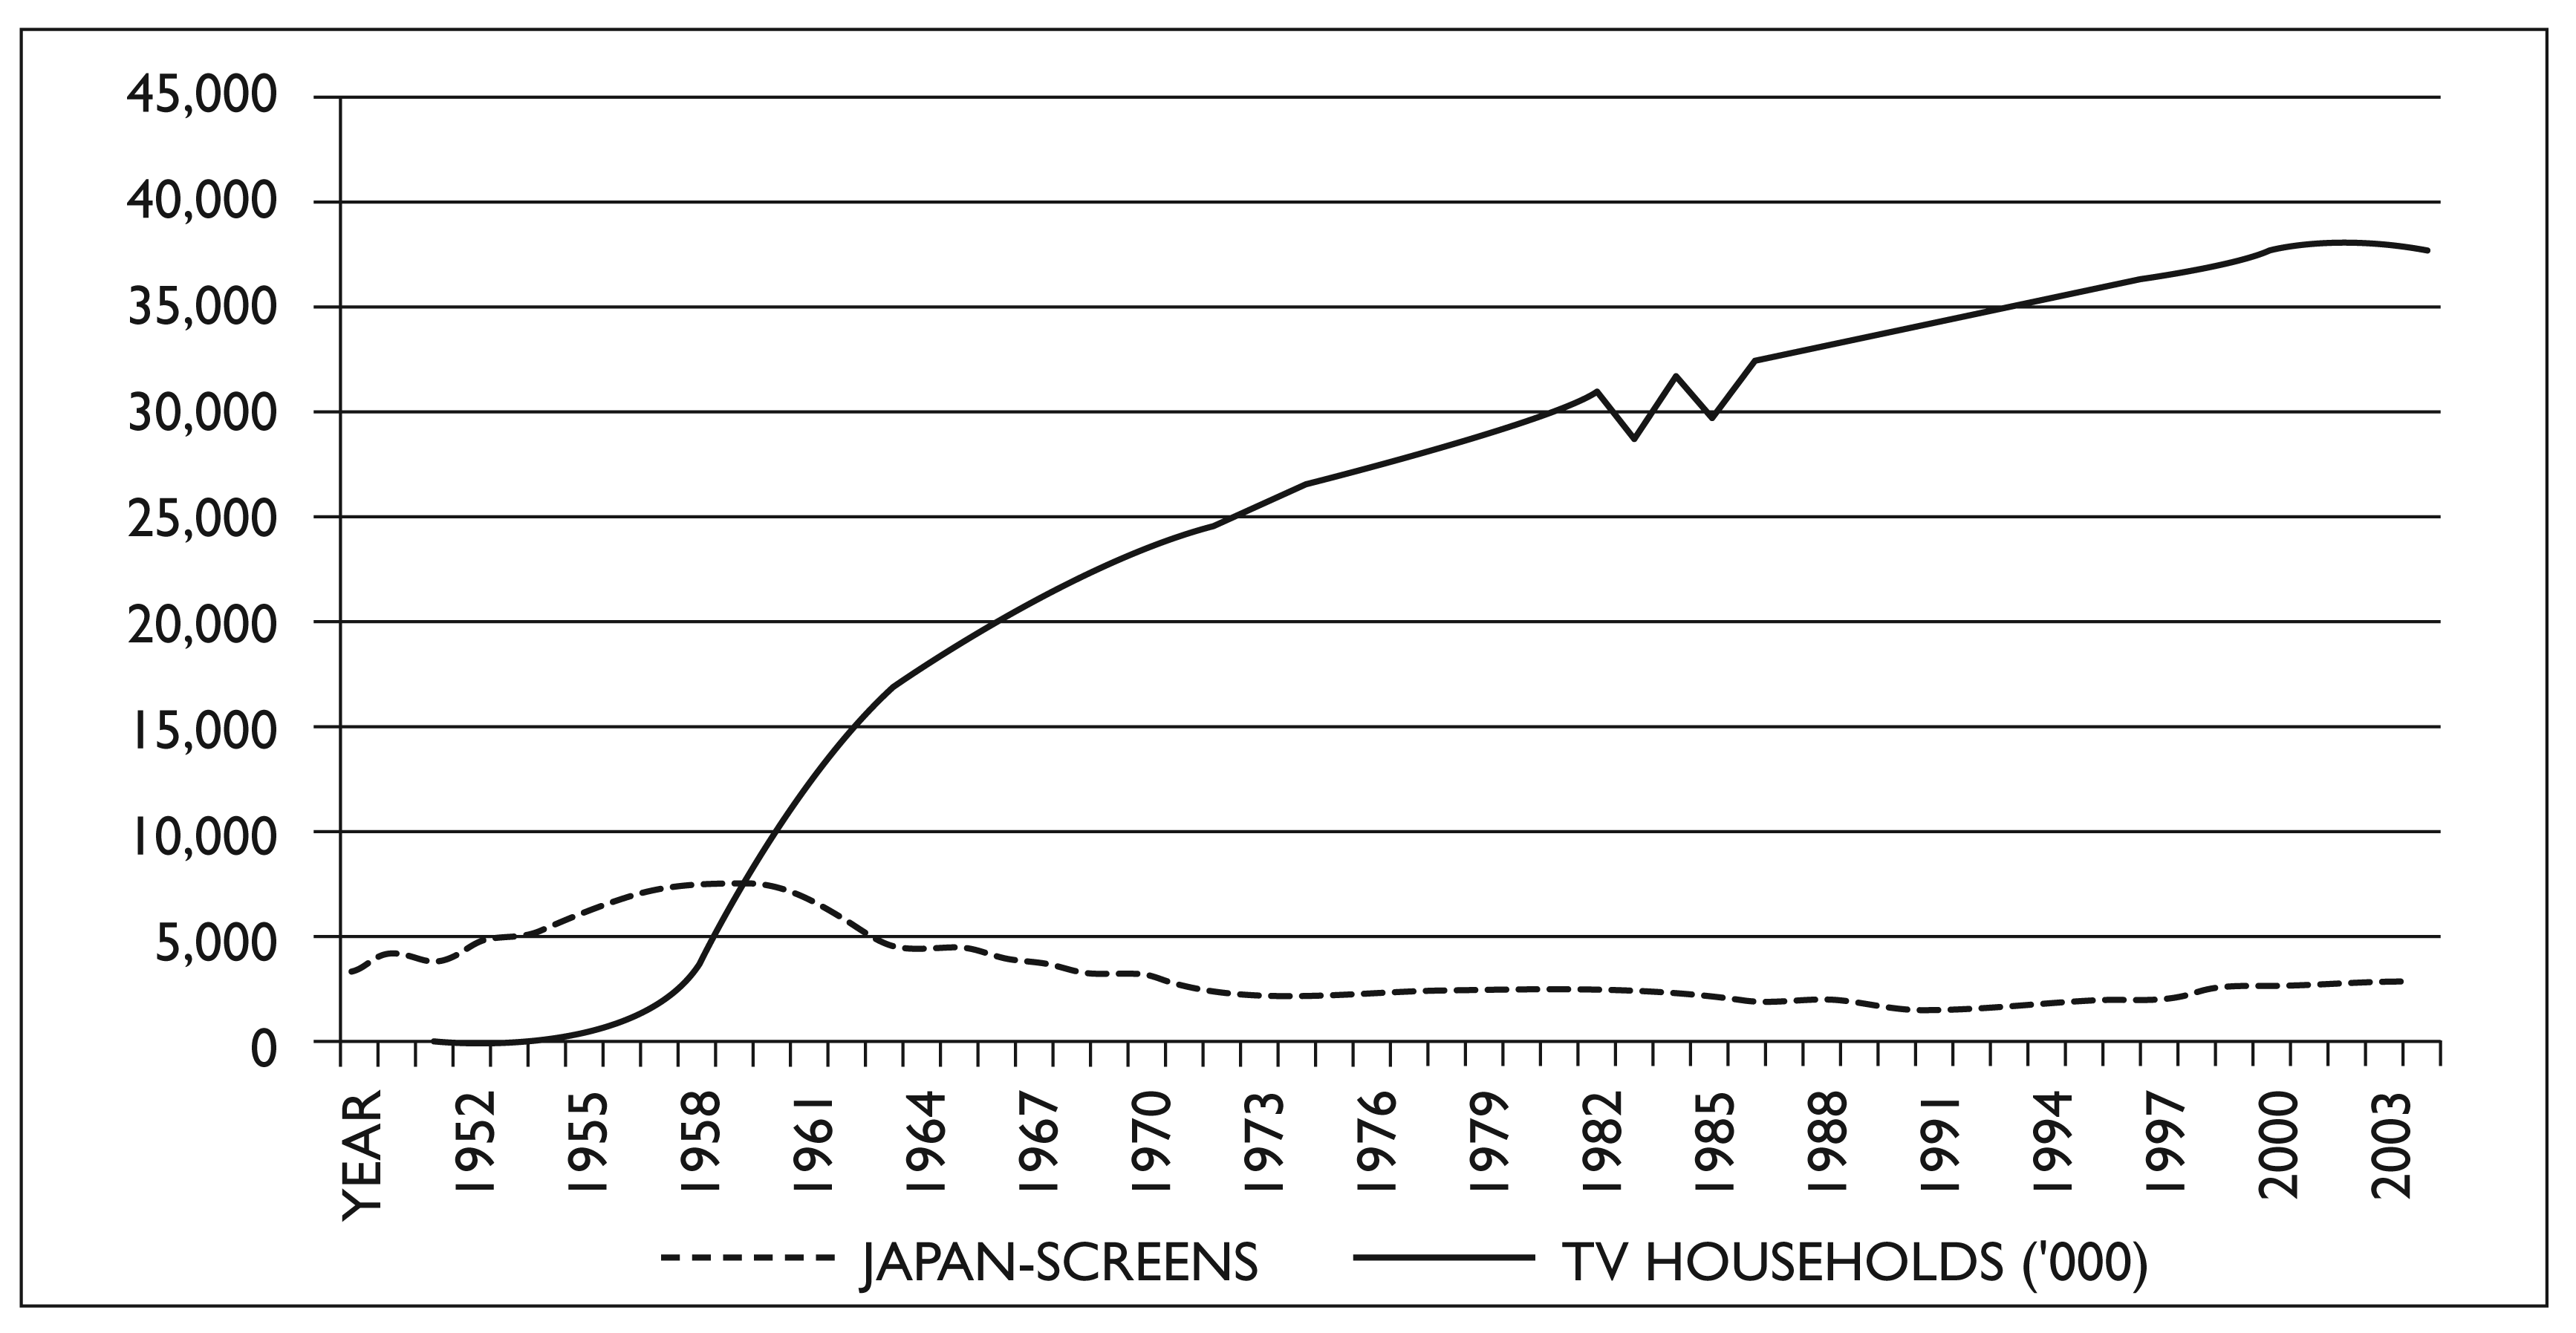
Films Produced and Television Households
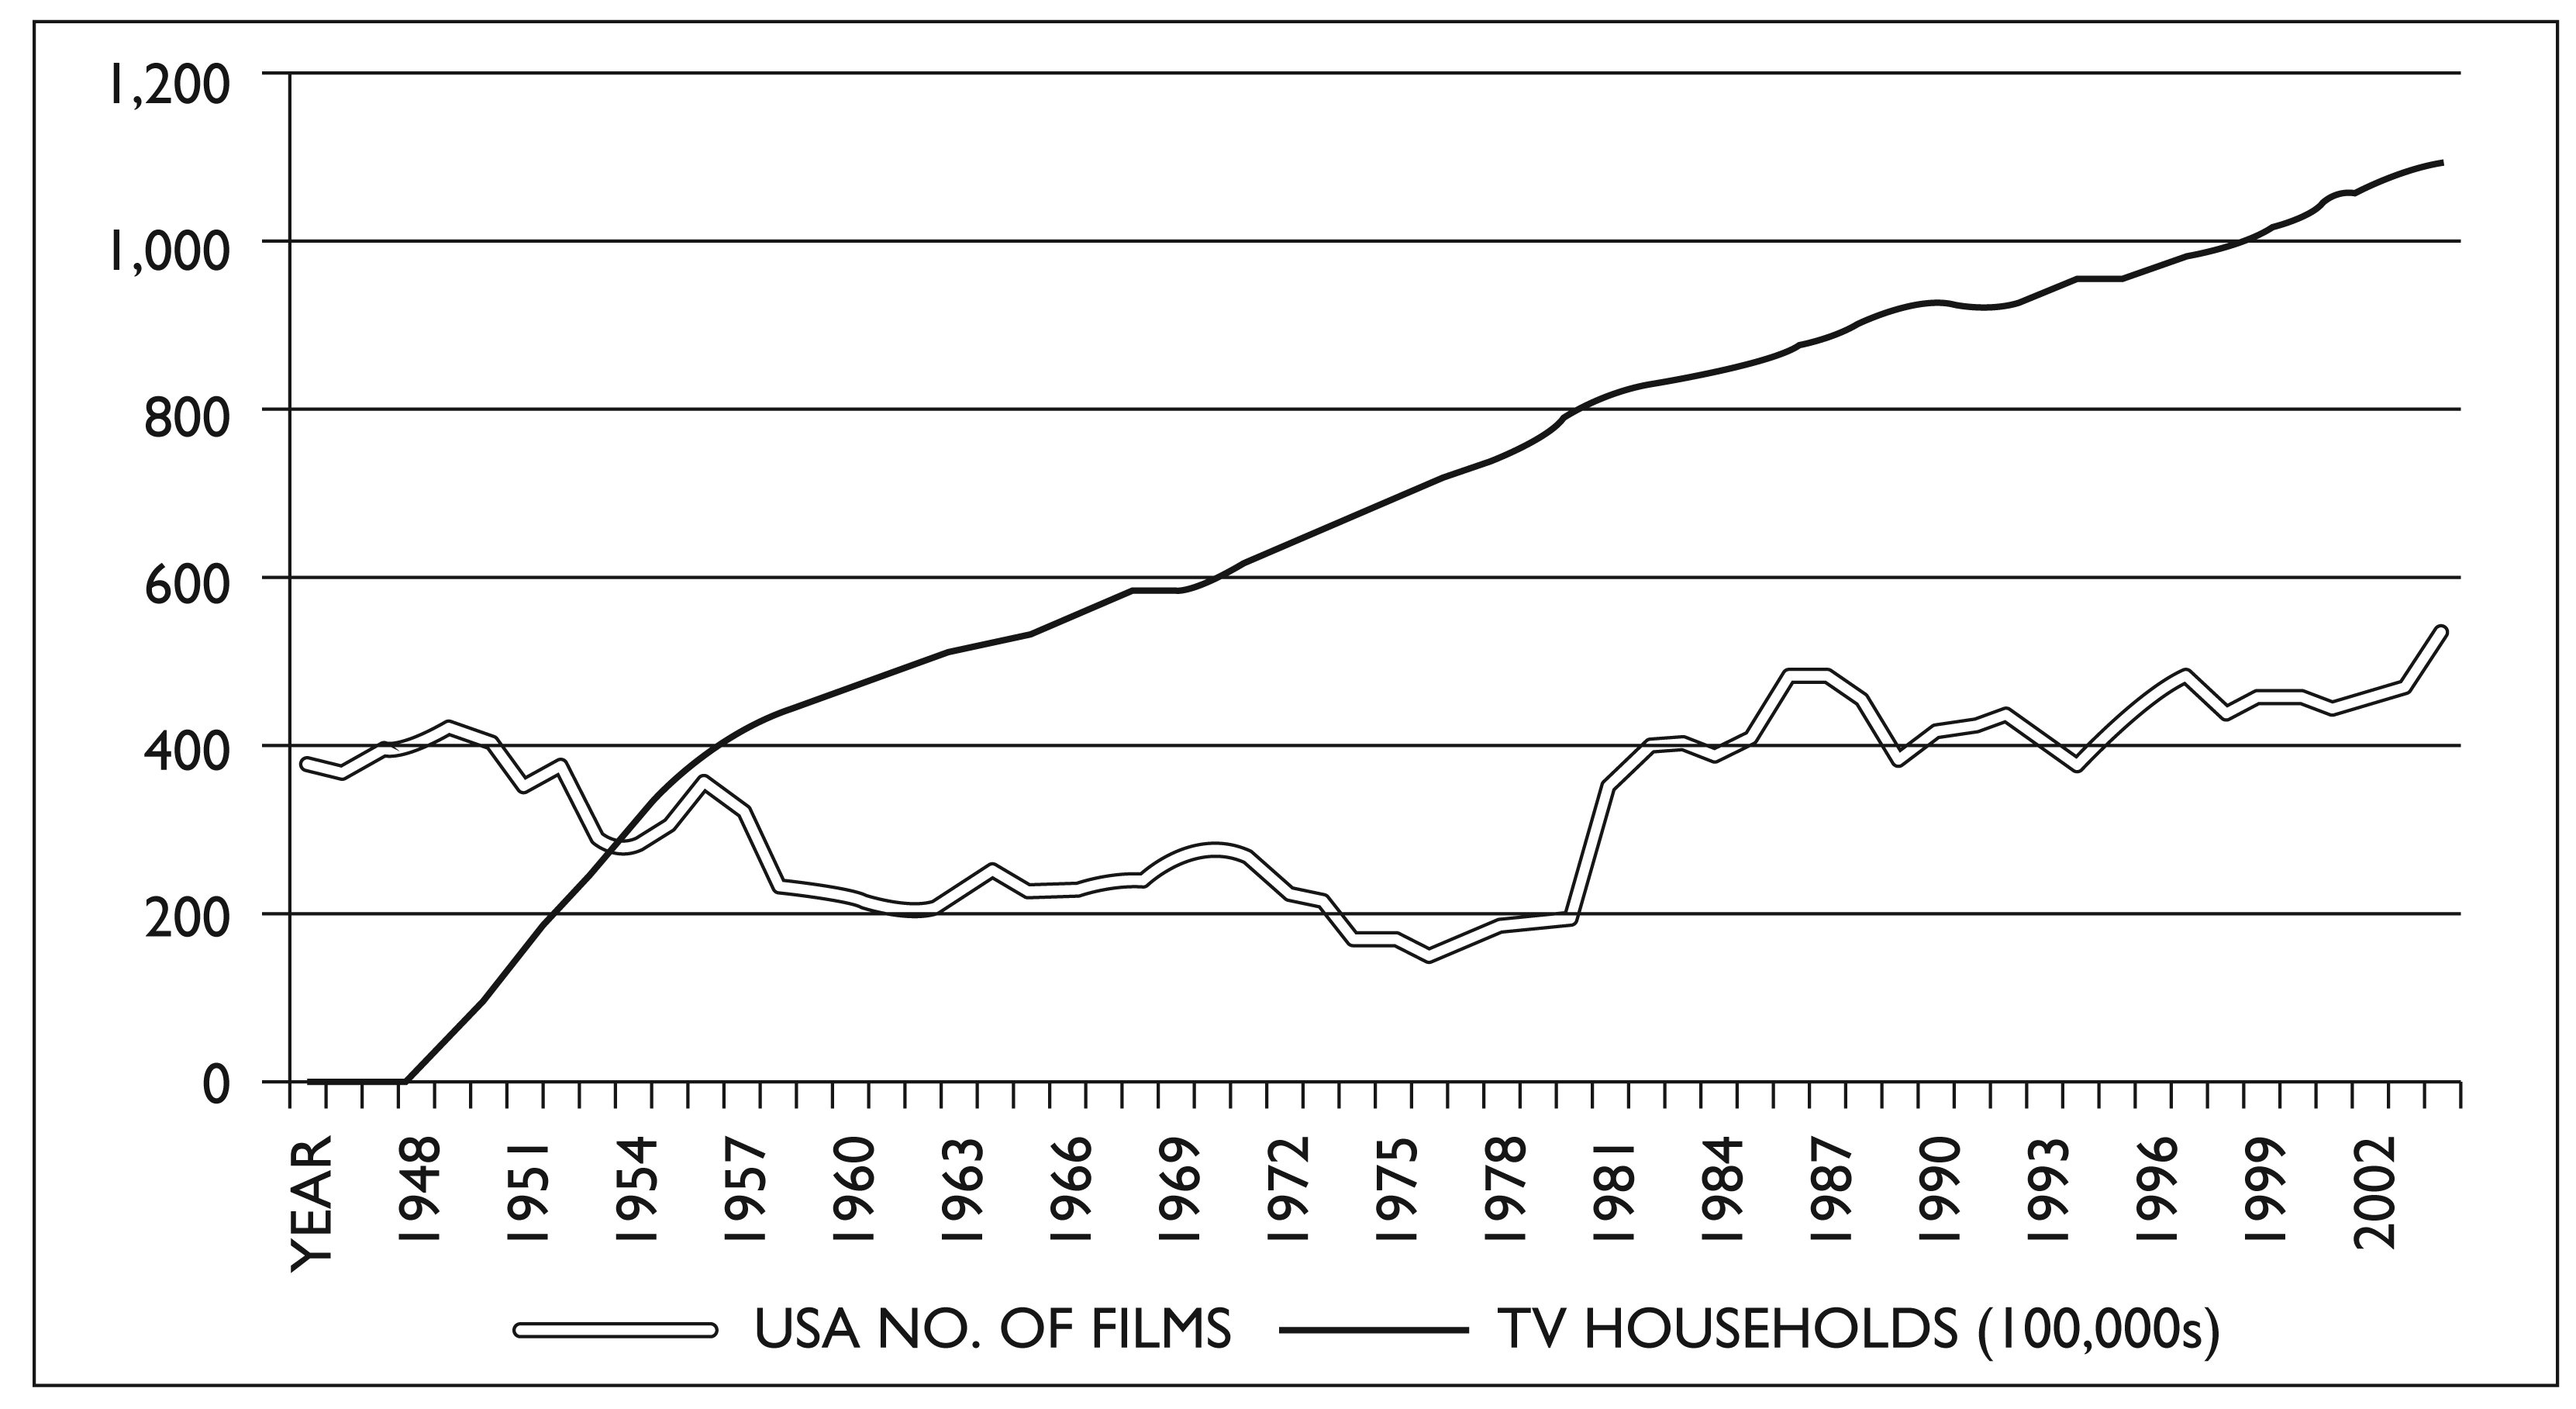
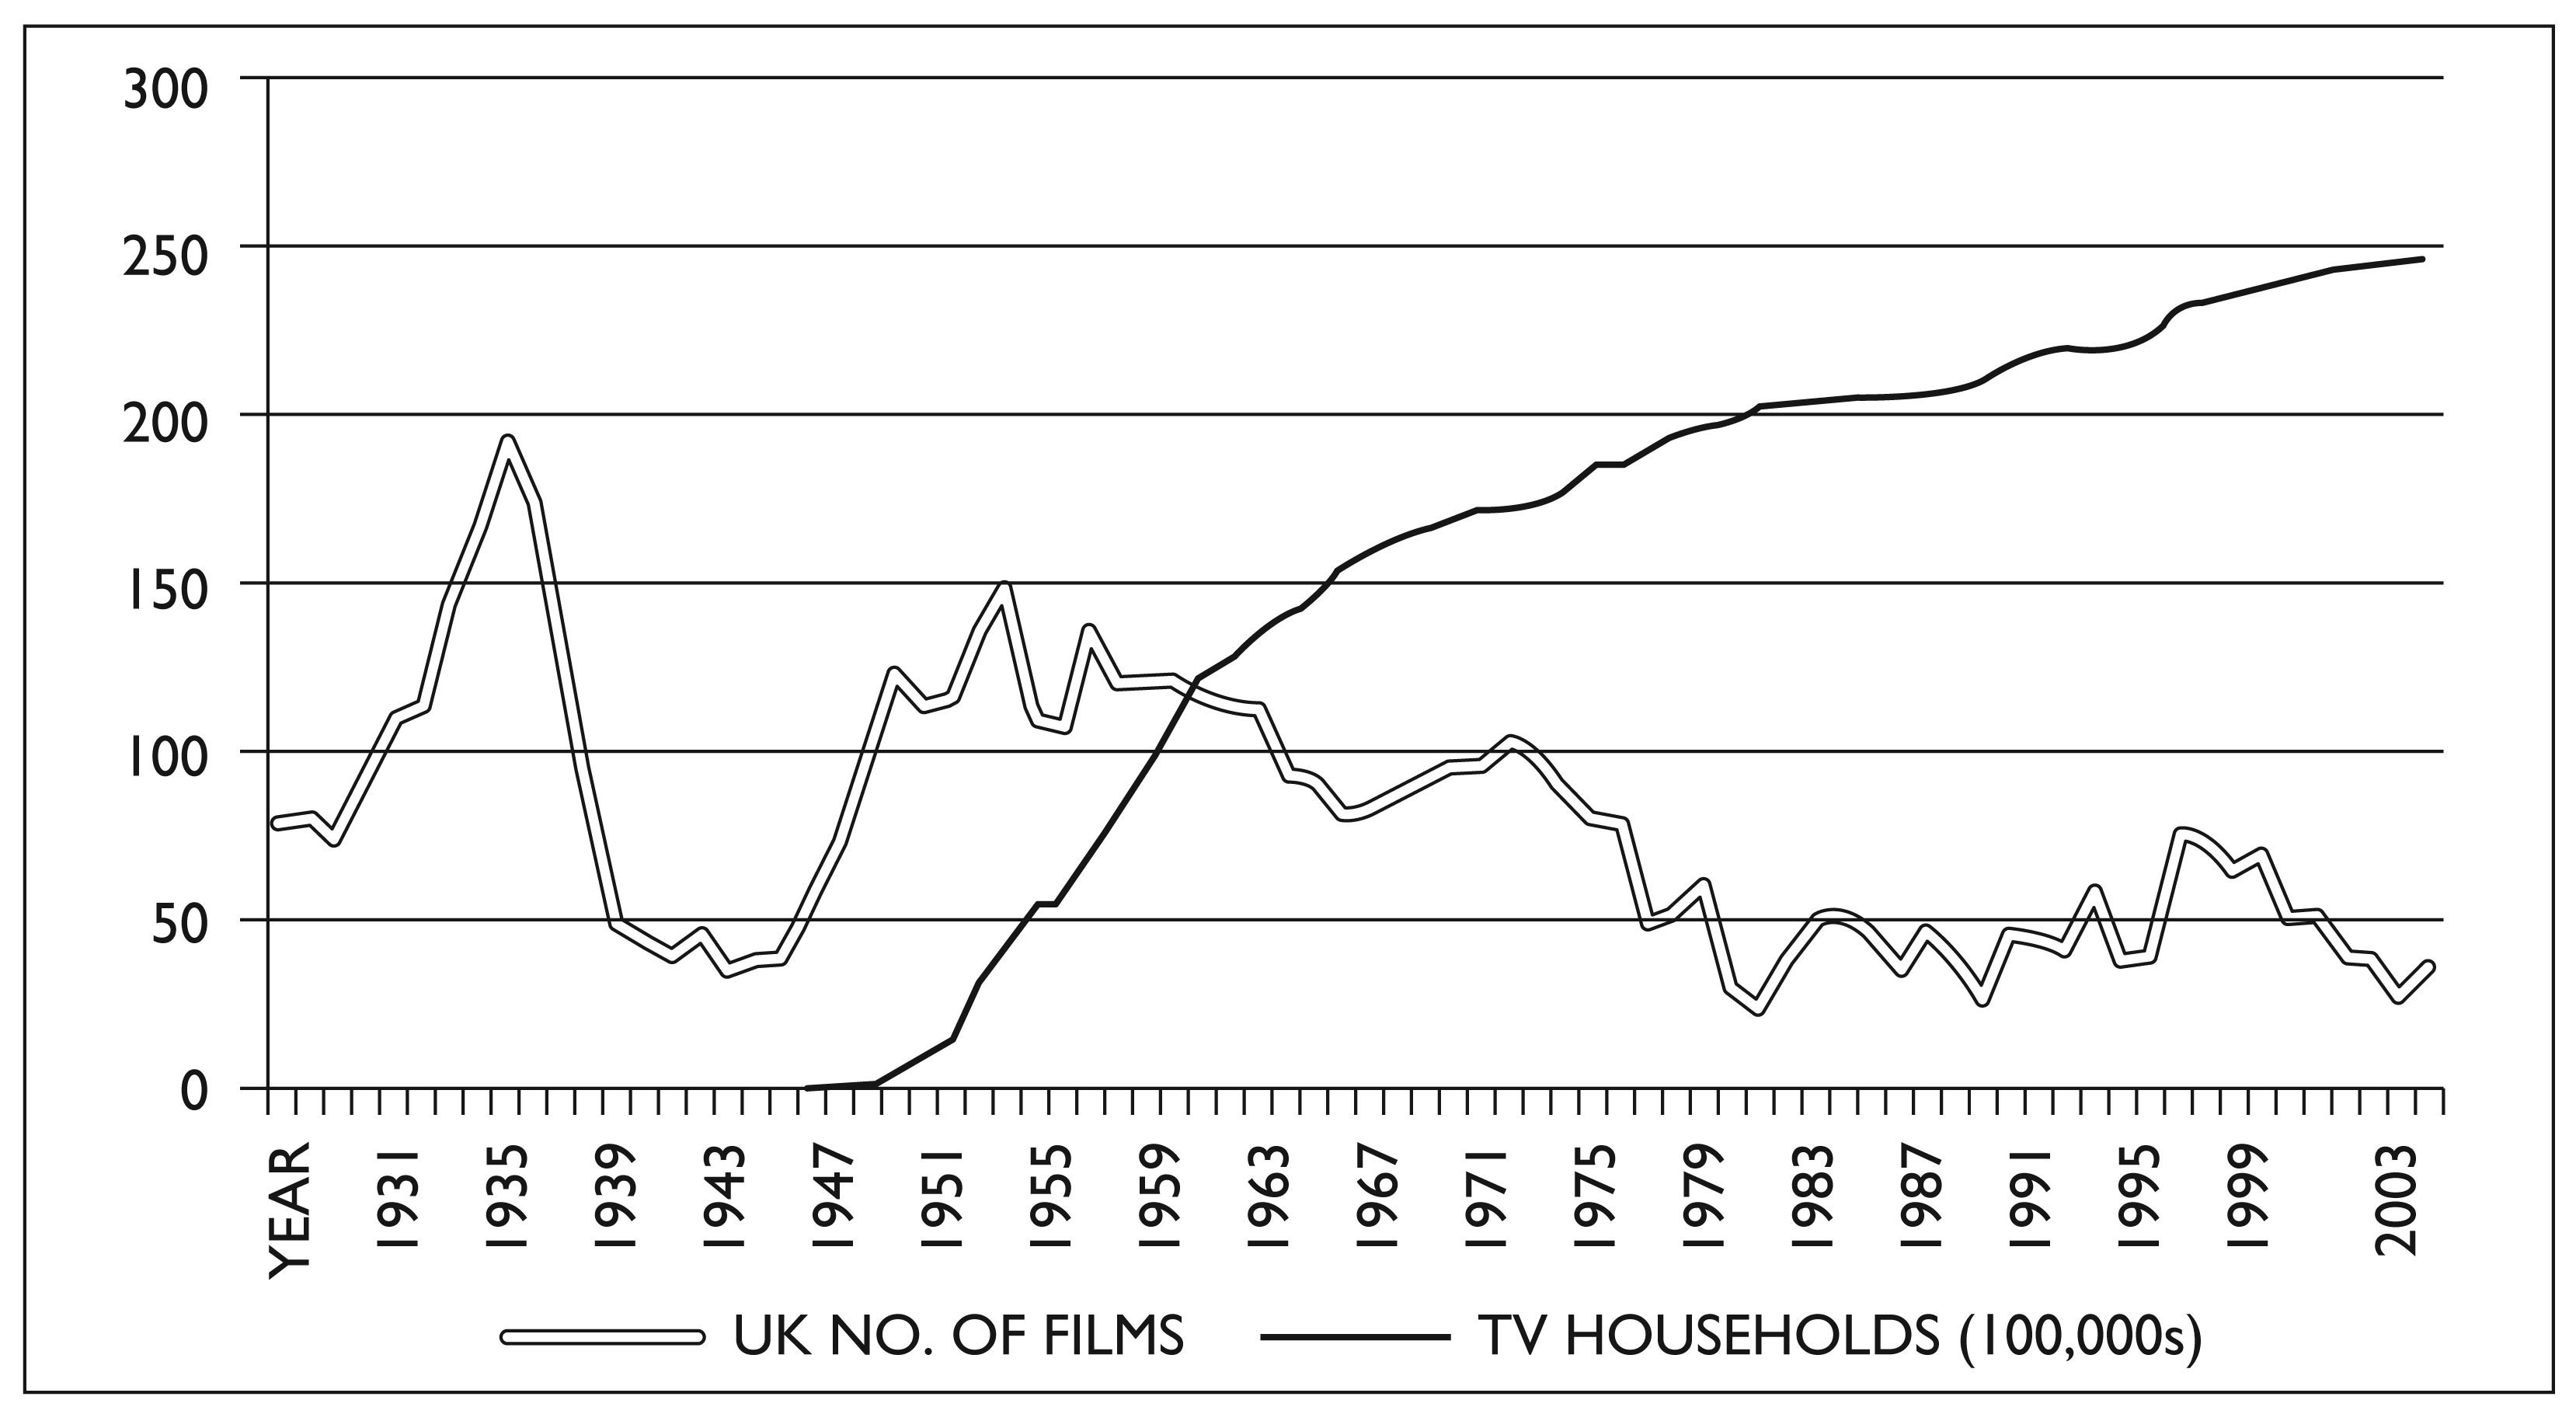
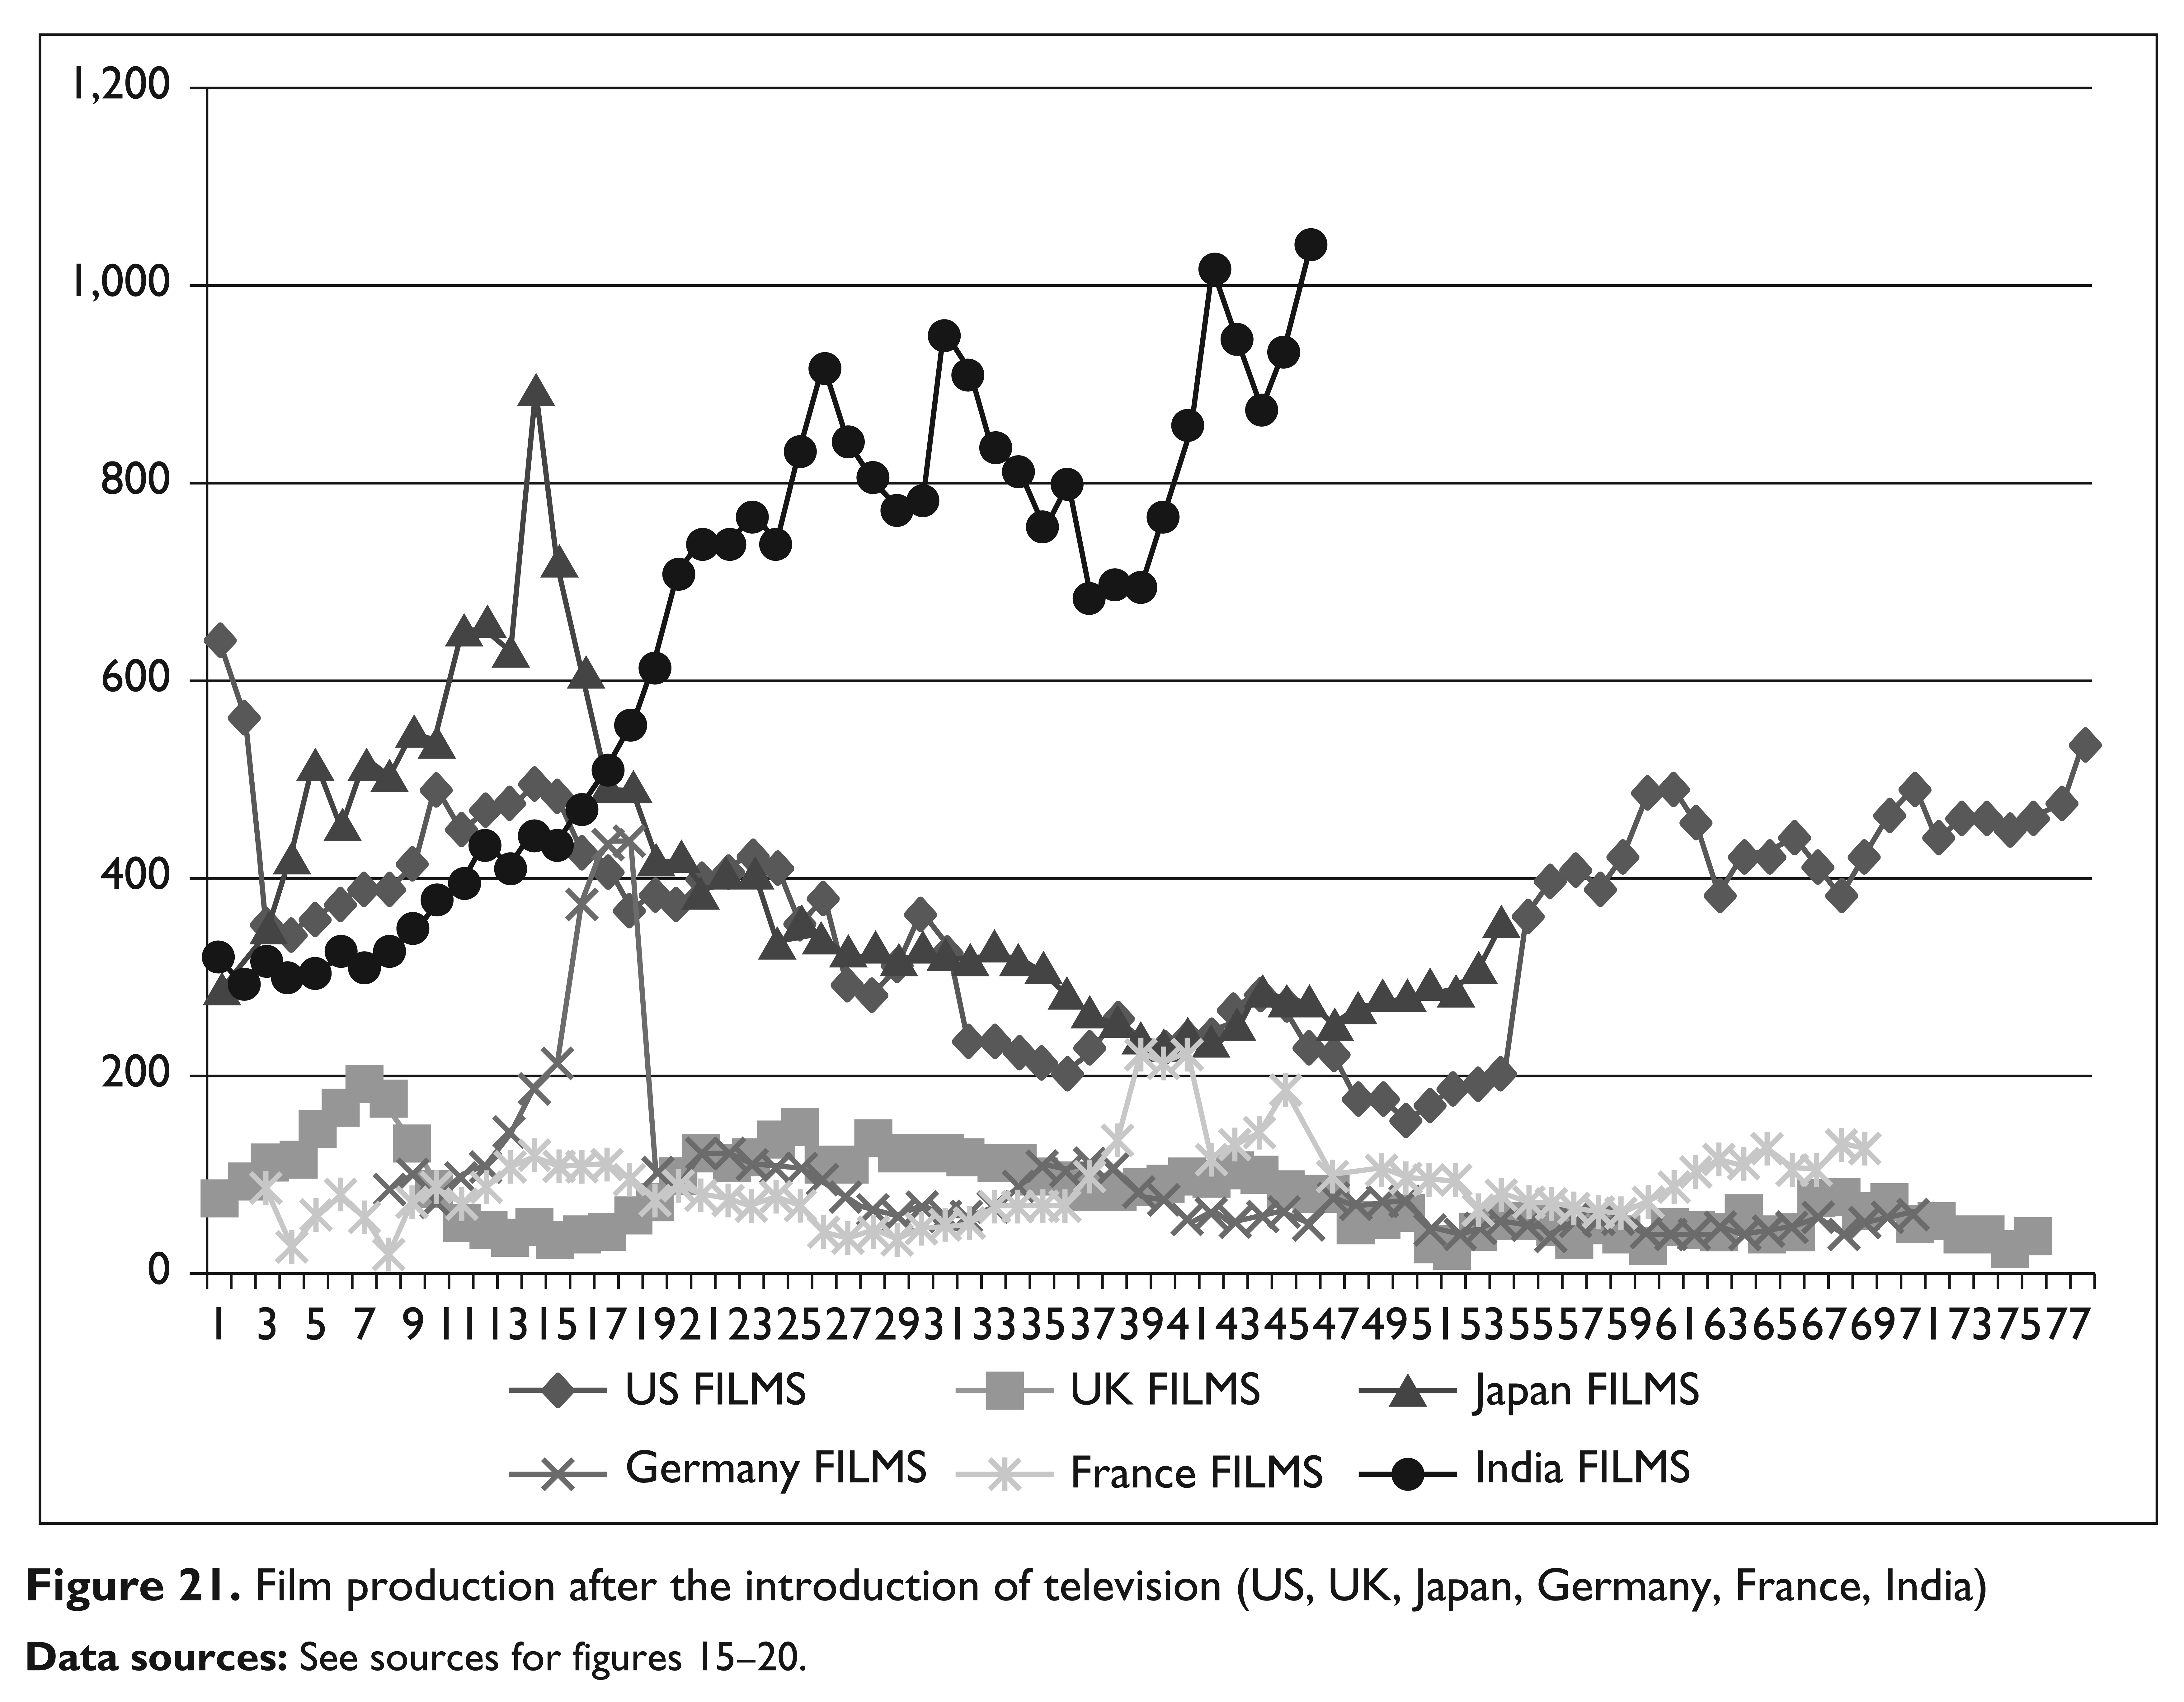
The annual number of films produced was graphed alongside television households (see Figures 15–20). The six countries fell into two groups. The USA, France and India have shown an increase in films produced despite the introduction of television. Both the USA and France show an initial fall in film production followed by a later increase, while India has not shown any decrease in film production at all. The other group of countries includes the UK, Germany and Japan. These countries all showed a continuous decline in the number of films produced after the introduction of television. These results are to be interpreted with caution due to the reason explained earlier; the number of films produced does not cast any light on the revenue generation potential of the films produced. American film production is lower than Indian film production, but Hollywood films dominate international film markets.
As before, time series of films produced from all countries were graphed together from the arrival of television. India clearly stands out in the number of films produced which show a continuous increase each year compared to the other countries (see Figure 21).
Theatrical Screens and Television Households
Theatrical screens and television households were also graphed for the individual countries. Except for the USA and France, all other countries showed a declining trend in theatrical screens (see Figures 22–27). While an increase in theatre screens does not mean an increase in admissions capacity, fewer screens generally mean fewer admissions opportunities.


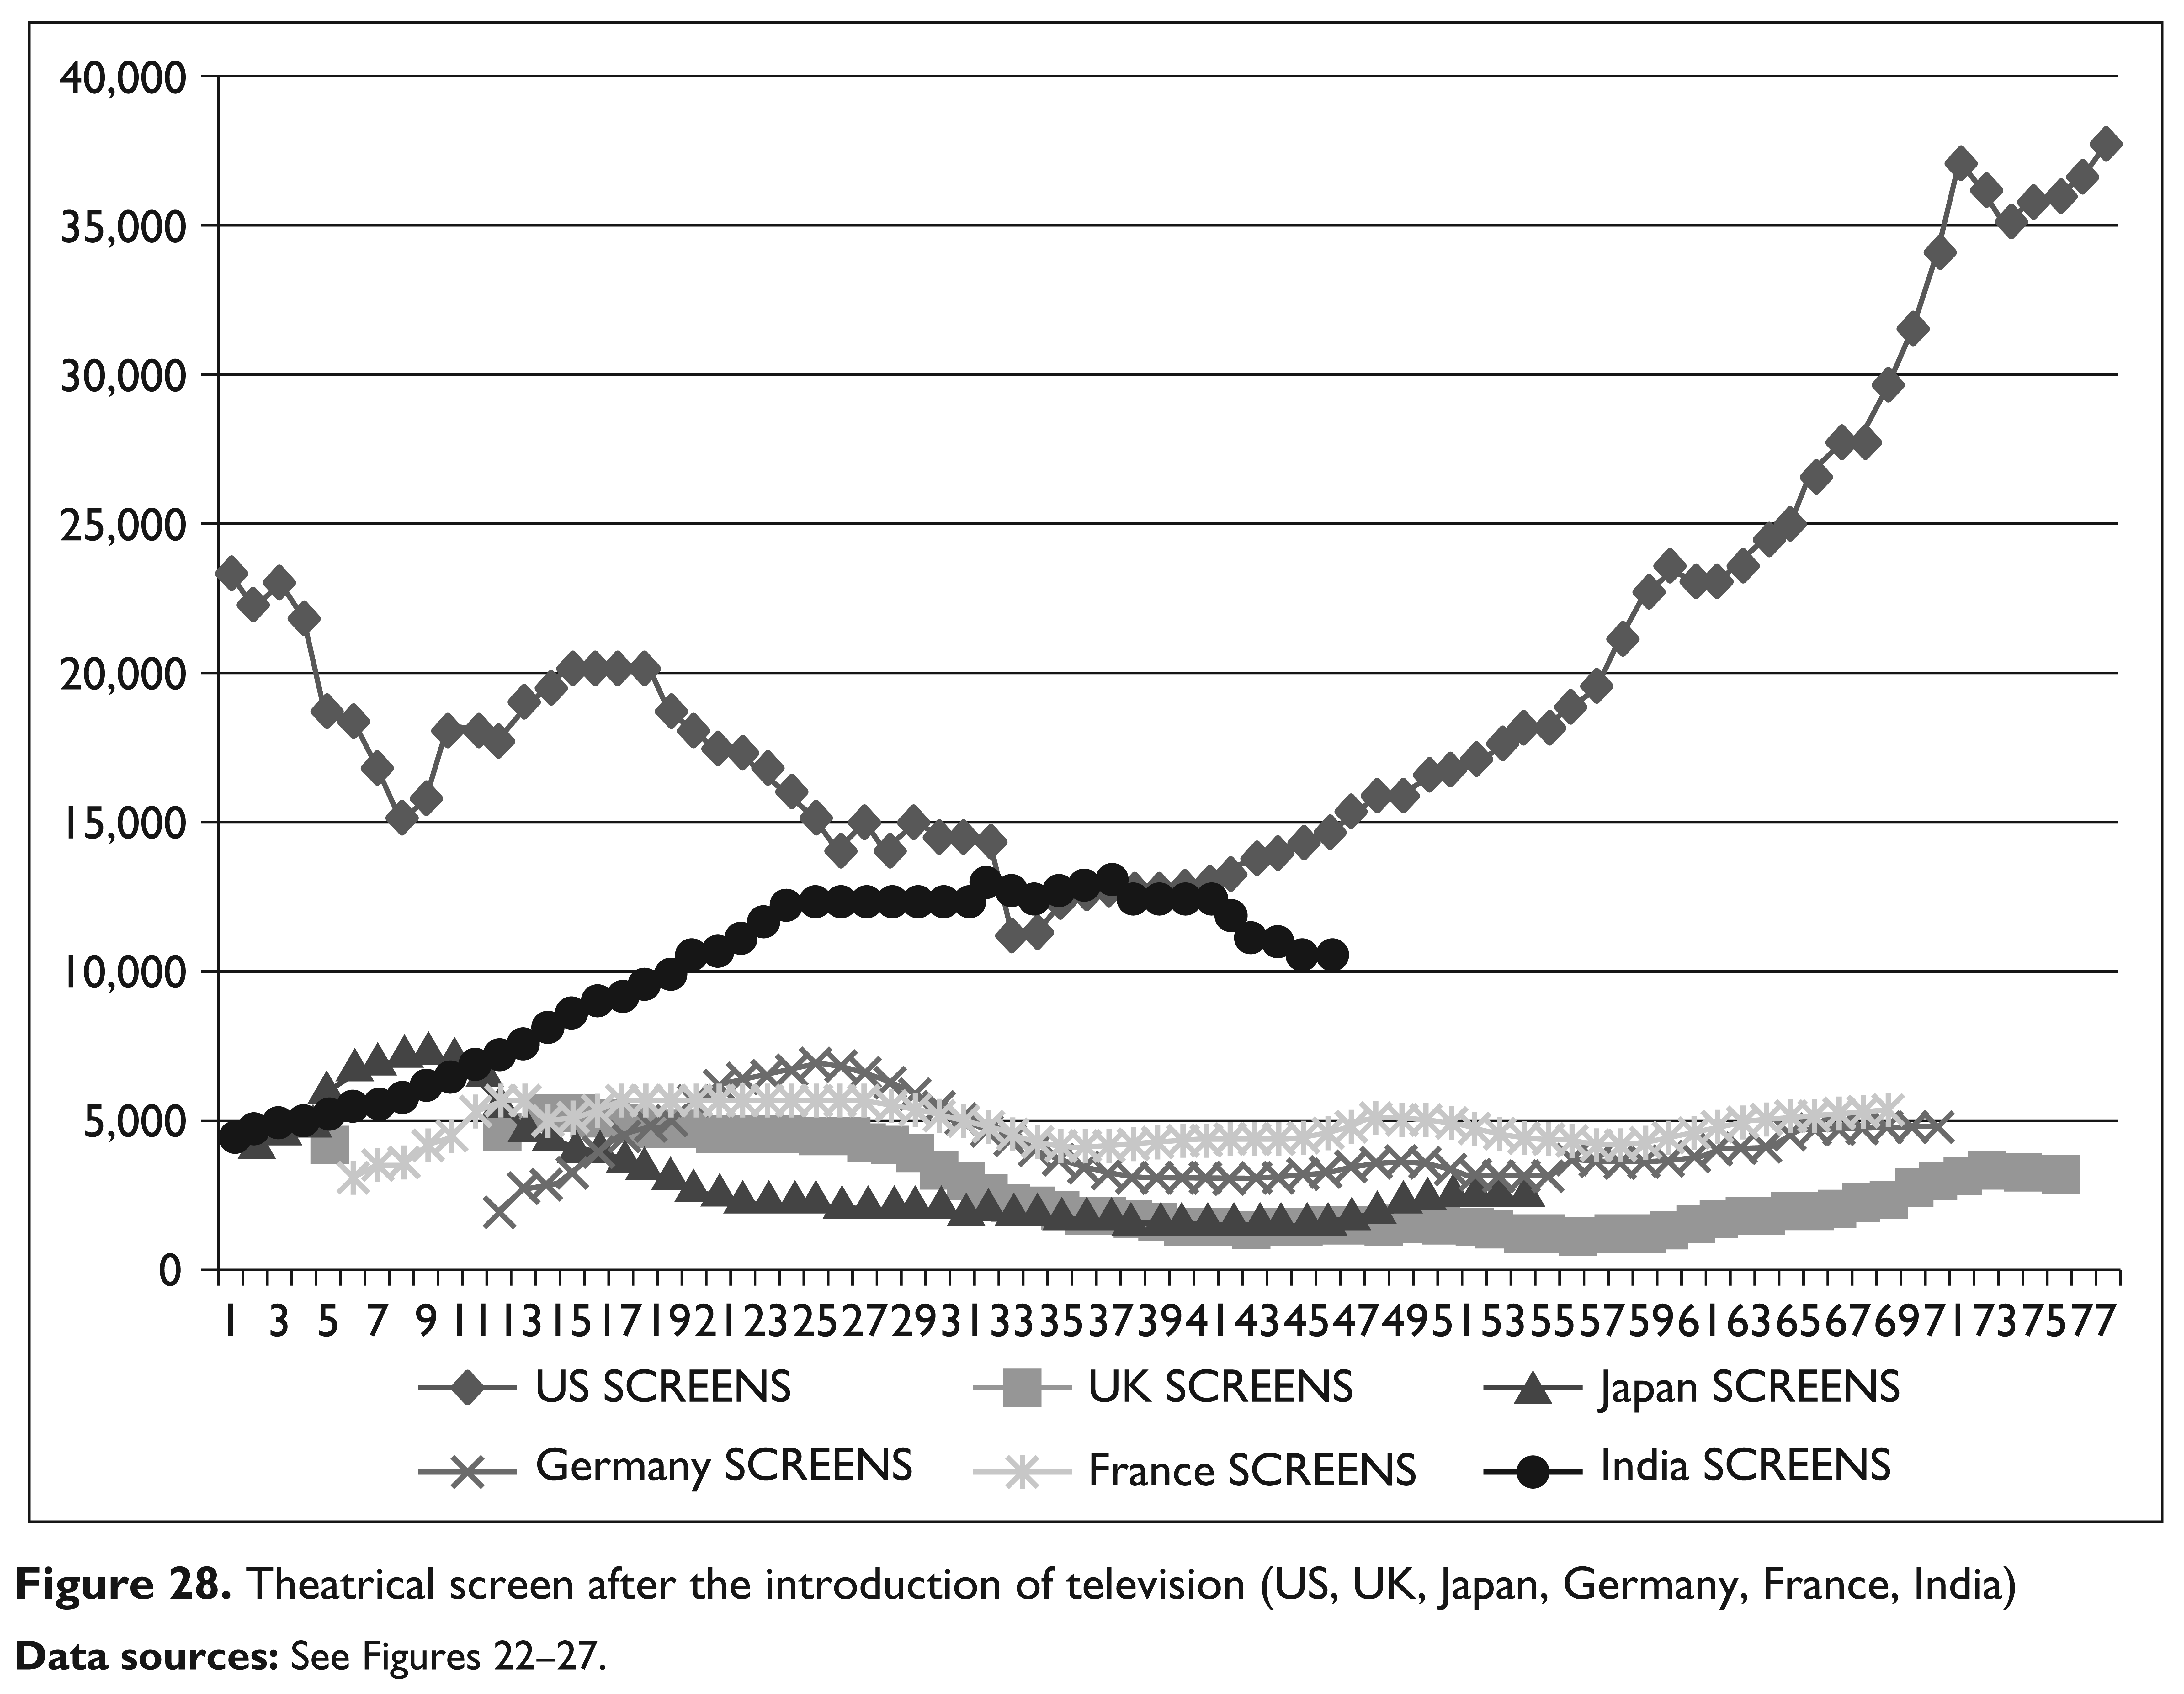
When taken together, we see how theatrical screens in all countries except the US have fallen since arrival of television. India also shows a decline in the number of screens that are available (see Figure 28). In the USA theatrical screens have actually increased after an early decline.
Overall, the trend lines point to some broad patterns. In the matter of television diffusion, India is at a very different stage than the USA, UK, France, Germany and Japan. While television households have reached a plateau in all these countries, television households in India are still growing. Second, aggregate film admissions have steeply fallen in all the other countries except in India. Third, Indian per capita admissions were much lower than per capita admissions in countries such as the USA and UK in the early days of television. Currently per capita admissions in all countries are roughly at the same level. Fourth, Indian film production exceeds film production in all other countries. Fifth, except for the US, number of theatrical screens have declined in all other countries including India.
In the next section, regression models that were estimated to examine the statistical relationships between the variables are presented.
Models and Estimation
To examine the economic effect of competing technologies on the film industry and the effect of the diffusion of television on film admissions, the number of films produced and theatrical screens is modeled here. Following the models by Spraos (1962) and Stuart (1982), the basic model estimated is as below:
Two measures are used for admissions: aggregate admissions and admissions per capita. Two additional measures—the number of films produced and the number of theatrical screens—are also used in the estimation.
Variable Definitions
Econometric Estimation—Country Models
Since the data is from a time series, serial correlation in the ordinary least squares (OLS) specification of the regression model cannot be ruled out. The OLS model assumes that errors are uncorrelated. Thus the presence of serial correlation in the data violates one of the basic assumptions of the OLS model. In the presence of serial correlation, the OLS estimator remains unbiased, but it is no longer efficient. The R-squared values and the t statistics show an increase. Thus serial correlation needs to be identified and adjusted for. The Durbin-Watson statistic is computed to test for serial correlation. The computed value is compared to the value of test statistic at the number of degrees of freedom (no. of independent variables + constant) and for the number of observations (N). The test statistic table reports an upper and lower bound for the test statistic. If the computed value is greater than the upper bound then there is no evidence of serial correlation. The OLS specification is acceptable in this situation. The test is inconclusive if the computed value falls between the lower and upper bounds of the test statistic. If the computed value is less than the lower bound, the presence of serial correlation is indicated. To adjust for serial correlation, the model is re-estimated using the Prais-Winsten method of estimation. This method assumes that the correlation is of the first order, that is, each error term is correlated to the error term immediately preceding it (Greene 2002). This is considered to be an acceptable assumption for annual data. The models were first estimated for each country individually.
USA
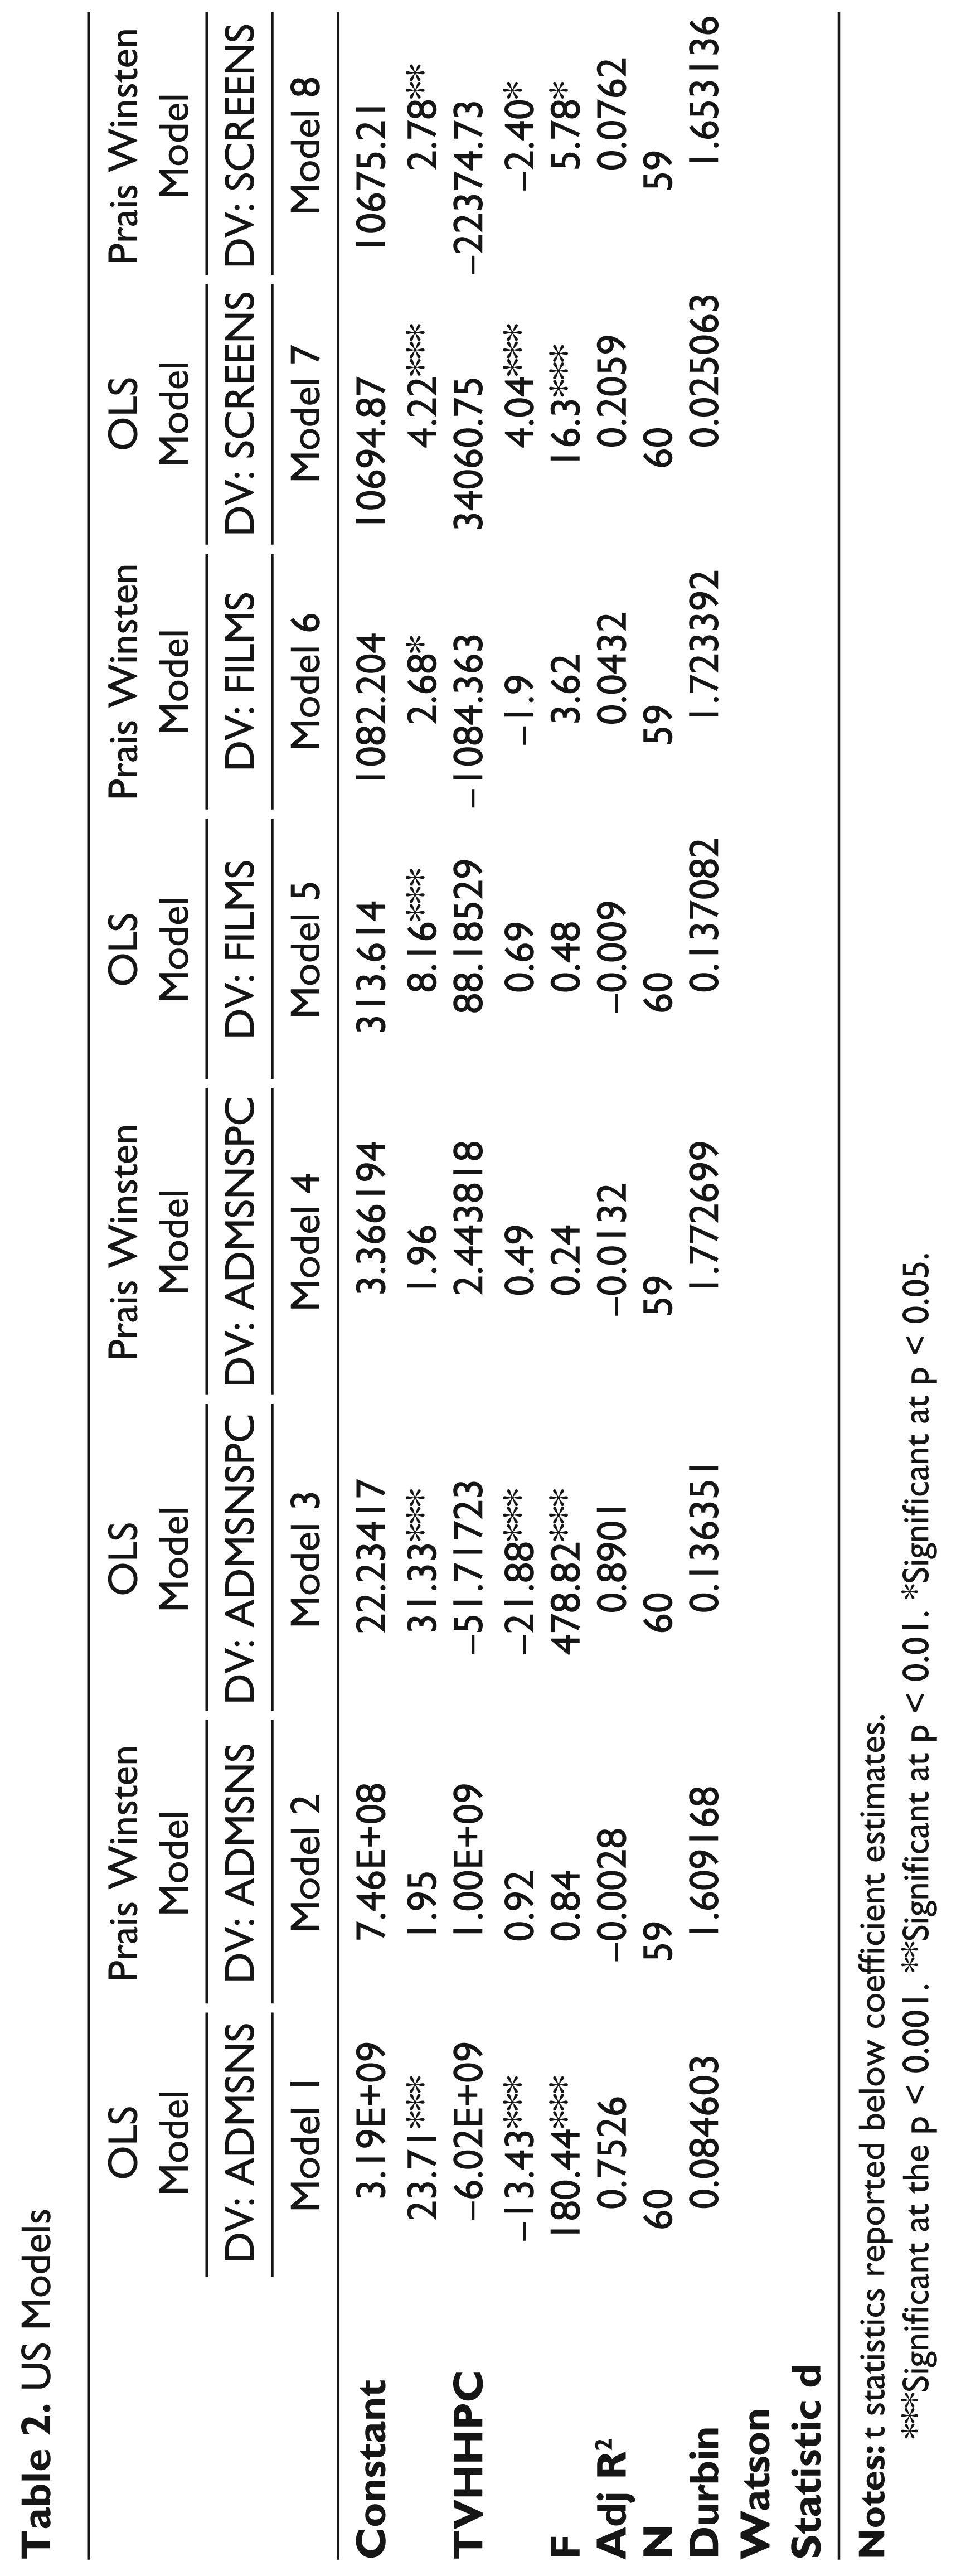
Data from the USA was first examined. The OLS version of the model was first estimated (Model 1) to examine the effect of television penetration on aggregate admissions. For this model (Model 1), the computed value of the Durbin-Watson statistic was less than the lower bound of the statistic at the reported degrees of freedom (2) for the number of observations (0.084603 < 1.51, df = 2, N = 60), thus indicating the presence of serial correlation. To adjust for serial correlation, the model (Model 2) was re-estimated using the Prais-Winsten method of estimation. After adjusting for serial correlation, the significant effect for TV penetration on aggregate admissions disappeared and the direction of the effect changed to positive. This model tested inconclusively for the presence of auto-correlation.
The second measure used for estimation was admissions per capita. The OLS model showed a significant negative effect of television penetration on admissions per capita (See Table 2). Serial correlation could not be ruled out, and the Prais-Winsten method of estimation was used. The effect was no longer significant, and the direction changed to positive.
US Models
***Significant at the p < 0.001. **Significant at p < 0.01. *Significant at p < 0.05.
For the third measure—the number of films produced—television penetration had a positive but non-significant effect in the OLS specification. Serial correlation could not be ruled out, and the Prais-Winsten method of estimation was used. The direction of the effect changed to negative, but remained non-significant.
The fourth and final measure used was the number of screens. Television penetration had a positive and significant effect on the number of screens in the OLS model. Serial correlation could not be ruled out, and the Prais-Winsten method of estimation revealed that television penetration had a significant negative effect on the number of screens (t = –2.4, p < 0.05, adjusted R2 = 0.062).
In summary, the estimation results show that in the USA, television penetration had a significant negative effect on the number of screens. The effect on admissions per capita was positive, but not significant, and the effect on the number of films produced was negative but not significant. The model which included aggregate admissions tested inconclusively for the presence of serial correlation.
UK
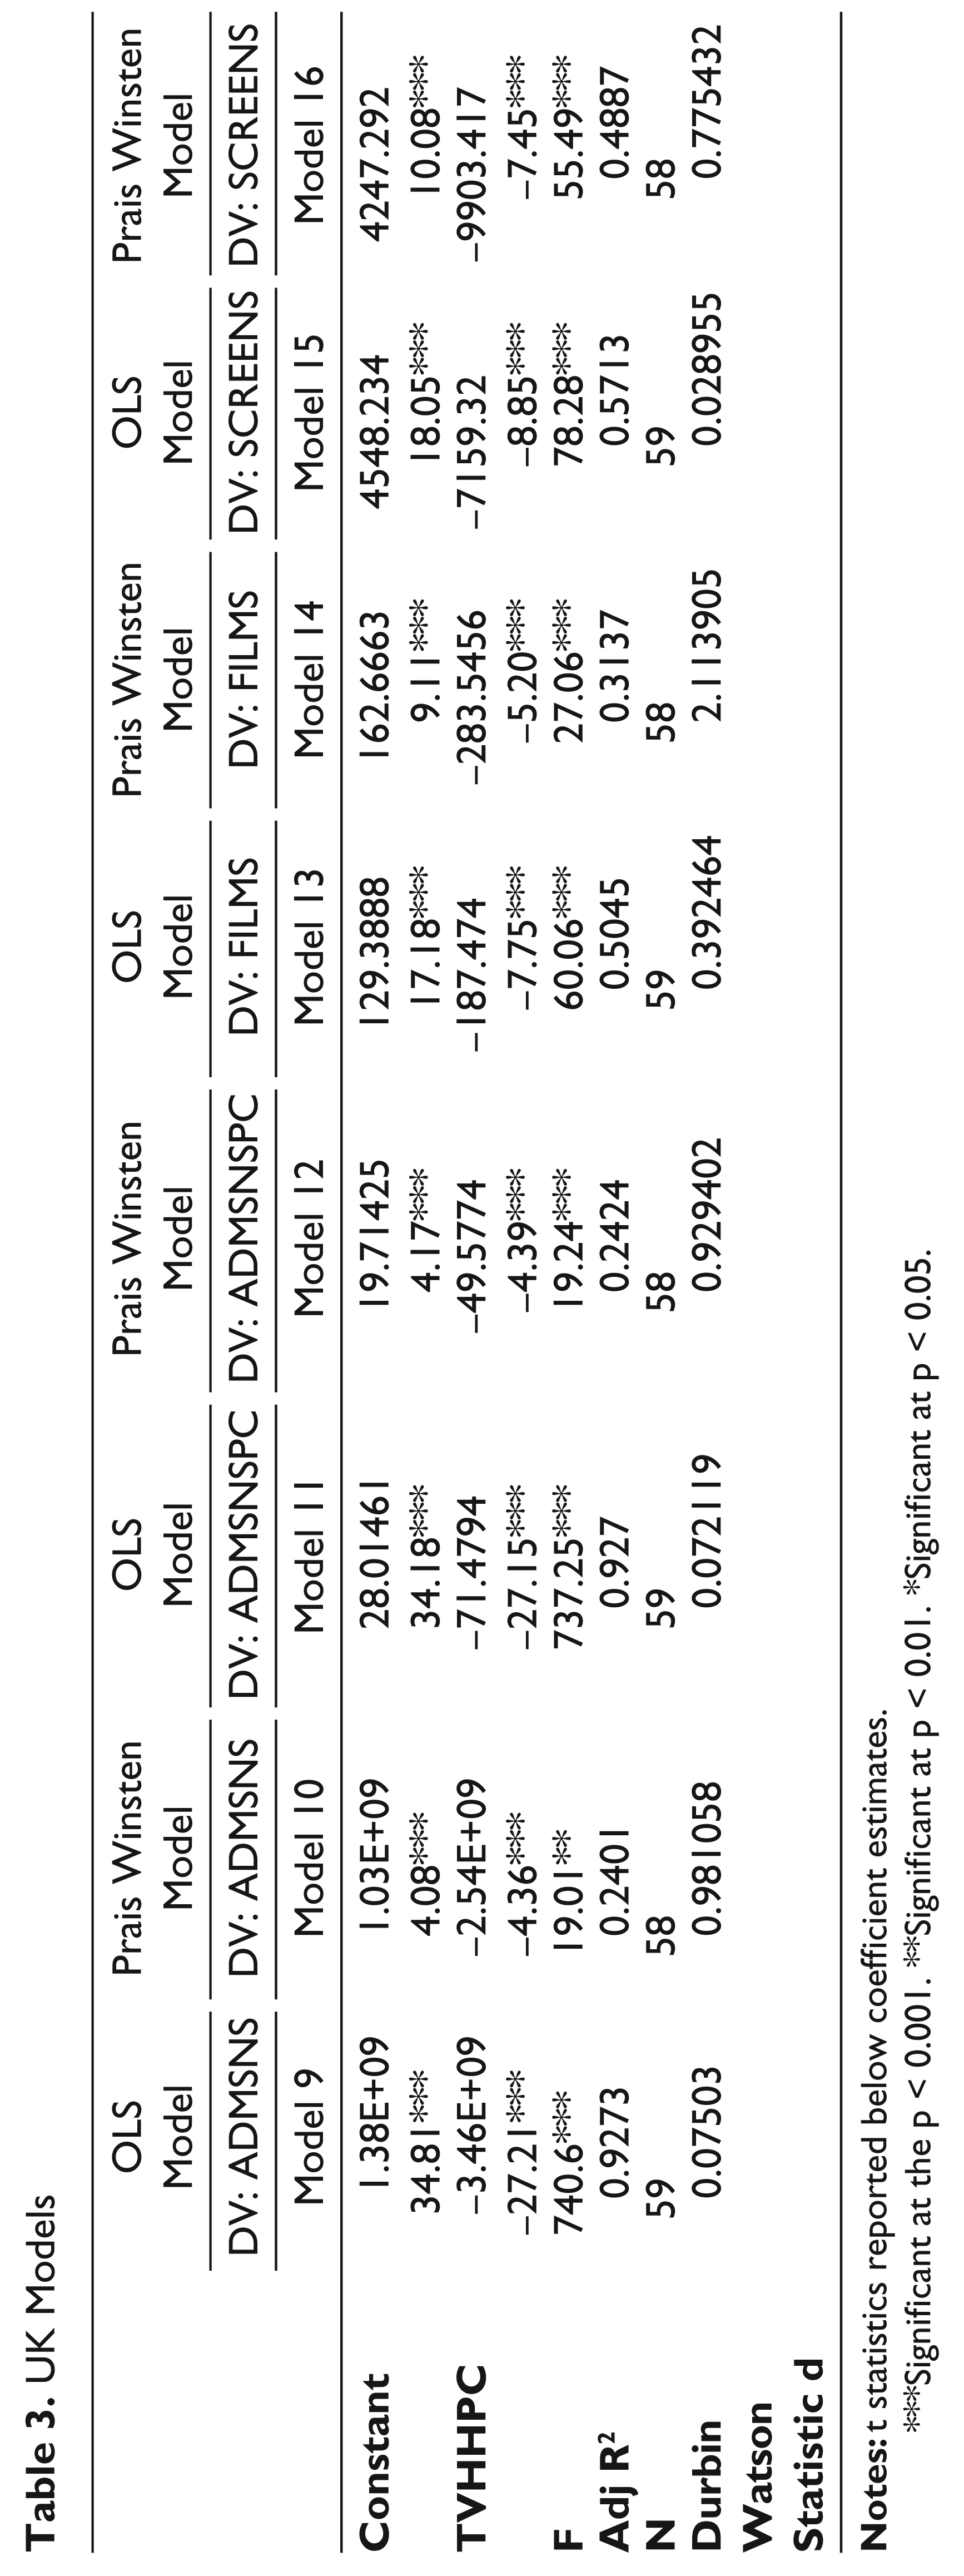
In the UK, television penetration had a significant negative effect on the number of films produced, when the OLS model was estimated (see Table 3). Since serial correlation could not be ruled out, the model was re-estimated using the Prais-Winsten method. This model also showed a significant negative effect of television penetration on the number of films produced (t = –5.2, p < 0.001, adjusted R2 = 0.3137).
UK Models
***Significant at the p < 0.001. **Significant at p < 0.01. *Significant at p < 0.05.
The data for the UK shows serial correlation in models that include the aggregate admissions, admissions per capita and number of screens despite re-estimation using the Prais-Winsten method.
France
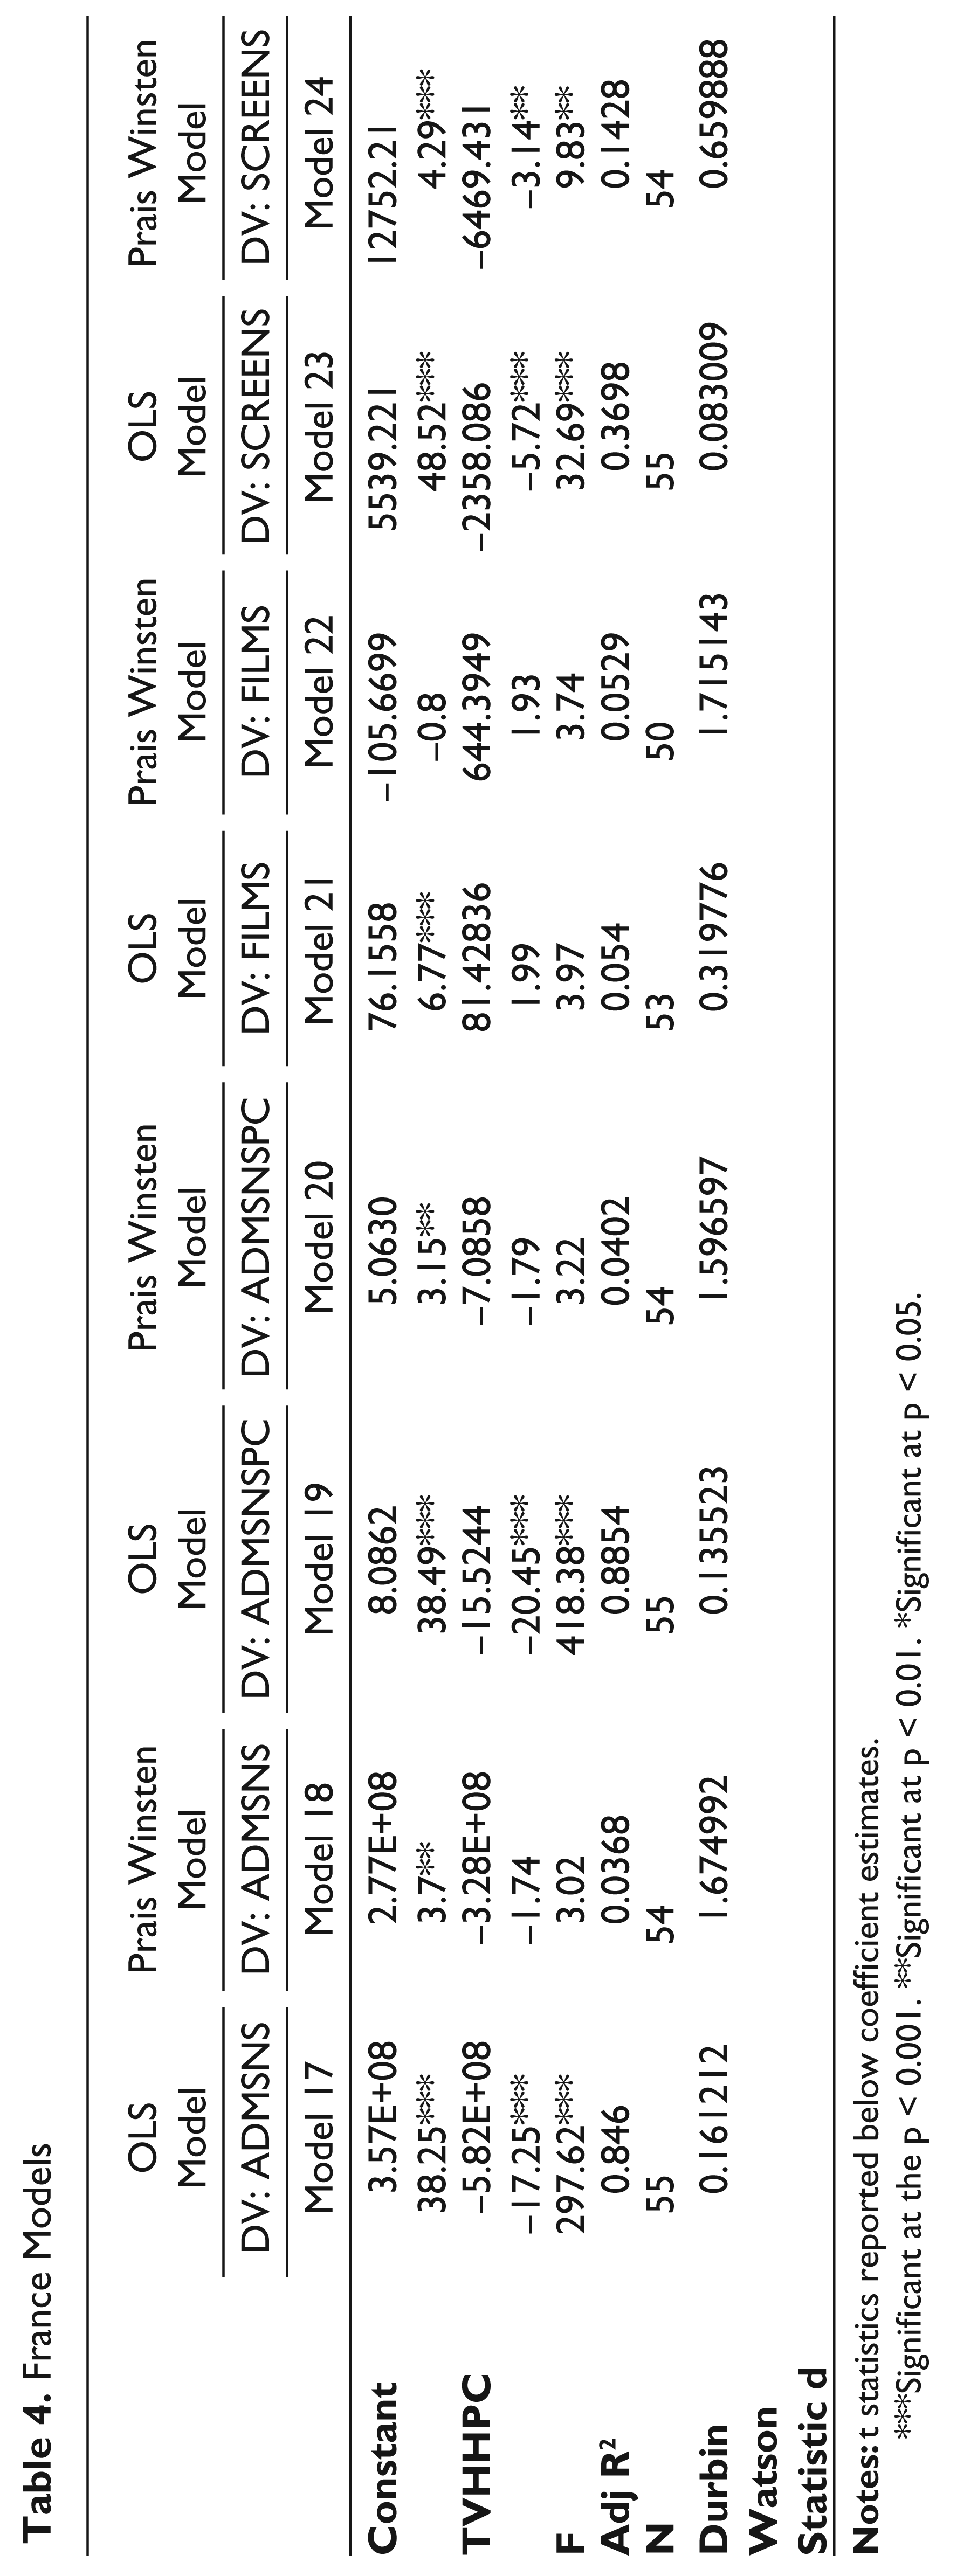
Television penetration had a negative but non-significant effect on aggregate admissions and a positive but non-significant effect on the number of films produced in France. Despite using the Prais-Winsten method, models involving the number of screens showed the continued presence of autocorrelation. The model involving admissions per capita tested inconclusively for the presence of autocorrelation (see Table 4).
France Models
***Significant at the p < 0.001. **Significant at p < 0.01. *Significant at p < 0.05.
Germany
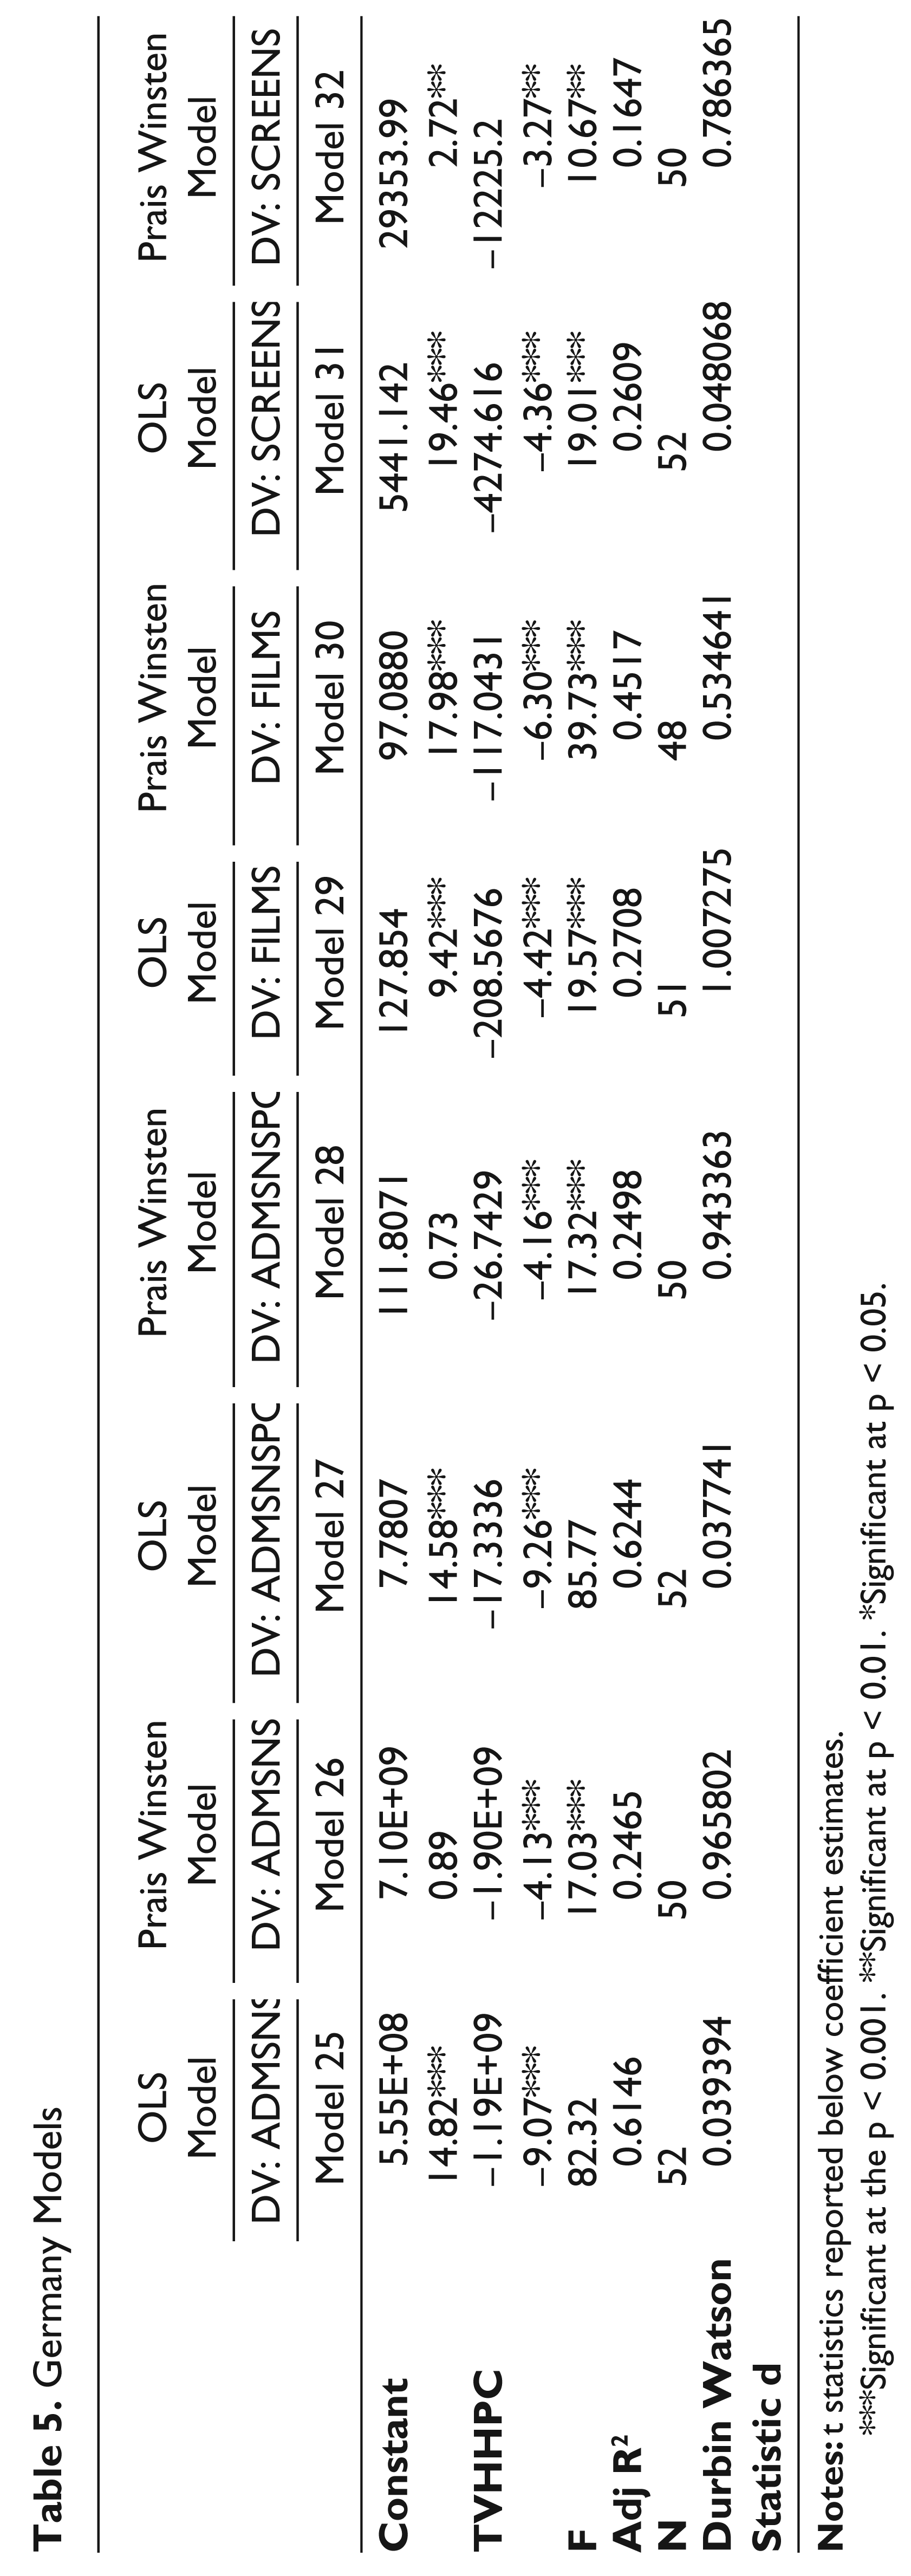
The data was observed to be serially correlated in the models estimating the effect of television penetration on all four measures, that is, aggregate admissions, admissions per capita, number of films produced and the number of screens as seen in the low value of the computed Durbin-Watson test statistic even after re-estimation using the Prais-Winsten method (see Table 5).
Germany Models
***Significant at the p < 0.001. **Significant at p < 0.01. *Significant at p < 0.05.
Japan
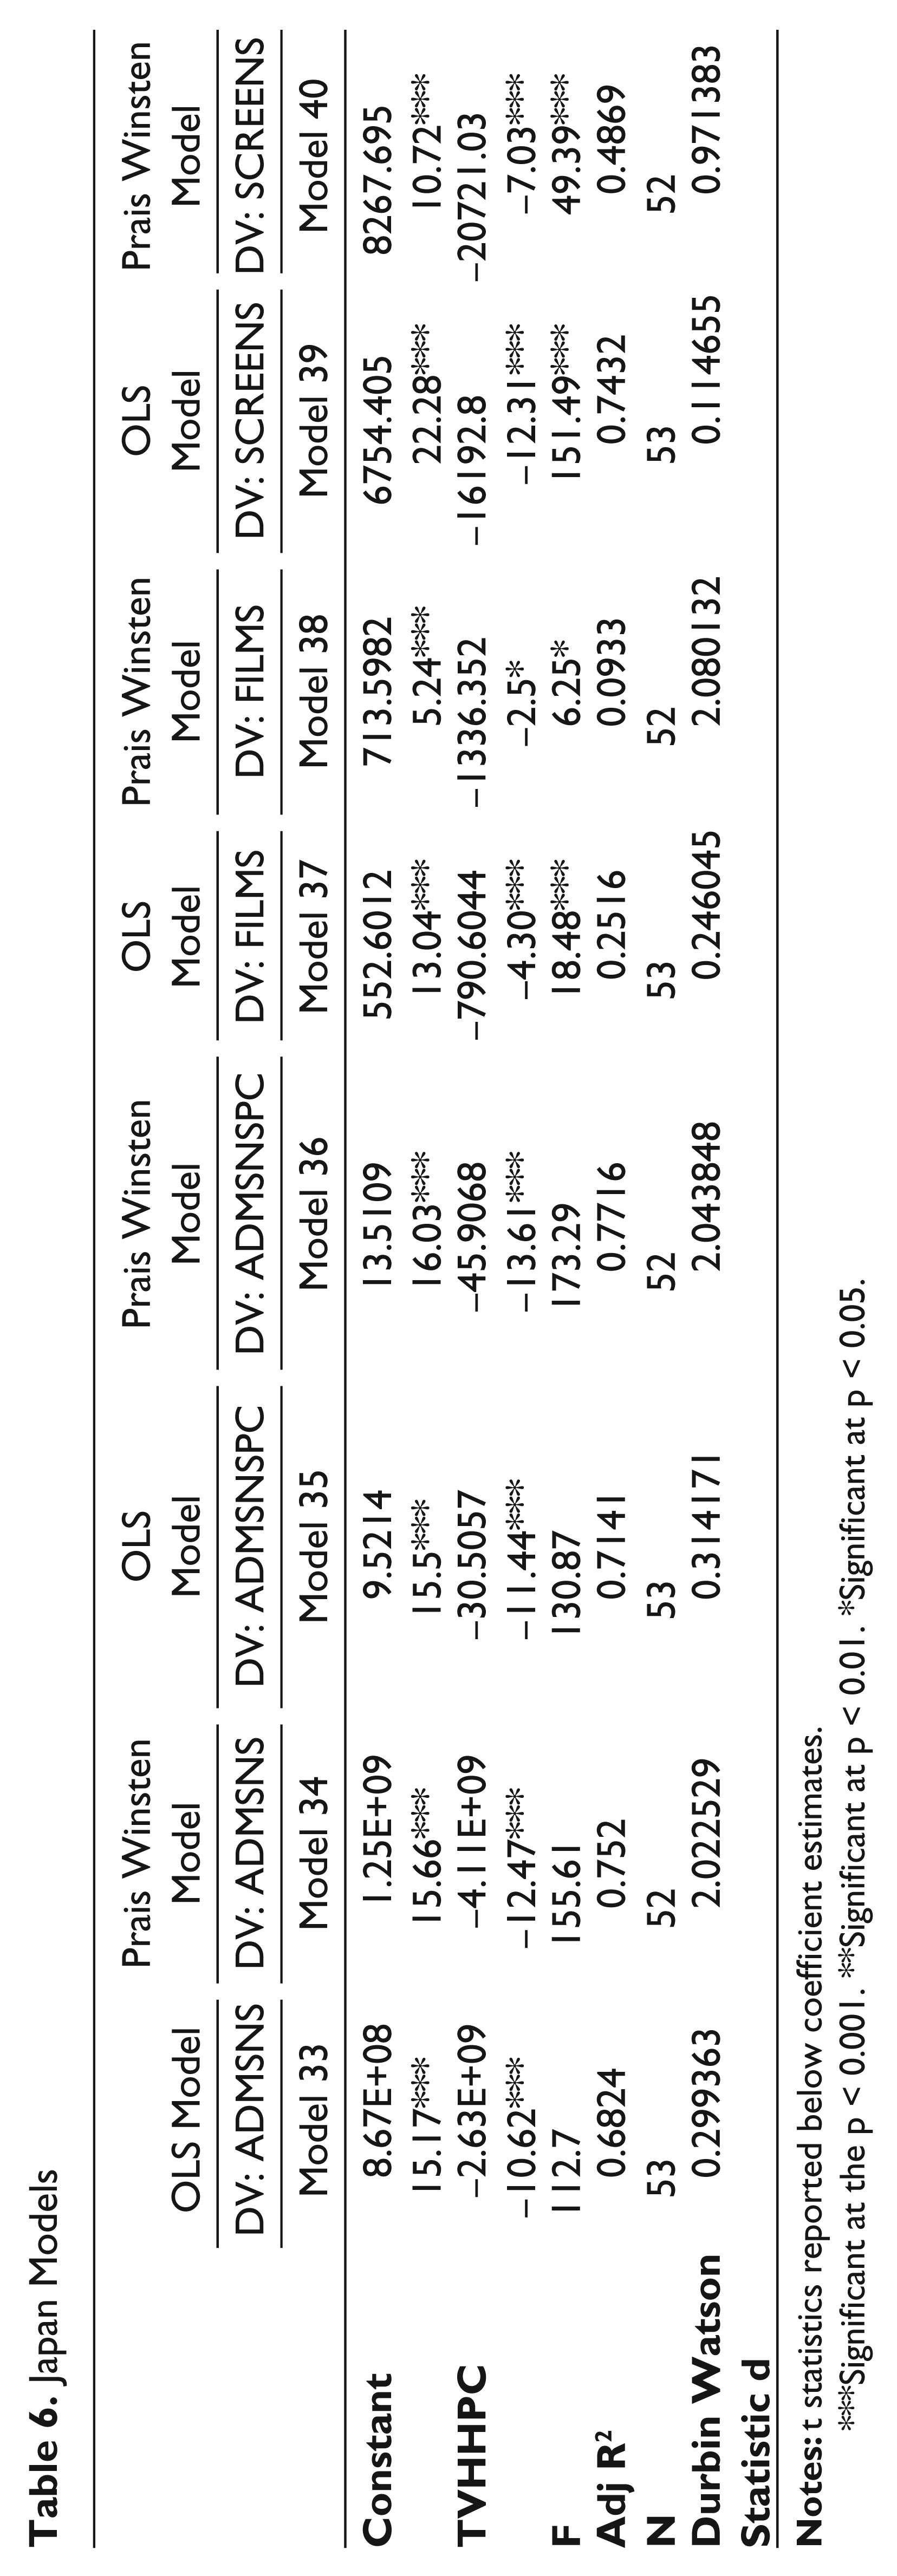
Television penetration showed a significant negative effect on aggregate admissions (t = –12.47, p < 0.001, adjusted R2 = 0.752). Similarly, television penetration showed a significant negative effect on admissions per capita in the model estimated through the Prais-Winsten method (t = –13.16, p < 0.001, adjusted R2 = 0.7716) (see Table 6).
Japan Models
***Significant at the p < 0.001. **Significant at p < 0.01. *Significant at p < 0.05.
Data for both additional measures—number of films and the number of screens—showed the presence of serial correlation that could not be adjusted using the Prais-Winsten method.
India
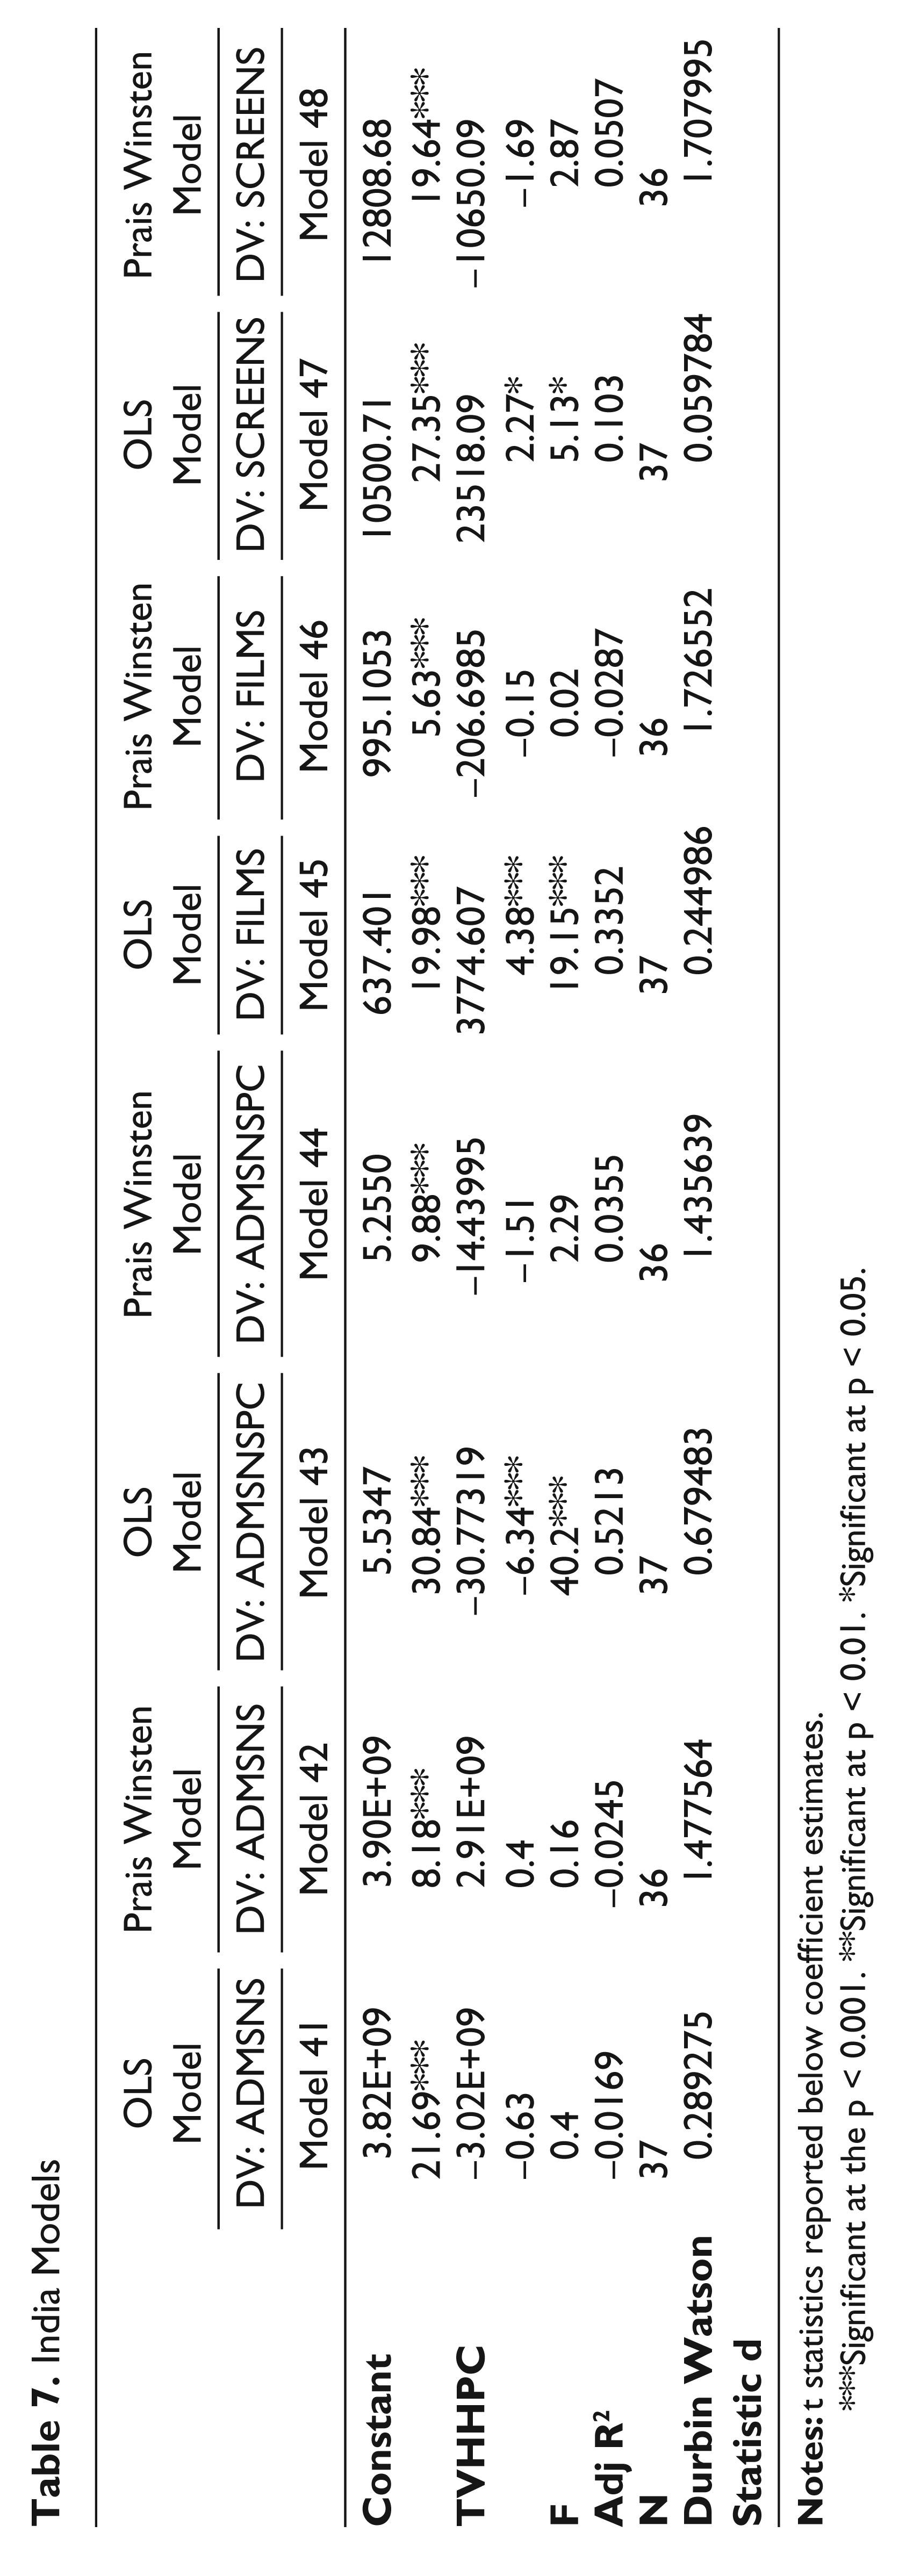
The models used to estimate the effect of television penetration on aggregate admissions as well as admissions per capita showed the inconclusive presence of serial correlation in the data. Television penetration had a negative but non-significant effect on the number of films produced and on the number of screens (see Table 7).
India Models
***Significant at the p < 0.001. **Significant at p < 0.01. *Significant at p < 0.05.
In the foregoing section, individual country models were estimated to examine the effect of television penetration on admissions, number of films and number of screens, to understand differences among the effects of television penetration in six film producing countries. In the following section we examine the differences between India and other countries.
Group Models
To examine the differences between India and other countries, we proceed in two steps. First, panel models are estimated with all six countries. In the next step, India is dropped from the estimation and the panel models are re-estimated without Indian data. This is done to examine the effect of India as an outlier in the group of film producing countries. OLS models are first estimated followed by fixed effect –group effect models and fixed effect –time effect models.
The F test was used to examine if fixed effects models provided a better fit than pooled OLS models. A significant F statistic indicates the presence of the fixed effect, that is, the constant term is different for the different groups (or time periods if it is a fixed time effect model) and thus the fixed effect model fits the data better than the pooled OLS model (the OLS specification uses a single constant term for all groups/time periods). In this study, time effect models are preferred to group effect models because they control for serial correlation between successive years.
Aggregate Admissions
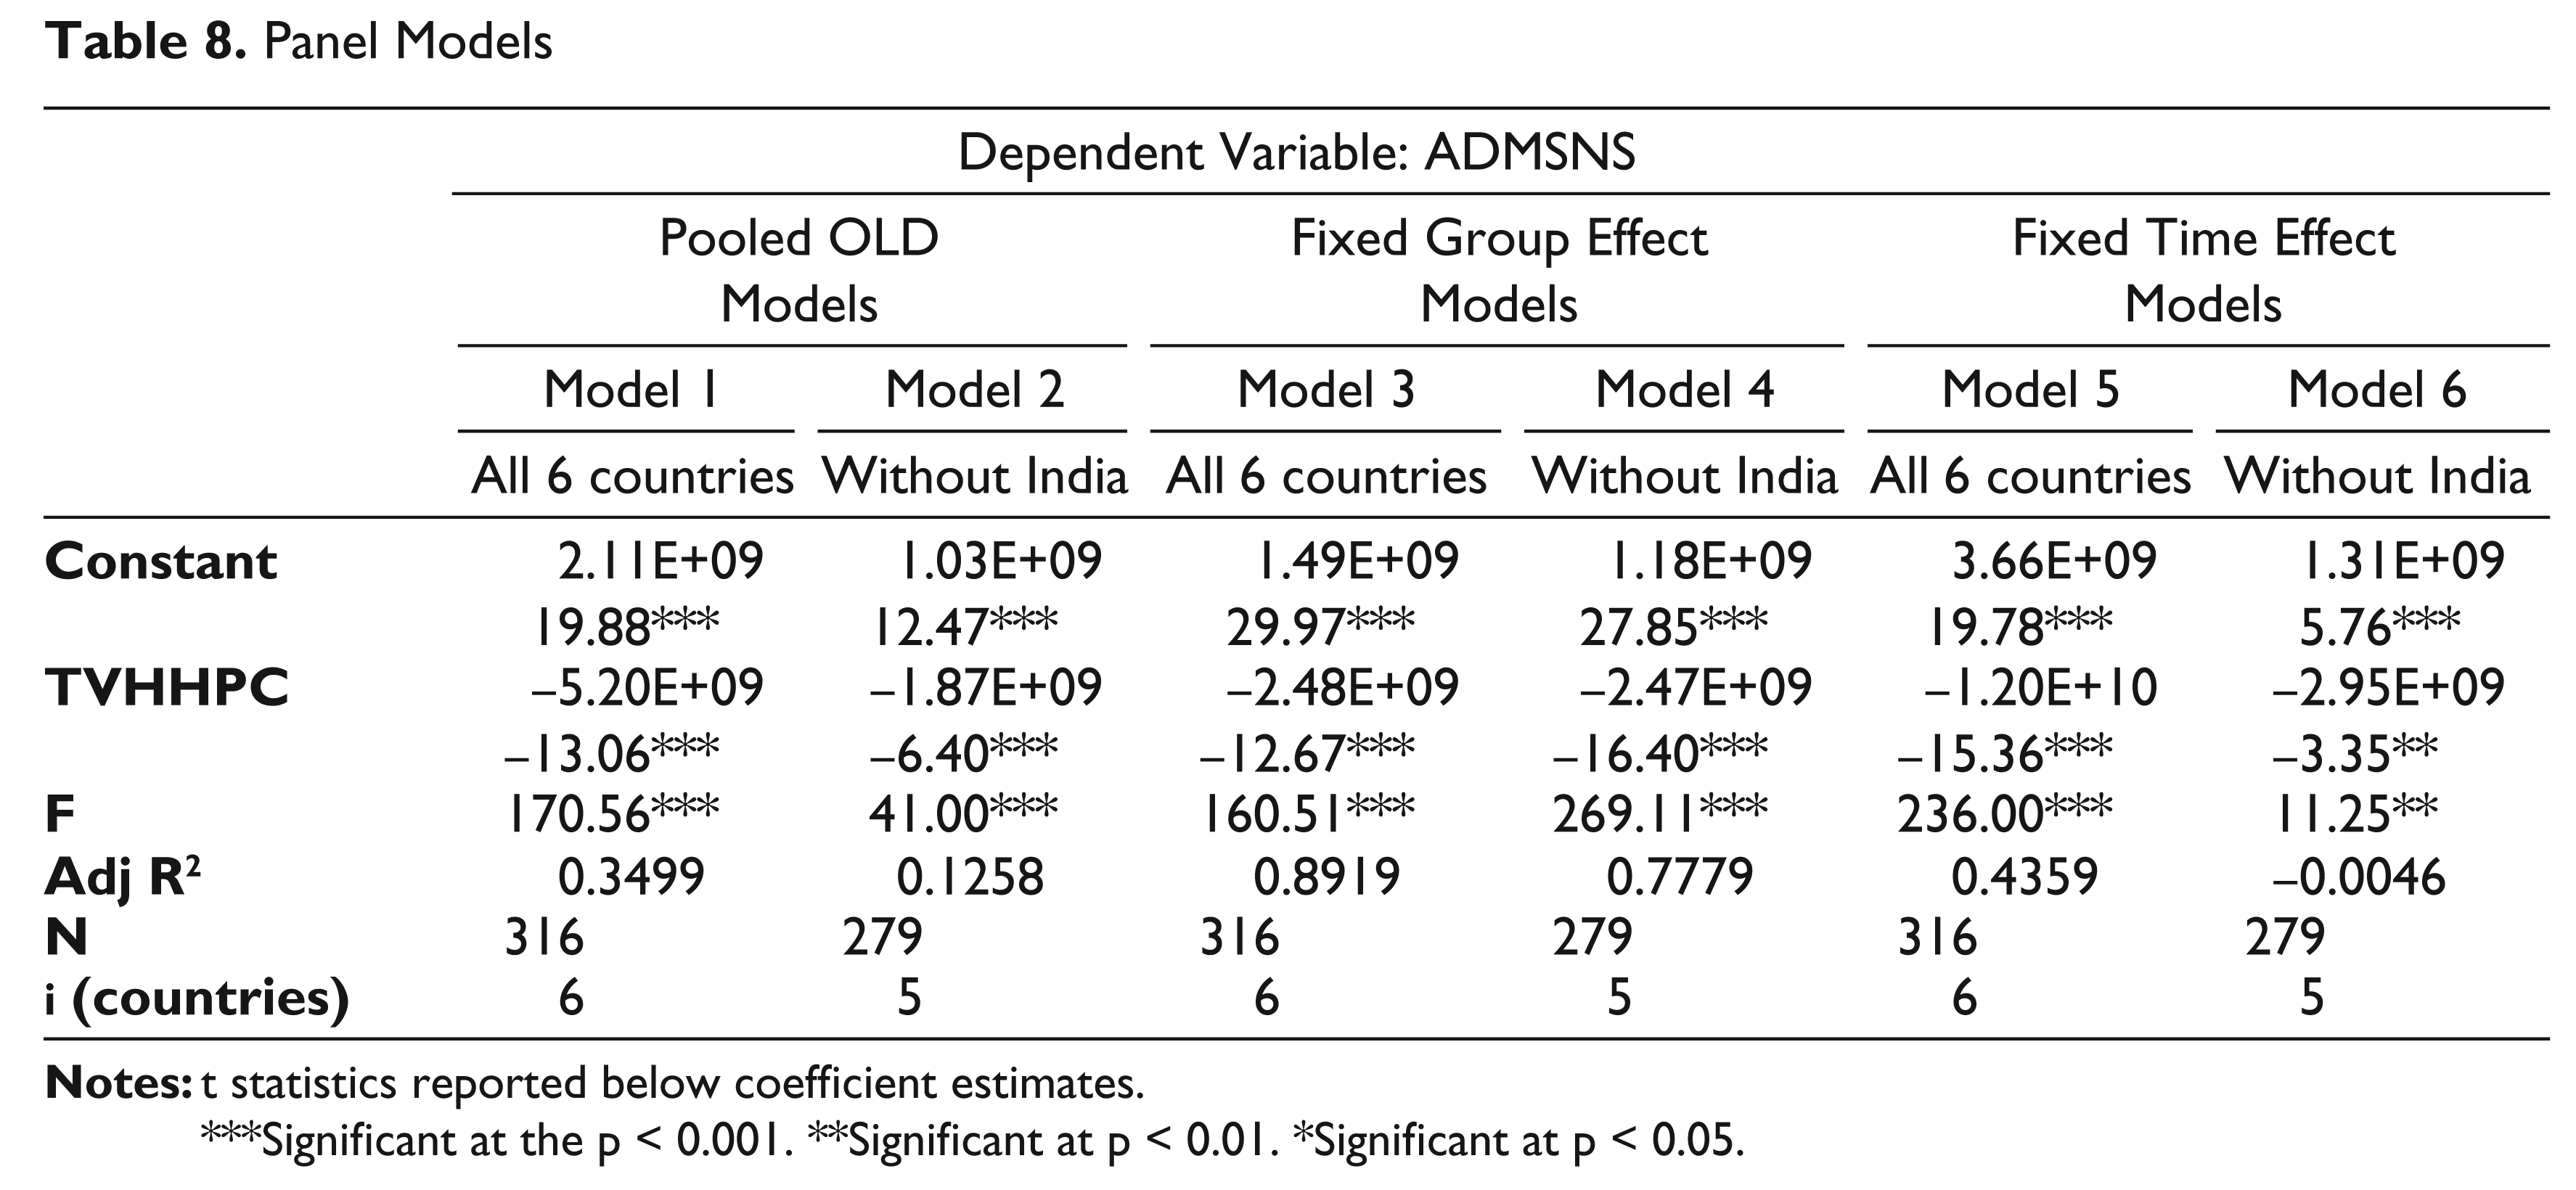
The effect of television penetration on aggregate admissions was first examined. The pooled OLS model which included all six countries was first estimated (Model 1). As predicted, television penetration had a significant negative effect on aggregate admissions in the pooled OLS specification. The model was repeated after dropping India from the estimation with no change in the direction or significance of the effect (Model 2). Fixed (group) effect and fixed (time) effect models were estimated next. As predicted, the negative and significant effect of television penetration on aggregate admissions was observed in all. models (see Table 8).
Panel Models
***Significant at the p < 0.001. **Significant at p < 0.01. *Significant at p < 0.05
The F statistic for the group effect specification was significant both when India was included (Model 3) and when it was excluded (Model 4). The group effect model thus provides a better fit than the pooled OLS model. This indicates there is a difference between the various countries. The fixed time effect model fit the data when India was included. The F statistic was not significant when India was excluded from the model. The pooled model fit the data better when India was excluded from the estimation. All models except model 6 showed the presence of heteroscedasticity. In the presence of heteroscedasticity, the estimator continues to be unbiased, but the variance estimates are no longer efficient, to account for this, White’s robust standard errors are reported.
The regression results show that despite what we see in the graph of aggregate admissions, statistically, India fits the predicted international pattern when it comes to the significant negative effect of television penetration on aggregate admissions.
Admissions Per Capita
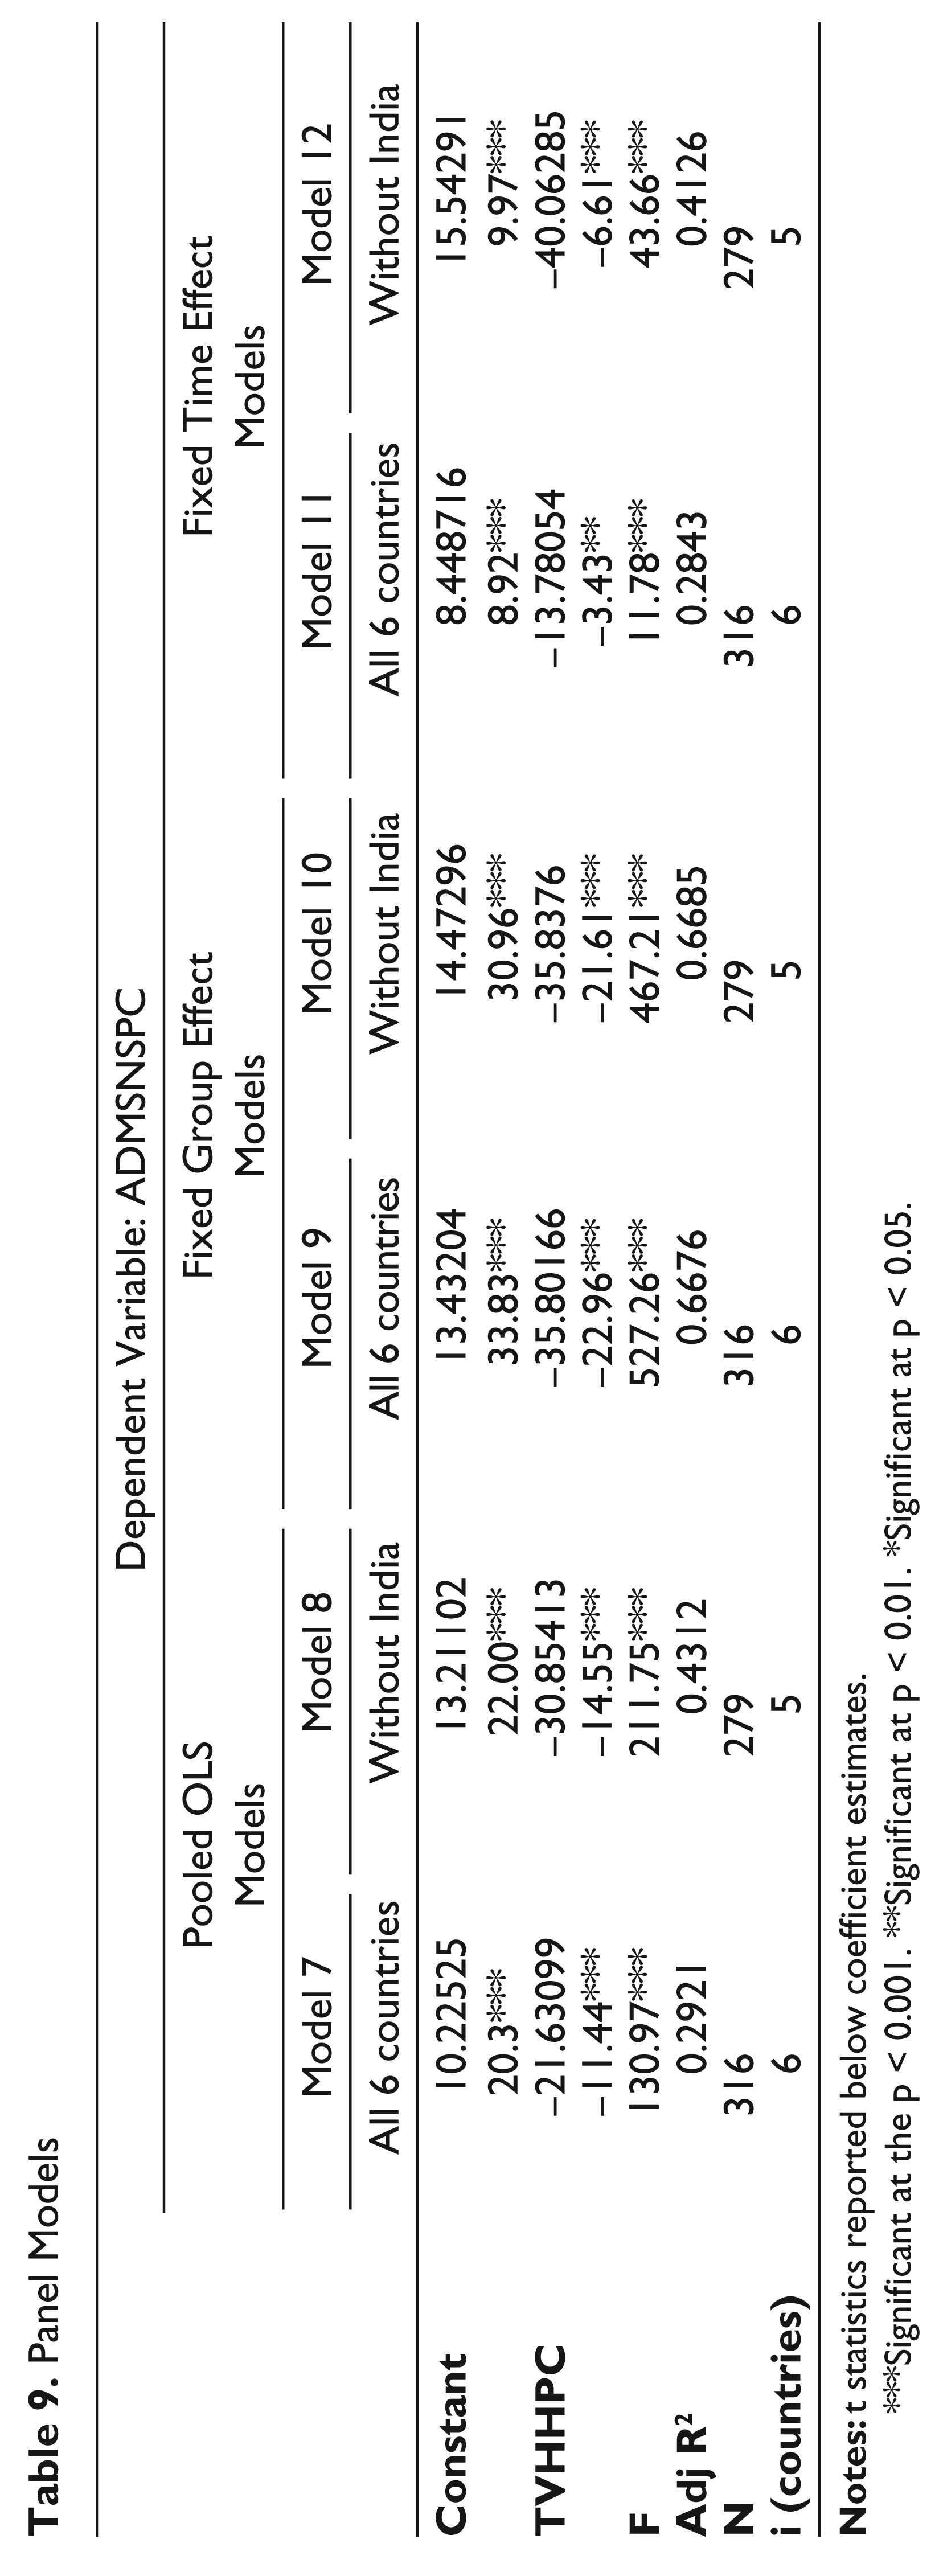
The second measure used for estimation was admissions per capita. As predicted, all six models showed a significant negative effect of television penetration on admissions per capita. The F statistic for both group effect models was significant, showing that the fixed group effect models were a better fit for the data rather than the pooled OLS models. The F statistic for both time effect models was not significant, showing that the pooled OLS models were a better fit for the data than the fixed time effect models (see Table 9).
Panel Models
***Significant at the p < 0.001. **Significant at p < 0.01. *Significant at p < 0.05.
From these models we see that as predicted, per capita admissions declined as more and more households acquired television sets, in India in other film producing countries.
Films
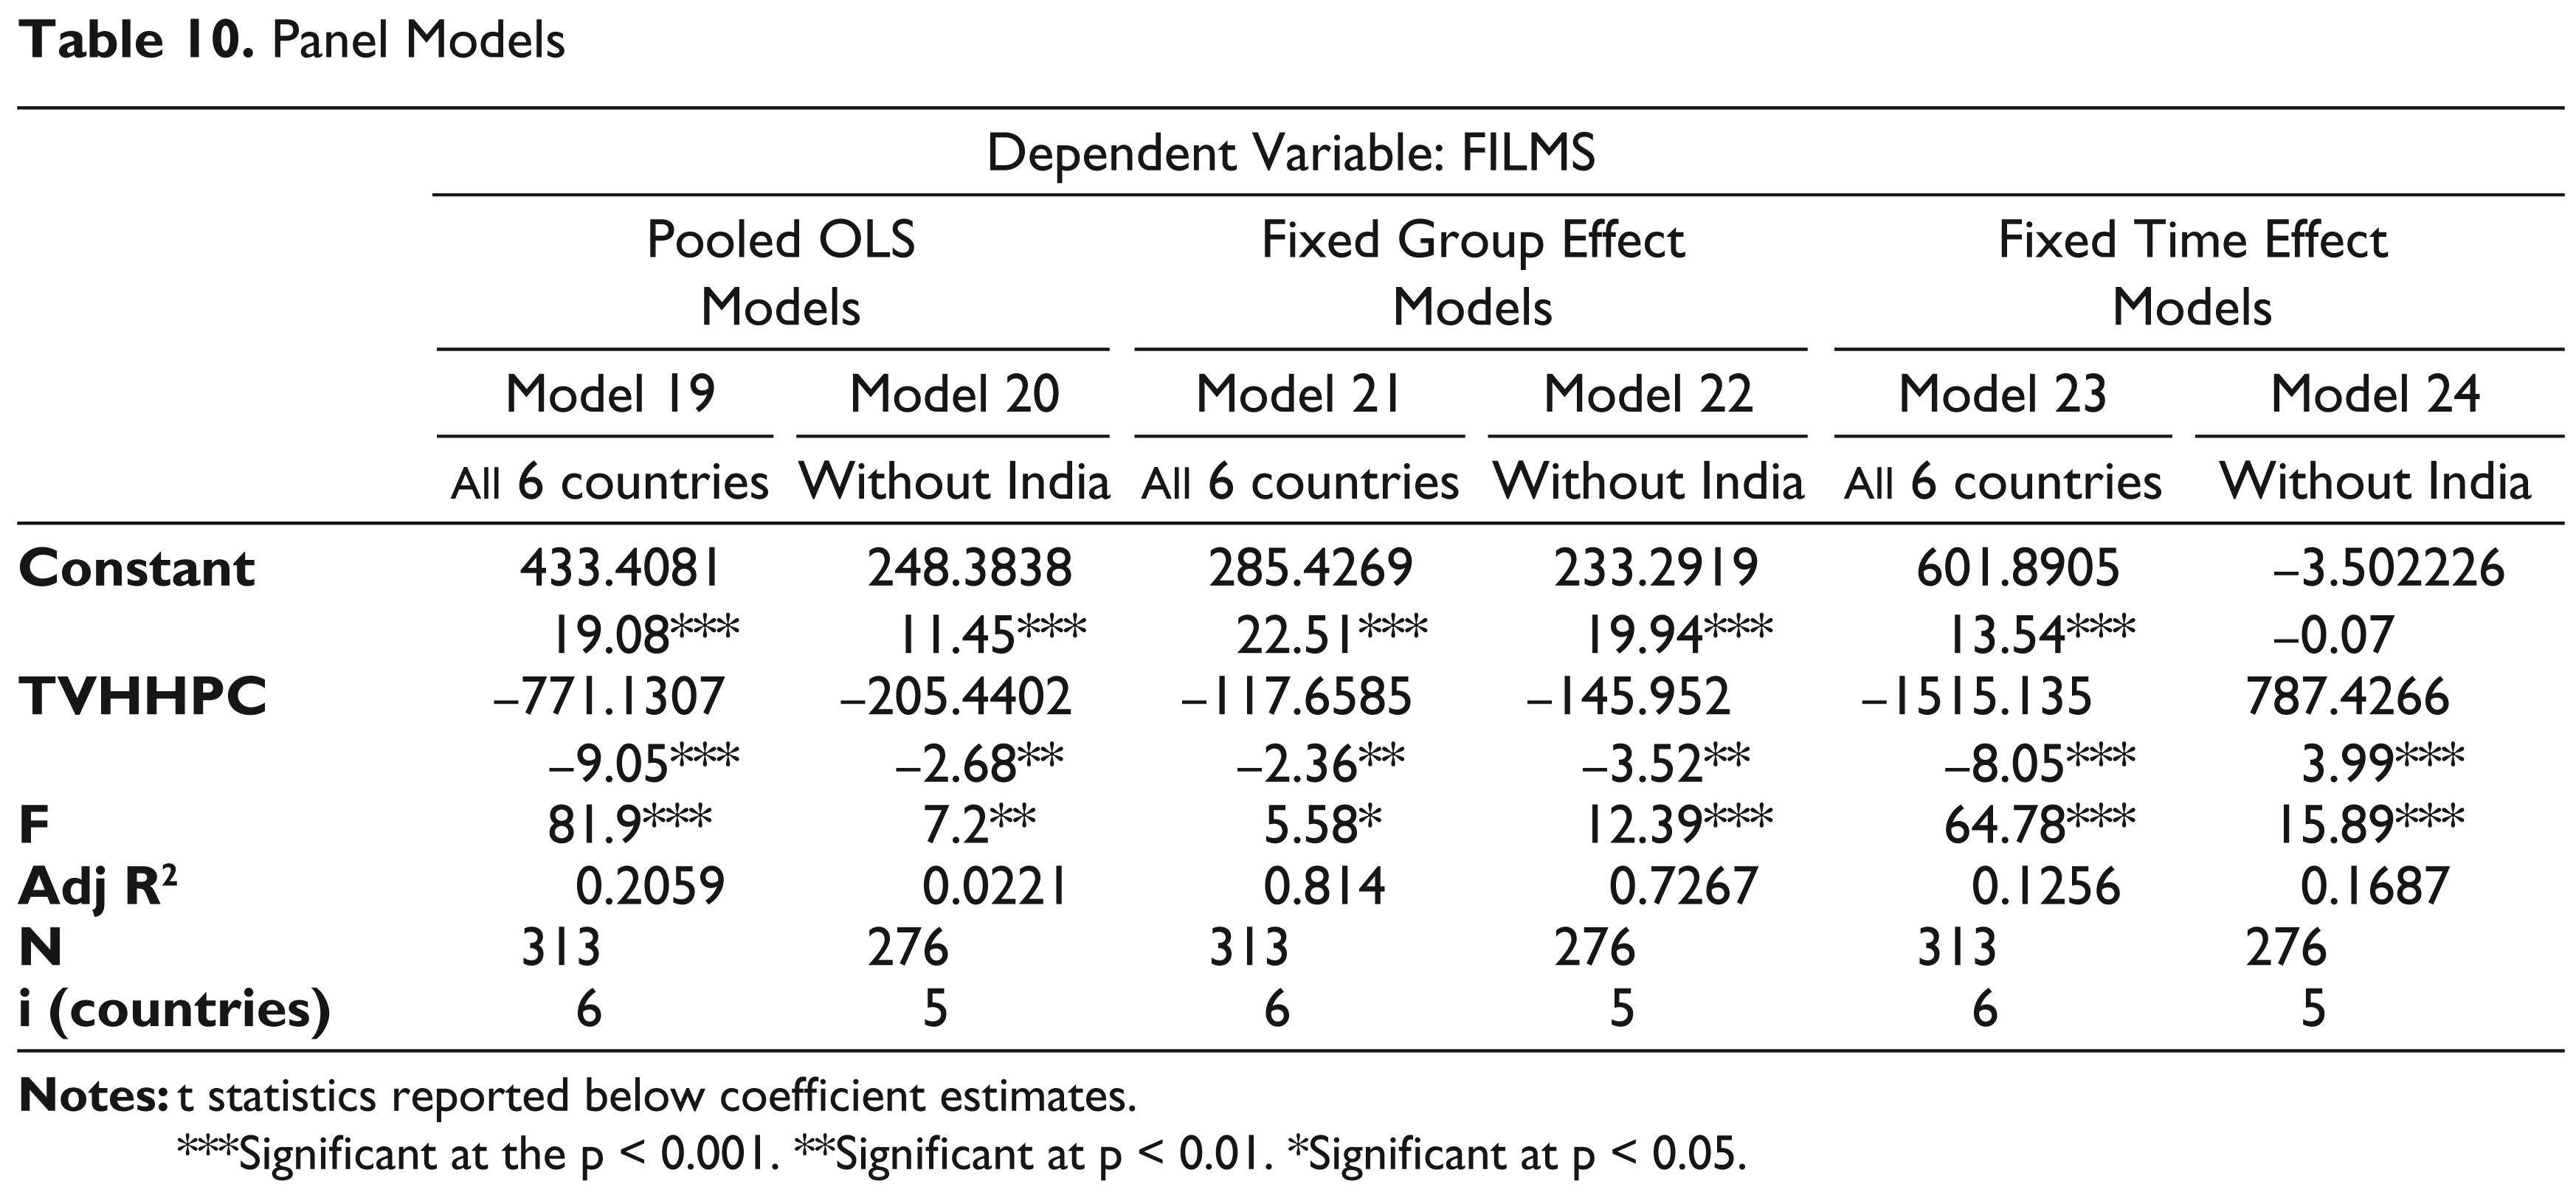
All panel models except the fixed time effect model excluding India showed a significant negative effect of television penetration on the number of films produced as predicted. The fixed time effect model excluding India showed a significant positive effect of television penetration on the number of films. Fixed group effect models provided a better fit than the pooled OLS models as seen from the significant F tests. The fixed time effect model that excluded India was a better fit than the pooled OLS model (see Table 10). Thus India is an outlier when it comes to the effect of television penetration on the number of films produced.
Panel Models
***Significant at the p < 0.001. **Significant at p < 0.01. *Significant at p < 0.05.
Screens
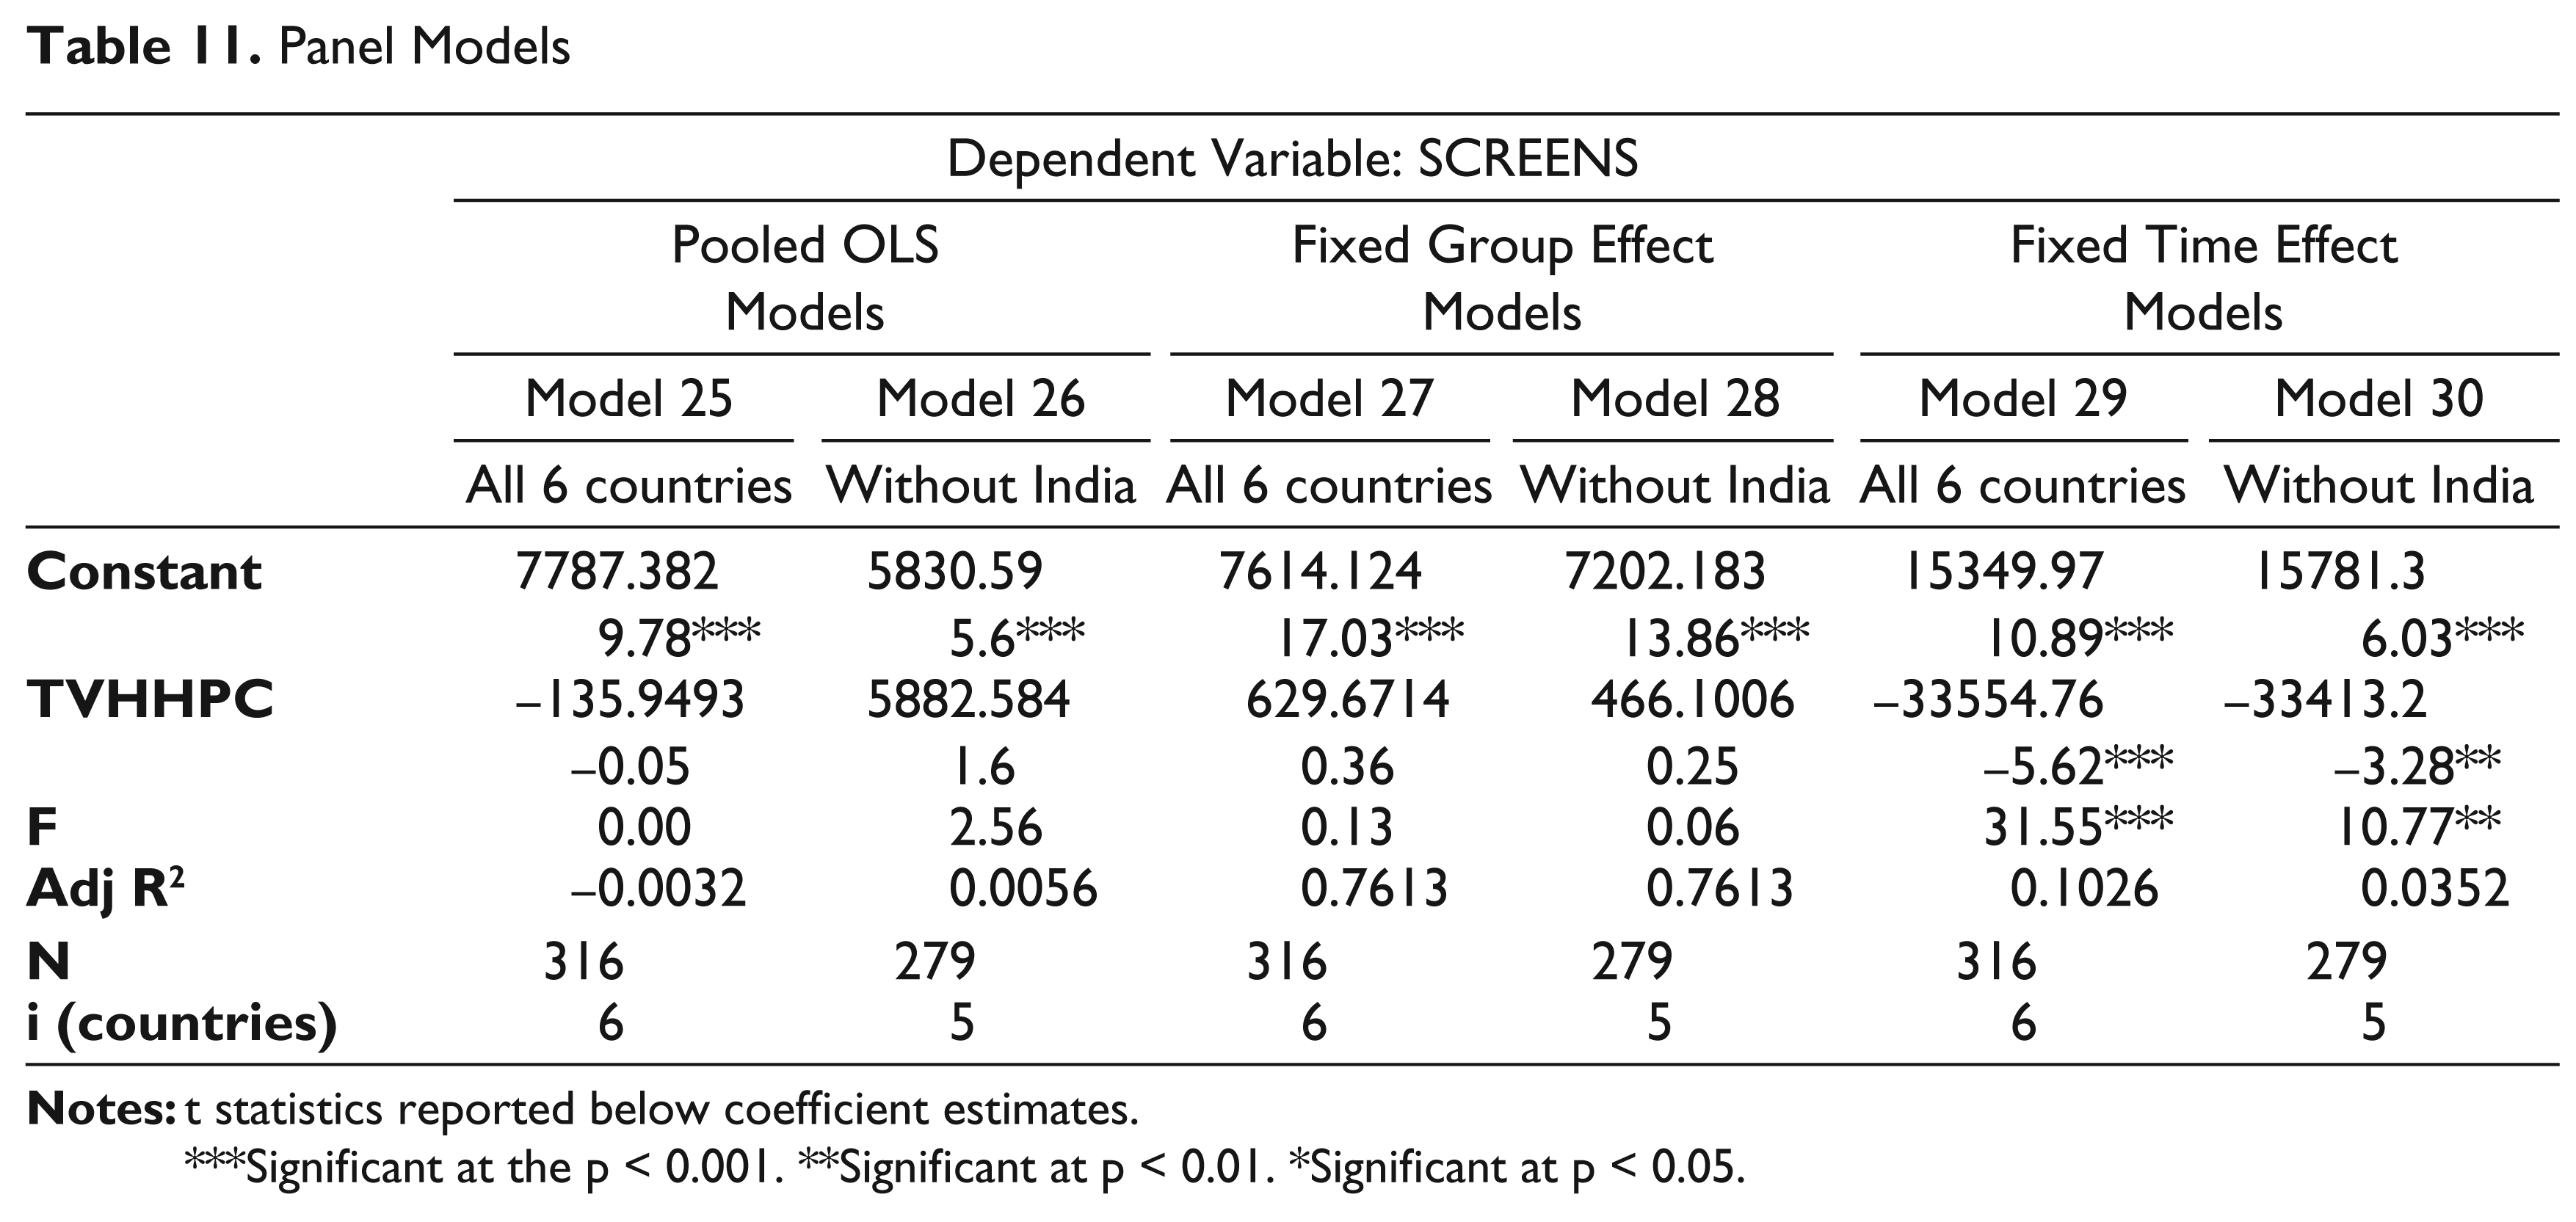
The final measure used was the number of screens. Television penetration had a significant negative effect as predicted on the number of screens in only in the fixed (time) effect models (see Table 11).
Panel Models
***Significant at the p < 0.001. **Significant at p < 0.01. *Significant at p < 0.05.
The F statistic comparing the fixed (time) effect model (including India) and the OLS specification was significant, thus showing that the fixed (time) effect model was a better fit for the data than the OLS specification. The F statistic in the fixed (time) effect model excluding India was not significant, indicating that the pooled OLS model was a better fit than the fixed (time) effect model.
Conclusion
The aim of this article was to examine the patterns in Indian film production and theatrical exhibition after the arrival of television to understand the economic effect of a competing technology such as television on the film industry. These patterns were examined in the context of the top five international box-office markets—USA, Japan, UK, France and Germany. The effect of television penetration on two measures of the annual number of theatrical admissions, aggregate admissions and admissions per capita and two supplementary measures, the annual number of films produced and the number of screens, was examined in the five major film producing countries and India.
Descriptive data show that India’s persistent aggregate admissions appear to be more an artifact of the population size rather than a higher frequency in visits to the theatres. At the aggregate level, the Indian experience seems to be counter to the general trend in other countries, that is, persistent theatrical admissions despite the diffusion of television. However, film admissions per capita are not any higher in India than in other countries. As in other countries, as more Indian households acquired television sets, per capita admissions declined. In this aspect, the Indian experience is quite similar to that of the other countries in this study.
Second, Indian television diffusion is still in the steep part of the famous S shaped diffusion curve. Despite its 112 million television households in 2006, the penetration rate of television in India is only 59 per cent of all Indian households. Similarly, despite aggregate cable television households of 68 million, cable television penetration is limited to 36 per cent of all Indian households. Extending the analysis from Spraos (1962), that relates the rate of decline in theatrical admissions with the stage of television diffusion, to the Indian market, it is possible that the large numbers of Indian households that are lower on the socio-economic ladder and which are not television households yet, are still dependent on the cinema theatres for their audiovisual entertainment, contributing to the persistence of aggregate theatrical admissions and to the large share of film industry revenues from theatrical admissions. In this aspect, the Indian film market shows a clear lag compared to the other countries in this study.
As in the USA and France, television penetration did not have a statistically significant effect on the number of films in India, unlike in the UK and Japan where television penetration had a significant negative effect on films produced. Although television penetration had a negative effect on the number of screens in India the effect was not statistically significant. In the USA, television penetration had a statistically significant negative effect on the number of screens.
Since serial correlation is to be taken into consideration in time series datasets, group-wise regressions were estimated to address this factor. The group-wise econometric analysis results show that despite what we see in the graph of aggregate admissions, statistically, India fits the international pattern when it comes to the significant negative effect of television penetration on aggregate admissions as well as per capita admissions. Group-wise models estimating the effect of television penetration on the number of films produced and the number of screens showed mixed results.
Data used in country-level regression models was found to exhibit a high level of serial correlation which could not be adjusted for despite re-estimation using the Prais-Winsten method. More advanced estimation methods that take into account this serial correlation may help in identifying the country-level effects of television penetration. Linear regression methods were used in the empirical analysis in this chapter. However over a long period of time, the relationships between the variables cannot be expected to remain linear. Non-linear models such as log forms that take this into consideration would perhaps contribute towards a better understanding of the relationship between the variables.
The significant negative effect of television penetration on film admissions in India is a finding that bears consequences for policy-making, especially with regard to issues such as piracy, which affect video revenues. While television and music rights incomes in India have increased in recent years, domestic theatrical collections account for about 74 per cent of the revenues and continue to form the main revenue stream to the Indian film industry. In a one-two punch situation, if fewer people go to the theatres to see films because they have televisions at home and fewer people buy legal DVDs of films, then indirect means, such as television and music rights streams, assume more importance. From the point of view of international media flows, this is a situation that bears watching.
Footnotes
Acknowledgements
This article is based on a chapter of my dissertation submitted to Indiana University in December 2008 and was presented as a paper at the 19th Annual Conference of The Asian Media Information and Communication Centre (AMIC), 21–23 June 2010 at Singapore.