
Abstract
In the context of the recent evidence of a revival of the PDS in certain states, its impact between 2004–2005 and 2011–2012 on the nutritional indicators of children aged 7–19 years was studied by state. This exercise showed that the PDS has had a significant impact on the longer-term nutritional indicator in three of the four functioning states and on the short-term indicator in two reviving states. This indicates that the revival has begun to translate into nutritional gains and catch-up growth of children in some states. Two sets of indicators were used to understand the mechanisms through which these gains were attained. One considered the dependence on the calories provided by PDS commodities; this showed a high dependence on PDS for sufficient intake of calories in functioning states and increasing dependence in certain reviving states. The second indicator was an index of dietary variety. This followed a pattern of higher dietary diversity in beneficiary households in most of the functioning and reviving states. These are encouraging results which offer scope for further reforms.
Before the passage of the National Food Security Act in 2013, one of the major points of debate was the means of delivery: in-kind or cash transfers. The current system relies on various in-kind programmes to ensure food security; one of them is the public distribution system (PDS). The extent to which this programme has an impact on the nutritional and health status of the beneficiaries therefore needs to be studied carefully.
Since its inception during the Second World War, the PDS has undergone many changes. In the early 1990s, there were criticisms of an urban bias and high leakages in the system; the solution was seen to lie in targeting the system to the ‘deserving beneficiaries’ (World Bank, 1996). In 1997, the Government of India therefore shifted from a universal to a targeted PDS. However, although the issue of the urban bias has been addressed, a volume by the Planning Commission (2008) showed leakages to have doubled following the shift to Targeted PDS.
Currently, there is a view to dismantle the system altogether and put in place cash transfers or food coupons (Basu, 2011; Government of India, 2015). The 2015 report of the High Level Committee on Reorienting the Role and Restructuring of the Food Corporation of India headed by Shanta Kumar recommended that cash transfers be used rather than PDS. However, this view does not give sufficient importance to recent studies which provide clear evidence, in terms of primary and secondary data, of a revival of the PDS post-2007 in a number of states following their adoption of PDS reforms.
Khera (2011a, 2011b) showed from primary and secondary data that the PDS is not uniformly or irreparably defunct. The improvements have been attributed to expansion of coverage, reduction of issue prices, technological improvements and other PDS reforms. Himanshu and Sen (2013) noted that the PDS revival continued on to 2011–2012 and additionally, more states such as Bihar, Assam and West Bengal had implemented PDS reforms by then. They estimated that a shift to cash transfers would cost many times more than the current Minimum Support Price-Public Distribution System to maintain the same levels of calorie intake. Drèze and Khera (2015) found that, although leakages were still unacceptably high, there were signs of a reduction in leakages between 2004–2005 and 2011–2012, particularly in the states that had undertaken reforms.
Most studies of the impact of PDS on nutrition have considered the effect in terms of intake of nutrients (Kaul, 2014; Kaushal & Muchomba, 2015; Kochar, 2005). There have been fewer studies of the impact on child anthropometry. Tarozzi (2005) concluded from the 1992–1993 (National Family Health Survey data that the PDS had a limited impact on child anthropometric indicators in Andhra Pradesh. The 2011–2012 dataset of the India Human Development Survey (IHDS) provides more recent data on the usage of PDS as well as anthropometry. Using the national-level sample, Desai and Vanneman (2015) did not find any impact on the anthropometry of children aged below five years. In this article, I consider children in the 7–19 age group and study the impact of PDS on their anthropometric indicators at the state level.
A further objective is to understand whether there is potential for catch-up growth. One of the hypotheses related to child nutrition is that malnutrition in the first two or three years of age would irreversibly put the child in a lower growth trajectory with lower potential for future growth (Golden, 1994). An alternative hypothesis is that changes in the environment or diet can enable the child to fully compensate for the nutritional deficiencies of the past and result in catch-up growth (Golden, 1994). This article studies whether the PDS has aided such catch-up growth and if so, the mechanisms through which such benefits were attained.
The results show that the PDS has had an impact on the longer-term nutritional indicator in states where it has been functioning well for many years, and on the short-term indicator in certain reviving states. This indicates that the PDS has had a role in aiding catch-up growth in these states. To understand the mechanism through which these nutritional benefits were attained, the role of the system in ensuring sufficient intake of calories was considered; this showed a high dependence on the PDS for the same in functioning states and an increasing dependence in some reviving states. The indexes of dietary diversity were also higher in beneficiary households as compared to non-beneficiary households in most of the functioning and reviving states.
Data and Methodology
To understand the changes in the functioning of PDS, the proportions of households purchasing PDS cereals and the monthly quantities purchased were studied by state between 2004–2005 and 2011–2012. These indicators were calculated using the previous three thick rounds of the National Sample Survey (NSS) consumption expenditure survey data. In addition, the proportion of undernourished population by the original calorie norms and the reduction in this proportion due to the PDS were calculated in each state.
To study the impact of PDS on final outcomes of child nutritional status, IHDS data of 2011–2012 was used. Height-for-age and weight-for-age z-scores are the nutritional outcomes studied here. Height is considered to be a longer-run indicator of nutritional status while weight is a more short-run indicator. The extent to which the IHDS surveys are representative at the state level is limited. However, the state-level results could be indicative of the relative performance and impact of the system in different states.
Propensity score matching (PSM) was applied to the data to conduct the analysis. PSM constructs a suitable comparison group on the basis of the probability of participation in the programme. Beneficiaries are matched to non-beneficiaries on the basis of their propensity scores. Non-beneficiaries who are as similar as possible to the beneficiaries in terms of observed characteristics are identified. The impact of the programme is the mean difference in the outcomes between the two groups. The estimates reported in this article are from nearest neighbour matching with replacement.
An additional objective was to study whether PDS aids catch-up growth. For this, the panel data feature of IHDS was used. The z-scores of the same children were calculated in the 2004–2005 IHDS dateaset so as to account for their health in the earlier time period. The z-scores of the 0–12 age group in the 2004–2005 data set were linked to the data files of the 7–19 age group in the 2011–2012 data set, and then used as a control variable in the functional form. Another control variable used was the wealth index of the household. This was calculated using principal component analysis as with the Demographic and Health Surveys (Rutstein & Johnson, 2004). Besides including variables on asset ownership and building materials of the house, the wealth index also includes variables on drinking water source and sanitation facilities, which are important determinants of child nutrition.
To understand the results, two sets of indicators were used. One considered the role of the system in reducing undernourishment by calorie norms as well as the additional calories contributed by the PDS as a percentage of total calories consumed; these were calculated for each state using NSS data. The second was an index of dietary variety as used by Desai and Vanneman (2015). This is the sum of food groups consumed by the household out of a total of six: cereals, other grains, pulses, fruits and nuts, vegetables, and milk. This index was calculated for each household from IHDS data. The average index was compared for treated and control groups in the samples before and after the matching exercise to check for any patterns in the dietary diversity of PDS beneficiary and non-beneficiary households.
Analysis
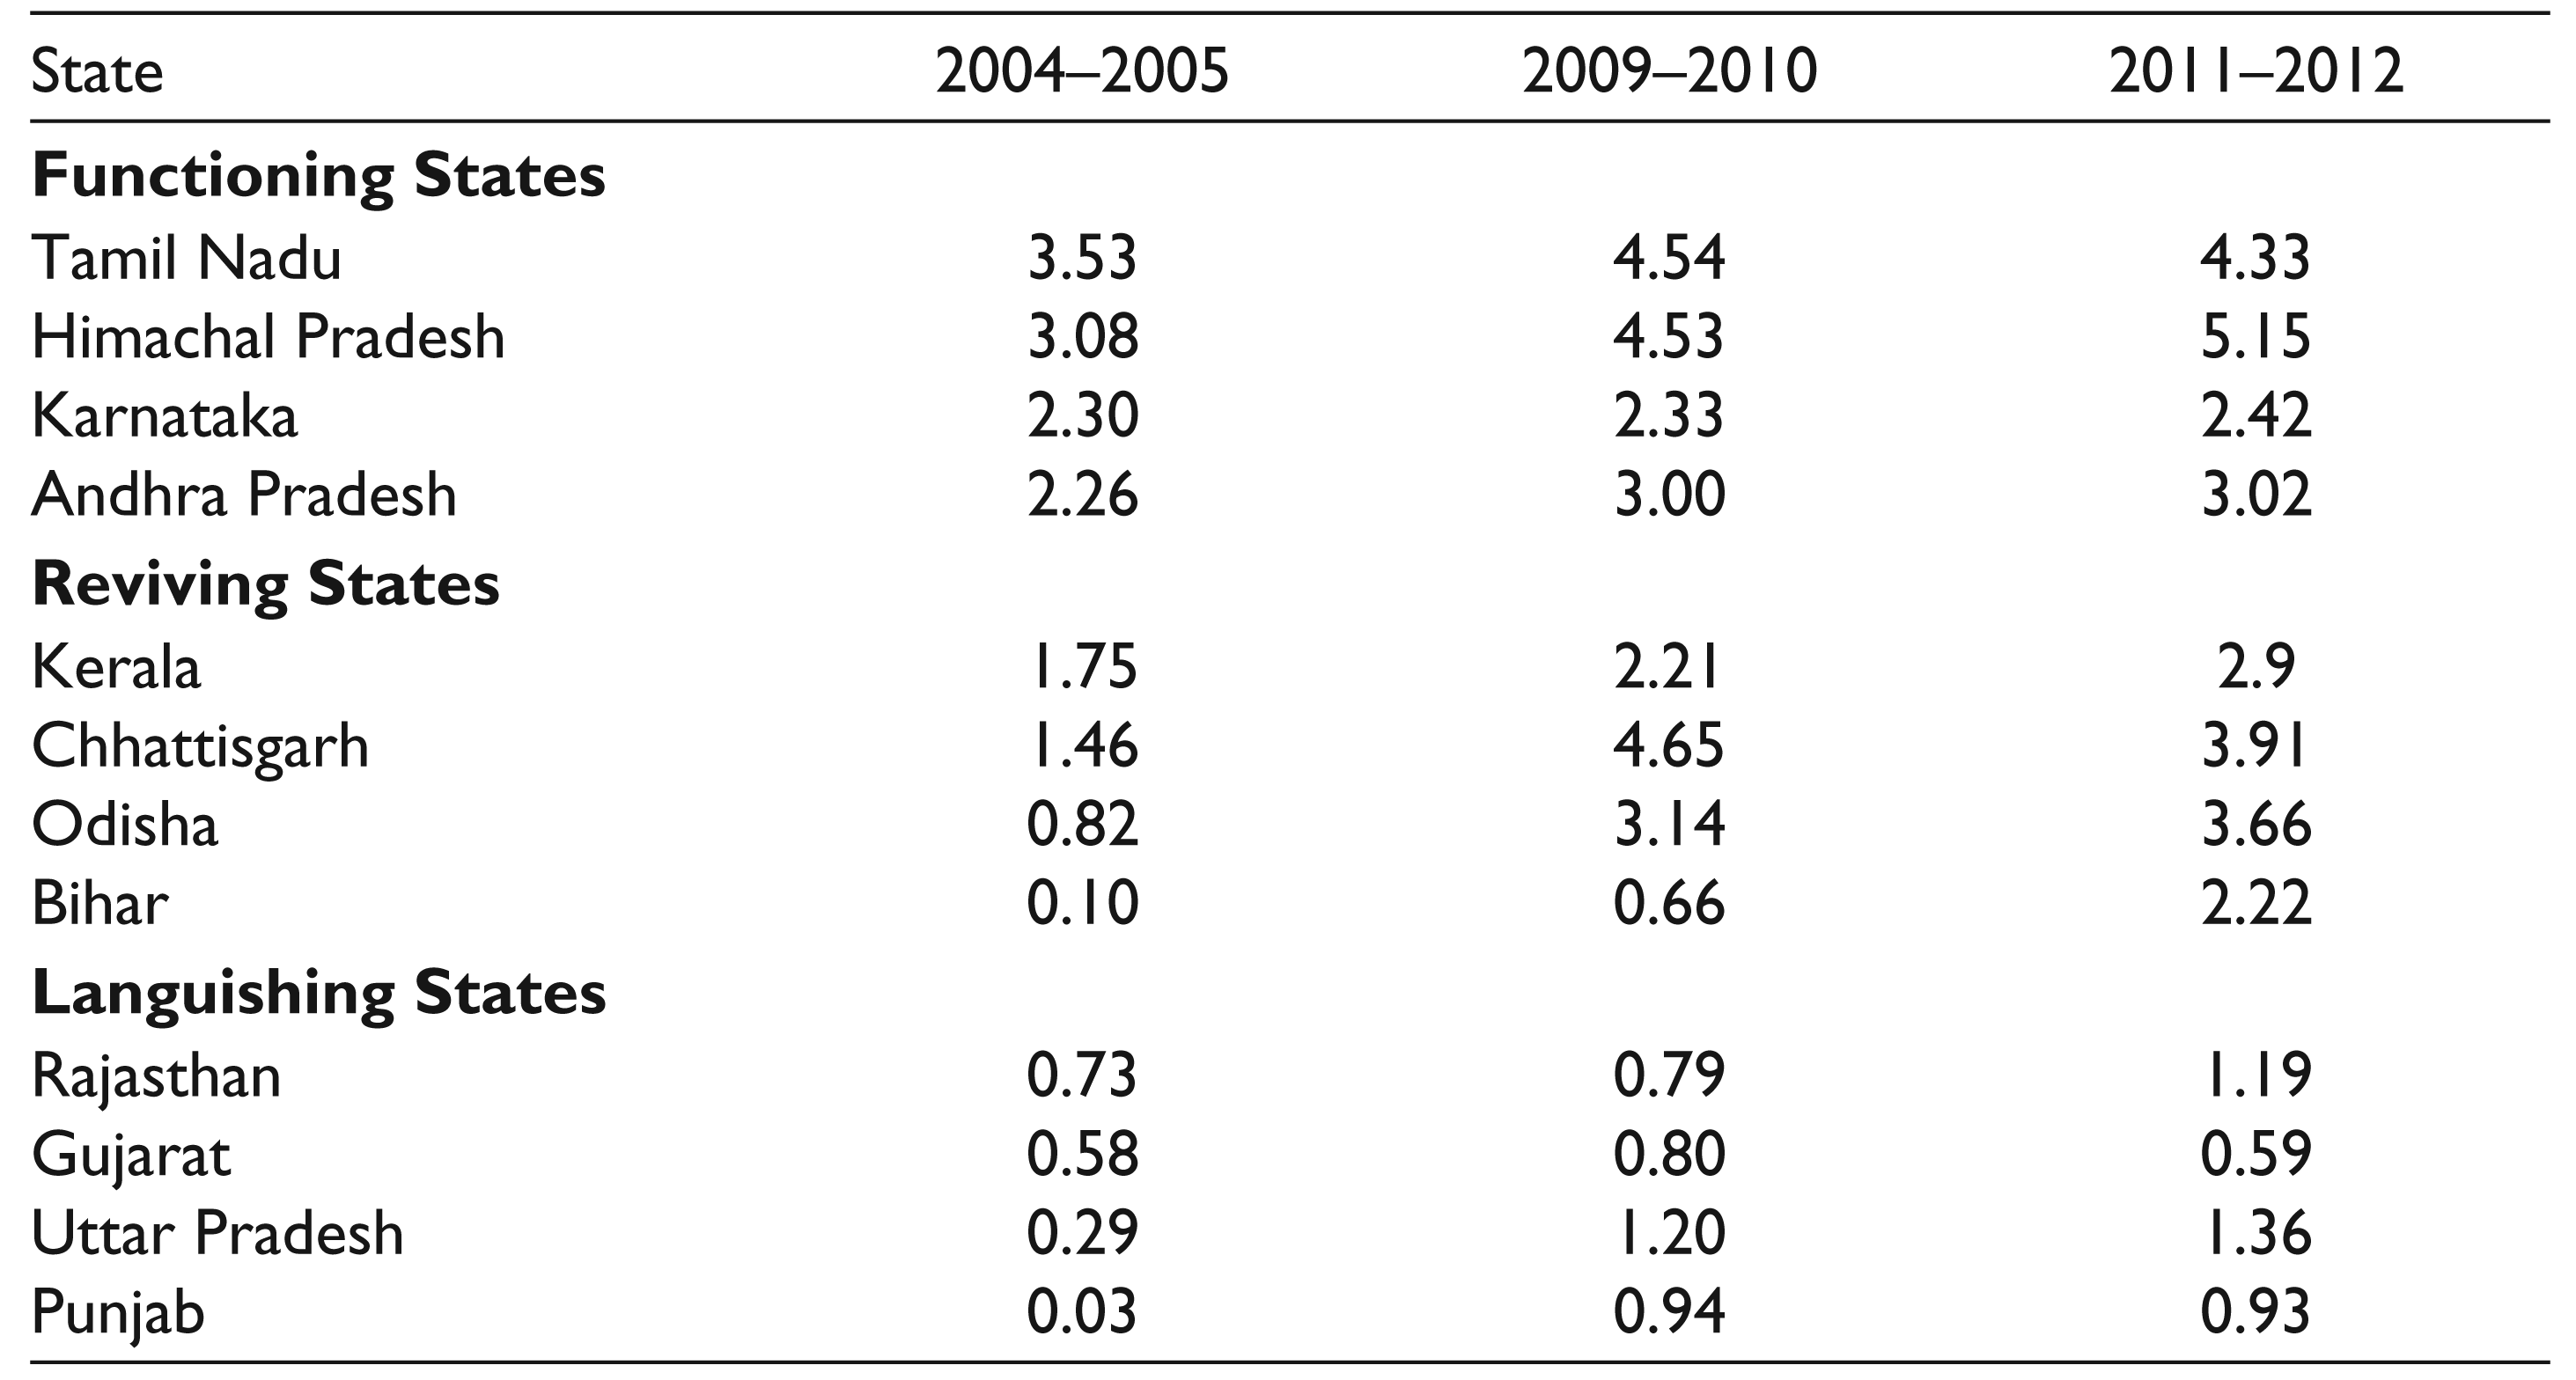
To begin with, indicators relating to the state-level functioning of the system between 2004–2005 and 2011–2012 were studied. Table 1 shows the average monthly per capita purchase of rice and wheat from the PDS in each state. Khera (2011a) classified states into functioning, languishing and reviving states on the basis of their monthly per capita purchases of rice and wheat separately. Modifying her classification to include the total purchase of PDS cereals, I used a monthly benchmark of 2 kg per capita. The states in which the monthly purchases exceed 2 kg per capita in all three rounds are the functioning states, those in which the purchases increased to 2 kg per capita are reviving states and the others are the languishing states. By this classification, the functioning states are Tamil Nadu, Himachal Pradesh, Karnataka and Andhra Pradesh. The states which revived by 2009 in terms of per capita purchase of PDS cereals are Kerala, Chhattisgarh and Odisha; Bihar joined this list by 2011. Of the languishing states, four have been considered here due to their relatively larger sample sizes: these are Rajasthan, Gujarat, Uttar Pradesh and Punjab.
Average Monthly per Capita Purchase of Cereals from PDS (kg)
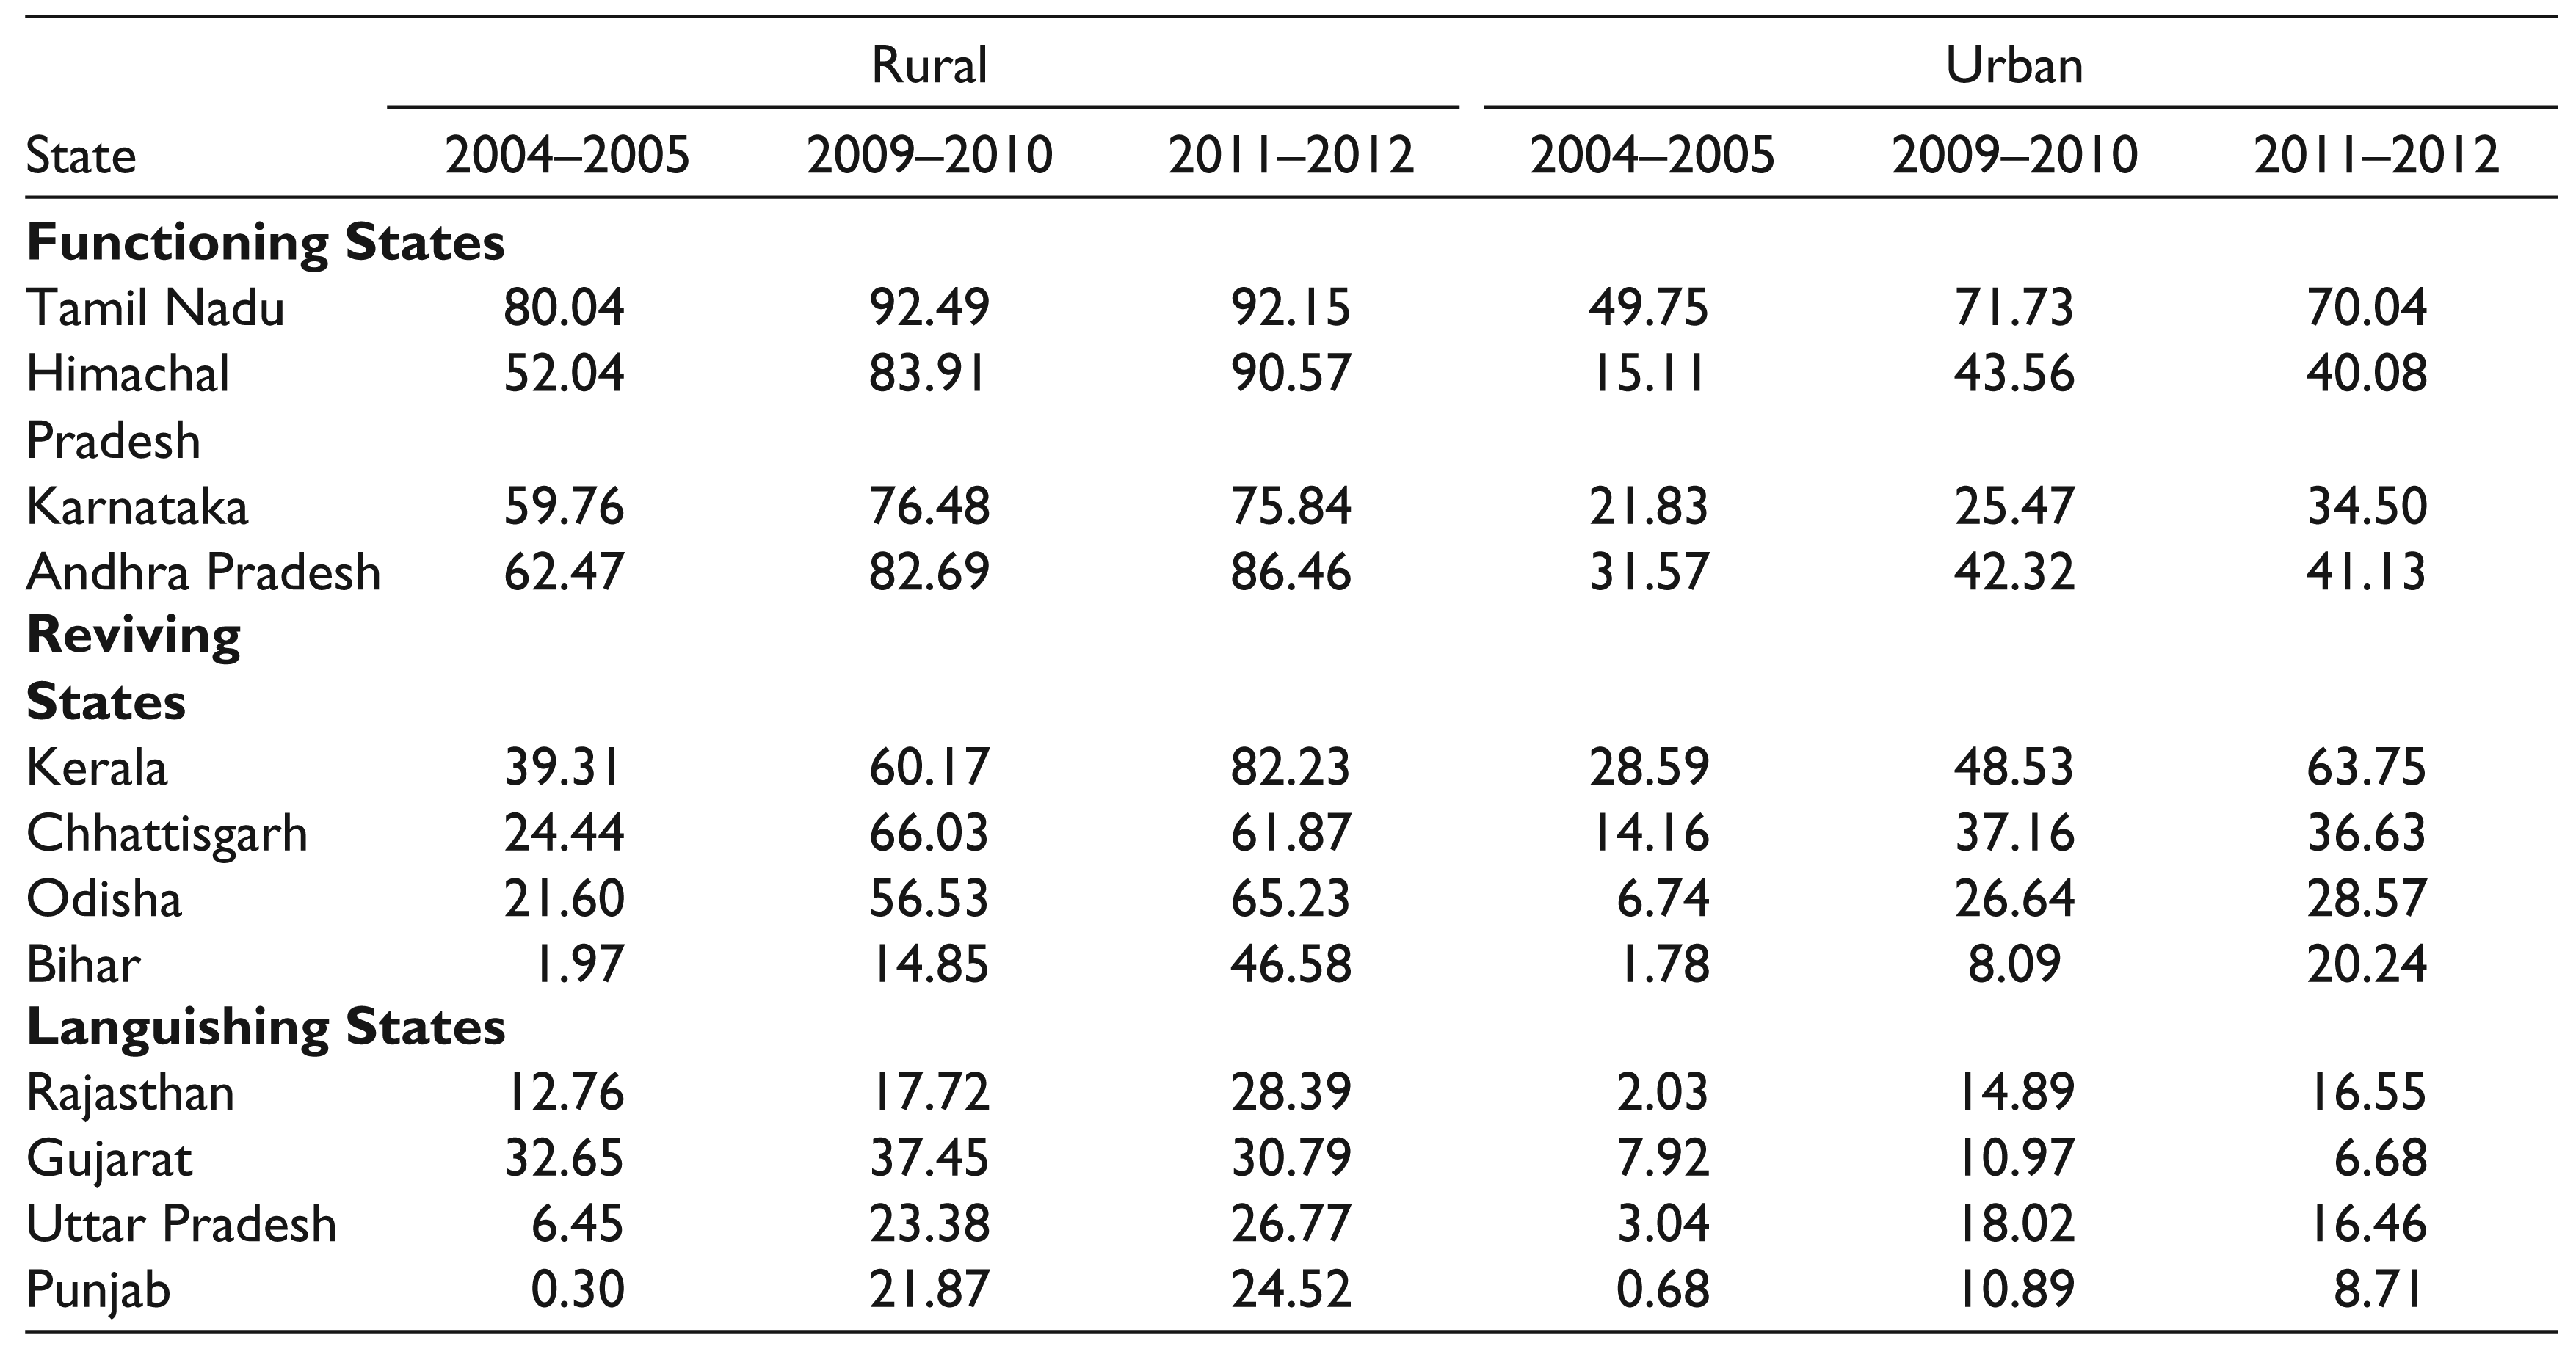
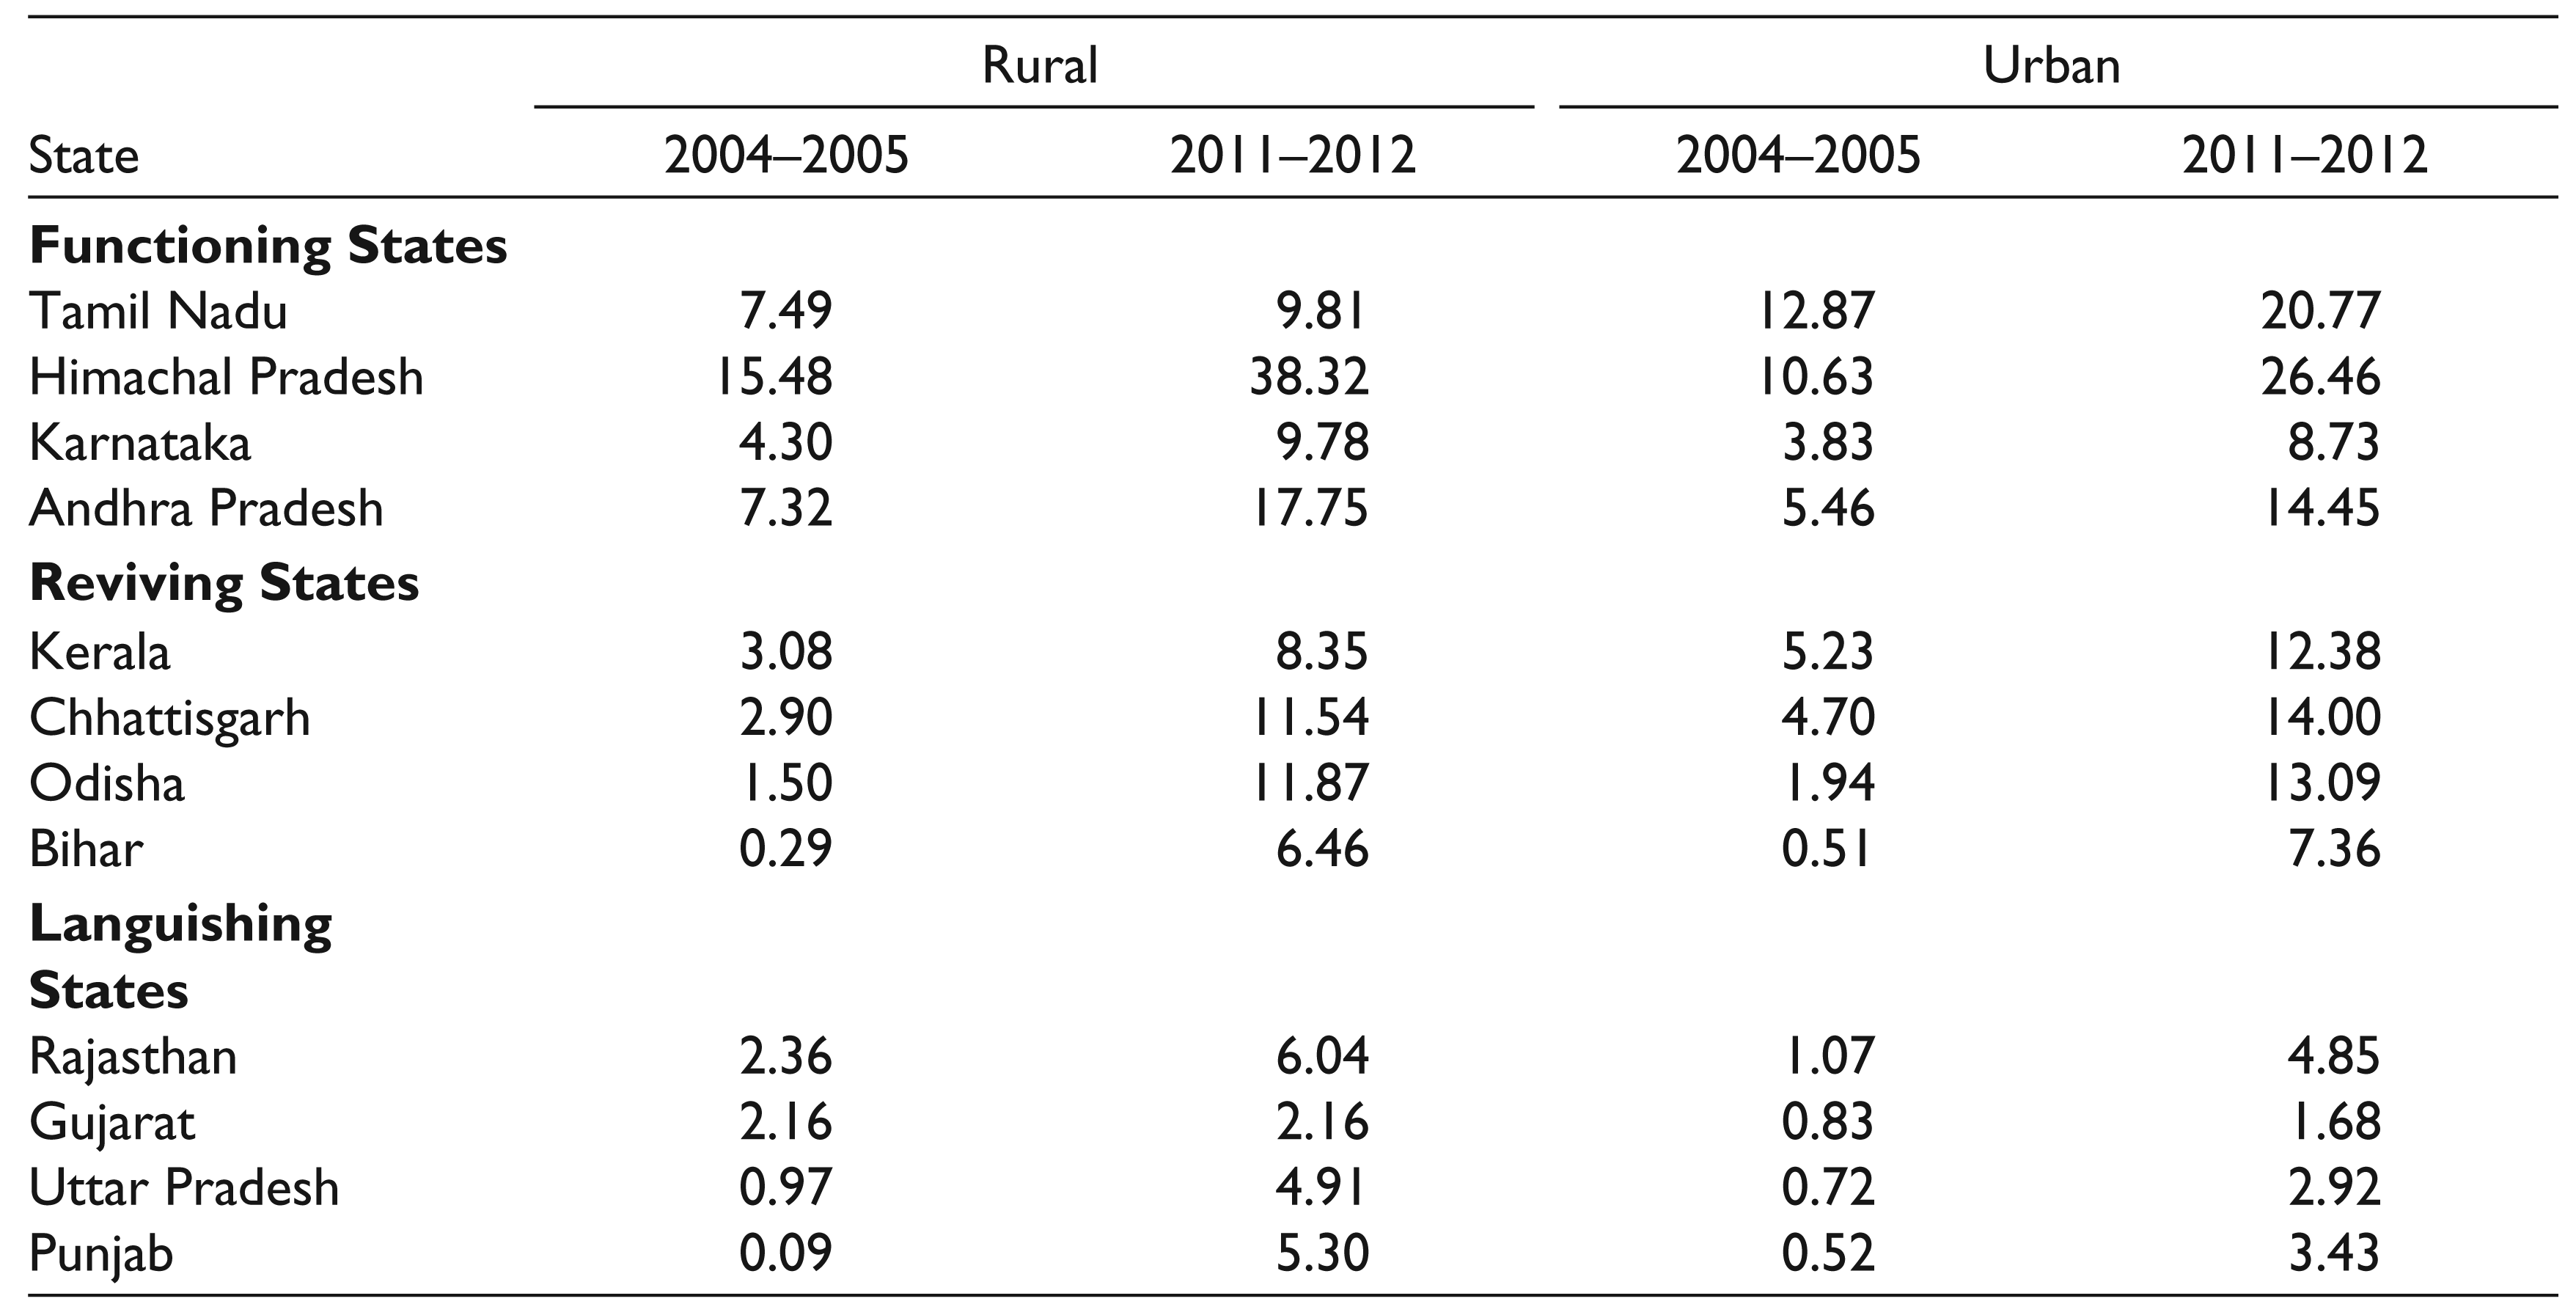
In Table 2, the percentages of households which purchased rice or wheat from the PDS in these states are given by sector. This table shows that in the functioning states, the utilization of the PDS for cereals in rural areas increased even more after 2004–2005 so that by 2009–2010, it was near-universal in the rural areas of Himachal Pradesh, Andhra Pradesh and Karnataka. In Tamil Nadu, the PDS was universal from 2006. The PDS in Kerala, which was upheld as a model in the 1990s, suffered from the shift to targeted PDS (Swaminathan, 2009); this is reflected in the percentage of utilization in 2004–2005. Nevertheless, by 2009–2010, Kerala recovered from the policy shift and the extent of utilization increased further by 2011–2012. The reviving states of Chhattisgarh and Odisha recorded notable increases in these figures over this period. Between 2009–2010 and 2011–2012, Bihar also recorded a significant increase in the proportion of households purchasing cereals from the PDS in rural areas. The languishing states had very low rates of utilization throughout this period.
The last three columns of Table 2 show the corresponding figures for urban areas. Tamil Nadu is the only state that recorded high rates of utilization in urban areas in all three rounds. Kerala, Himachal Pradesh, Andhra Pradesh and Chhattisgarh were other relatively well-performing states in urban areas by 2009–2010. The states which recorded low rates of utilization in rural areas did so in urban areas as well.
The improvements in the reach and functioning of the PDS in terms of reduction in poverty have been noted in the earlier literature (Drèze & Khera, 2013; Himanshu & Sen, 2013). However, a divergence between the trends in poverty and those in nutritional indicators has been observed. Between 2000 and 2005, a period of rapid economic growth, there has been a decrease in poverty by the official poverty lines, while there has been a decline in average per capita calorie intake and stagnation in the proportion of under-five underweight children at the all-India level (Deaton & Drèze, 2009). The divergence between the poverty and nutritional trends makes it of interest to study whether there is also a divergence in terms of the impact of the PDS on these parameters. In addition, as this is a food subsidy programme, an analysis of its functioning would be incomplete without a corresponding study of its nutritional impact.
Proportions of Households Purchasing PDS Cereals (%)
Anthropometric Indicators
Using the framework in Singh, Park and Dercon (2014), who followed Senauer and Garcia (1991), Behrman and Deolalikar (1988) and Behrman and Hoddinott (2005), child health is considered to be of intrinsic value to the overall welfare of the household. The health of child i in time t is given by the health production function Hit,

where Fit is the food consumption of child i in period t, Ci refers to the time-invariant observable characteristics of the household to which child i belongs, Zit refers to time-variant observable characteristics such as economic shocks, Hit-1 is the health of child i in period t − 1 and Uit refers to the unobserved characteristics of child i in time t.
The nutritional outcomes are the height-for-age z-scores and weight-for-age z-scores of children in the 7–19 age group. The impact of the PDS on child nutrition was estimated through the following equation,

Here, Hi2 is the outcome variable and refers to the anthropometric z-score of the child in 2011–2012. PDSi2 is the treatment variable, which takes the value of 1 if the household to which the child belongs purchased rice or wheat from the PDS in 2011–2012, and 0 otherwise. Hi1 refers to the anthropometric z-score of the child in 2004–2005, to account for the earlier health status of the child and captures the role of PDS reforms in aiding catch-up growth in each state. Ci refers to other control variables, such as rural/urban location, the total income and wealth index of the household in 2011–2012, sex, age and age squared of the child, nutritional status and years of education of his/her mother, social and religious group, household size as well as literacy status of the household head.
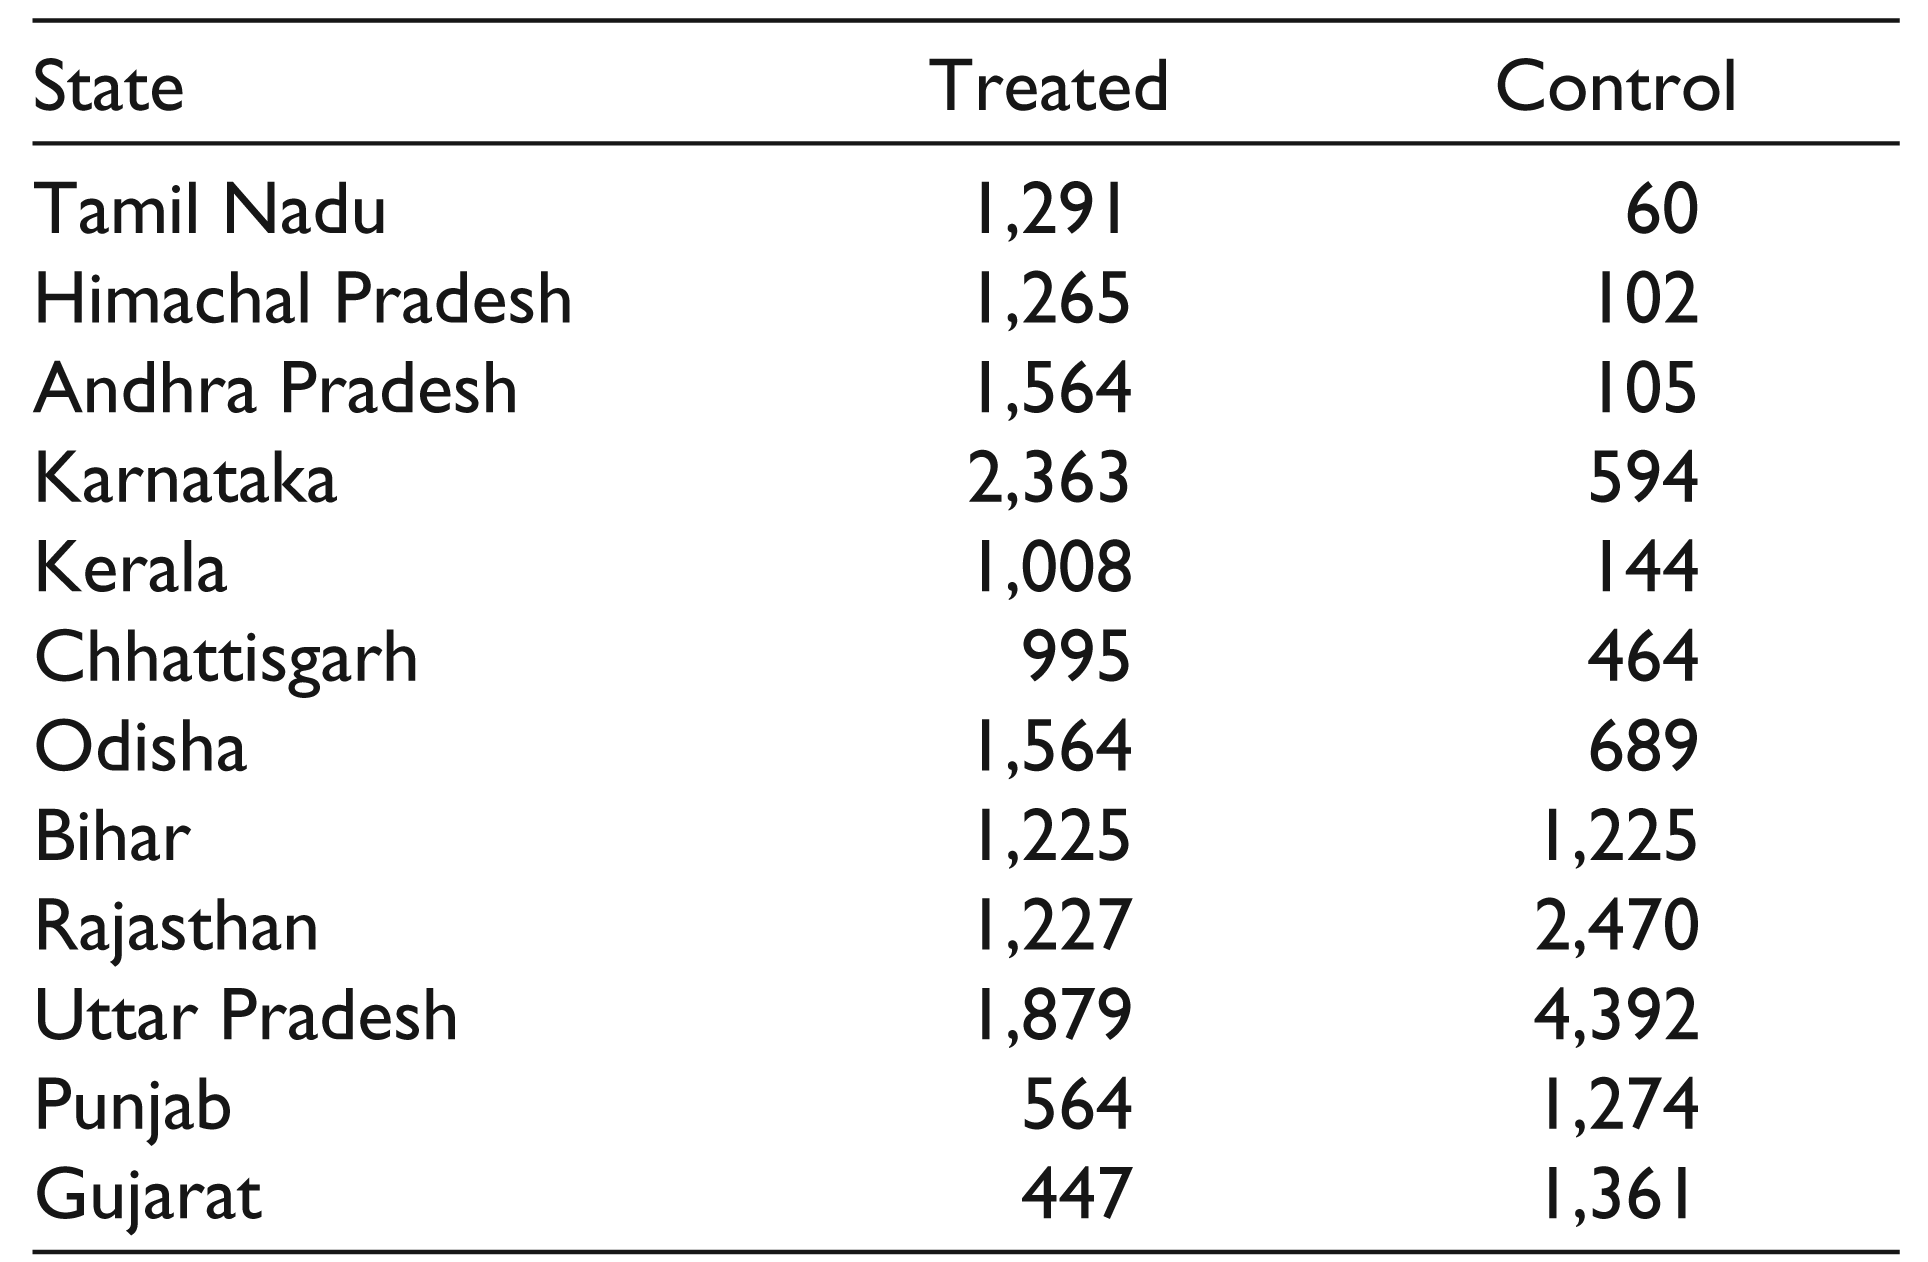
The set of beneficiary children belonged to households which purchased PDS cereals in 2011–2012; these were compared to non-beneficiary children who were as similar as possible according to the PSM exercise. Table A1 in the Appendix gives the sample sizes of the state samples. The sample sizes are quite small for certain states; this may affect the quality of matching and the results. This is an important limitation of this analysis. Another limitation is with the method used, which assumes that there are no unobserved differences between the treated and control groups which affect the outcomes. The time-invariant unobserved factors would be accounted for in Hi1, the nutritional status of the child in 2004–2005. However, any time-variant unobserved factors are not accounted for in this analysis. Keeping in mind these limitations, the Average Treatment Effects on the Treated (ATT) were calculated; the results of this exercise are given in Tables 3, 4 and 5.
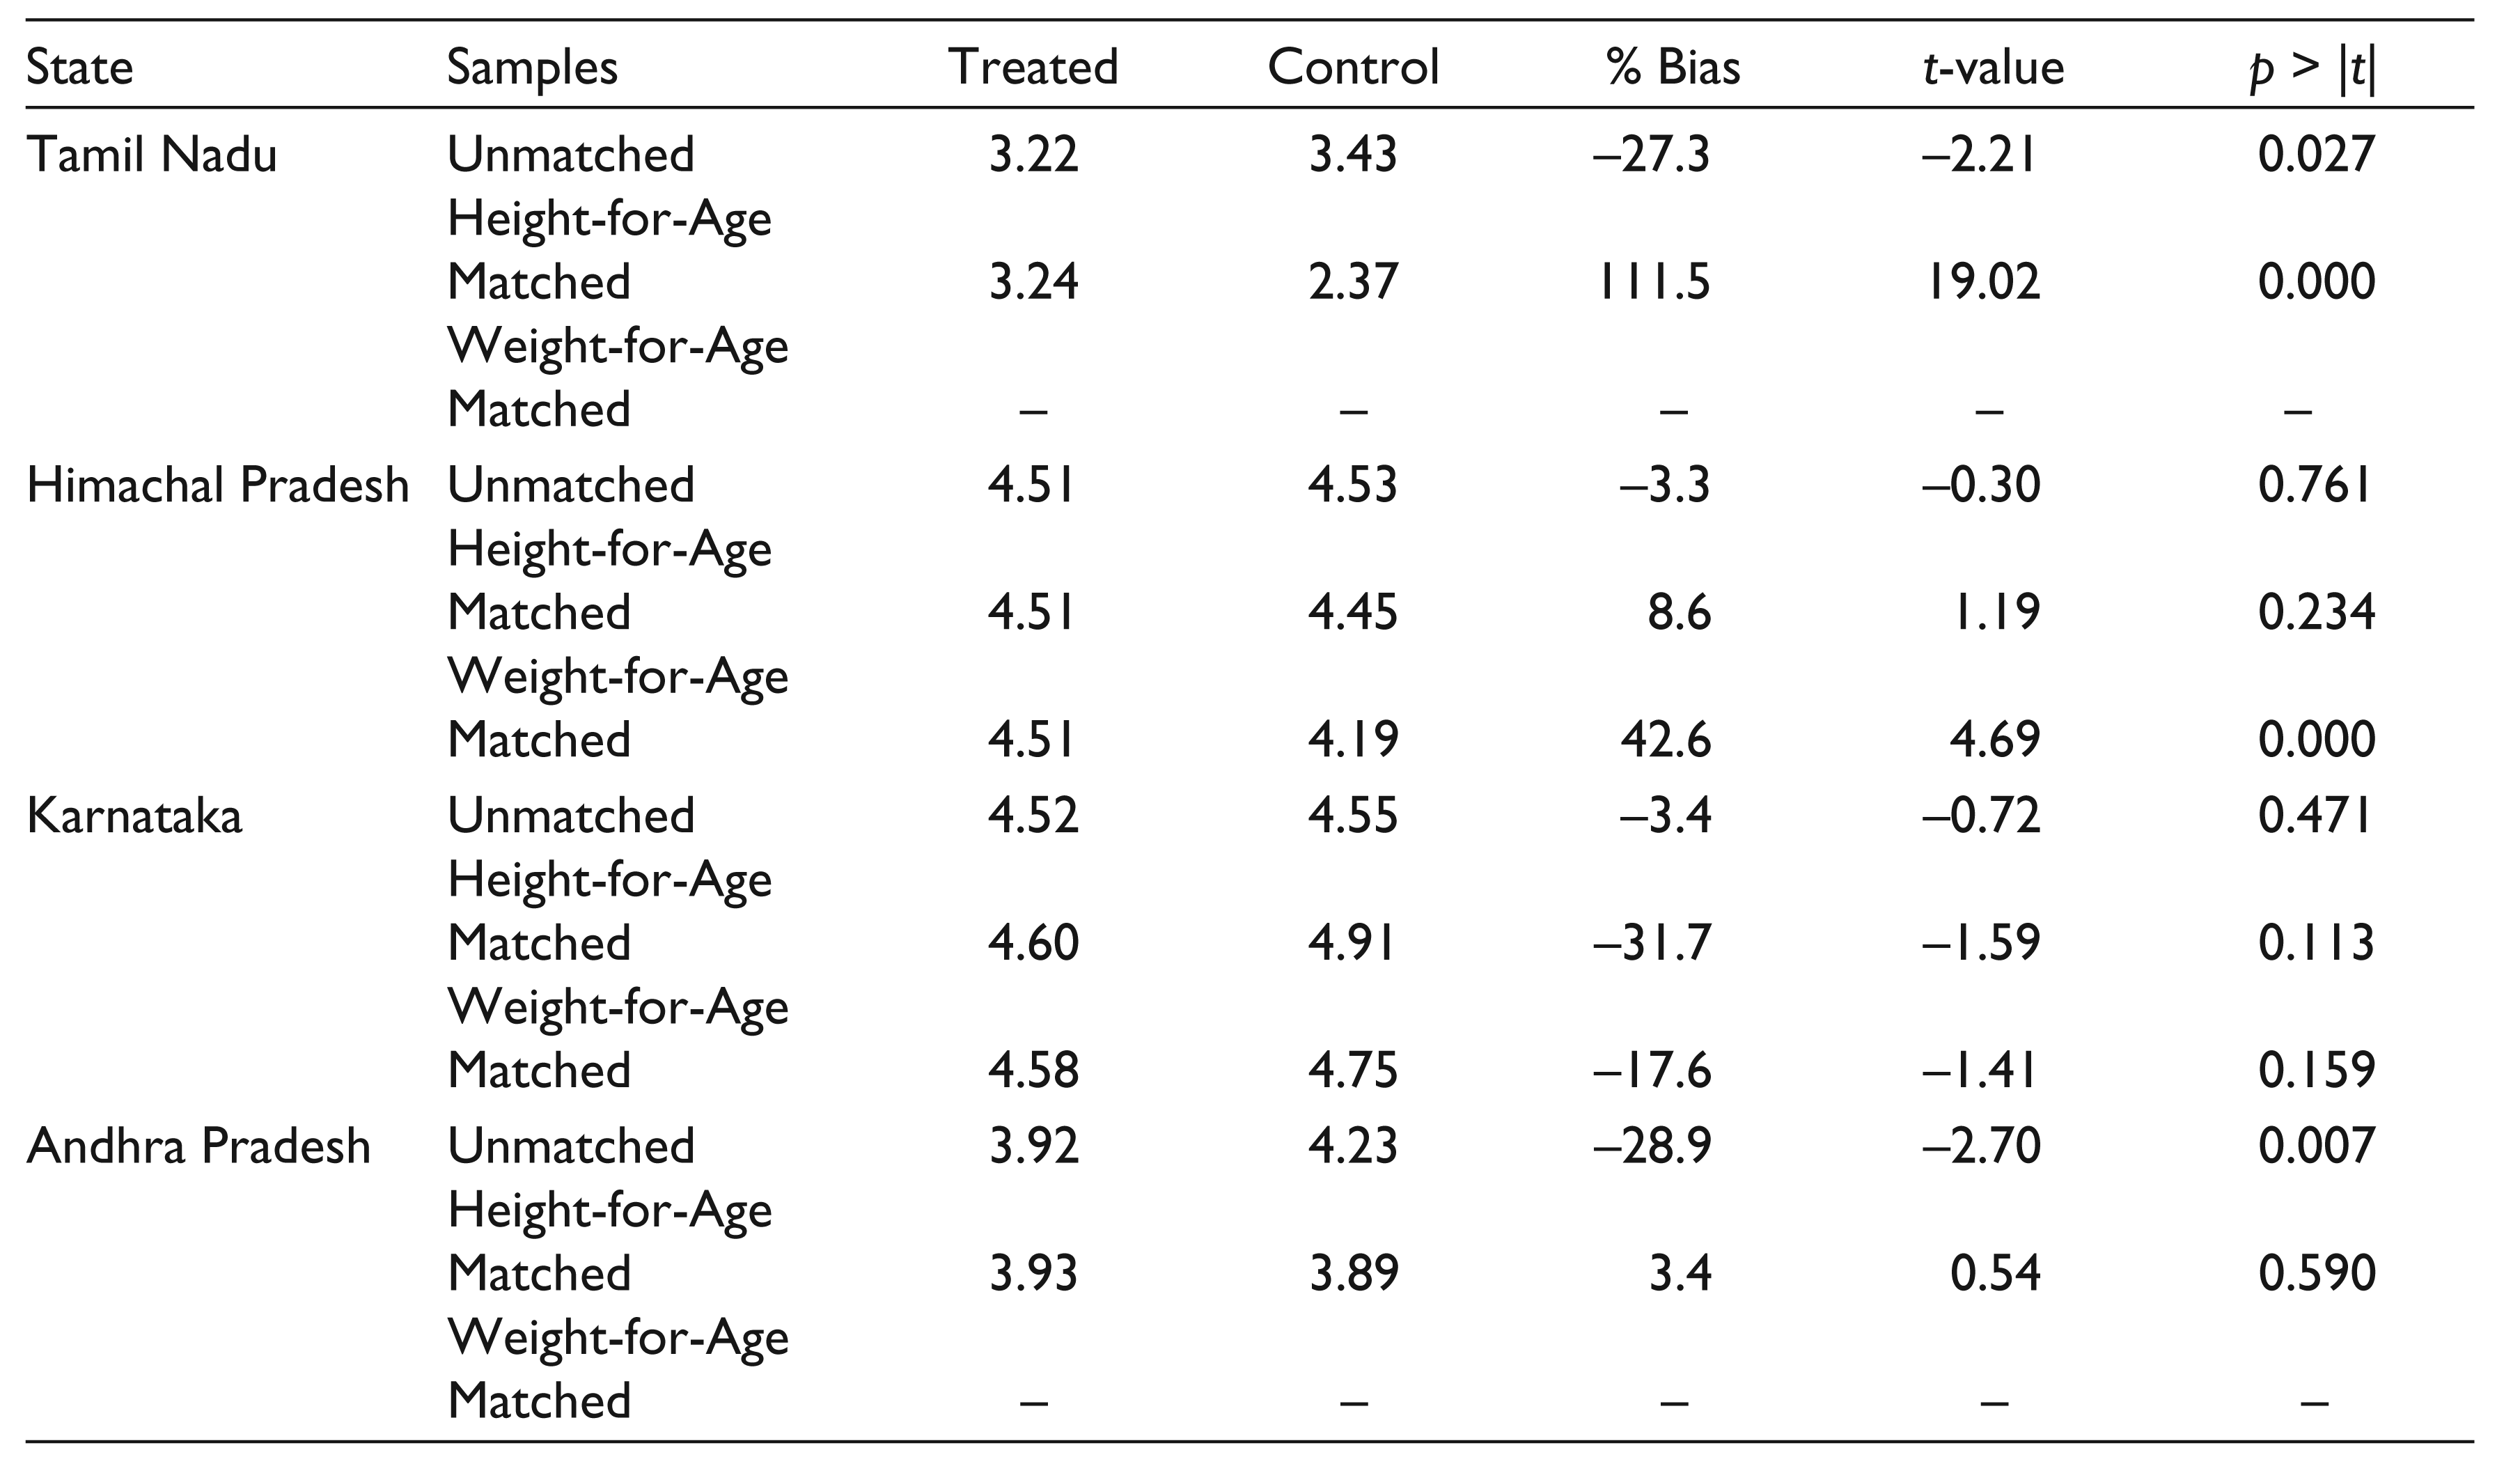
Estimated Impact of the PDS in 2011–2012, Functioning States
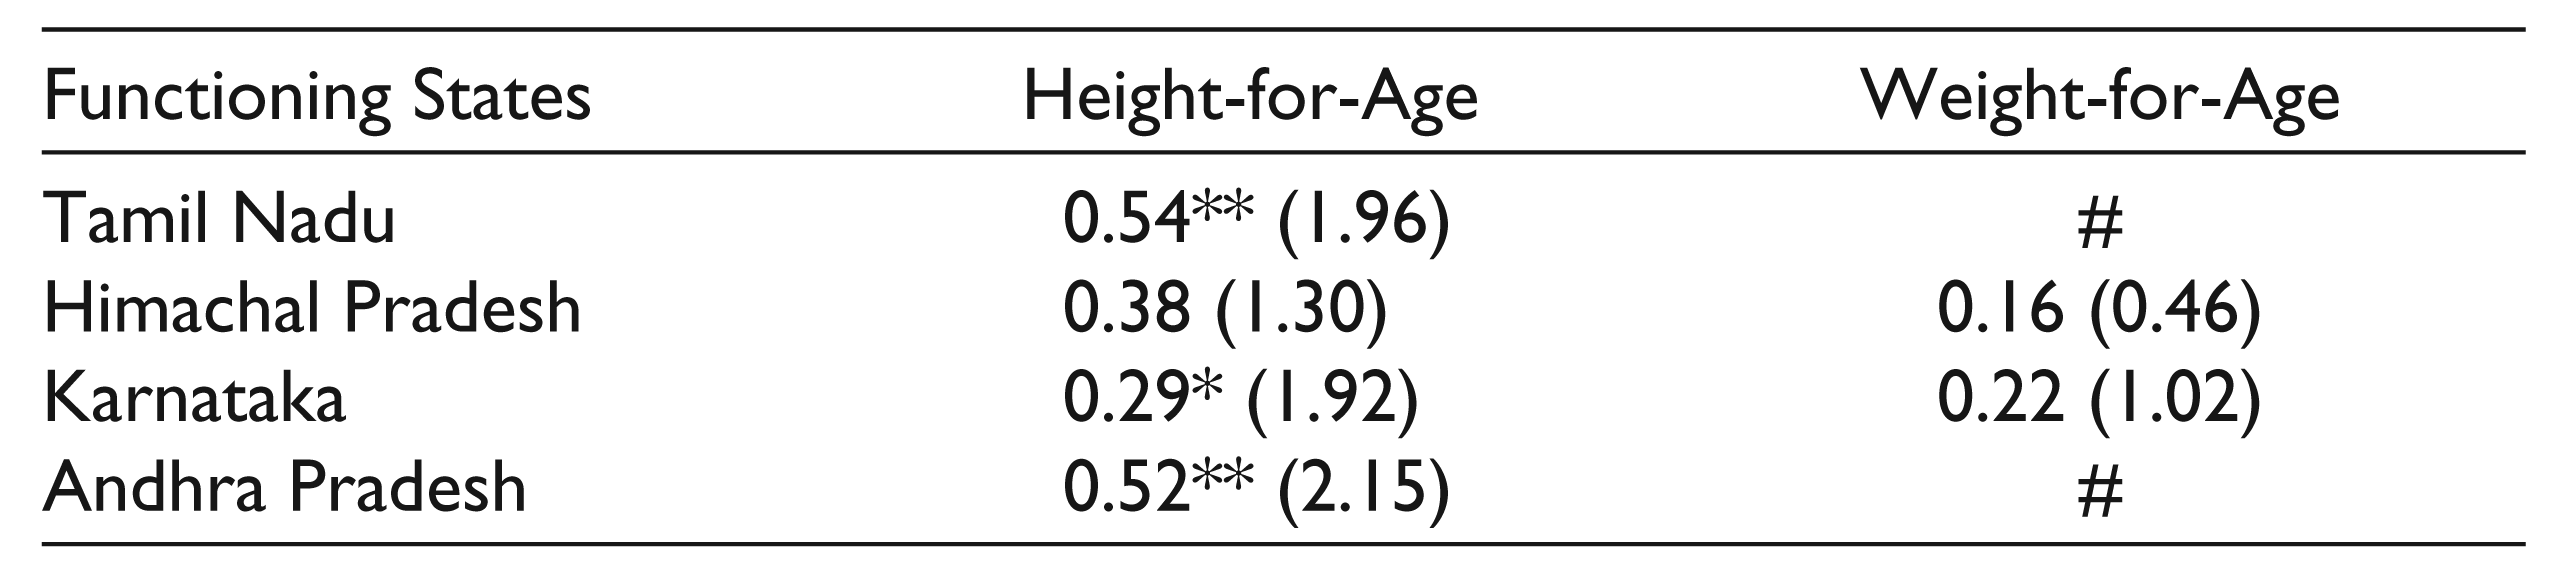
# ATT could not be calculated.
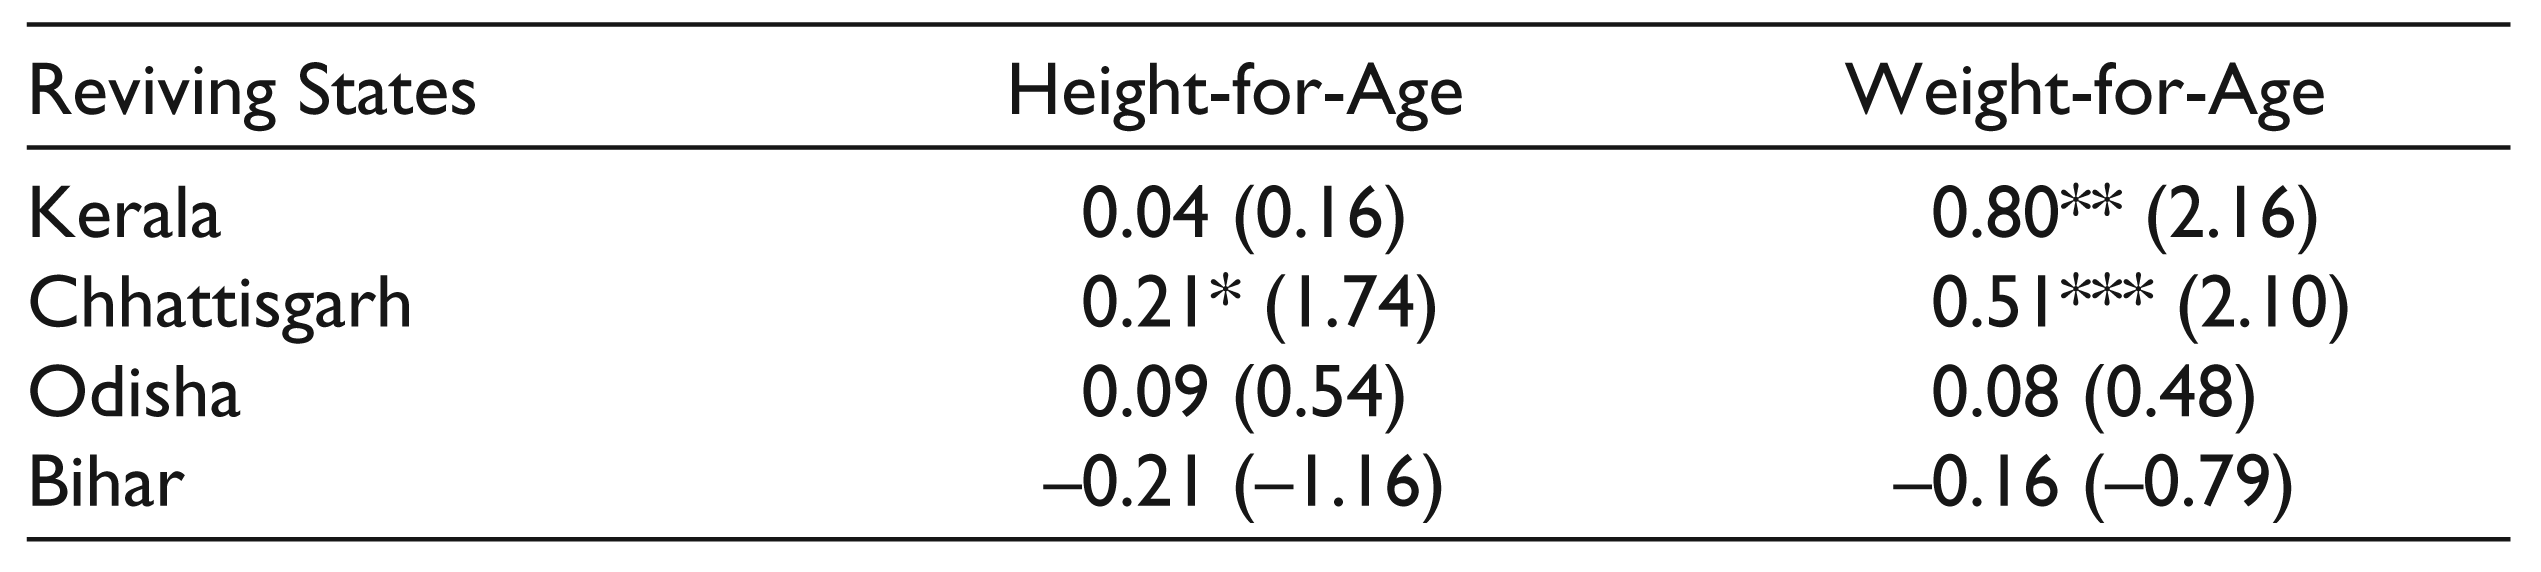
Estimated Impact of the PDS in 2011–2012, Reviving States
Estimated Impact of the PDS in 2011–2012, Languishing States
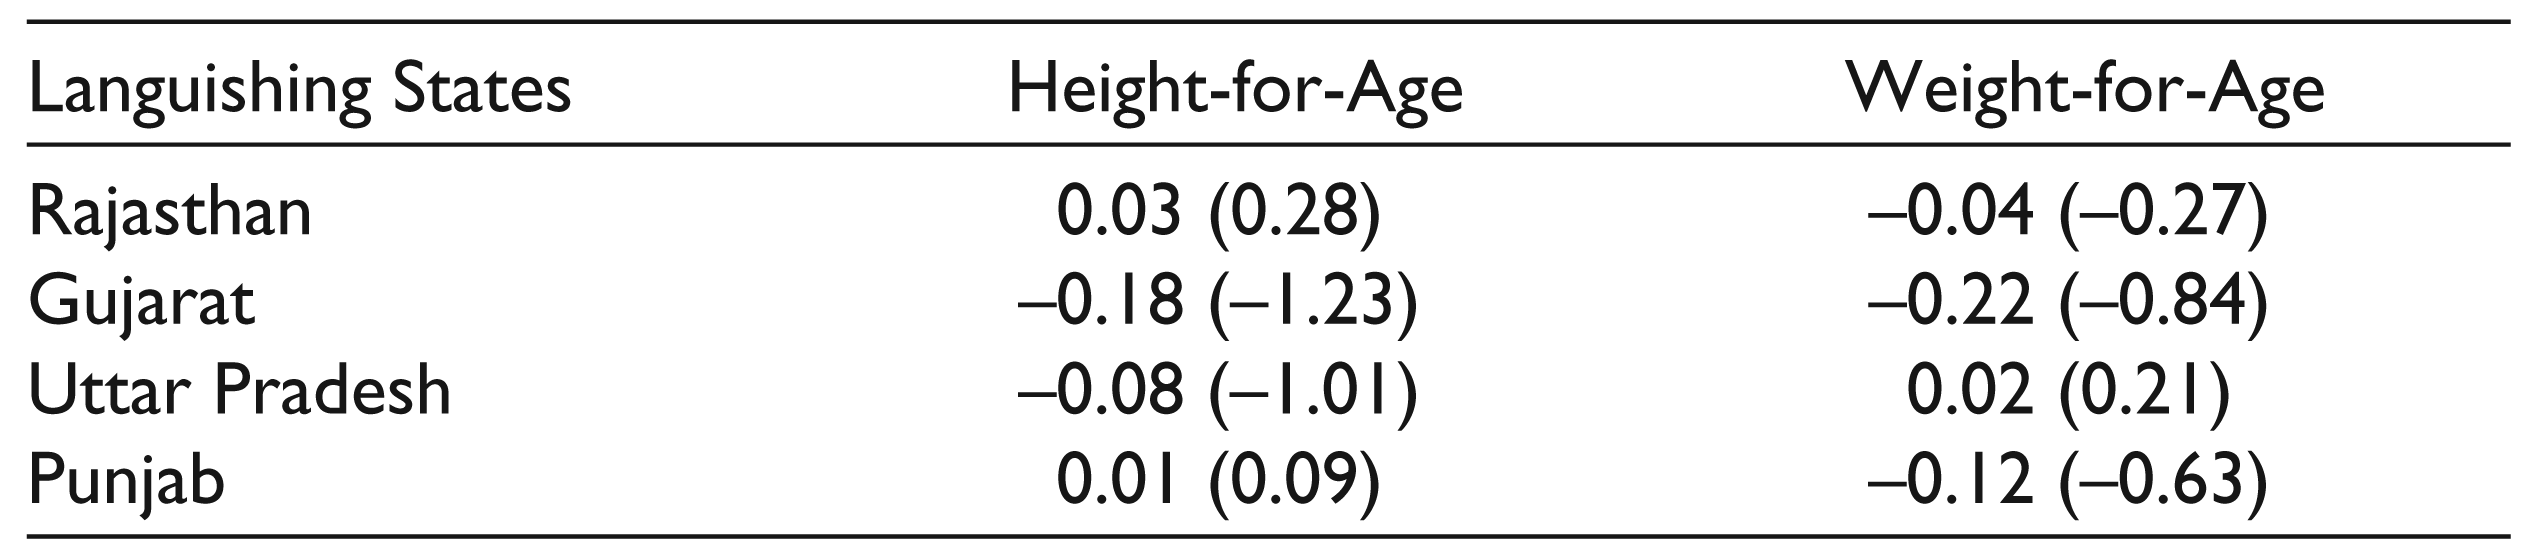
Table 3 shows the ATT in the functioning states with universal or near-universal coverage of the PDS. This shows that the PDS has had a statistically significant effect on and enabled catch-up growth in the height-for-age indicator in three of the four functioning states. In Tamil Nadu, Karnataka and Andhra Pradesh, purchase of rice or wheat from the PDS by the household significantly increased the height-for-age z-score of the child by 0.54 standard deviations (sd), 0.29 sd and 0.52 sd, respectively. However, Himachal Pradesh, the other functioning state, does not show a similar impact. For Andhra Pradesh and Tamil Nadu, the average treatment effect on weight-for-age z-scores could not be calculated. This is partly because the ‘who2007’ package to calculate weight-for-age z-scores excludes sampled children aged above 10 years. In addition, the fact that these states have close to universal coverage made it difficult to identify children in non-beneficiary households with valid z-scores. These states have therefore been marked with a # in Table 3. In the two functioning states where the exercise could be conducted, the PDS did not have a statistically significant impact on the weight-for-age z-scores. Height-for-age is perceived to be an indicator of long-term nutritional status and thus, this exercise shows that the system has had a positive impact on the longer-term child nutritional indicator in the states where it has been functioning well for many years.
Table 4 shows the estimated anthropometric impact in the reviving states. There is a statistically significant impact of the PDS on the weight-for-age z-score in Kerala and on the height-for-age and weight-for-age z-scores in Chhattisgarh. The purchase of rice or wheat from the PDS by the household significantly increased the weight-for-age z-score in Kerala by 0.80 sd, and the height-for-age and weight-for-age z-scores in Chhattisgarh by 0.21 sd and 0.51 sd, respectively. The recent revival has aided catch-up growth in the weight-for-age z-score in two of the four reviving states; this is consistent as weight-for-age is considered to indicate shorter-run nutritional status. However, in Odisha, another state noted for its revival, this exercise did not reveal any statistically significant impact on the anthropometric indicators considered here. Bihar was also seen to show signs of a revival of the PDS in 2011–2012 NSS data but understandably, the signs of this revival are not yet evident in the nutritional indicators.
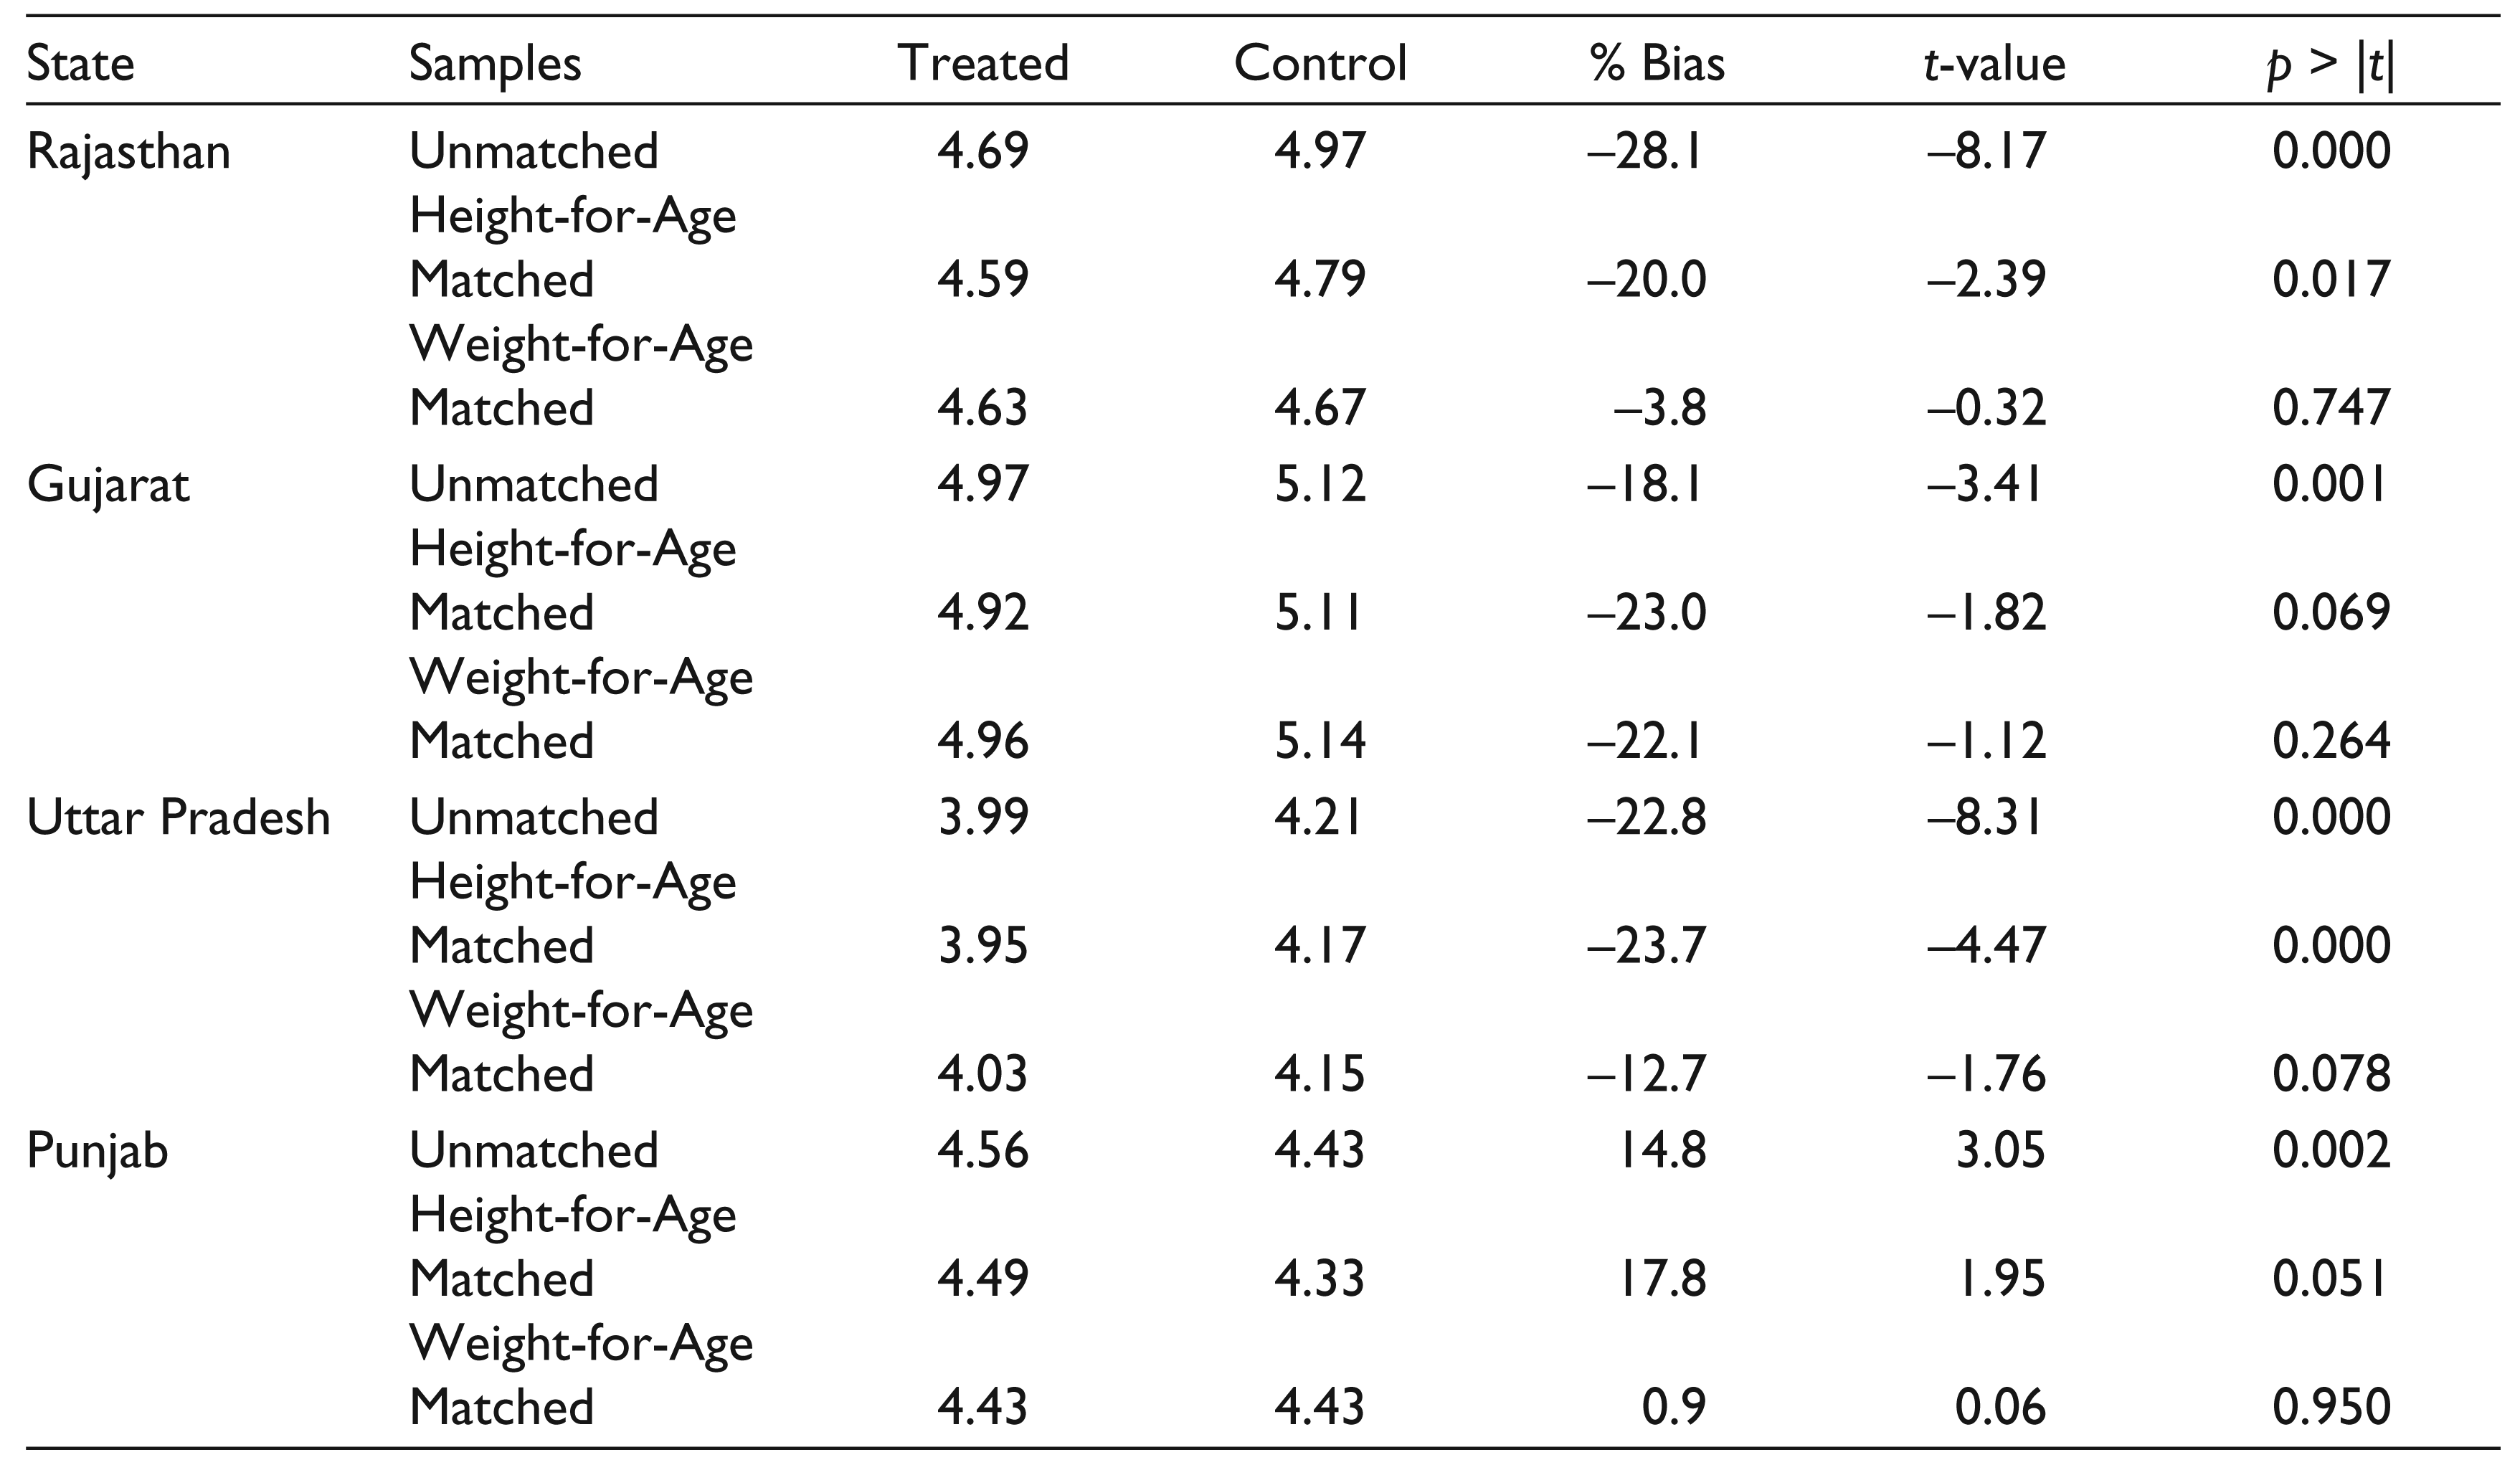
Table 5 shows negative ATT of the PDS on child anthropometry in the languishing states. Even with a languishing PDS, it is difficult to understand how the provision of food could worsen the nutritional status. A possible explanation is that implementation of the PDS has been highly targeted in these states, so that even after the matching exercise, there are large differences in the nutritional status of the children in beneficiary households and the matched children in non-beneficiary households in these states, for which the poorly functioning PDS has been unable to compensate.
The method used here was nearest neighbour matching with replacement. As a robustness check, kernel matching method was also used; the estimates from this method are not reported here. Although the magnitudes of the ATT vary by method, the sign and significance remain the same in most cases. The balance of covariates was also checked after matching.
To get a clearer understanding of the mechanisms leading to the differential impact of the system on nutritional indicators in these states, I have considered two parameters—the role of PDS in ensuring adequate consumption of calories and in enabling dietary diversity. To get a measure of the first parameter, I used the original calorie norms of 2,400 calories per person per day in rural areas and 2,100 calories in urban areas to calculate the proportions of calorie-deficient population in each state. Consider an alternative scenario where the PDS is absent. In the first case, I assumed that all of the calories consumed through the subsidized commodities are additional and that the amounts spent on these commodities are instead spent on non-food expenditure. The resultant percentages of the undernourished population below the calorie norms were calculated. The differences between the two proportions are given in Table 6.
This table shows the low contribution of the PDS towards reducing calorie-insufficiency by these norms in 2004–2005. Except in Himachal Pradesh, and to a lesser extent in Tamil Nadu and Andhra Pradesh, the presence of the PDS did not make any significant difference to the percentage of undernourished population by calorie norms. By 2011–2012, the role of the PDS in lifting the population above the calorie norms increased greatly in states that already had a well-functioning PDS or had begun to show signs of a revival. This was particularly true in Himachal Pradesh; out of every 100 people in the rural areas of this state, 38 more people would be consuming below the calorie norms in the absence of the PDS in 2011–2012.
Reduction in Undernourished Population Due to PDS Calories (%)
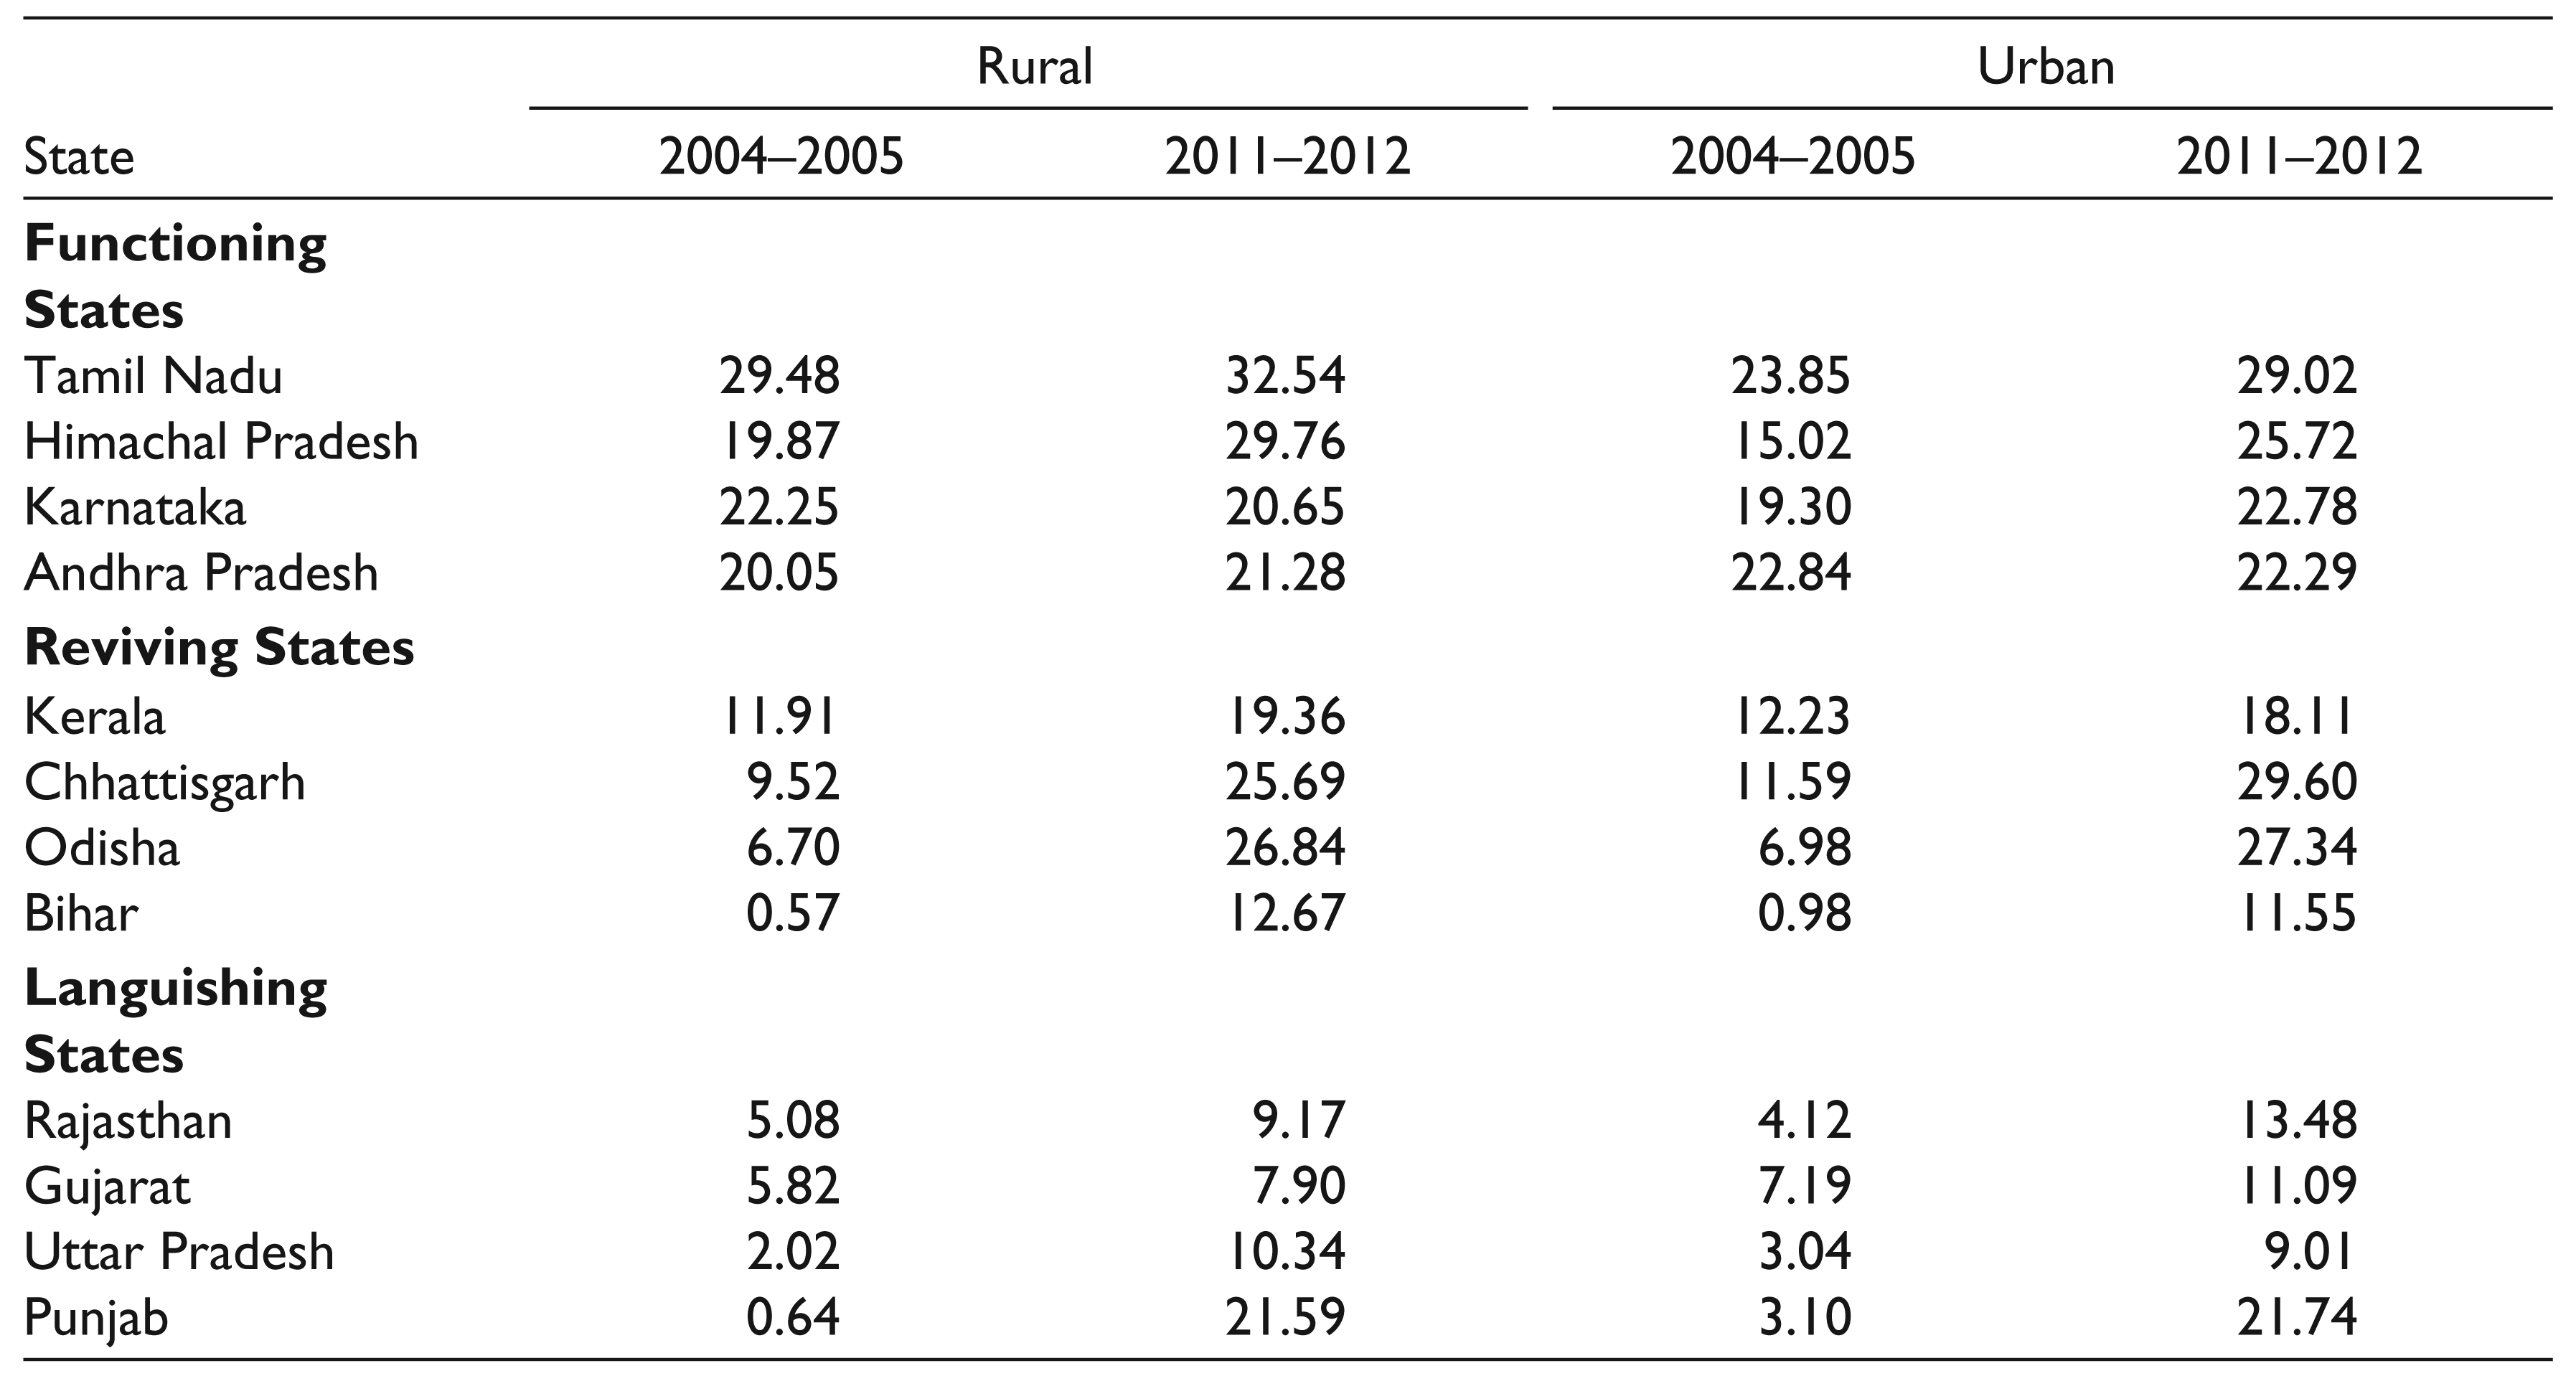
Next, I considered an alternative scenario where the amount spent on purchasing the commodity from the PDS is instead used to purchase the same commodity from the market. The per capita calorie intake from market quantities of equal value was calculated. The difference between this intake without the food subsidy and the actual per capita calorie intake with the food subsidy gives the extra calories contributed by the PDS towards the per capita consumption of households in that state. Table 7 gives these figures as percentages of total per capita calorie intake. This table reiterates the point of classification of these states into these three groups. In the functioning states, the contributions of the PDS towards per capita calorie intake were already high in 2004–2005; at least one-fifth of the calories consumed per capita in PDS households were additional calories contributed by the PDS. These figures did not change much by 2011–2012 in most of these states. In reviving states, the contributions increased greatly by 2011–2012, particularly in Chhattisgarh and Odisha. Meanwhile, in three of the four languishing states, the contributions were low and remained low in 2011–2012. Tables 6 and 7 therefore indicate the high dependence on the PDS for consumption of sufficient calories in the functioning states and increasing dependence in certain reviving states.
Extra PDS Calories in Total per Capita Calorie Intake (%)
The second mechanism I considered to explain the results was the role of the PDS in enabling greater dietary diversity. Tables 8, 9 and 10 consider the household index of dietary variety. This index is the sum of the number of food groups consumed out of a total of six: cereals, other grains, pulses, fruits and nuts, vegetables and milk. The tables consider the average dietary diversity index in PDS beneficiary and non-beneficiary households in the matched and unmatched samples of the three groups of states after the PSM exercise.
Table 8 shows the index in the matched and unmatched samples of the functioning states. In three of the four states, the index of dietary diversity is higher in PDS than non-PDS households; it is much higher in Tamil Nadu. However, the difference is not significant in all cases. The exception to the pattern is Karnataka where the index is higher in non-beneficiary households. This is somewhat puzzling, as Table 3 shows an impact of the system on the height-for-age parameter in this state. Thus, the impact in this state may not be explained by improvements in dietary diversity or if so, the contribution of the PDS in this regard may have been exhausted in earlier years, resulting in a significantly higher height-for-age z-score among beneficiary children.
Index of Dietary Variety in Matched and Unmatched Samples, Functioning States
Index of Dietary Variety in Matched and Unmatched Samples, Reviving States
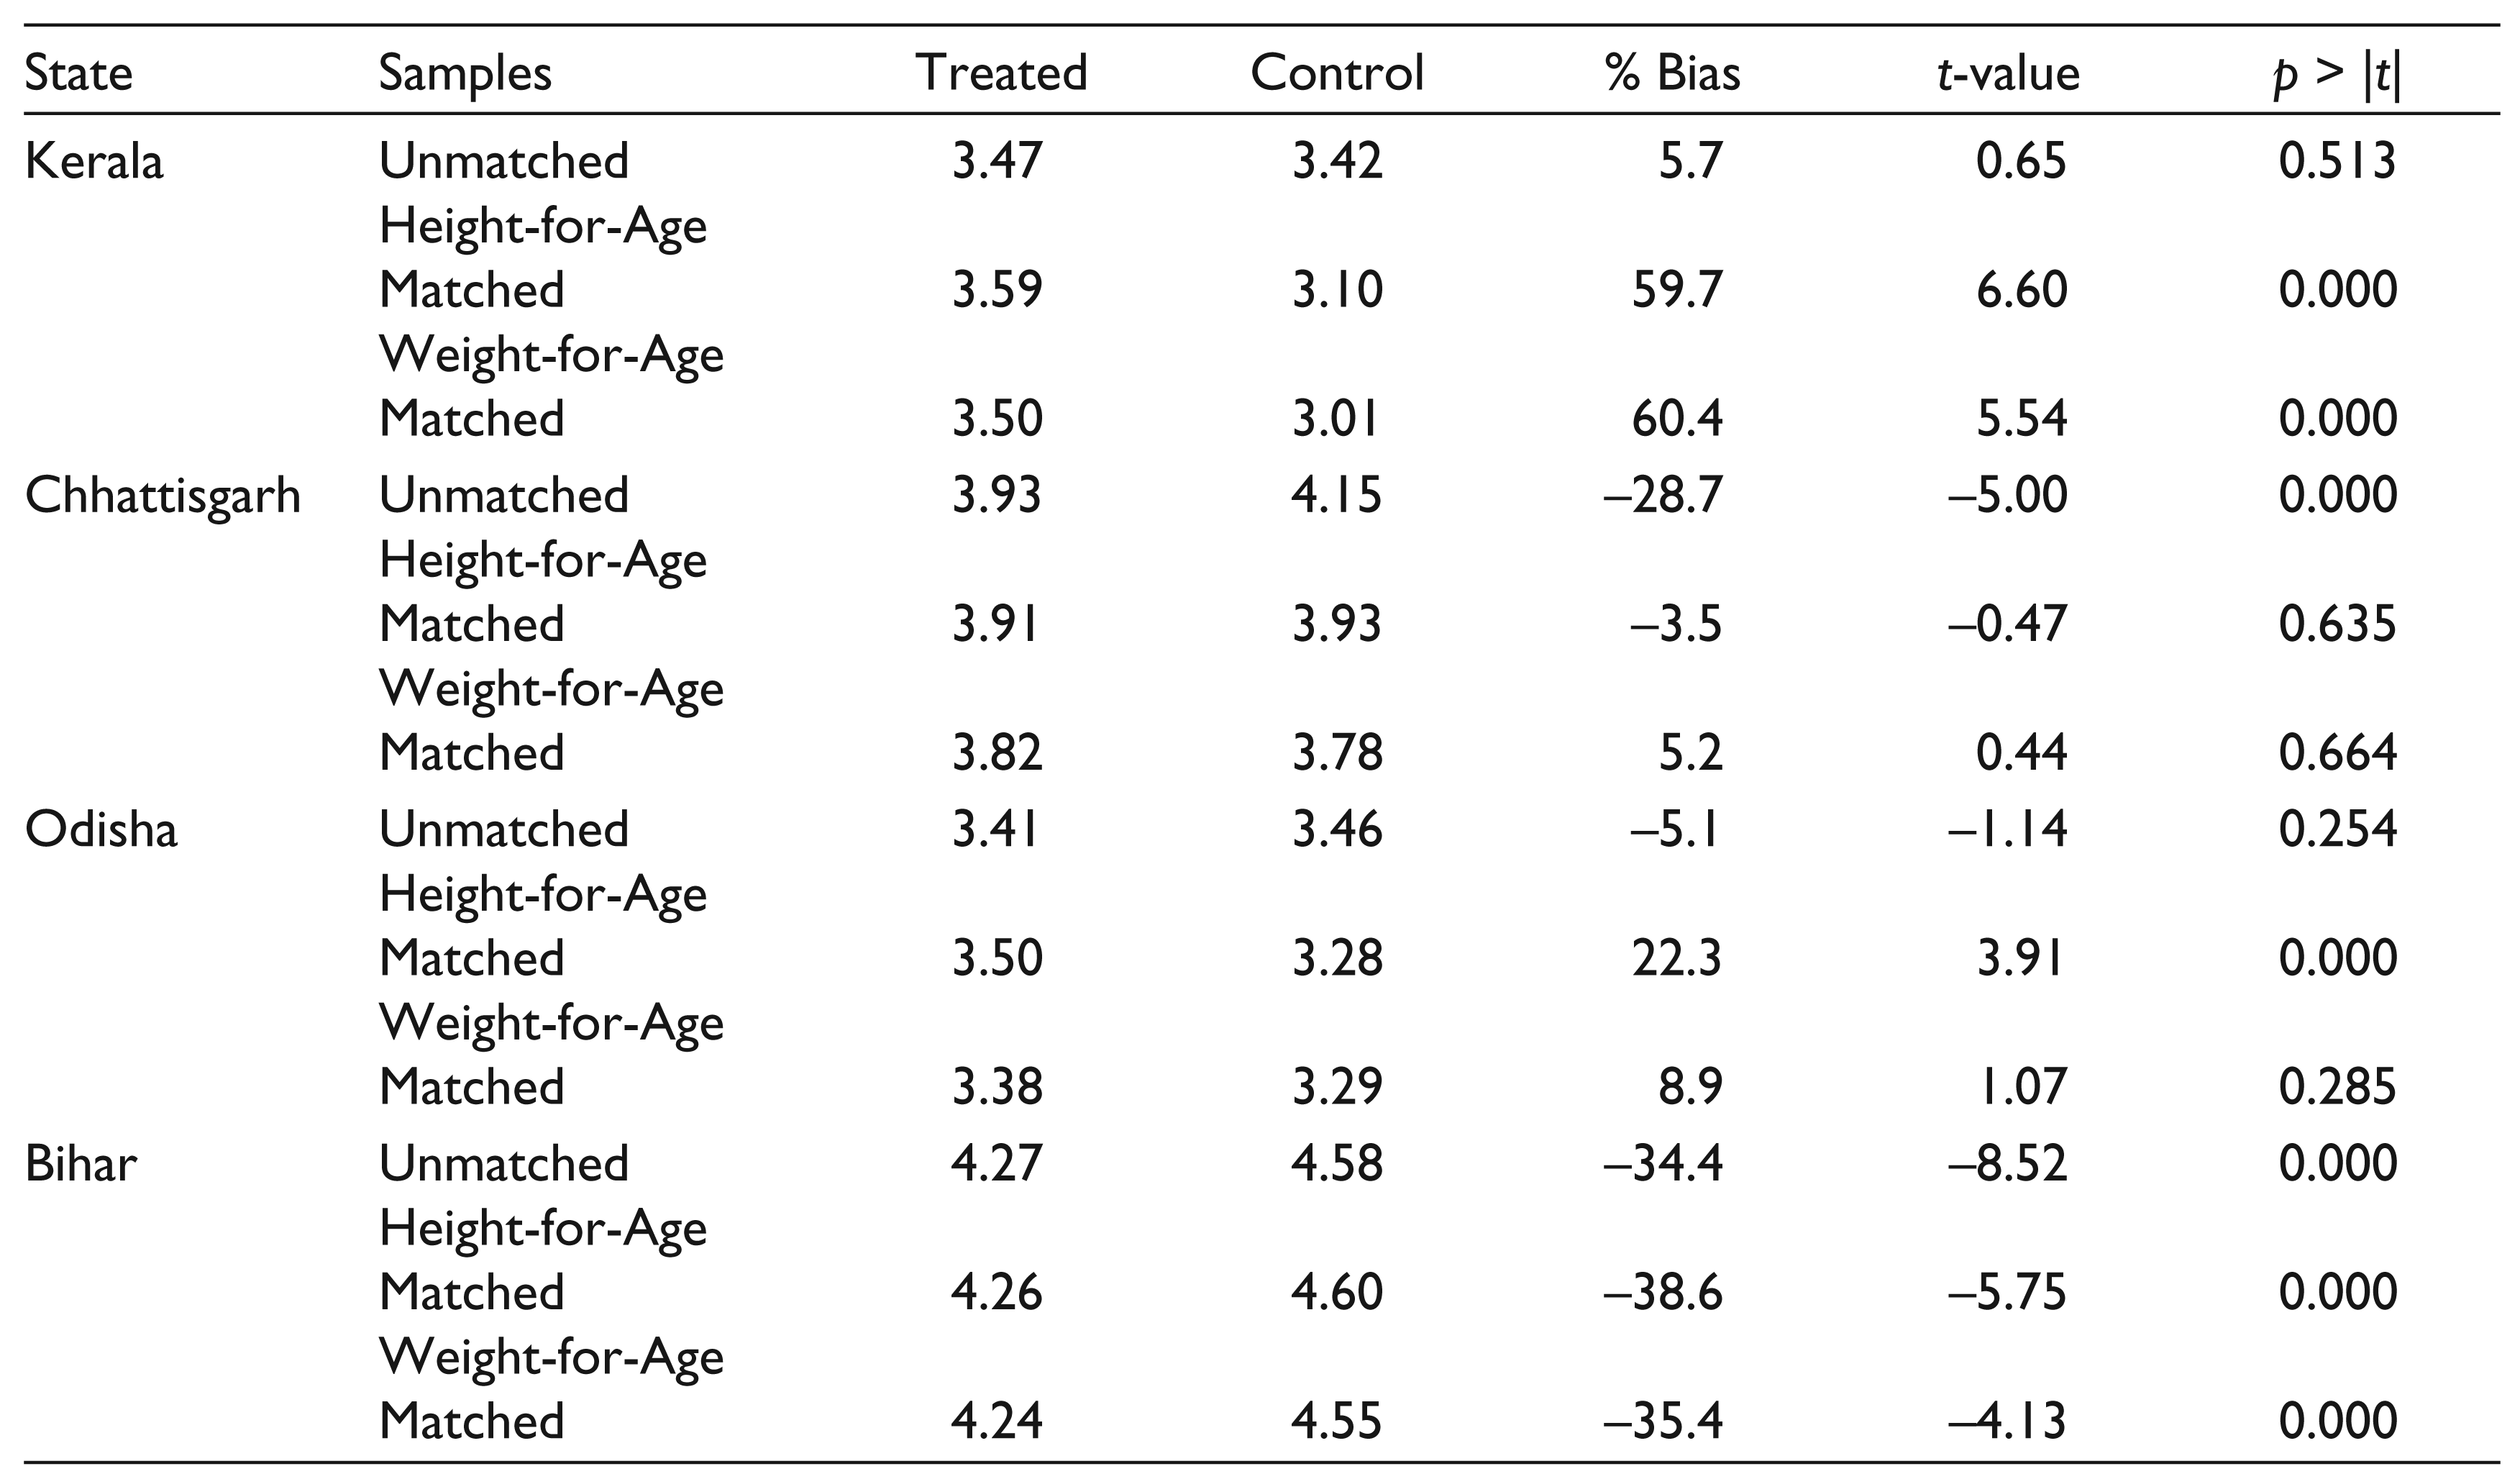
Table 9 shows the dietary diversity index in the different samples of reviving states. In three of the four reviving states, the index is in most cases higher in PDS beneficiary households, as compared to non-beneficiary households. The exception is the state of Bihar; as pointed out earlier, it is unlikely for the revival in this state to have already been reflected in dietary patterns and nutritional outcomes.
In languishing states (Table 10), the opposite trend can be seen. In three of the four languishing states, dietary diversity appears to be higher in non-PDS households as compared to PDS households; the index is much higher in two of these states. The exception is Punjab, which is surprising as the PDS is not considered to play a very important role in this state. One explanation for why Punjab shows counter-intuitive results in certain parameters may be the result of the much fewer households that the PDS benefits in this state (Table A1), which makes the sample size of the treated group much smaller and the matching exercise less reliable. Alternatively, it could be the case that the PDS provides an important contribution to the consumption of those few households, so that they are better off as compared to non-beneficiary households in similar conditions.
Index of Dietary Variety in Matched and Unmatched Samples, Languishing States
Thus, the composition of the diet appears to be important in explaining the differences in the performance and impact of PDS on the nutritional status of children across states. This is consistent with the results of Kishore and Chakrabarti (2015), who found evidence for diversification of the food basket of poor households between 1993–1994 and 2011–2012 in their sample of five states that had implemented PDS reforms. In states where the PDS is functioning well, beneficiary households may be able to purchase and consume items from different food groups through the amounts saved from not having to purchase the same quantities from the market. In the languishing states, there may be significant differences in the dietary diversity of households, which are not compensated for by the PDS. This point needs to be explored further with the study of consumption patterns in these states.
Conclusion
The state-wise indicators of utilization of the PDS reflect the improvements in the functioning and reach of the system in certain states over the past decade. These improvements follow a combination of steps undertaken by these states through expansion of coverage, reduction of issue prices, technological improvements and other PDS reforms.
In the context of this revival, the impact of the PDS on the nutritional indicators of children in the age group 7–19 years was studied by state. A further objective was to explore possible catch-up growth and the role of the PDS in aiding such growth in each state. This showed that the PDS has had a significant positive impact on the longer-term nutritional indicator in three of the four functioning states, and on the short-term nutritional indicator in two of the four reviving states. This result indicates that at least in these two states, the revival of the PDS has begun to translate into nutritional gains. It also indicates the greater role of the PDS in aiding catch-up growth in these functioning and reviving states.
Certain mechanisms were explored to understand these results. This showed a higher dependence on the system for sufficient consumption of calories in the functioning states and an increasing dependence in certain reviving states. The indexes of dietary diversity were also higher in PDS beneficiary households as compared to similar non-beneficiary households in most of the functioning and reviving states. These are encouraging results which offer support for further extension of PDS reforms in the other reviving as well as the languishing states.
Footnotes
Acknowledgements
I am very grateful to Prof. Jayati Ghosh and the participants at the Global Conference on Prosperity, Equality & Sustainability 2016 for their suggestions and comments. Any remaining errors are my own.
Appendix
Sample Sizes of State-level Samples
| State | Treated | Control |
| Tamil Nadu | 1,291 | 60 |
| Himachal Pradesh | 1,265 | 102 |
| Andhra Pradesh | 1,564 | 105 |
| Karnataka | 2,363 | 594 |
| Kerala | 1,008 | 144 |
| Chhattisgarh | 995 | 464 |
| Odisha | 1,564 | 689 |
| Bihar | 1,225 | 1,225 |
| Rajasthan | 1,227 | 2,470 |
| Uttar Pradesh | 1,879 | 4,392 |
| Punjab | 564 | 1,274 |
| Gujarat | 447 | 1,361 |