
Abstract
This article estimates the total fertility rate (TFR) for the overall population in major Indian states by employing Arriaga variation of the P/F ratio method and the relational Gompertz model. The article uses the 2011 Census data on average parity and the current fertility schedule. Estimation of TFRs at the state level by employing Arriaga variation of the P/F ratio method strongly corresponds with Sample Registration System (SRS) compared to those derived from the relational Gompertz model. Thus, Arriaga variation of the P/F ratio method was retained to estimate the Hindu–Muslim fertility differentials for 618 districts in India from all states except Jammu and Kashmir. Comparing the TFRs obtained from the analyses with indirect estimates of TFRs from the 2001 Census, the analysis reveals that the overall fertility transition in India has been steady during the last decade. Fertility transition has been underway for both Hindus and Muslims, at a varying pace, when compared to the state-level indirect estimates of the 2001 Census. Though the overall convergence of fertility between Hindus and Muslims has been underway, significant regional variations persist.
Keywords
Introduction
Like earlier decades, the 2011 Indian Census data show a higher growth rate of Muslim population compared to the Hindu population, which has fuelled an intense controversy among academicians and policymakers of India. The Census Commissioner of India has not only published the population figures by religious affiliation at the state and district levels but also the data on the number of children ever born and the number of births in the last year (before the census year) by the number of women in the five-year age interval (GoI, 2016a, 2016b). These disaggregated data on religious demography have only been made available since 2001, which are helpful to policymakers (GoI, 2004).
Using these data, the article estimates total fertility rates (TFRs) for the overall population at the state level by employing Arriaga variation of the P/F ratio method (Arriaga, 1983; Brass, 1964; Brass & Coale, 1968) and the relational Gompertz model (Brass, 1996; Zaba, 1981) to check their validity with the data obtained from the Sample Registration System (SRS) from the same year (Registrar General of India [RGI], 2013). Estimates for all religions and for Hindus and Muslims were then derived to assess the fertility differentials at the district level across India by Arriaga variation of the P/F ratio method; as such, estimates of TFRs have a close correspondence with the estimates obtained from the SRS, except for a few large states in general and for Jammu and Kashmir in particular. Analysis of district-level data for Jammu and Kashmir was thus dropped because of its inappropriateness. The state-level TFR estimates of Hindus and Muslims were further compared with the indirect estimates of TFRs of Hindus and Muslims from the 2001 Census data by Rajan (2005) (by employing the reverse survival method) to ascertain the extent of fertility transition among these religious groups in different states of India.
We have deliberately restricted our analyses and discussion in comparing Hindu–Muslim fertility differentials obtained from the 2011 and 2001 Censuses (Rajan, 2005) and have not focused on the factors contributing to such differentials as detailed discussion on this issue is available elsewhere (Alagarajan, 2003; Alagarajan & Kulkarni, 2008; Bhat, 1996; Bhat & Rajan, 1990; Bhat & Zavier, 2005; Dharmalingam & Morgan, 2003; Dharmalingam, Navaneetham, & Morgan, 2005; James & Nair, 2005; Jeffery & Jeffery, 2000; Kulkarni & Alagarajan, 2005; Moulasha & Rao, 1999; Shariff, 1996). These studies have not only established the role of different socio-demographic, economic and cultural factors, contributing to Hindu–Muslim fertility differentials, but have also focused on inter- and intra-state variations in such differentials. In view of intra-state variation infertility according to religion, our current endeavour would help policymakers assess community-specific family planning needs and accordingly redesign family welfare programmes at the district level.
Method
One could directly calculate TFRs of Hindus and Muslims from data on the number of women by present age, religious affiliation and number of births in the last year (before the census year), since TFR is calculated as the sum of age-specific fertilities multiplied against the width of the five-year age interval. However, the birth counts a year prior to the census year, as reported in the 2011 Census, are incomplete, as only about 79 per cent of births have been covered, possibly due to reference period errors. 1 Therefore, not much confidence can be placed in applying the direct method for calculating TFR. A similar observation was noted by Kulkarni (2007) while estimating “missing girls” from the 2001 Census data.
It may be worth pointing out that under census definitions, religious faith and persuasions are self-reported by the household members and remain unverified. It is generally observed that although the majority of the Scheduled Castes report themselves as Hindus, a substantial proportion of Scheduled Tribes report themselves as Christians. For example, in Nagaland, the Hindu and Muslim population, as reported by the respondents, is only 8.8 and 2.5 per cent, respectively. In Mizoram, the reported percentage of Hindus and Muslims is 2.7 and 1.4, respectively. Thus, in the northeastern states the majority of the population identified themselves as Christians and Scheduled Tribes as their ethnicity.
The P/F ratio method obtains current fertility by comparing the cumulative fertility equivalent derived from recent fertility data “F” by trusting the age pattern of fertility but not level and life-time average parities “P,” trusting the overall level of fertility but not the age distribution (Brass, 1964; Brass & Coale, 1968; United Nations, 1983). The method is very useful to adjust estimates of the current fertility level, which is computed from data on recent births from incomplete census or civil registration. The method requires data regarding the total number of children ever born by five-year age intervals of mothers, recent fertility by five-year age intervals of mothers measured either by births in the previous year or the vital registration system and the total number of women in each five-year age group. The assumptions in employing this method are as follows: misreporting of current fertility is constant across all age groups, increasing under-reporting of parity by women’s age and constant fertility for the youngest age group to age 35 years or so. With perfect data, the ratio should be the same for all age groups and close to one; however, in practice, it is quite perfect if the ratios for 20–24, 25–29 and 30–34 age groups are close. Typically, the P/F ratio will decrease with women’s age, and deviation from this pattern indicates violations of the assumptions or different patterns of under-reporting.
However, some imperfections have been noticed in the P/F ratio method. For example, Zlotnik and Mill (1981, p. 104) noticed that the original P/F ratio method may not represent the true picture satisfactorily and is thus likely to lead to biased estimates. Such biases arise due to simplified assumptions inherent in the application of the method, particularly, the assumption of constant fertility for a sufficiently long period (more than 20 years or so) preceding the survey date so that the cohort and the cumulated period fertility are equal, and have proved to be flawed (Feeney, 1998).
Arriaga (1983) proposed a refinement and modification of the aforesaid Brass P/F ratio method. This modification makes a provision of changing fertility levels by using a linear interpolation of children ever born by age of the mother from two or more censuses (Arriaga, 1983). The method provides estimates of children ever born for 1 year prior to the census date. Arriaga (1983) extension was included in FERTPF procedure of MORTPAK and used in the current analyses. It takes the combinations of P2/F2, P3/F3 and P4/F4 by default.
Another refinement and modification of the Brass P/F ratio method is the relational Gompertz model. The model is used as a diagnostic tool and estimation technique for the evaluation and adjustment of fertility estimates obtained from retrospective reports on period and recent fertility (Brass, 1981; Zaba, 1981). The model is generally used not only for the veracity of the fitting method but also for parsimonious estimates of parameters. It fits the Gompertz function to reported recent fertility rates (ASFRs) and the average parity. ASFRs provide the shape of fertility distribution, and data on average parities give corrected age-specific and TFRs. The method does not require an assumption of constant fertility as it compares/replaces recent fertility data with model fertility schedules to check accuracy and relies on parity data for all age groups (not just younger ones). 2
Results
Table 1 provides the estimates of TFR at an all-India level and also for the major states as obtained by the Arriaga version of the P/F ratio method, relational Gompertz model and estimates provided by the SRS for the same year to check the validity of our estimates. This was done as SRS is regarded as the most reliable source of demographic indicators since the 1980s. It can be observed from Table 1 that TFR derived from the census by employing Arriaga version of the P/F ratio method corresponds with the SRS estimates not only at the all-India level but also for most of the major states. According to census estimates, India’s TFR is only 0.2 points lesser in comparison to SRS estimates. Further, ratios of age-specific fertility rates based on adjustment factors (P/F ratios) for the age groups from 20–25 to 30–35 were found to be very close to unity, which established the efficacy of the method. Contrary to SRS estimates, estimated TFR at the all-India level as obtained from the relational Gompertz model was found to be substantially high—0.7 children per woman. Even for the states which have already witnessed fertility transition such as the southern Indian states, for Maharashtra, Punjab, Odisha and West Bengal, the relational Gompertz model provides considerably higher estimates of TFRs (Table 1). North Indian states’, where fertility transition is underway, estimates of the relational Gompertz model depict higher estimates as compared to SRS. It seems that the relational Gompertz model put more emphasis on average parity rather than current fertility levels since estimated TFRs in all the states were found to be higher in comparison to the SRS estimates of current fertility.
Differences of TFR in Major States in India Using Arriaga Variation of the P/F Ratio Method and Relational Gompertz Model as Estimated from Census 2011 and the Sample Registration System (SRS) 2011
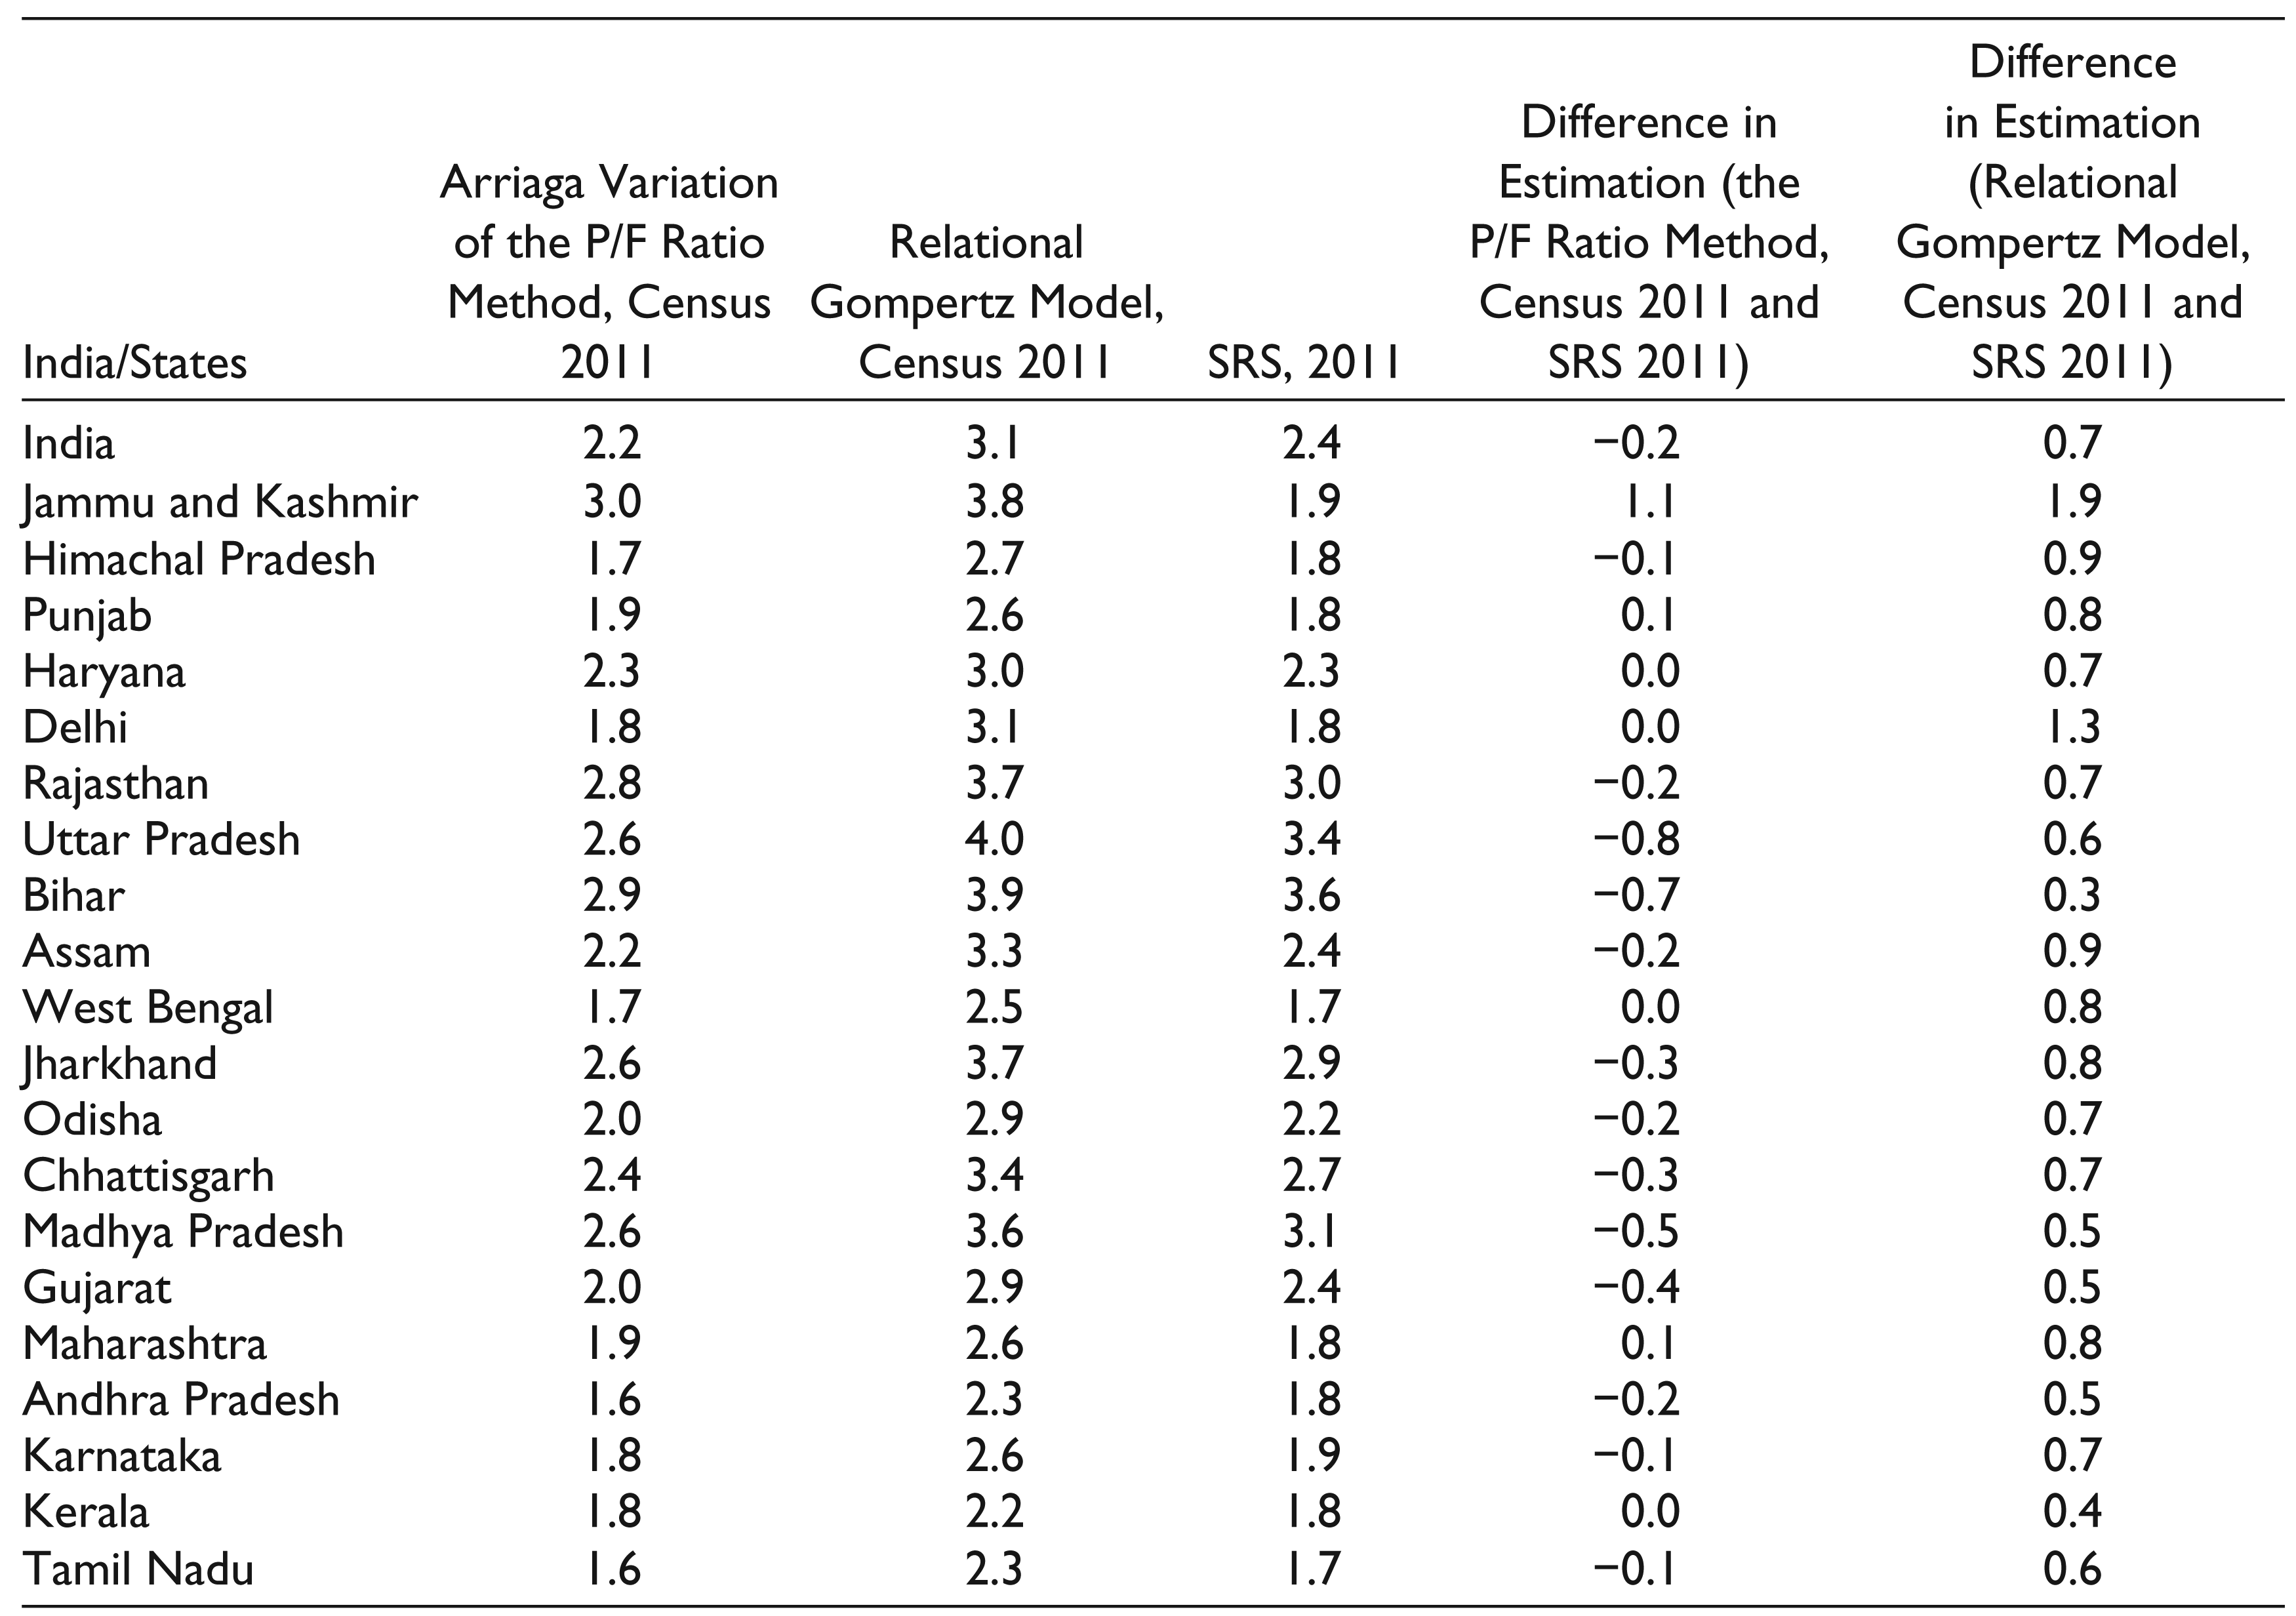
The correlation between SRS estimates and Gompertz relational model = 0.84.
The correlation between SRS estimates and the P/F ratio method excluding Jammu and Kashmir = 0.96.
The correlation between SRS estimates and Gompertz relational model excluding Jammu and Kashmir = 0.94.
On the other hand, except for the large states such as Uttar Pradesh, Bihar, Madhya Pradesh and Gujarat, the differences in estimates obtained from the SRS and Arriaga version of the P/F ratio method are generally extremely small. There are four states, namely, Kerala, West Bengal, Haryana and the National Capital Territory (NCT), where no difference in estimates derived from both these sources is found. Further, there are five more states, where differences in estimates were only ±0.1 point. Although examination of the reasons for higher differences in larger states in both rural and urban areas (not shown in Table 1) is beyond the scope of the article, it seems that Arriaga version of the P/F ratio method actually reflects rapid fertility decline in majority of the aforementioned states.
To note, for Jammu and Kashmir, the TFR estimates derived from Census 2011 using both the indirect methods are substantially higher as compared to the estimates provided by SRS. If Jammu and Kashmir is excluded from our analysis, the correlation coefficients between SRS and census estimates derived from the Arriaga variation were found to be 0.96 for the total population, while the correlation coefficient was 0.94 for the relational Gompertz model (Table 1). However, if we include Jammu and Kashmir, then the correlation coefficients between the said two methods of estimates reduced to 0.78 and 0.84, respectively. Guilmoto and Rajan (2013) have argued that a deliberate over-reporting of children in Jammu and Kashmir could be the reason and have questioned the quality of data for Jammu and Kashmir in Census 2011. In congruence with the aforementioned argument, we have also noticed such improbable TFRs for Jammu and Kashmir and have thus excluded Jammu and Kashmir from the rest of our analyses. As we found that Arriaga variation of the P/F ratio method provides more robust estimates of TFRs over the relational Gompertz model when we compared with SRS estimates, we have retained the Arriaga variation of P/F ratio in the rest of the analyses.
Estimates of Total Fertility Rates (TFR) for Hindus and Muslims and a Comparison with 2001 Estimates
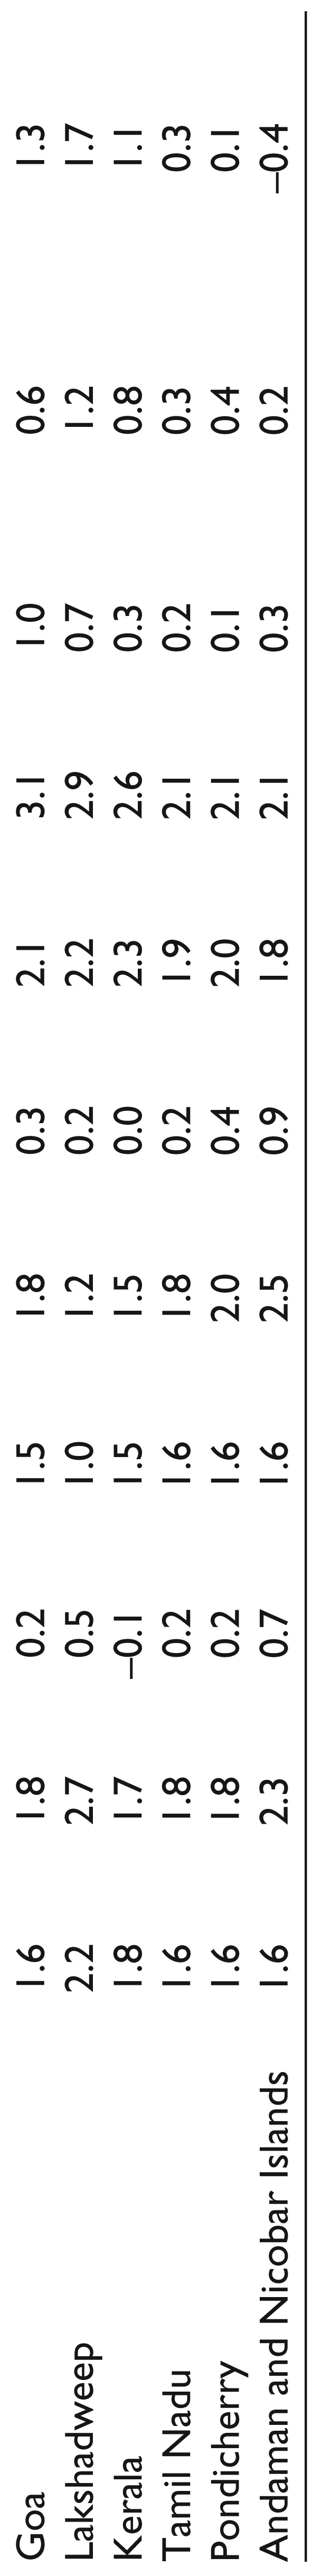
The data in Table 2 show estimates of TFRs by religion for all the states and union territories in India obtained by employing Arriaga version of the P/F ratio method and compare the estimates derived from the 2001 Census data by Rajan (2005) using reverse survival method. Both the estimates are not strictly comparable with each other for obvious reasons. Nonetheless, we have compared these estimates in Table 2 to get a sense regarding the extent of fertility decline in both the religions and also at the aggregative level.
At the all-India level, the decline of TFR was of 1.0 child per woman between 2001 and 2011. The TFR has declined from 3.1 to 2.1 (i.e., at the replacement level) among Hindus and from 4.1 to 2.7 among Muslims—that is, a decline of 1.4 children per woman. Apart from all southern states, most of the northwestern states and eastern states have achieved replacement-level fertilities in 2011 at the aggregate level. The smaller states of northeastern region, Goa and most of the union territories have also achieved such fertility levels. It is important to note that, at the aggregate level, the decline of TFR is found to be one or more children per woman in the states of Rajasthan, Uttar Pradesh, Bihar, Assam, Jharkhand, Chhattisgarh and Madhya Pradesh during 2001–2011, though these states are yet to attain replacement-level fertility.
Table 2 also reveals that apart from the southern states, TFR among Hindus is at or below the replacement level in most of the northwestern and eastern states. 3 Fertility among Hindus has reached or is below the replacement level in most of the northeastern states and the union territories as well. Though the TFR among Hindus has not reached the replacement level in states such as Haryana, Rajasthan, Uttar Pradesh, Bihar, Jharkhand and Madhya Pradesh, an absolute decline of one or more children per woman has been observed among the Hindu populations of these states.
The TFR among Muslims is at or below replacement level in Odisha, Andhra Pradesh and Tamil Nadu. Also, there are a number of states such as West Bengal, Chhattisgarh, Gujarat, Karnataka and Kerala, where TFRs among Muslims are close to the replacement level. Decline of the number of children per Muslim woman was found to be substantial in the states such as Haryana, Assam, Delhi, West Bengal and Jharkhand (almost two children per woman). The TFR among Muslims has been at or below the replacement level in some northeastern states as well. Additionally, fertility among Muslims was either at the replacement level or on the verge of reaching it in a number of union territories.
Table 2 also depicts the gap in TFR between Muslims and Hindus (TFR of Muslims—TFR among Hindus) for 2001 and 2011. At the all-India level this gap has been reduced by 0.4 children per woman between 2001 and 2011. Except for some union territories, the gap of TFR between these two religions has narrowed between 2001 and 2011. In most northeastern states, the gap has narrowed substantially—more than one child per woman. However, Christianity (neither Hinduism nor Islam) is the major religion in the northeastern states except Tripura. The reduction in the gap between the Hindu and the Muslim population also is also found to be more than one child or very close to one child per women in the two eastern states of West Bengal and Assam. A similar reduction was also noticed in Kerala. However, the pace of narrowing of this gap has remained slow in the central provinces which have relatively higher fertility and a larger share of the Muslim population. Though the gap between the TFR of Muslims and Hindus remained same in Madhya Pradesh and Gujarat, these states have a low share of the Muslim population.
Estimates of Total Fertility Rates for All Religions, Hindus and Muslims by States (excluding Jammu and Kashmir), according to Census 2011 and a Comparison with Estimates from Census 2001
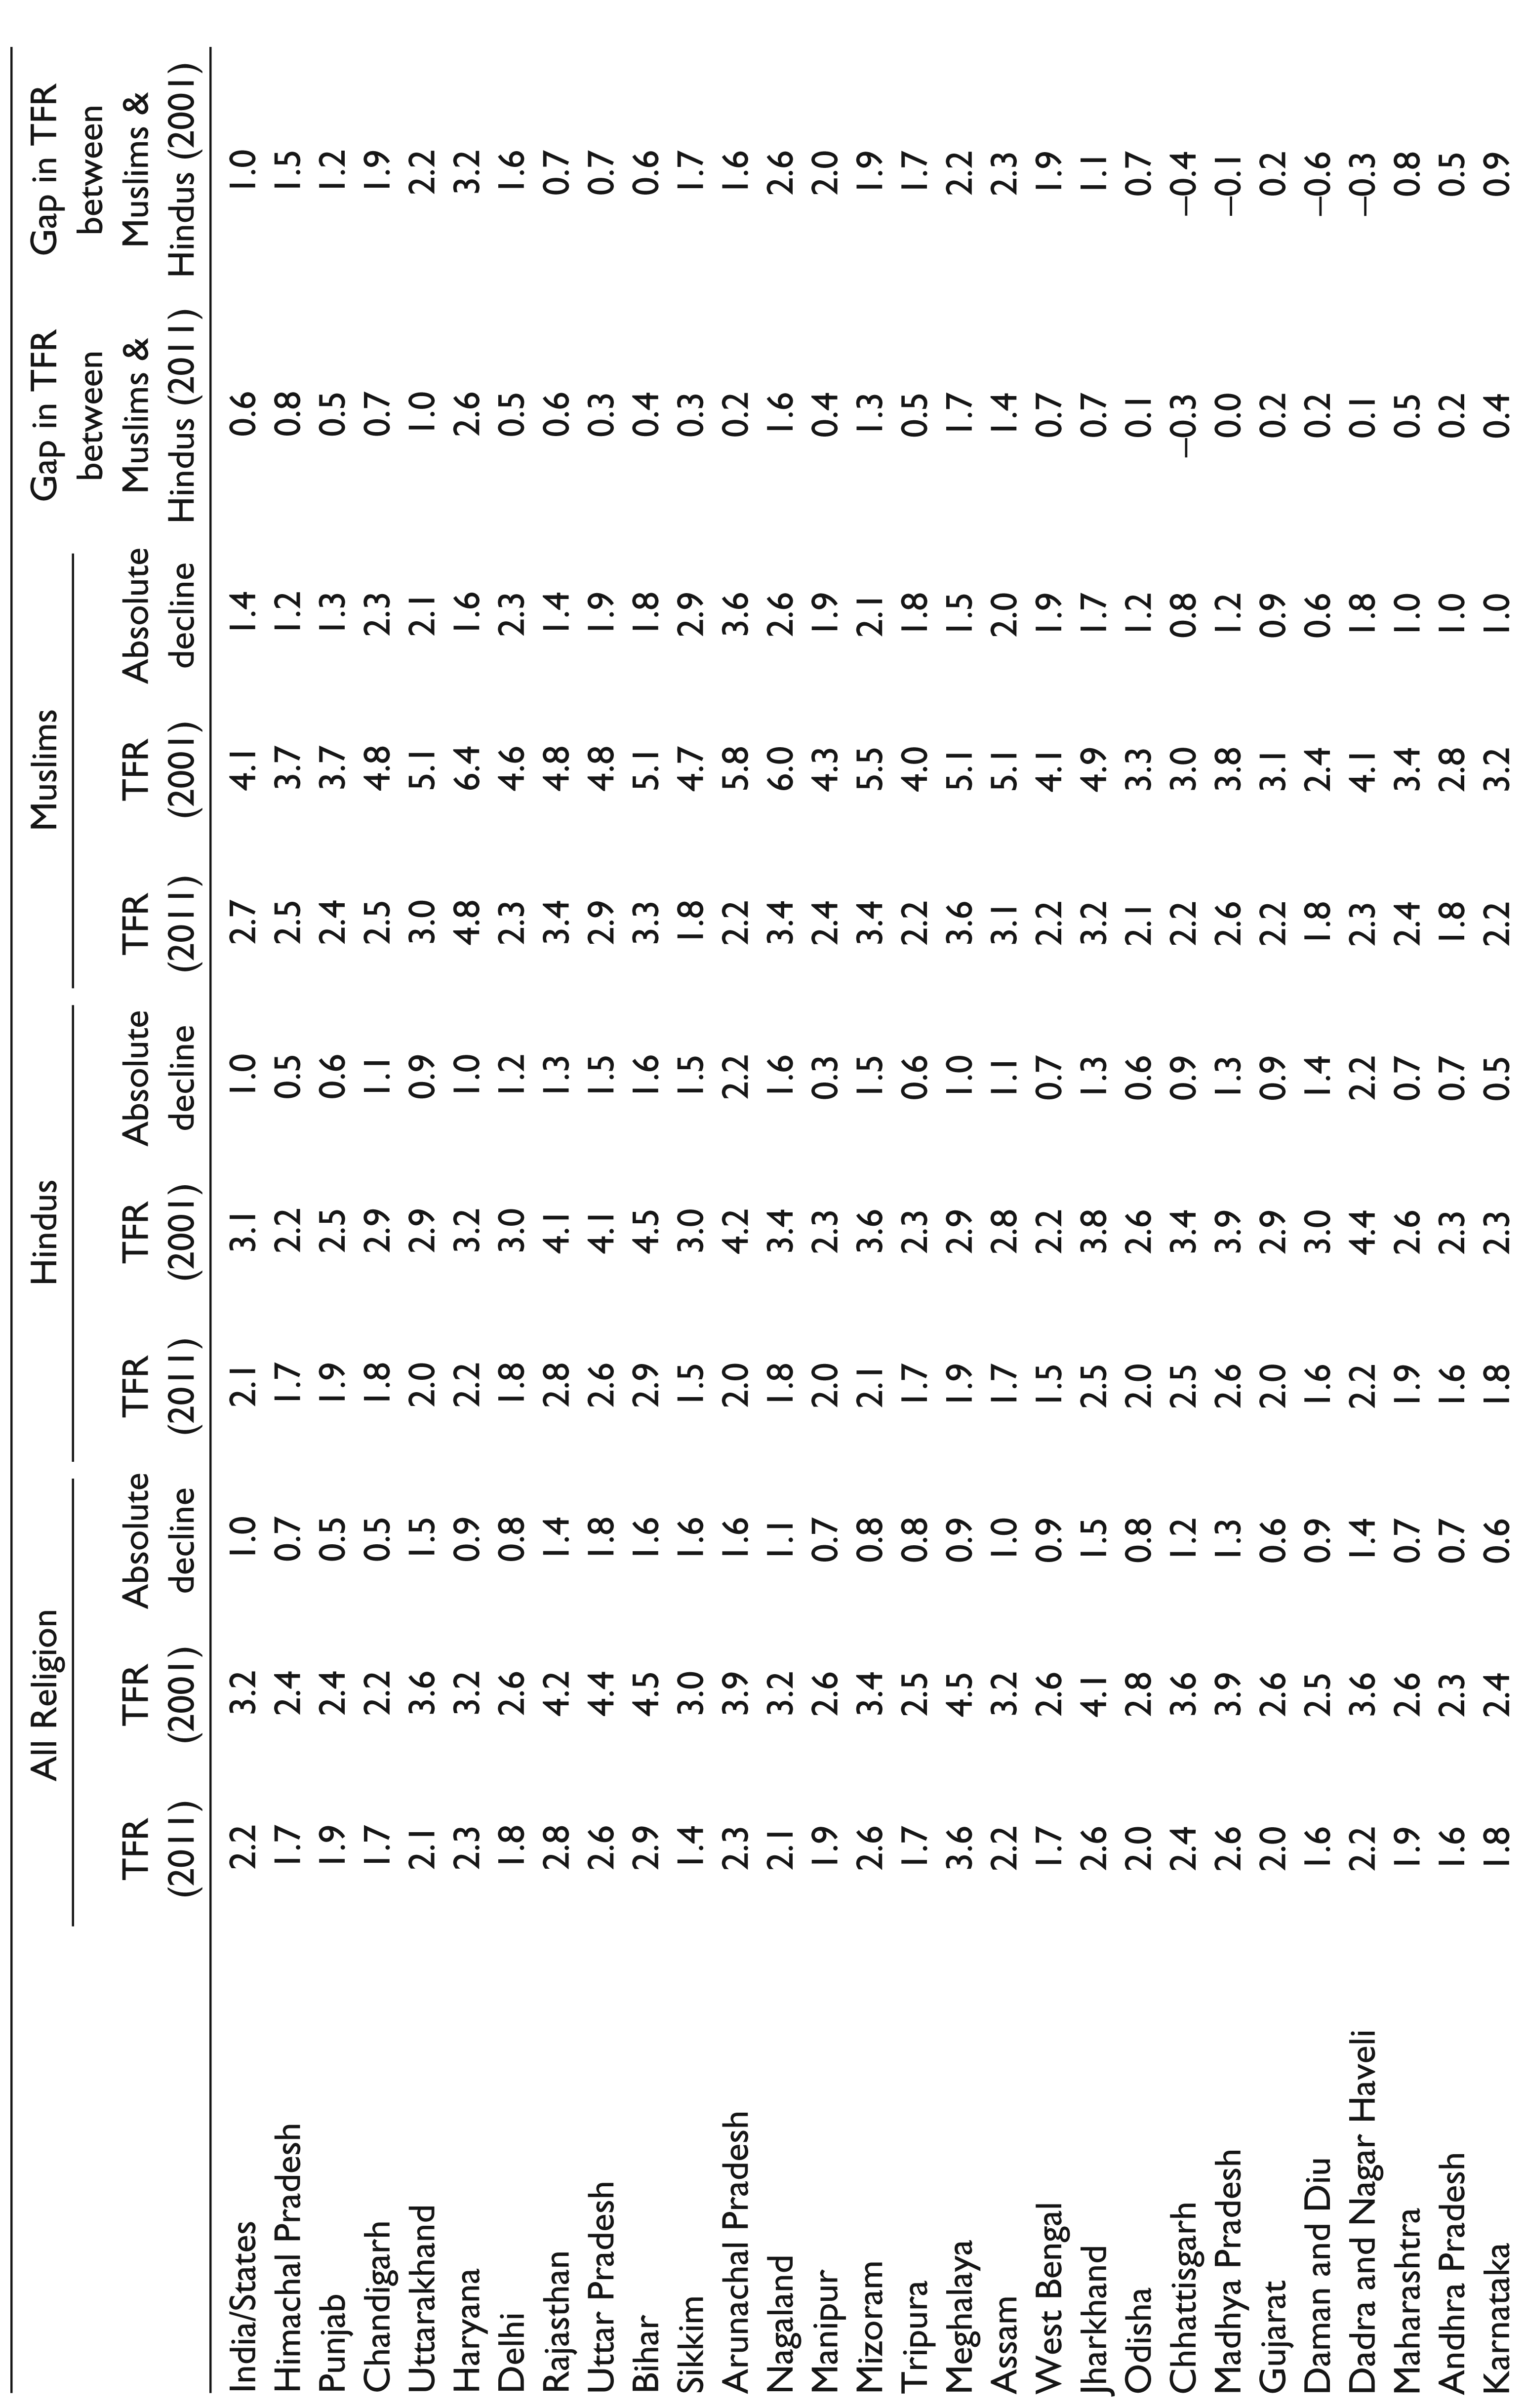
Thus, comparing state-level fertility differentials between Hindus and Muslims as estimated from Census 2011 and Census 2001, it can be ascertained that though the overall convergence of fertility between Hindus and Muslims has been underway, significant regional variations persist in the process of convergence since different states and religious groups are at different stages of transition as observed in the earlier studies as well (e.g., Alagarajan & Kulkarni, 2008). Those states, which have achieved fertility transition during the last decade, show that the reduction of gap in the fertility of Muslims and Hindus was also faster compared to those states which are in the middle or early stages of fertility transition.
Estimates of Fertility at the District-level from 2011 Census
Table 3 presents the percentage of districts that fall under different fertility levels for Hindus and Muslims by states and union territories. 4 Out of 618 districts, the TFR of Hindus has reached or is below the replacement level of fertility in about 54 per cent of the districts (331 districts), while the TFR of Muslims has attained such a level in 35 per cent of the districts (217 districts). After calculating district-level TFR from the 2001 Census, Rajan (2005) found that TFRs among Hindus had attained replacement levels in 79 districts and among Muslims in 26 districts out of the 594 districts covered in the 2001 Census.
TFR among Hindus has reached or is below the replacement level in all the districts of the three South Indian states except Karnataka. TFR among the Hindu population has attained this level in more than 90 per cent of the districts in the states of Punjab, Himachal Pradesh, Assam and West Bengal. A significant proportion of districts in the northeastern states and union territories has attained or is below replacement-level fertility for Hindus. On the other extreme, fertility among Hindus has attained such a level only in a few districts in the states of the north-central province. Notably, none of the districts in Bihar has attained such low levels of fertility for the Hindu population. However, in majority of the districts (more than 70%) in these states, where fertility transition is underway among the Hindu population, the TFR for Hindus is between 2 and 3. There are also about 20–35 per cent of the districts in the states of the north-central province where TFR among Hindus is between 3 and 4. It is interesting to note that out of 618 districts, in only 1 district in Meghalaya is the TFR among the Hindu population as high or more than 4 births per woman in 2011.
Districts Falling Under Different Levels of Fertility for Hindus and Muslims for All States in India (Excluding Jammu and Kashmir)
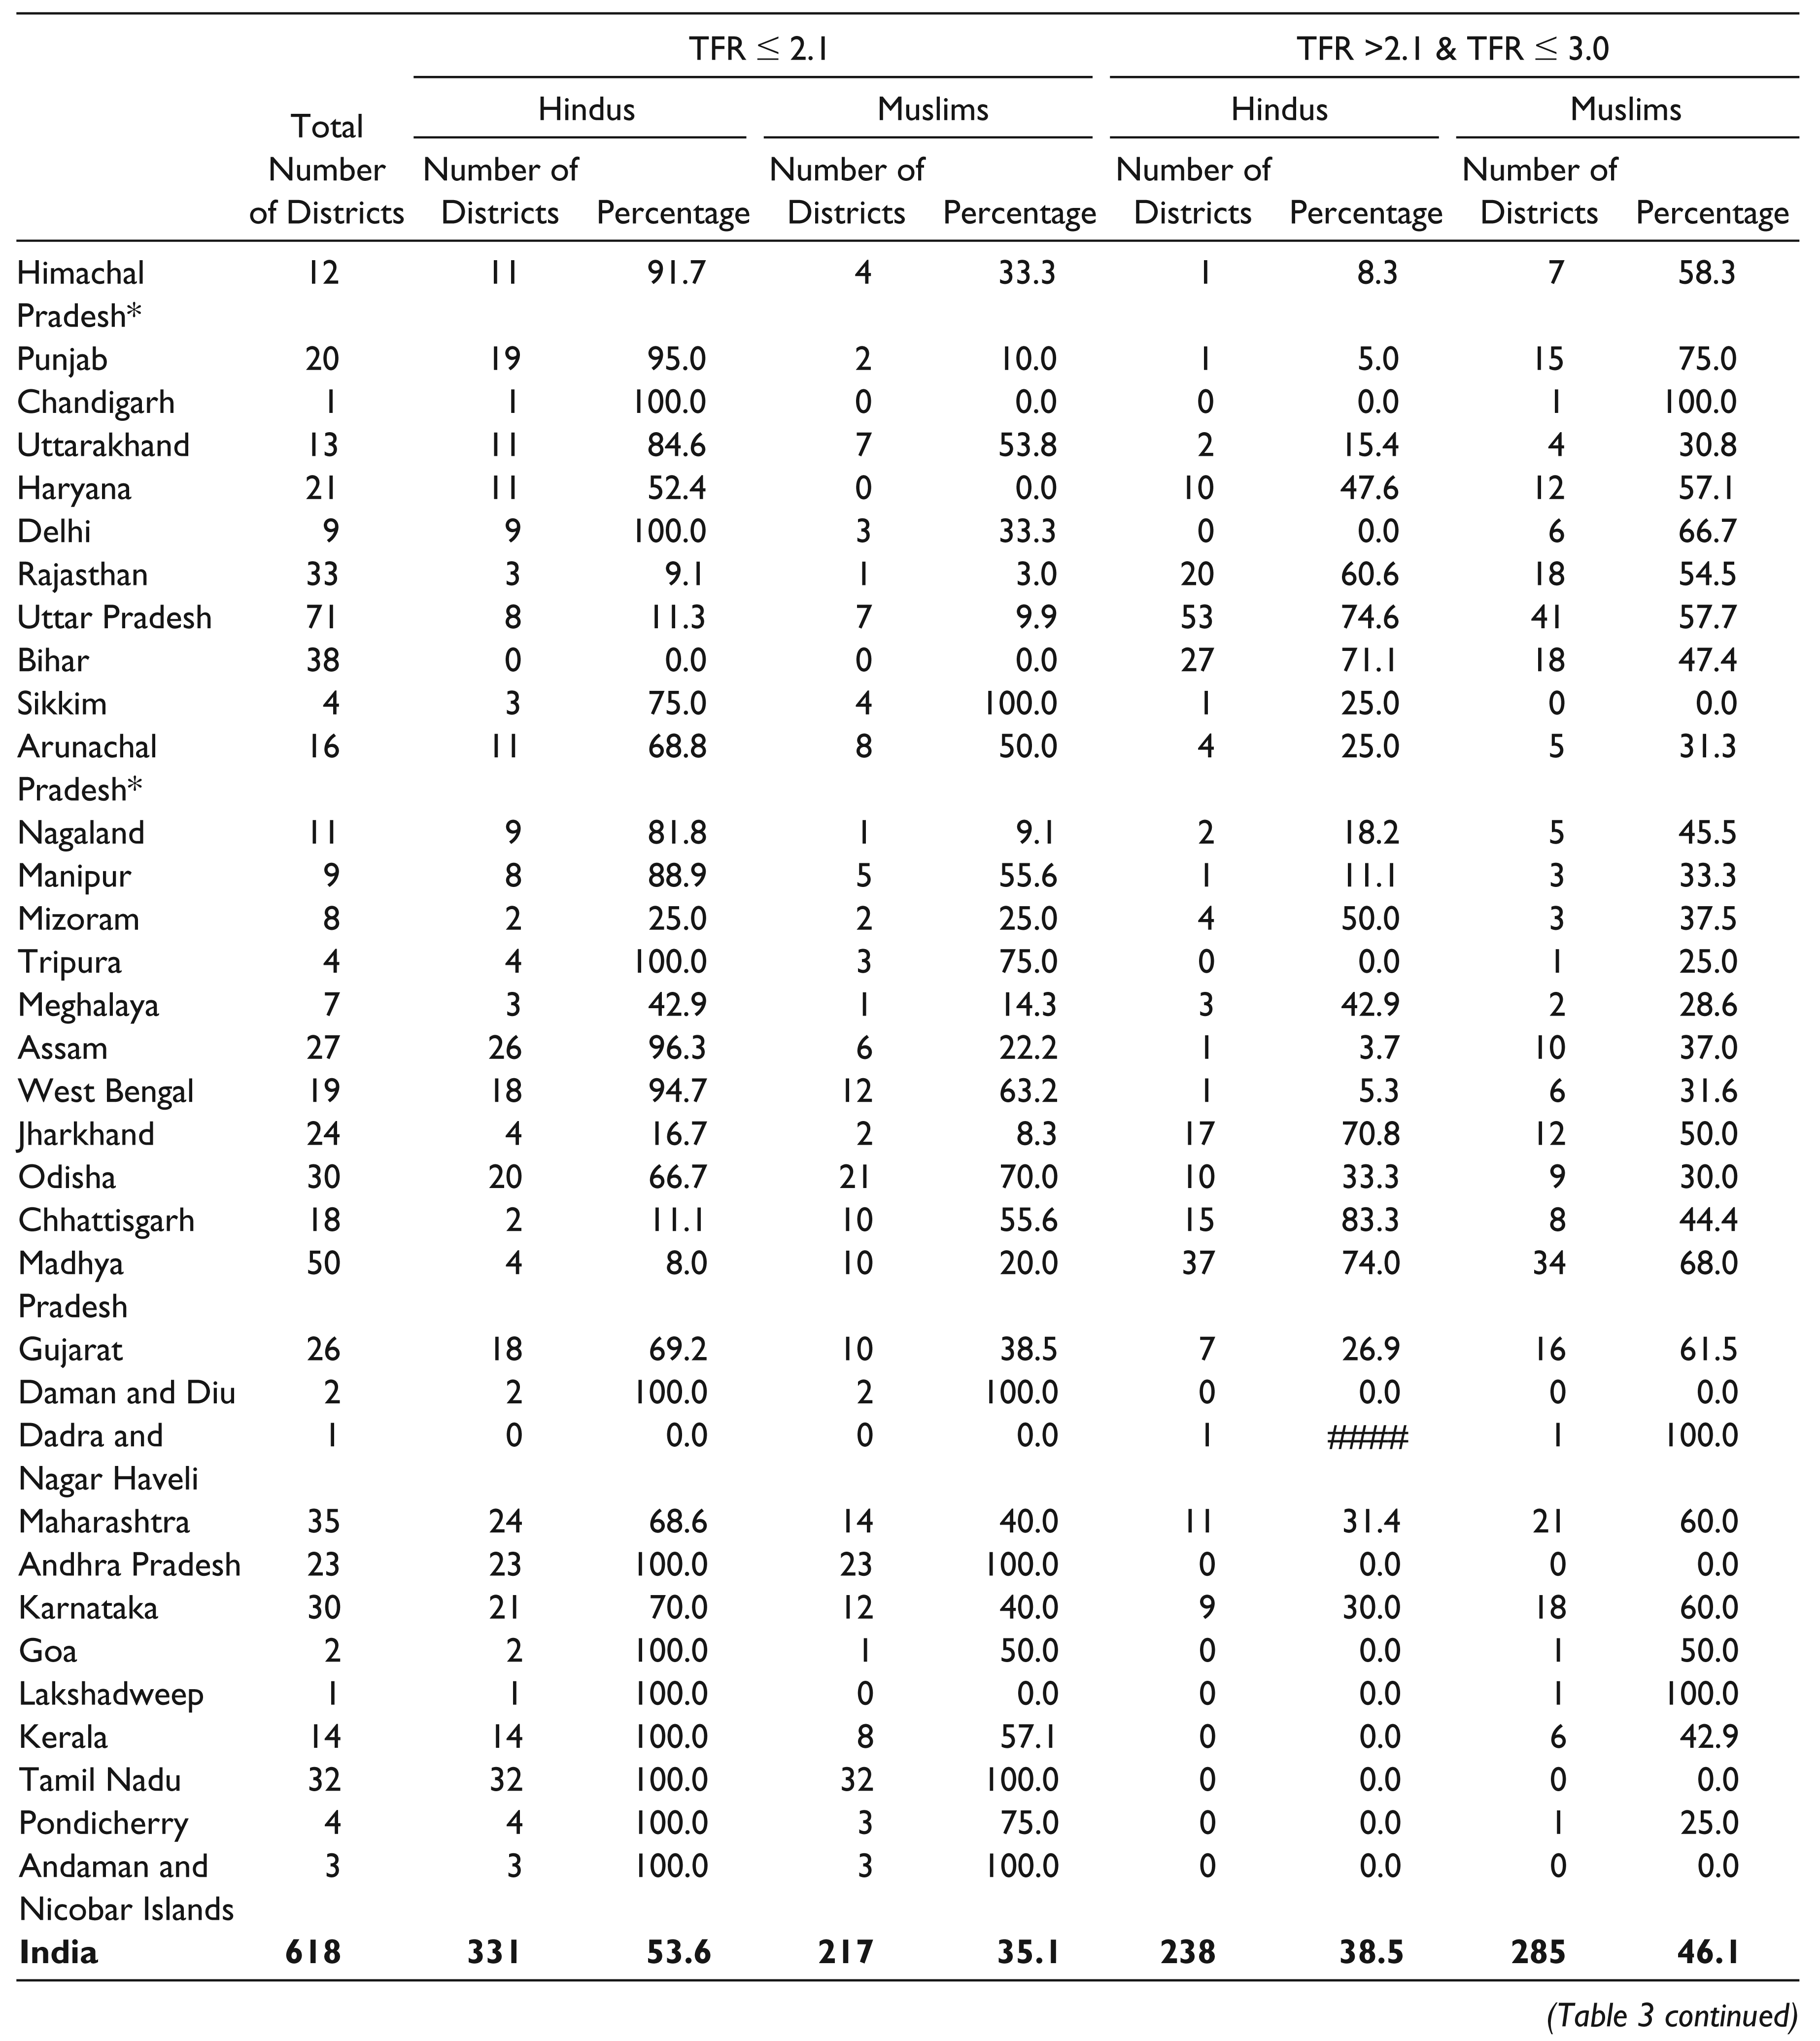
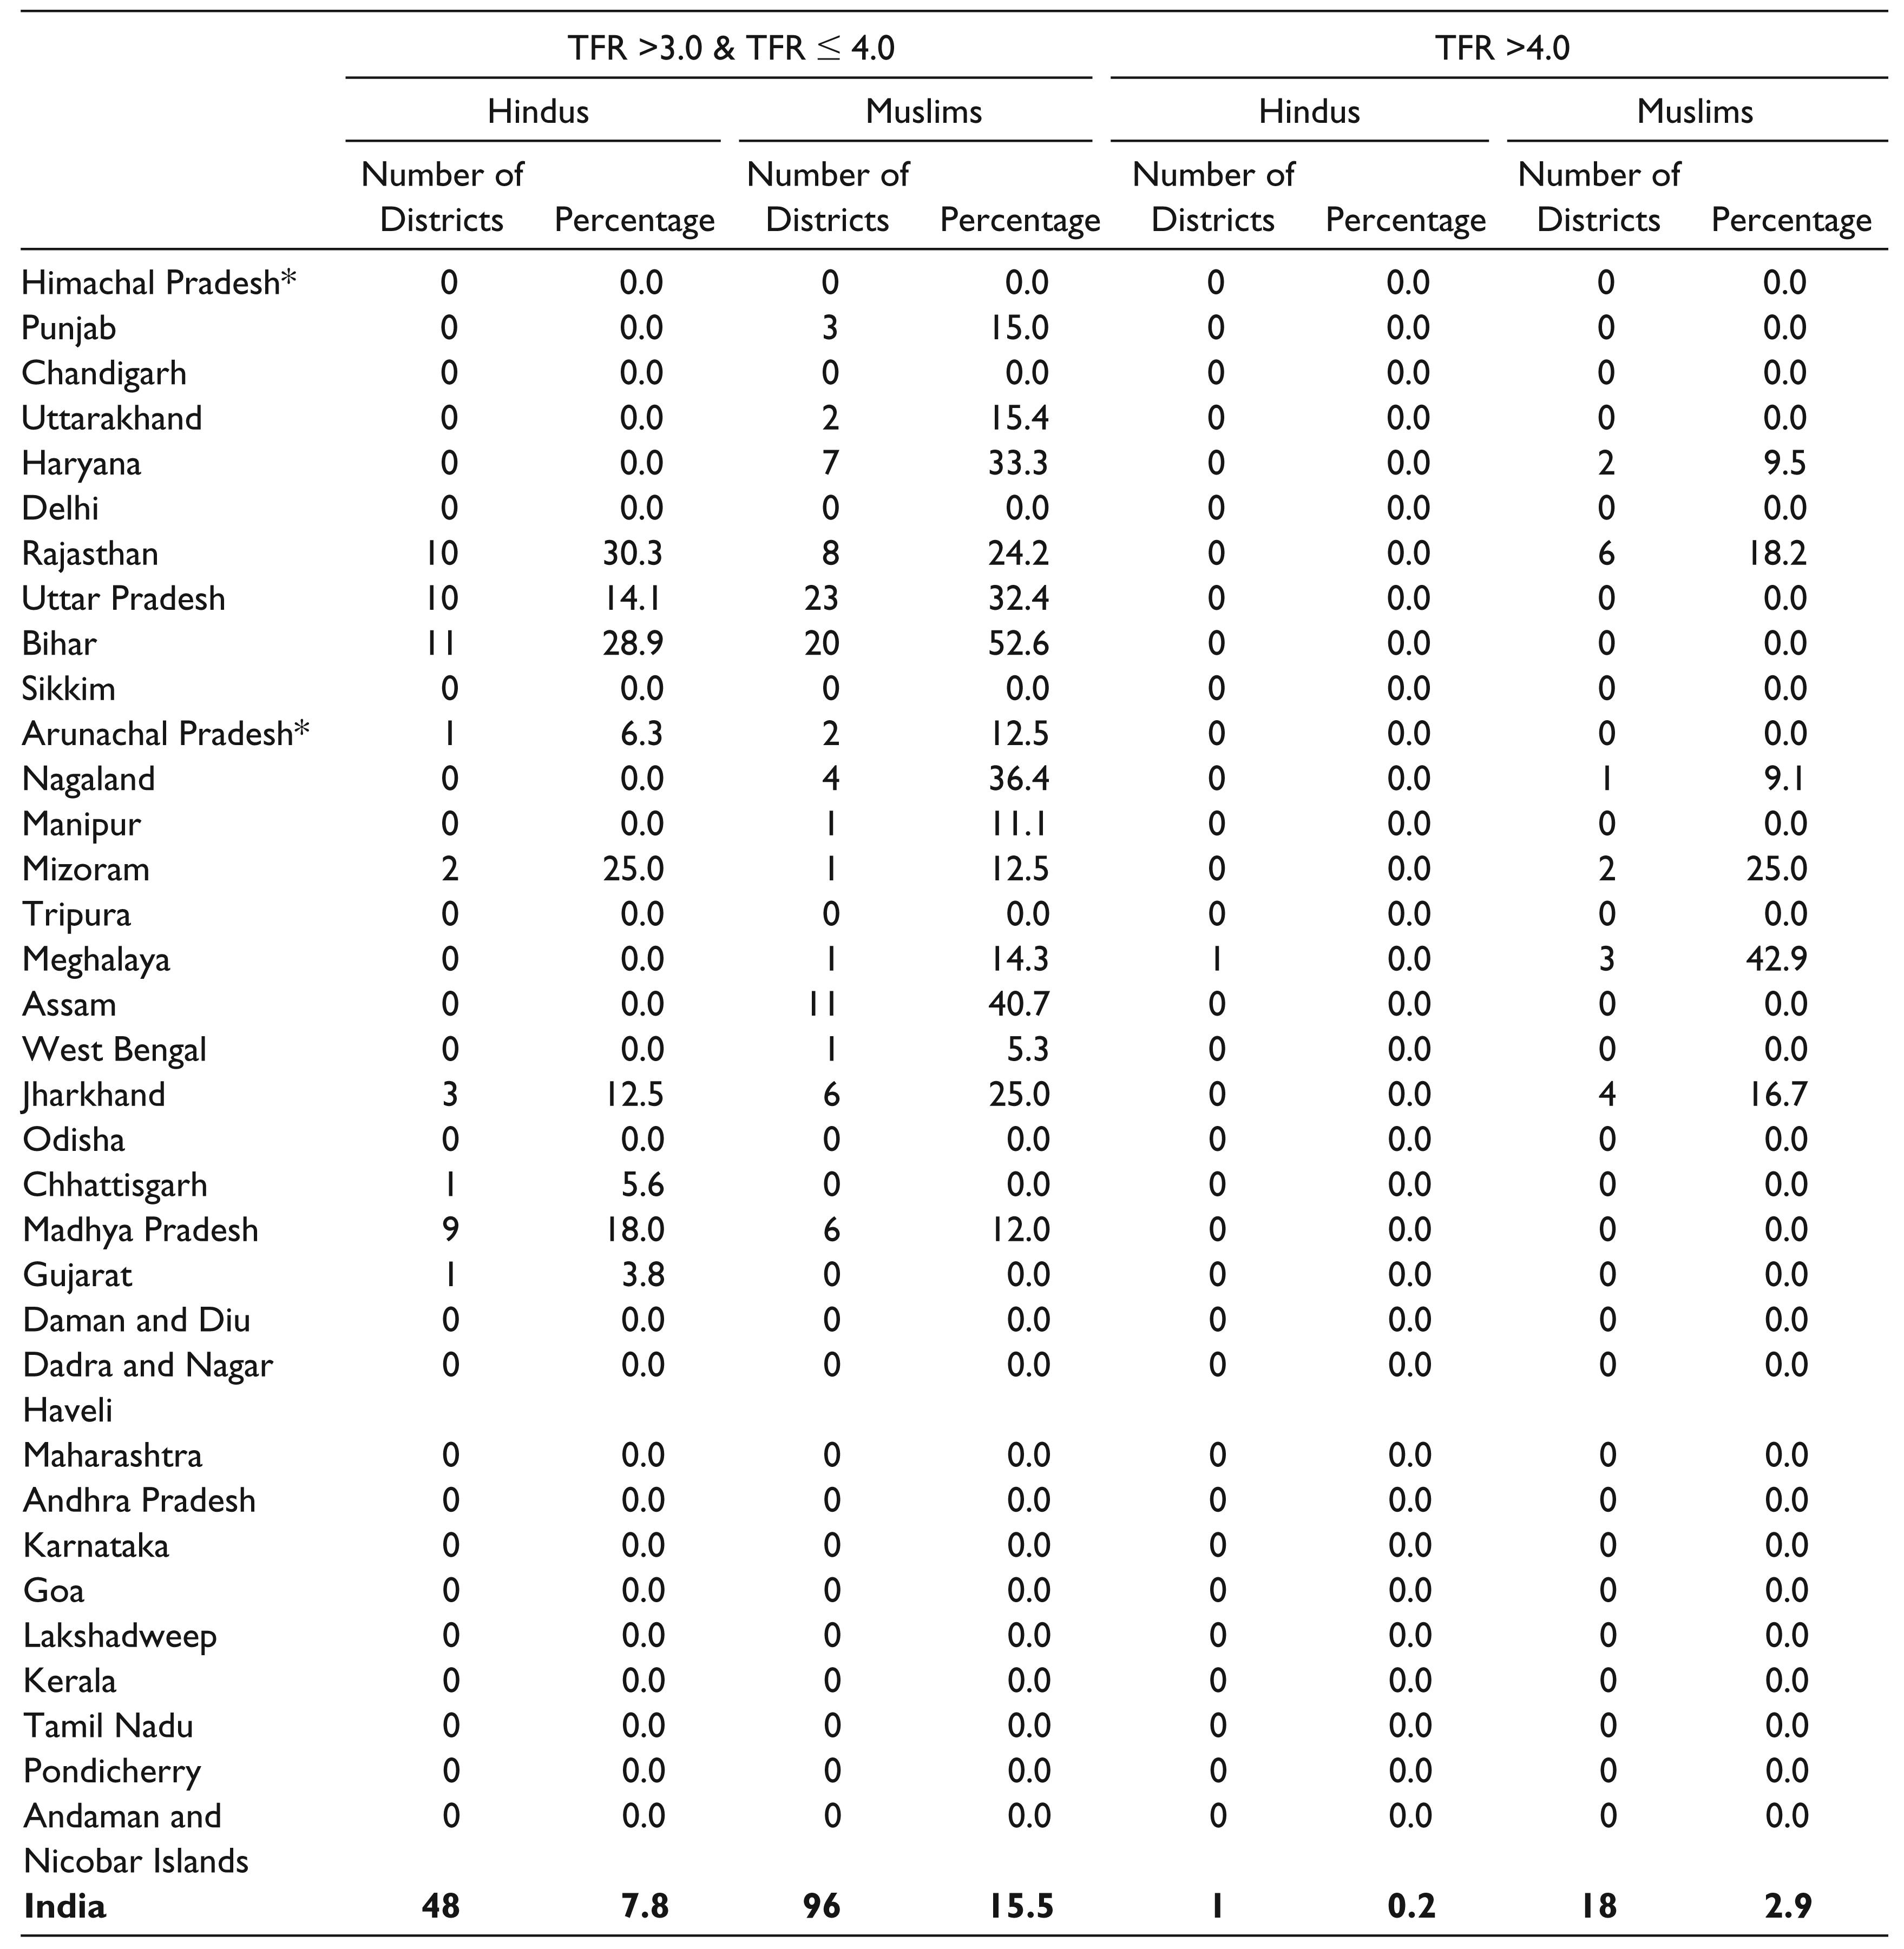
In all the districts of Andhra Pradesh and Tamil Nadu the TFR among Muslims has reached or is below replacement levels. Among smaller states, TFR among Muslims has reached such a level in Sikkim. Besides, TFR among Muslims attained such a level in a significant proportion of the districts in Odisha, West Bengal, Uttarakhand, Kerala and Chhattisgarh. In almost all the remaining districts in these states, TFR among Muslims is between 2 and 3 and is approaching the replacement level. In majority of the northeastern states, TFR among Muslims is between 2 and 3 in more than one-third of the districts. Like Hindus, TFR among Muslims is also high in the north-central province. Only in a few districts (and no district in the state of Bihar) in these states, TFR among Muslims is at a low level. Also, there are a substantial proportion of districts in these states where TFR among Muslims is between 2 and 3 as well as 3 and 4. There are also few pockets (18 districts) of very high fertility (TFR > 4) levels located in Rajasthan, Bihar, Jharkhand and Meghalaya.
Generally, it has been observed that in areas with a considerable decline in fertility there is hardly any district with very high fertility among Muslims. Notable exceptions are Assam and Haryana.
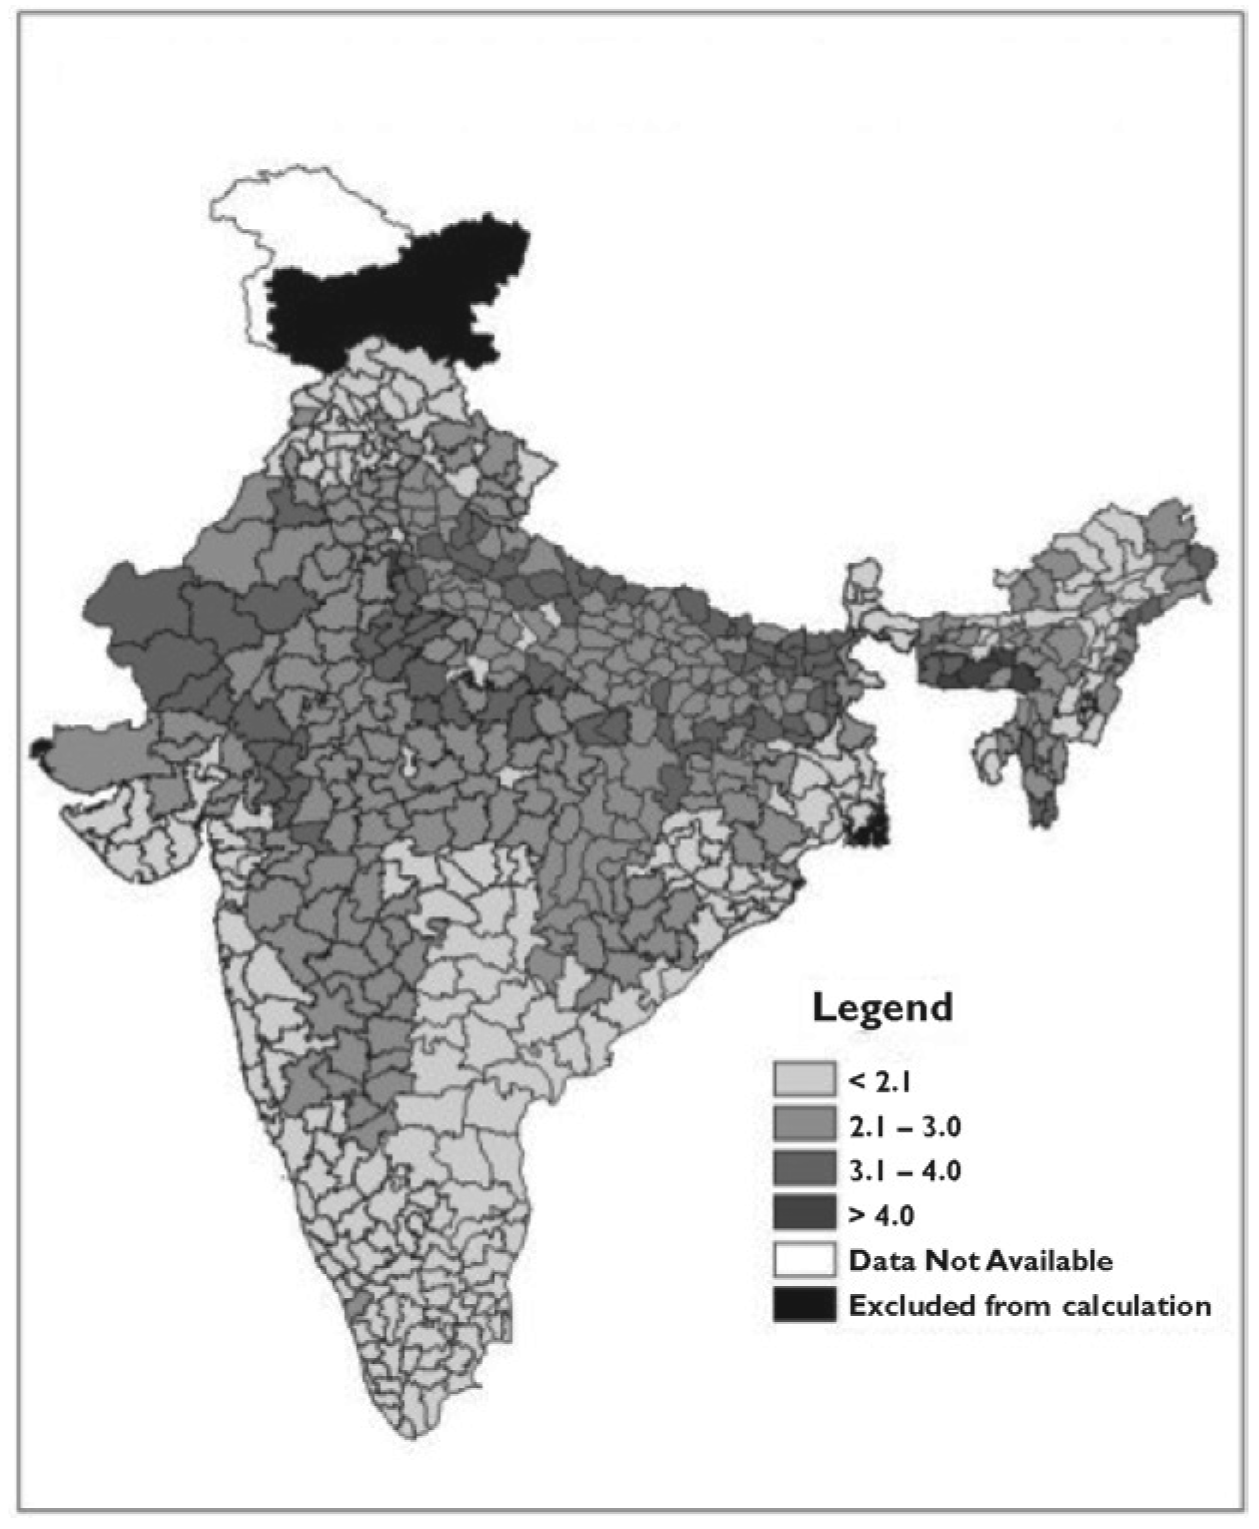
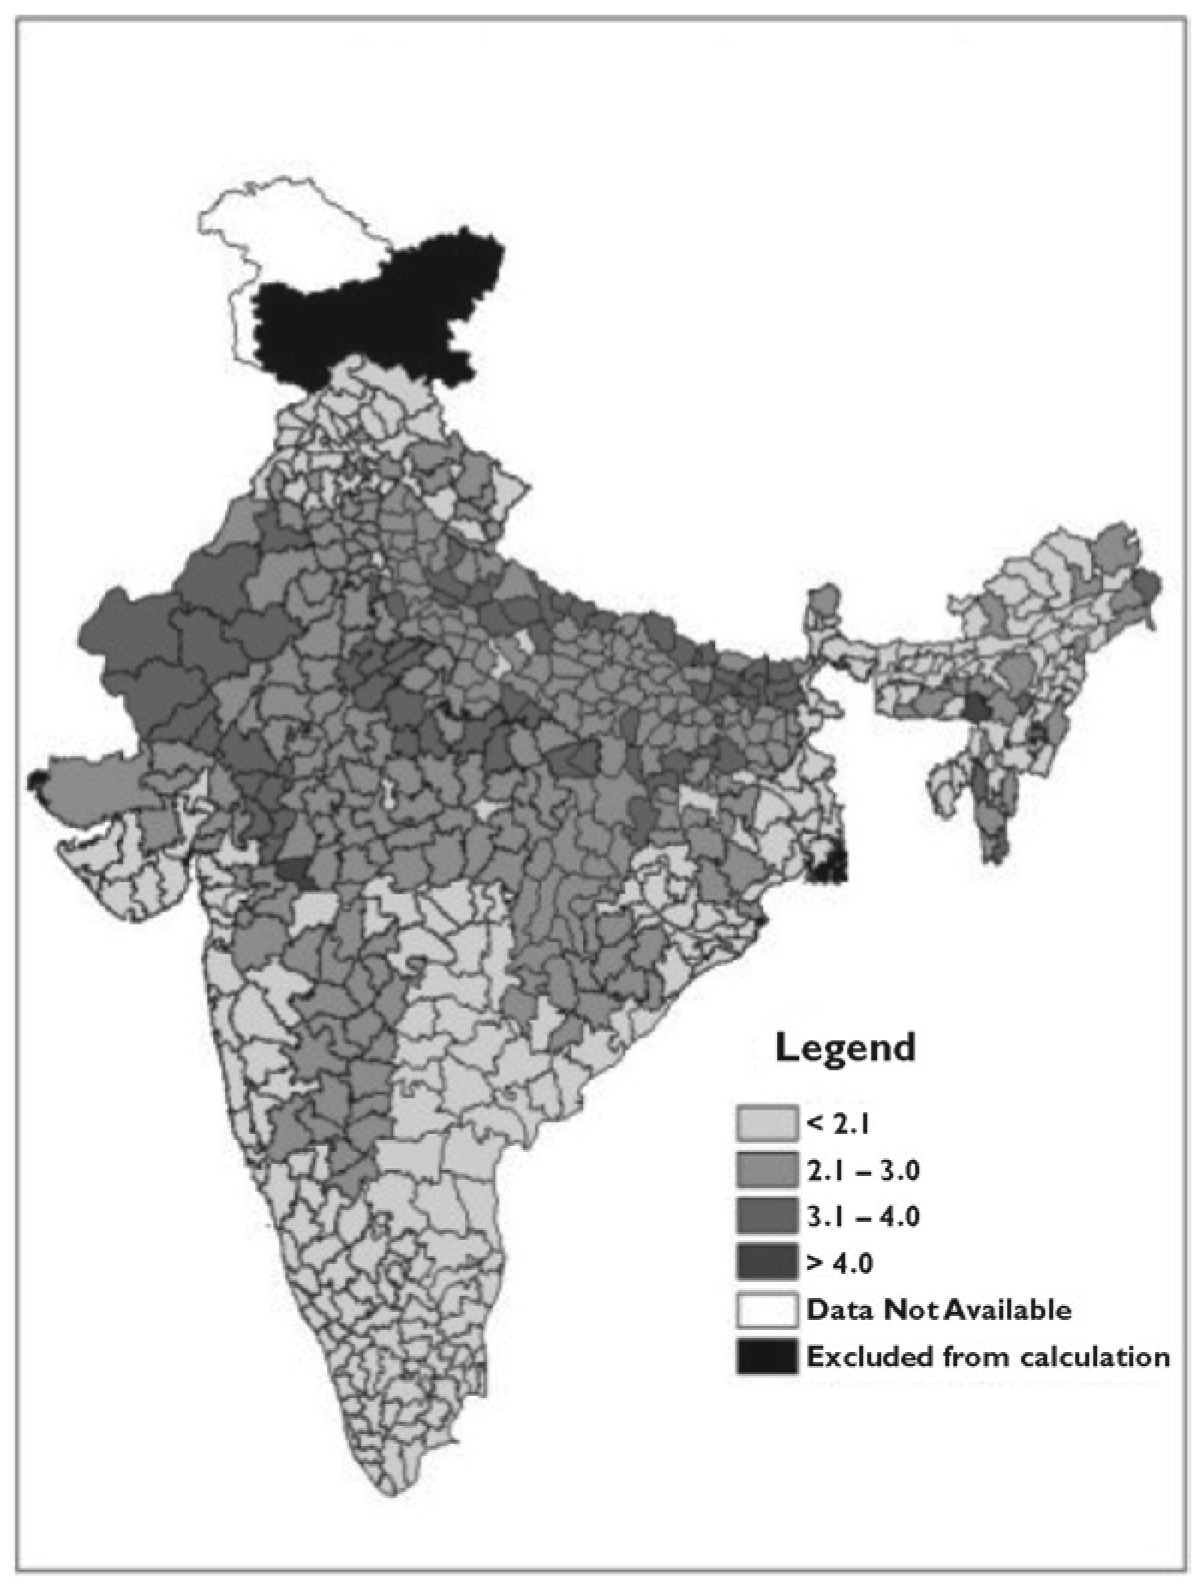
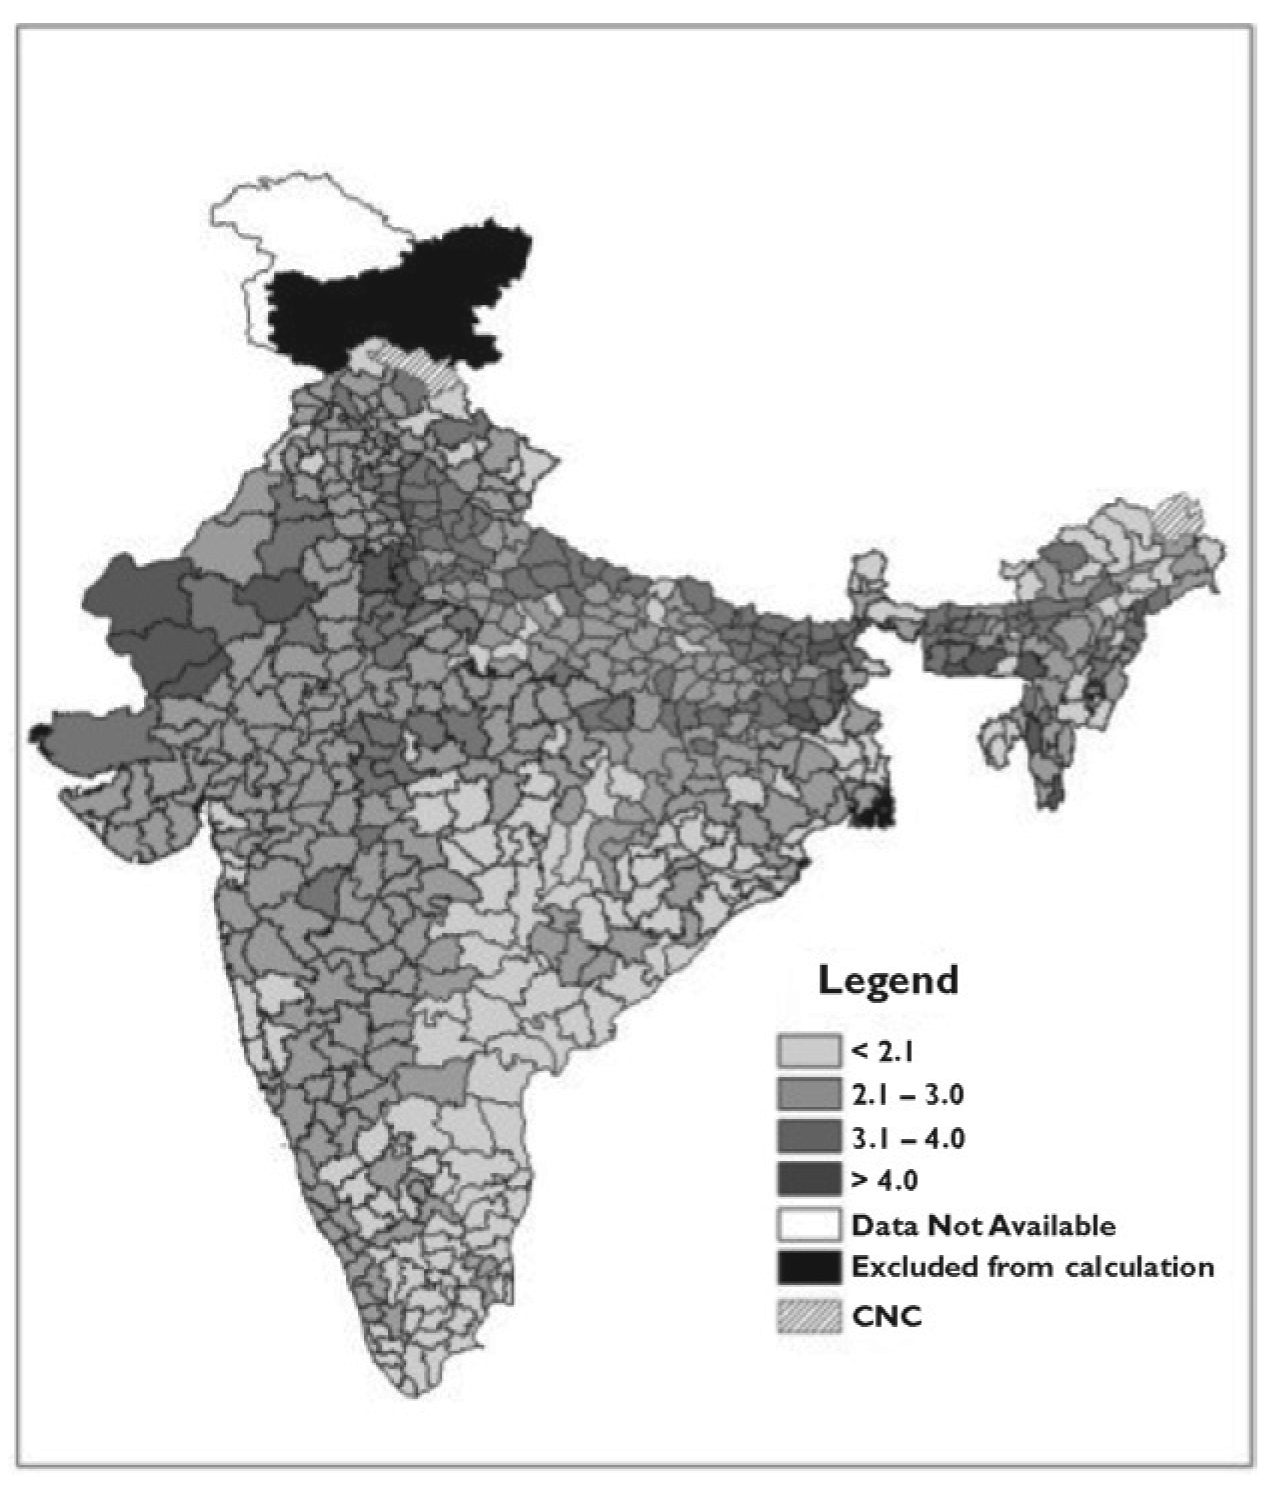
Earlier studies on regional variation in fertility empathetically concluded higher fertility in the northern compared to the western and southern parts of India (Bhat, 1996; Guilmoto & Rajan, 2001). From Figures 1–3, one can argue that not only the western and southern parts of India but also eastern states of West Bengal and Odisha and some of the northeastern states have undergone fertility transition. Fertility transition among Hindus was found to be widespread (Figure 2) encompassing the entire southern, northwestern and eastern part of the country. Decline of fertility among the Hindu population has also spread in the northeastern parts to a considerable extent. Even in the relatively high-fertility north-central zone, there are few pockets of low-fertility areas for Hindus (Figure 2). Fertility is reached or is below the replacement level among Muslims in a majority of the districts in the southeastern region of India including the extreme south and in the districts of hilly terrains and the high altitude of north (Figure 3). Besides, fertility among Muslims also reached a low level in some parts of the northeastern and eastern parts. There are few districts along the Arabian coast and in some pockets in the north-central India where fertility among Muslims has reached the replacement level. Fertility transition among Muslims has been underway in most of districts of the south-central region and also in eastern and northeastern region except in few pockets (Figure 3). Thus, one can argue that although fertility among Muslims is higher compared to that of Hindus, there is a clear sign of convergence in the fertility of Hindus and Muslims, which is at or below replacement levels across different regions in India in the foreseeable future.
Conclusions
The article estimates the Hindu–Muslim fertility differentials at the state and the district level by using Arriaga variation of the P/F ratio method. In the absence of a sound civil registration system, SRS has been the major source of fertility estimates at the state level. However, SRS neither provides fertility estimates by religion nor at the district level. The results of this exercise, by and large, appear to be reliable as state-level TFR strongly corresponds with SRS, except for a few large states. The major outcome of the current analyses is to provide an in-depth picture of Hindu–Muslim fertility differentials at the district level and trends at the state level.
It may be ascertained from the present analysis that the fertility transition in India has been steady during the last decade. Moreover, such transition has been underway for both Hindus and Muslims, at a varying pace, when compared to the state-level indirect estimates of the 2001 Census. It has also been observed that though the overall convergence of fertility between Hindus and Muslims has been underway, significant regional variations persist.
If such transition is sustained, the national-level TFR will reach the replacement level within the next few years. This corresponds to the projection of TFR by Bhat (2009); however, this decline is faster than the projection by the Population Division of United Nations. There are many districts across India where a decrease in TFR levels greater than one child per woman is discernable for both Hindus and Muslims. We have also observed some “ultra-low” fertility zones where TFR is 1.0 or just above. These districts are Kolkata of West Bengal, Shimla of Himachal Pradesh and some other high-altitude districts of Himachal Pradesh and northeastern states, where the TFR of both the religions is “ultra low.” Further studies may try to explore the reasons for such “ultra-low” fertility among both the religious groups in these districts of India.
Declaration of Conflicting Interests
The author declared no potential conflicts of interest with respect to the research, authorship and/or publication of this article.
Funding
The author received no financial support for the research, authorship and/or publication of this article.
Footnotes
Acknowledgements
The earlier draft of the article was presented in 37th Conference of the Indian Association for the Study of Population held at the Institute of Economic Growth on 7–9 December 2016. The comments received from the discussant and participants helped immensely improve the article. The author sincerely extends thanks and gratitude to the Dr Subhanil Chowdhury of IDSK for his comments and suggestions in the earlier version of the article. Assistance provided by Saurav Chakraborty and Kakoli Das in creating figures is also gratefully acknowledged.