
Abstract
This article uses the annual estimates of the human development index (HDI) prepared by the Global Data Lab of the Radboud University of The Netherlands to analyse the progress of human development in India during 1990–2015. The analysis reveals that human development in the country remains comparatively low by global standards and there are considerable variations in human development across states/union territories, although there is evidence of convergence in human development across states/union territories. The decomposition of the improvement in the HDI indicates that the progress in human development in the country has primarily been the result of the progress in the education dimension whereas the contribution of the progress in the dimension of health or well-being has been the smallest. The article calls for redesigning the National Sample Survey to generate data necessary for the estimation of the HDI on an annual basis at national and state/union territory level.
Introduction
It was way back in 1990 that the United Nations came up with the first human development report in an attempt to shift the focus of development policies and programmes from purely economic considerations to challenging human welfare concerns (United Nations, 1990). The report emphasized that people were the real wealth of any society. Therefore, the basic objective of all development efforts must be to create an enabling environment for the people to live long, healthy and creative lives. The very philosophy that the people must be at the centre stage of all development efforts is, however, not new. It has been articulated in different ways by Aristotle, Lagrange, Smith, Ricardo, Marx and Mill. However, the concept of development with people at the centre has repeatedly been obscured by the development framework that concentrates on the expansion of the output of the social and economic production system and creation of wealth. The people-centred development argues that expansion of the output and creation of wealth is only a means of human well-being. It is and should not be the end of development.
The unique and, perhaps, the most important feature of the 1990 human development report was the introduction of the human development index (HDI) as a simple, yet straightforward and widely appealing, measure of human progress. HDI is now used universally to monitor human development. United Nations ranks its member countries on the basis of HDI— higher the HDI, more developed the country. A high rank in HDI is frequently used as a means of national aggrandisement whereas a low rank is used to highlight national insufficiencies (Chaurasia, 2013). After its introduction in 1990, HDI has also gone through evolutionary ups and downs in terms of its construction, although the core dimensions of the index have remained unchanged (Kovacevic, 2010).
In India, despite all emphasis on human welfare and improvement in the quality of life of the people at the policy level, the human development movement has never been strong. The lopsided attention paid to measuring and monitoring human progress in India’s development planning and programming process may be judged from the simple fact that the country prepared and released its first official human development report only a decade after the release of the first human development report by the United Nations. The 2001 national human development report was followed by the second human development report in 2011 only (Government of India, 2002, 2011). The country has no institutional mechanism to measure and monitor human progress. Estimation of HDI, in India, essentially, remains an ad-hoc exercise so that its impact in terms of influencing development planning and programming has always remained symbolic. In recent years, pertinent human development issues and concerns facing the country have almost been overridden by the preoccupation with economic growth. It is argued that economic growth is sufficient to address human development issues facing the country. It is however well known that mere economic growth may not be sufficient to ensure sustained human progress (Ghosh, 2006; Reddy, 2009; Saxena & Deb, 2016; United Nations, 1990). It is argued that economic growth may be accompanied by the increase in income inequality and growth of unemployment. The evidence suggests that the conventional wisdom that “grow first and worry about human development later” is not supported by data (Ranis, 2004). It is, therefore, advocated that the human development should be given a priority where a choice is necessary (Ramirez, Ranis, & Stewart, 1998). In the Indian context, it has been observed that the increase in per capita income is not translating into human well-being that signifies the rising influence of other factors in deciding human development (Mukherjee & Chakraborty, 2010). It has also been found that the influence of public expenditure on human development activities is more than that of economic growth on human development (Gopalkrishna & Rao, 2012). After all, the concept of human development spans far and beyond the realms of economic well-being and captures such dimensions as politics, human rights, education, health and so on that influence human progress.
A major constraint to making human development central to development planning and programming is the challenge of measuring human development. HDI is the most widely used measure of human development. It was first proposed by Haq (1999) and later used by the United Nations since 1990 to measure and monitor human progress. Despite its universal use now, HDI has been criticised on many grounds (Anand & Sen, 1992; Booysen, 2002; Castles, 1998; Dasgupta & Weale, 1992; Desai, 1991; Doessel & Gounder, 1991; Hicks, 1997; Hopkins, 1991; Kelley, 1991; Kovacevic, 2010; Lind, 1992; Lüchters & Menkhoff, 1996; Lutz & Goujon, 2004; McGillivray, 1991, 1992; Pyatt, 1991; Rao, 1991; Ravallion, 1997; Sagar & Najam, 1998; Srinivasan, 1994; Streeten, 1995; Trabold-Nübler, 1991; Wolff, Chong, & Auffhammer, 2011) and a number of alternatives to HDI have been proposed including the very recent human life indicator (Ghislandi, Sanderson, & Scherbov, 2019). In India, even the use of HDI to measure and monitor human progress and to give human development orientation to development planning and programming is fraught with the availability of HDI estimates for the states and union territories of the country on an annual basis. This is so when the Government of India, in collaboration with the United Nations Development Programme (UNDP), had launched two projects—Strengthening State Plans for Human Development (Government of India, 2010) and Human Development towards Bridging Inequalities (Government of India, 2015). Estimation of HDI for the country and its states and union territories on an annual basis, as is done by the UNDP for its member countries, could never be institutionalized in India’s development administration system for at least two reasons. First, there has never been any attempt to institutionalize a system at national or at state/union territory level to estimate HDI on an annual basis as is the case with the estimation of the gross domestic product. Estimation of HDI in India has largely been an ad-hoc exercise, primarily, of academic interest. Second, there has been little attempt to develop and institutionalize the human development data system that can generate data to regularly calculate HDI, at least, for the country and its constituent states/union territories. One fallout of the ad-hoc approach adopted for the estimation of HDI at national and state/union territory level in India has been that human development could never become the basis for setting development priorities, for development planning and programming, and for measuring and monitoring development. The primary emphasis of development planning and programming in India has always remained and continues to be the domestic product or the output of the economy.
Recently, the Global Data Lab located at the Institute of Management Research of the Radboud University of The Netherlands has released the subnational version of the United Nations HDI (Smits & Permanyer, 2019). The subnational HDI shows the variation in the HDI in more than 1,600 regions in 160 countries of the world since 1990 including 37 states and union territories of India as they existed in 2015. The SHDI calculated by the Global Data Lab is based on a uniform methodology and consistent data set and, therefore, permits comparison over time and place. The panel data set related to HDI for states and union territories of the country spanning over more than 25 years beginning 1990 provides a unique opportunity to analyse human progress across states and union territories in India in the recent past.
In this article, we have used estimates of national and subnational HDI and associated education index (EDI), health index (WBI) and standard of living index (SLI) for India prepared by the Global Data Lab at the Institute of Management Research of the Radbound University in The Netherlands to analyse the progress of human development in the country and in its constituent states/union territories during the period 1990 through 2015. The article has three objectives. The first objective is to describe the progress of human development in the country. The second objective is to examine convergence in human development across states and union territories of the country. Finally, the third and the last objective is to decompose the change in HDI into the change attributed to the change in EDI, change in WBI and the change in SLI that, in combination, constitute HDI. This decomposition analysis permits to explore the primary driver of the change in HDI in the country and its states/union territories. The period 1990 through 2015 is of a particular importance to the Indian context. First, the year 1990 signals the beginning of economic reforms in India which is argued to have accelerated economic growth in the country in a significant manner. Second, the period 1990 through 2015 is the period of the United Nations Millennium Development Agenda (United Nations, 2000). As such, the analysis presented in this article attempts to answer how economic reforms in India and the Millennium Development Agenda of the United Nations had contributed to the progress of human development in the country and in its states/union territories.
The article is organised as: The next section describes the data that have been used in the analysis. The third section describes levels, trends and differentials in HDI during the period 1990 through 2015 in India and its states/union territories to reflect the progress as well as the prevailing disparities in human development across the country. The fourth section examines the convergence in human development, as reflected through the improvement in HDI, across the states/union territories. The fifth section analyses how the change in the three components of HDI—the index of education, the index of health or well-being and the index of the standard of living—contributes to the change in HDI. The sixth section of the article discusses the findings of the analysis in the context of human progress in the country and its states/union territories. Finally, the last section summarizes the findings of the analysis and highlights their policy and programme implications.
Data Source
The data for the analysis are derived from the subnational human development database developed and maintained by the Global Data Lab of the Institute of Management Research of the Radboud University, Netherlands. The database contains values of HDI; indexes of education, health and standard of living on the basis of which the HDI is constructed; and the four indicators used to construct the indexes of education, health and standard of living—expected years of schooling, mean years of schooling, life expectancy and gross national income per capita—for 1,625 regions within 161 countries including 37 states/union territories of India for the period 1990–2017 (Smits & Permanyer, 2019). The subnational values of the four indicators were computed using data from statistical offices and from the Area Database of the Global Data Lab, which contains indicators aggregated from household surveys and census data sets. Values for missing years have been estimated by interpolation and extrapolation from real data. The subnational values of the indicators have been normalised using the population-weighted averages of the indicators to their national levels in the HDI database of the UNDP. This approach ensured, as far as possible, the subnational variation of the data available through statistical offices and survey data sets, while on the other hand, their population-weighted national averages are equal to the values used by the UNDP in constructing the national HDI.
The methodology used for constructing HDI is the same as the methodology adopted by the United Nations (2018). The four indicators used in the construction of HDI were first normalized using the same goal posts as adopted by United Nations to represent the four indicators on a common scale. The normalized values of the four indicators were used to construct the indexes of education, health and standard of living. The index of education was computed from the normalized values of the mean years of schooling of adults aged at least 25 years and normalized values of expected years of schooling. The WBI was computed from the normalized value of the expectation of life at birth whereas the SLI was computed from the normalized value of per capita gross national income. The HDI was then computed as the geometric mean of the indexes of education, health and standard of living. Details about the construction of the subnational human development database are given elsewhere and not repeated here (Smits & Permanyer, 2019). An important step in the construction of the subnational human development database was the technical validation of the data related to four indicators used in the construction of HDI. There are potentially four sources of quality loss in the database: (a) loss of quality resulting from the sources of data, (b) quality loss because of lack of subnational data for at least one indicator used in the construction of HDI, (c) quality loss resulting from the procedure adopted for subnational level estimation of gross national income and expectation of life at birth and (d) quality loss resulting from extrapolation and interpolation of indicators for those years for which data are not available. A detailed exposition of the methods adopted for addressing these issues are discussed elsewhere (Smits & Permanyer, 2019). The application of these methods ensured that the loss of quality in the data contained in the subnational human development database is small.
Levels, Trends and Differentials in HDI
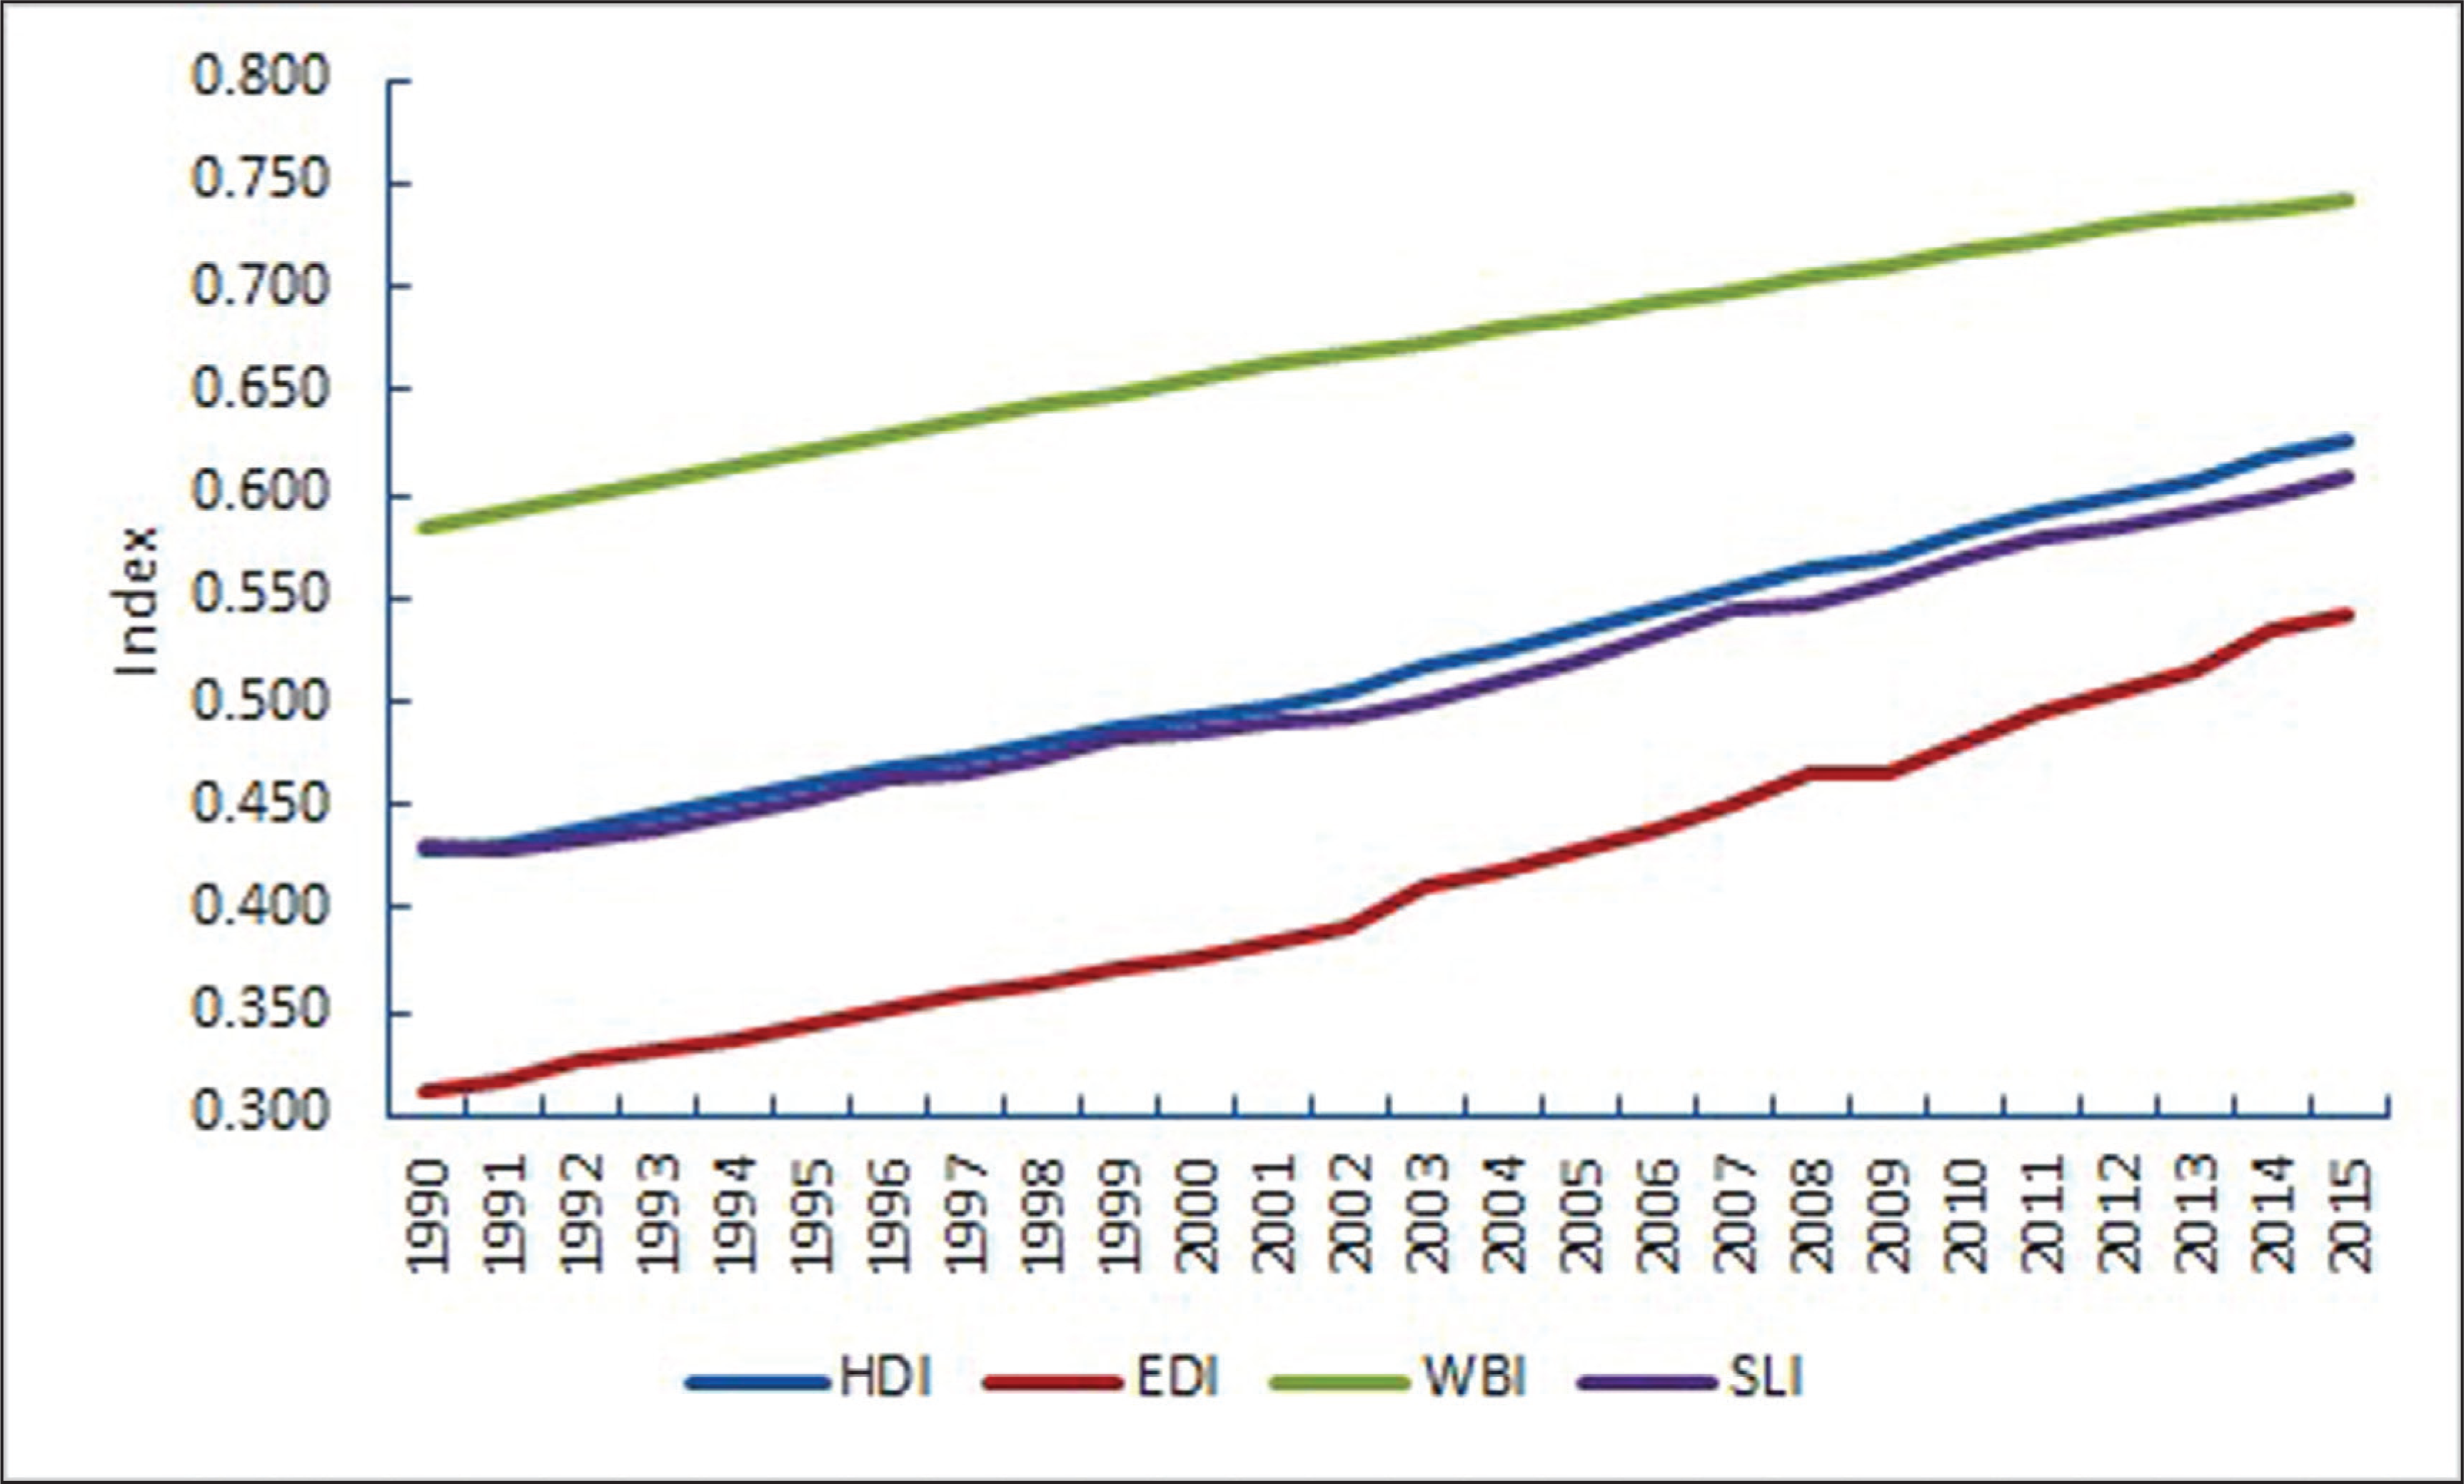
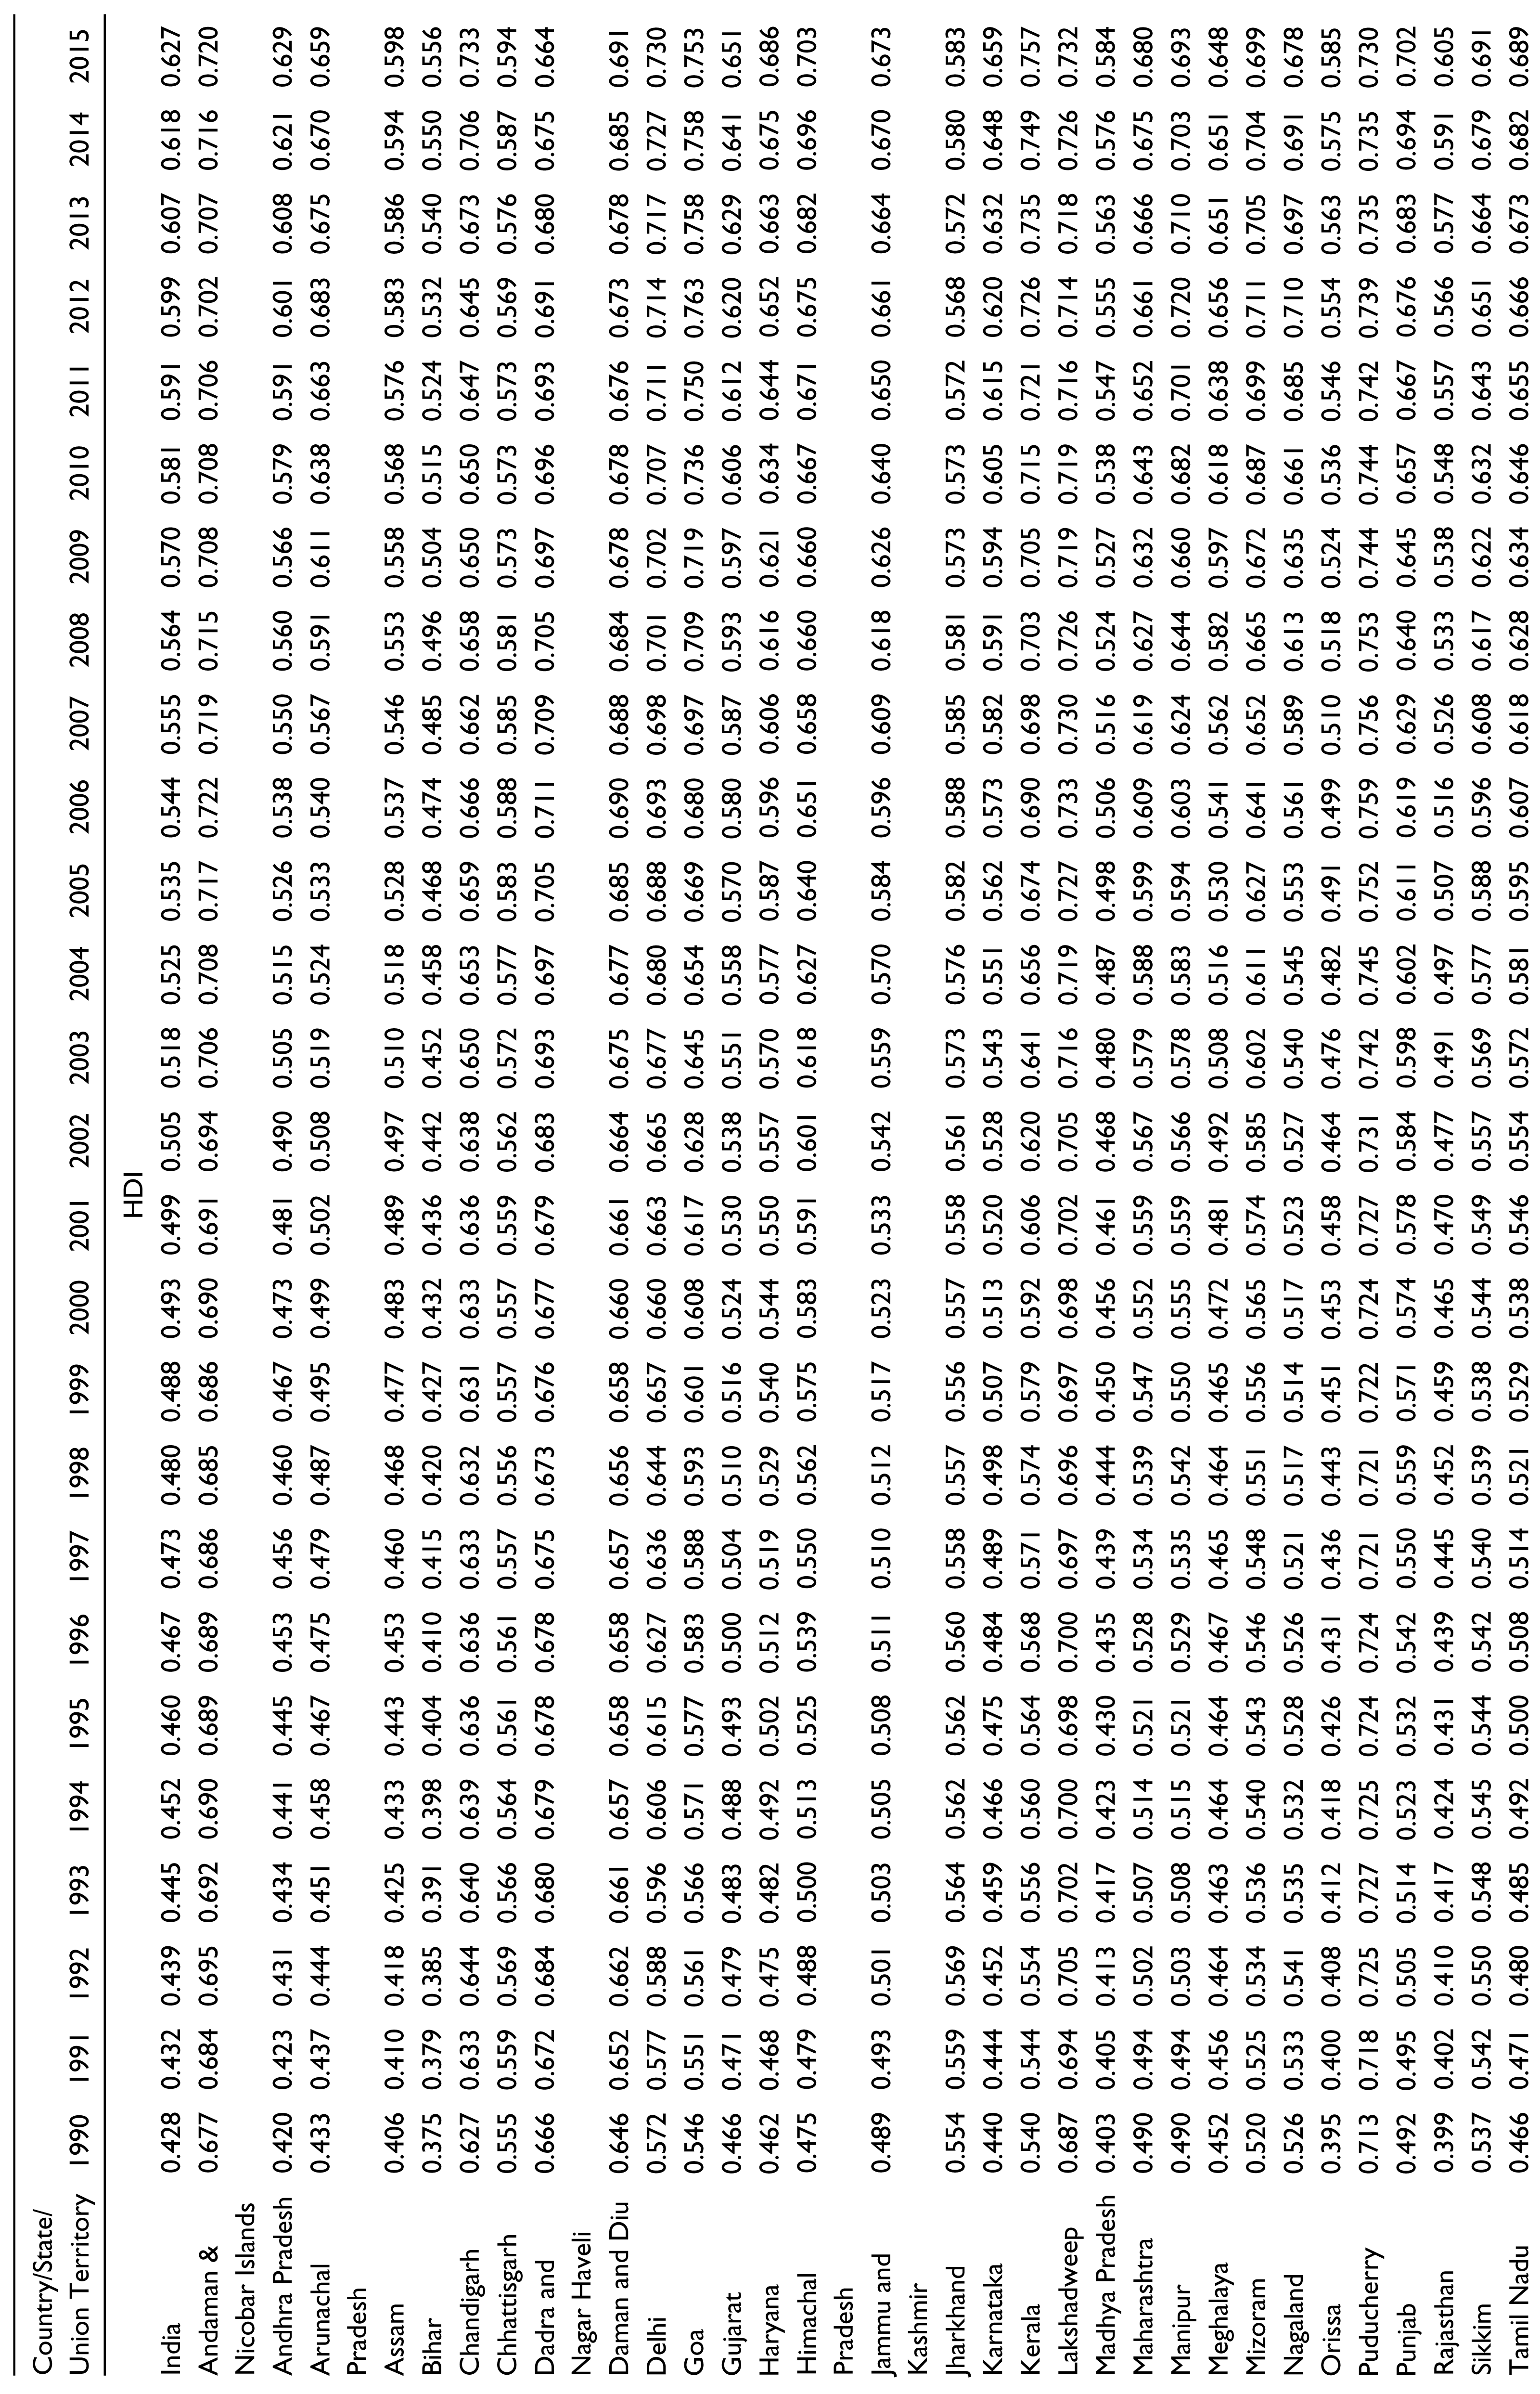
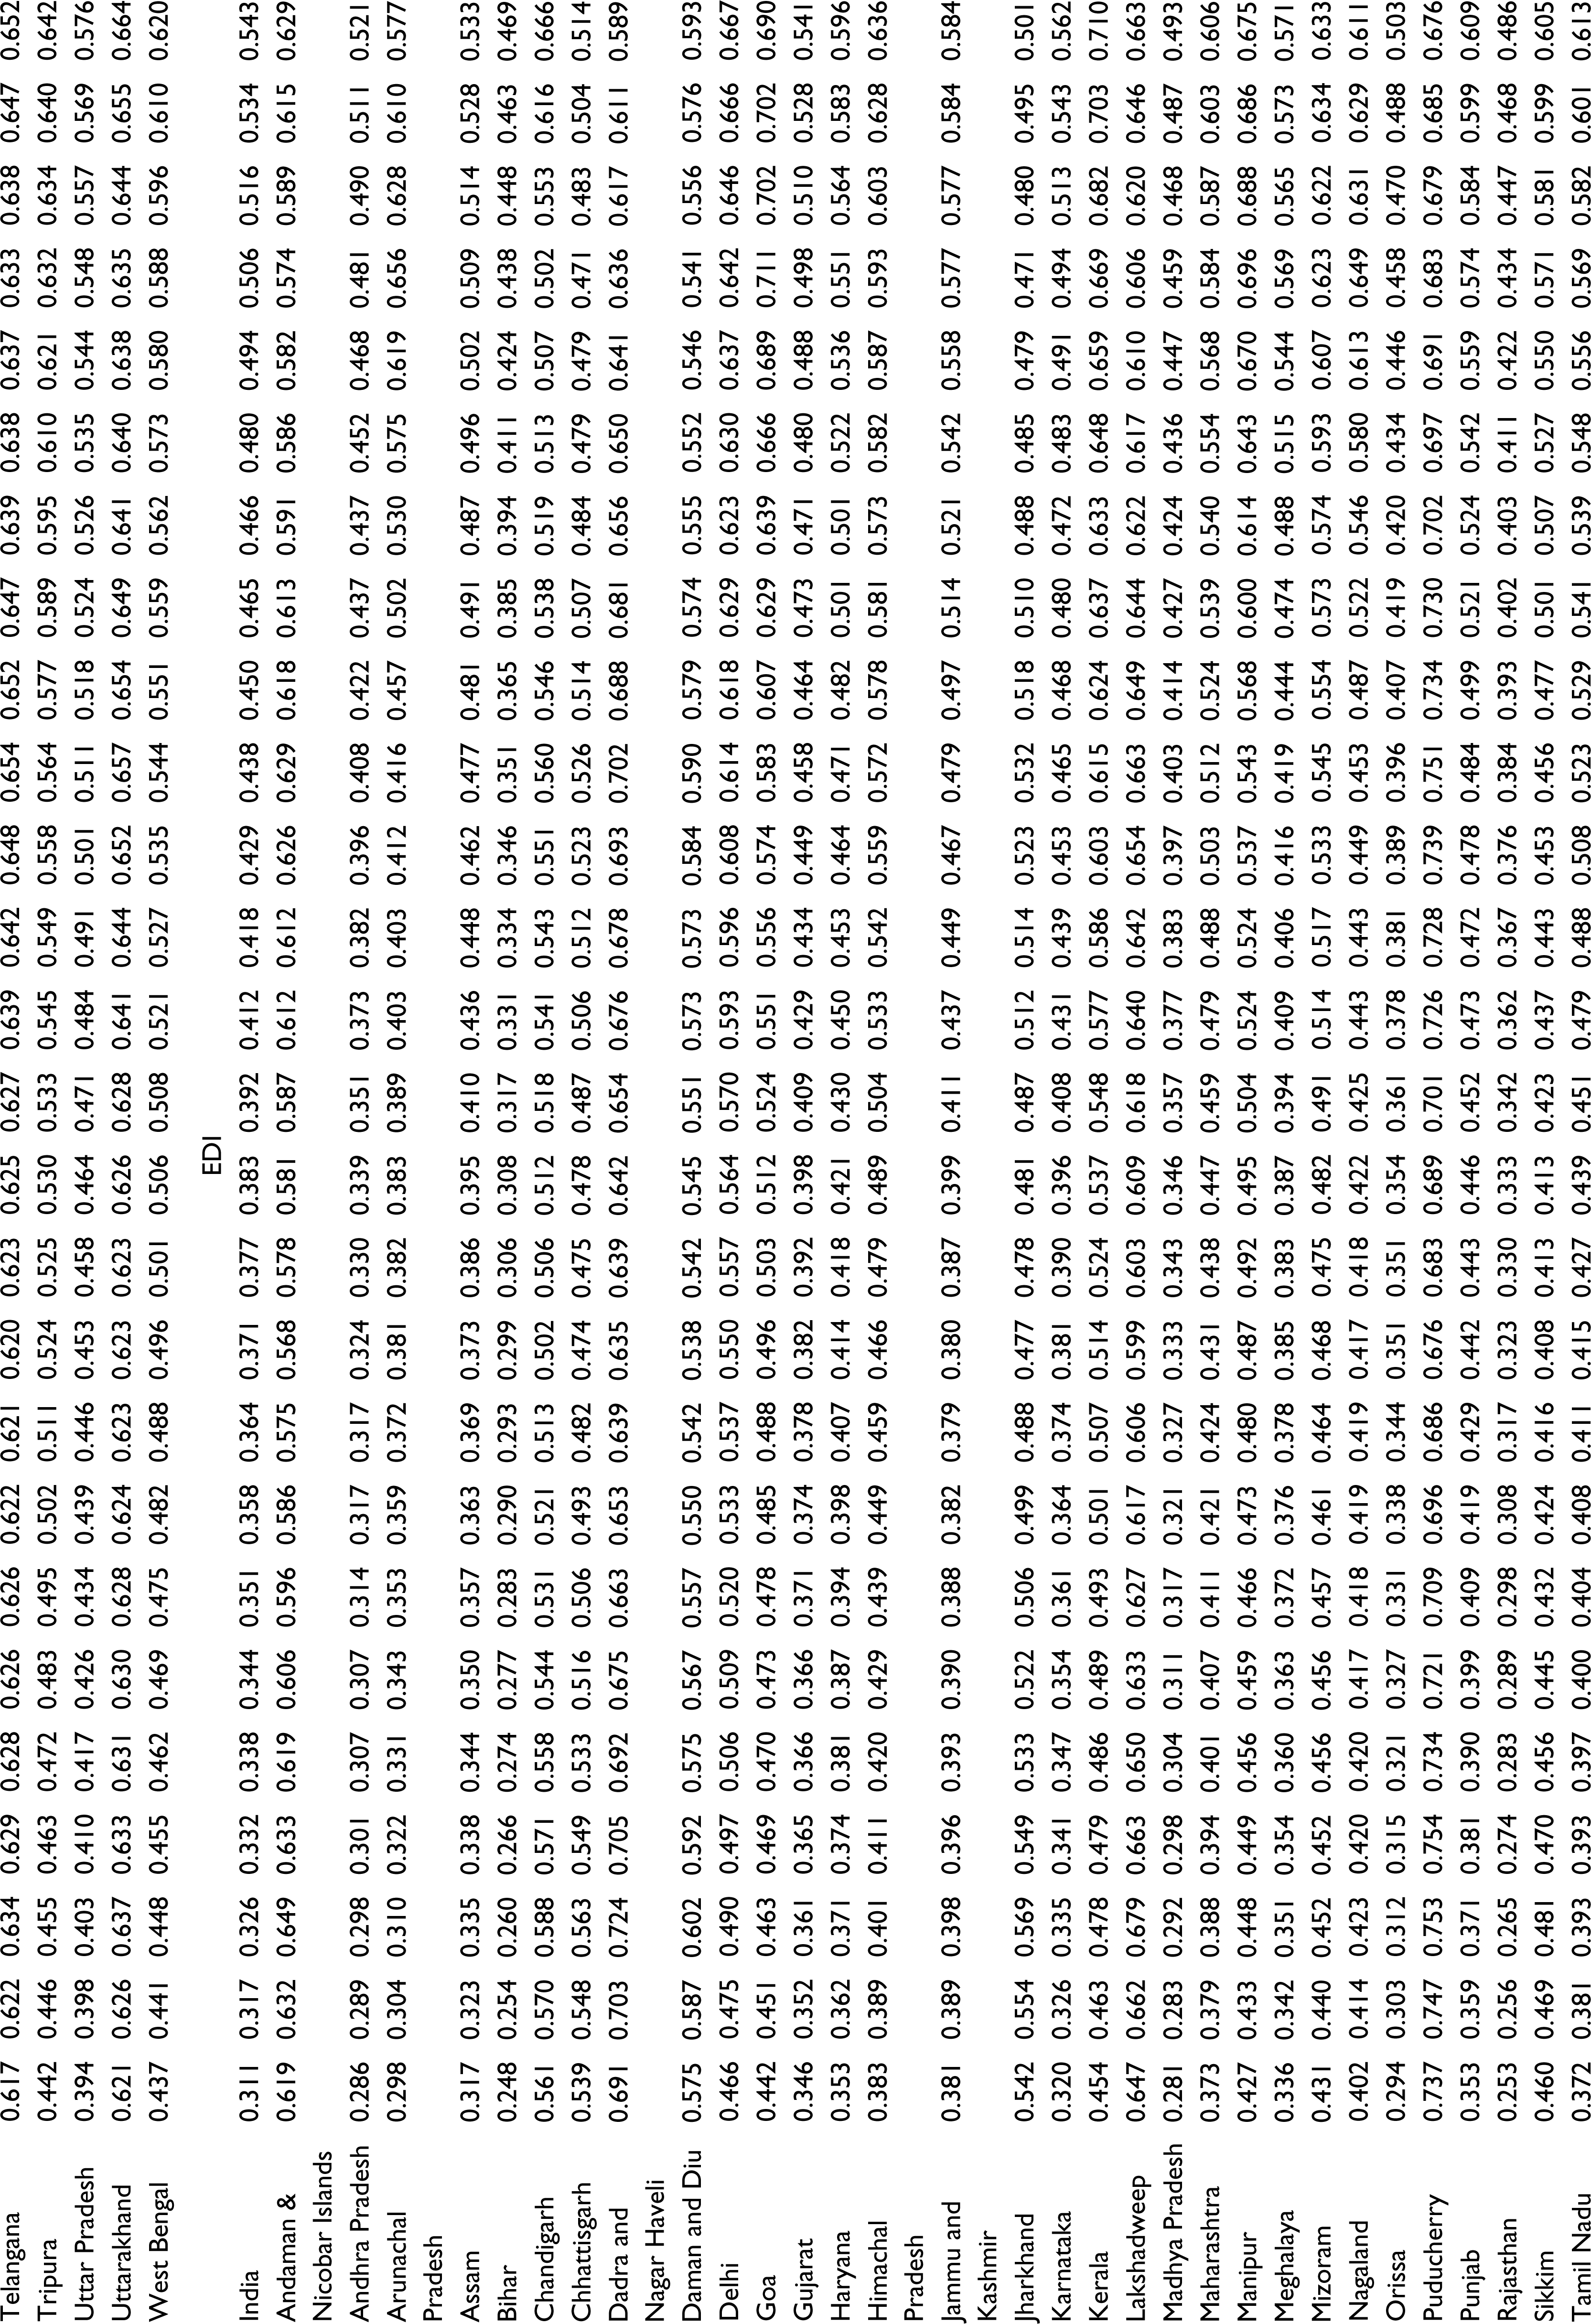
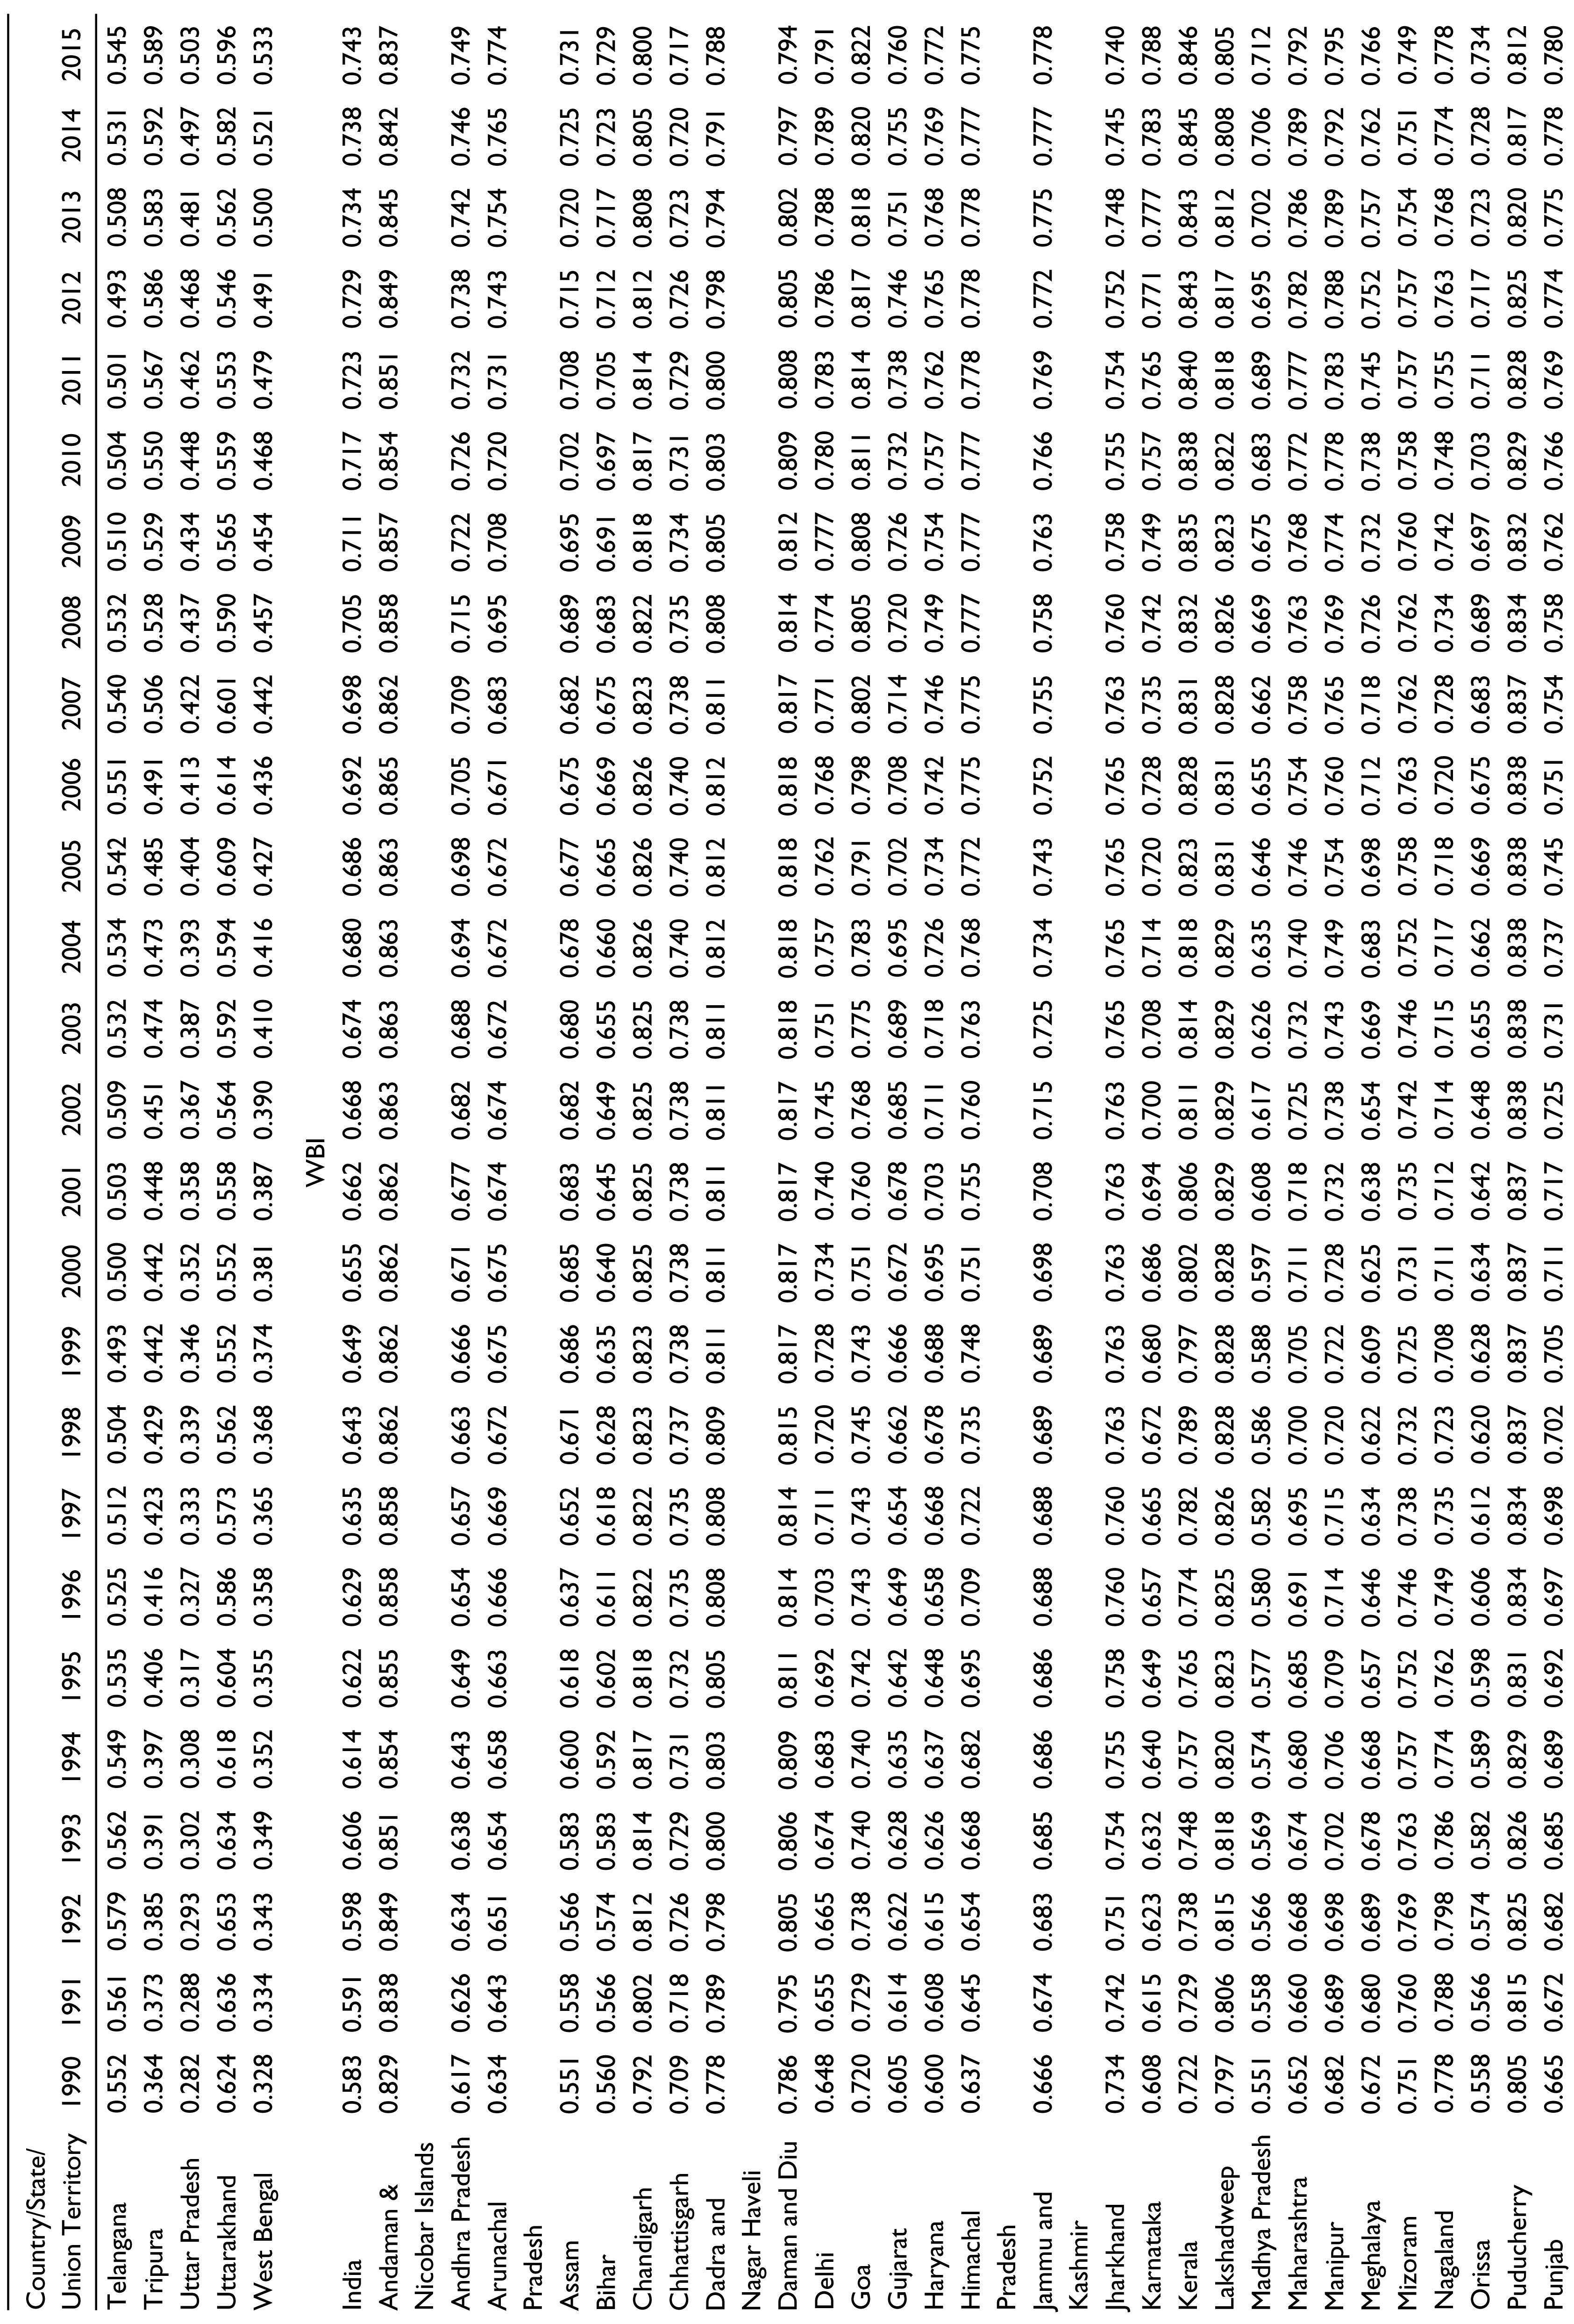
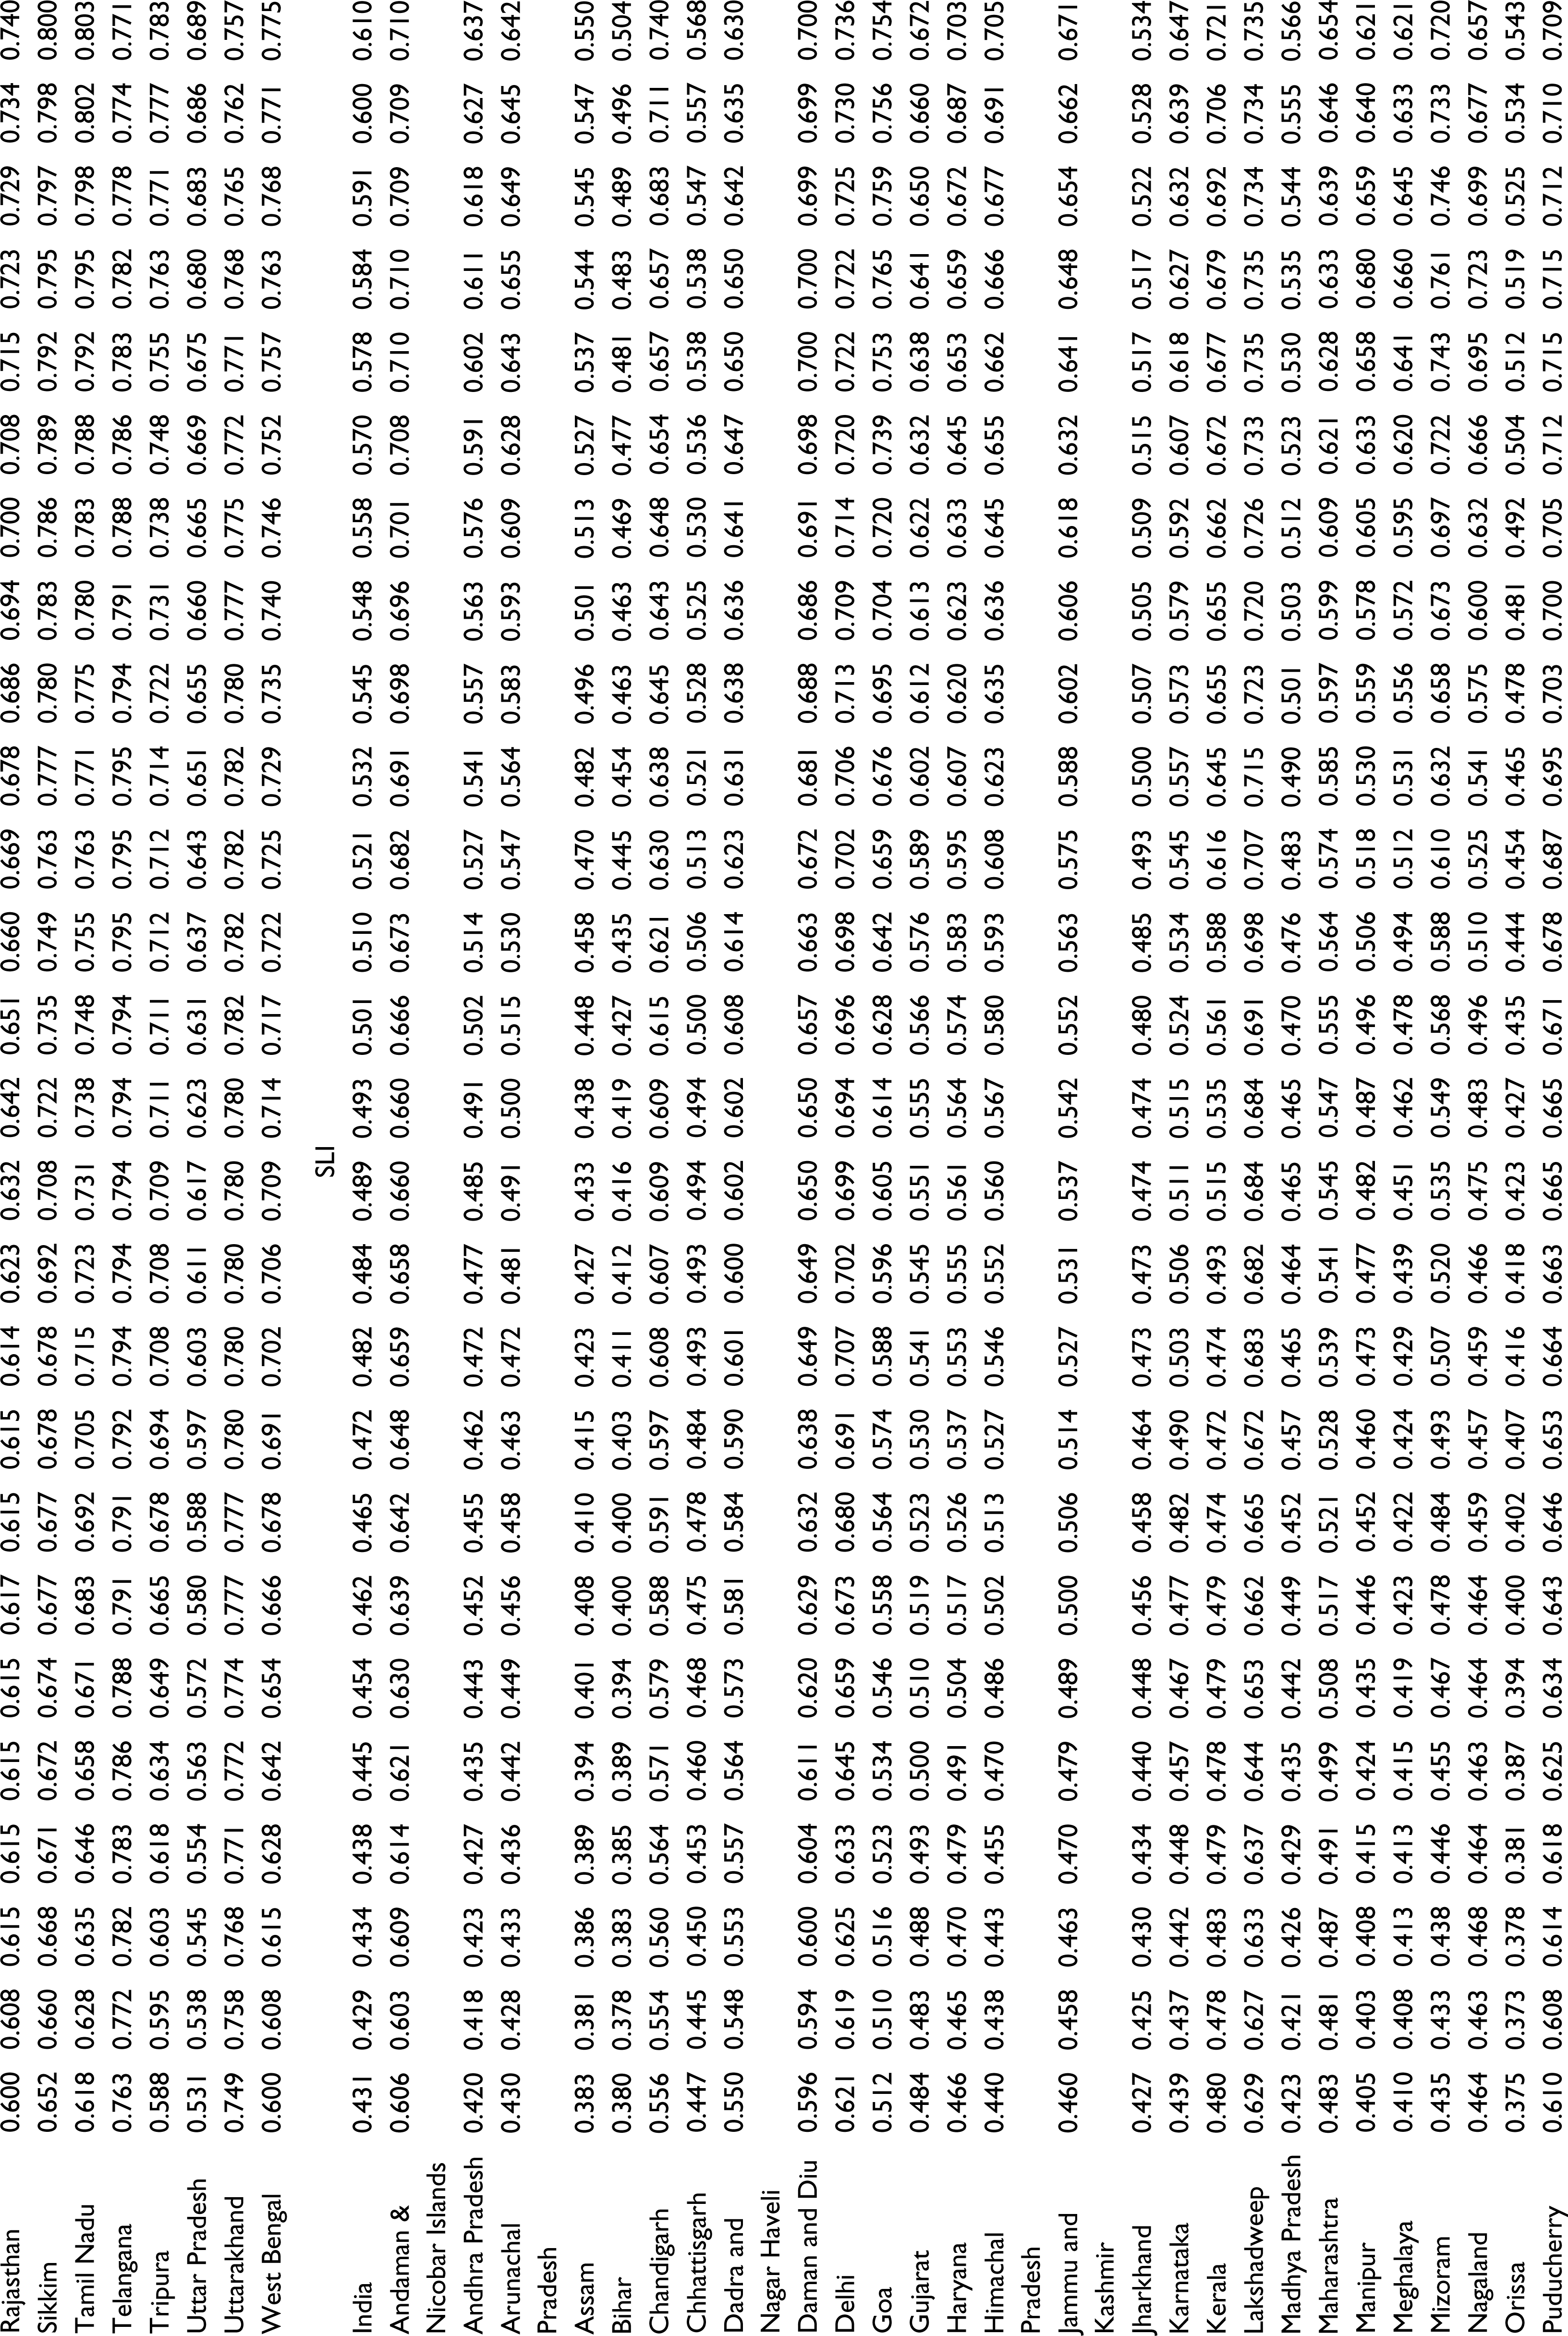
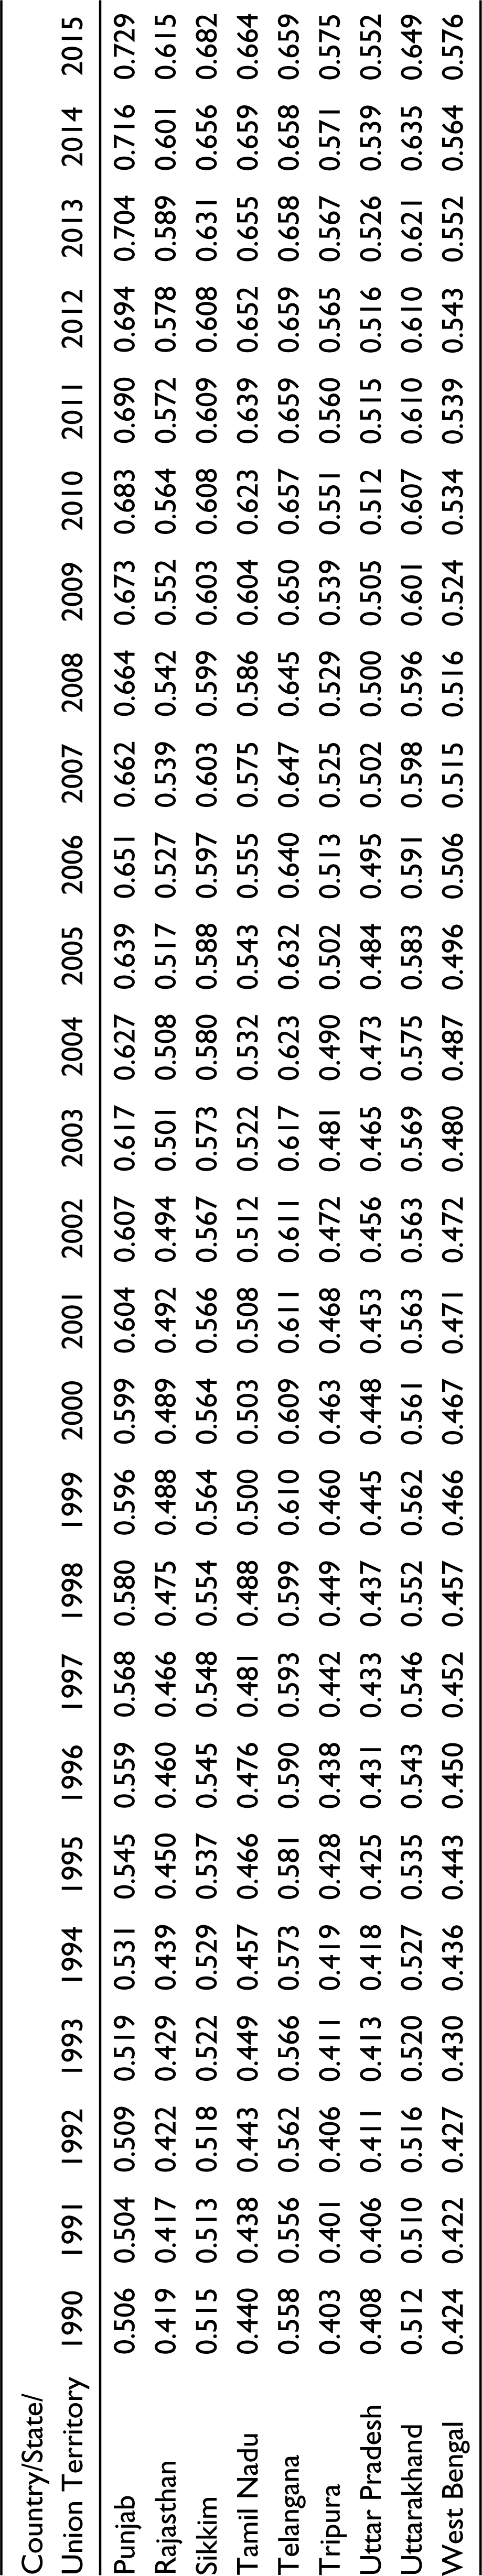
Estimates for HDI and associated EDI, WBI and SLI for India and states/union territories are given in Table A1 for different years of the period 1990 through 2015. The HDI for India is the same as the HDI estimated by UNDP. The HDI in India increased from 0.428 in 1990 to 0.627 in 2015 or by around 46 per cent. During the same period, EDI increased from 0.311 to 0.543, WBI increased from 0.583 to 0.743 and SLI increased from 0.431 to 0.610 (Figure 1). The United Nations categorises human development as low if HDI < 0.550, medium if 0.550 ≤ HDI < 0.700, high if 0.700 ≤ HDI < 0.800 and very high if HDI ≥ 0.800 (United Nations, 2018). This means that India was in the low human development category in 1990 but moved to the medium human development category in 2015. By the same argument, the country was in the low education development category throughout the period under reference but moved from low to medium category in health transition and from low to medium category in terms of the improvement in the standard of living during the 25 years between 1990 and 2015.
Trend in HDI, EDI, WBI and SLI in India, 1990–2015
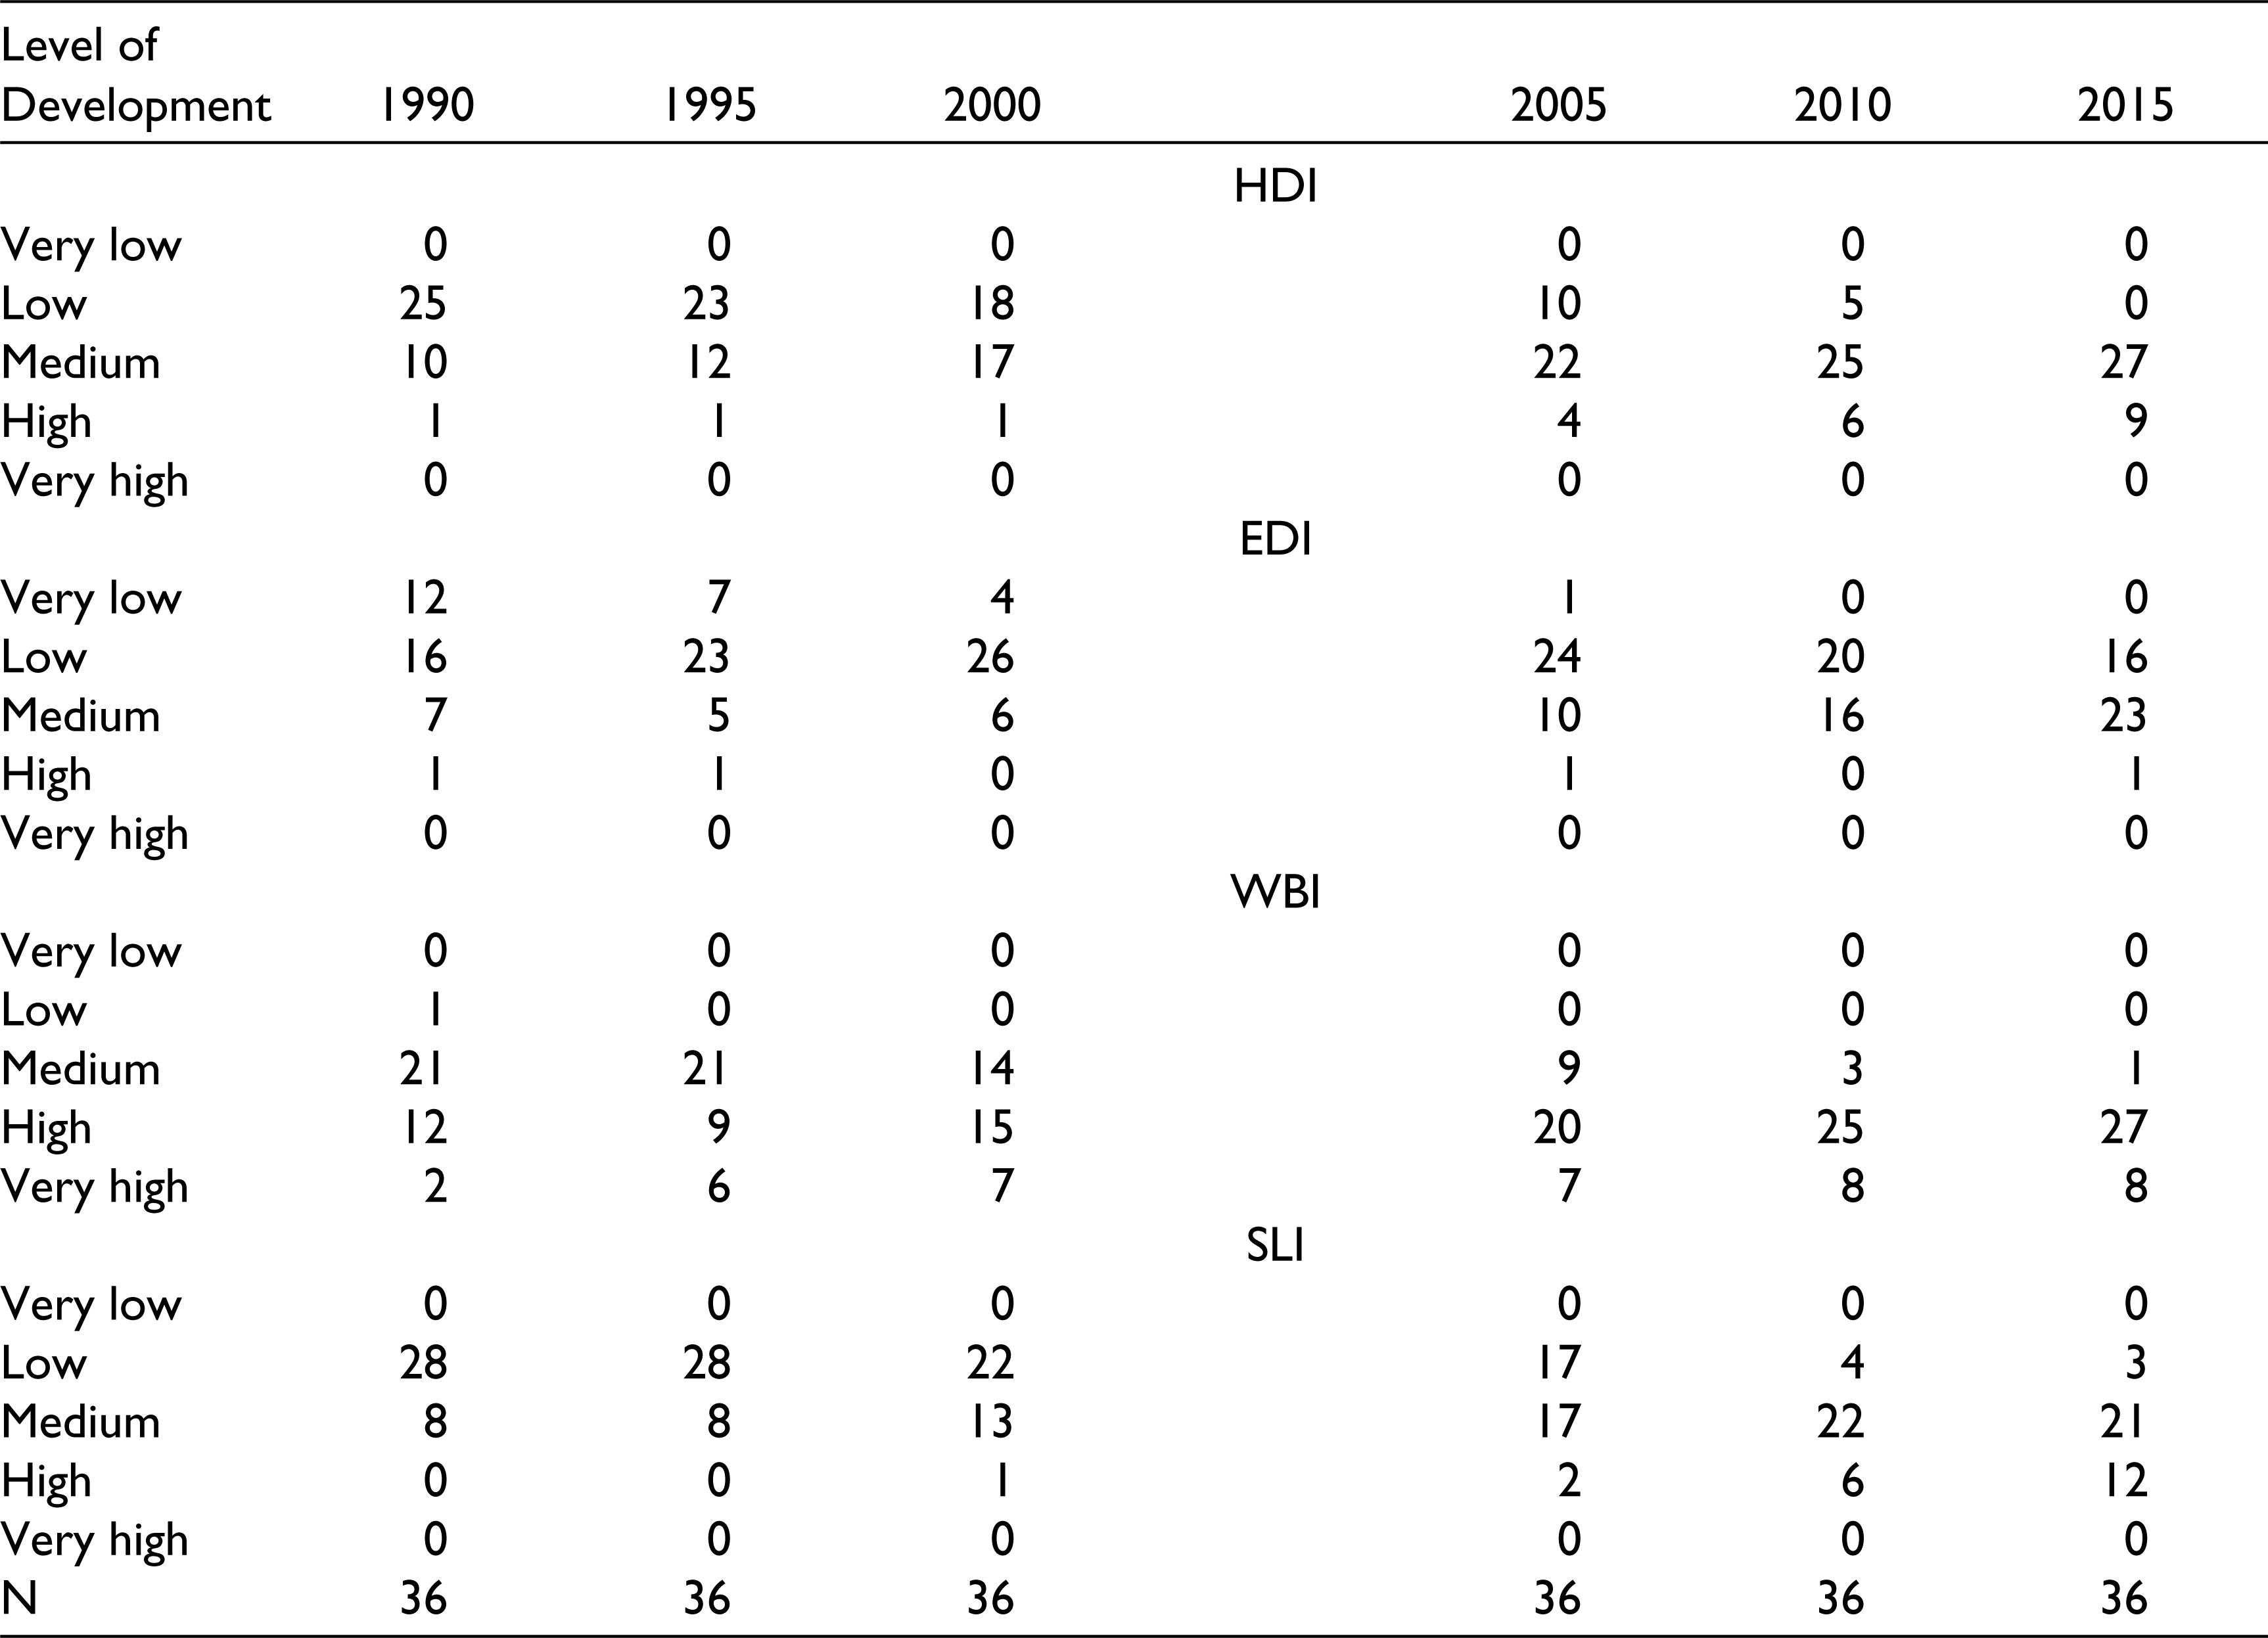
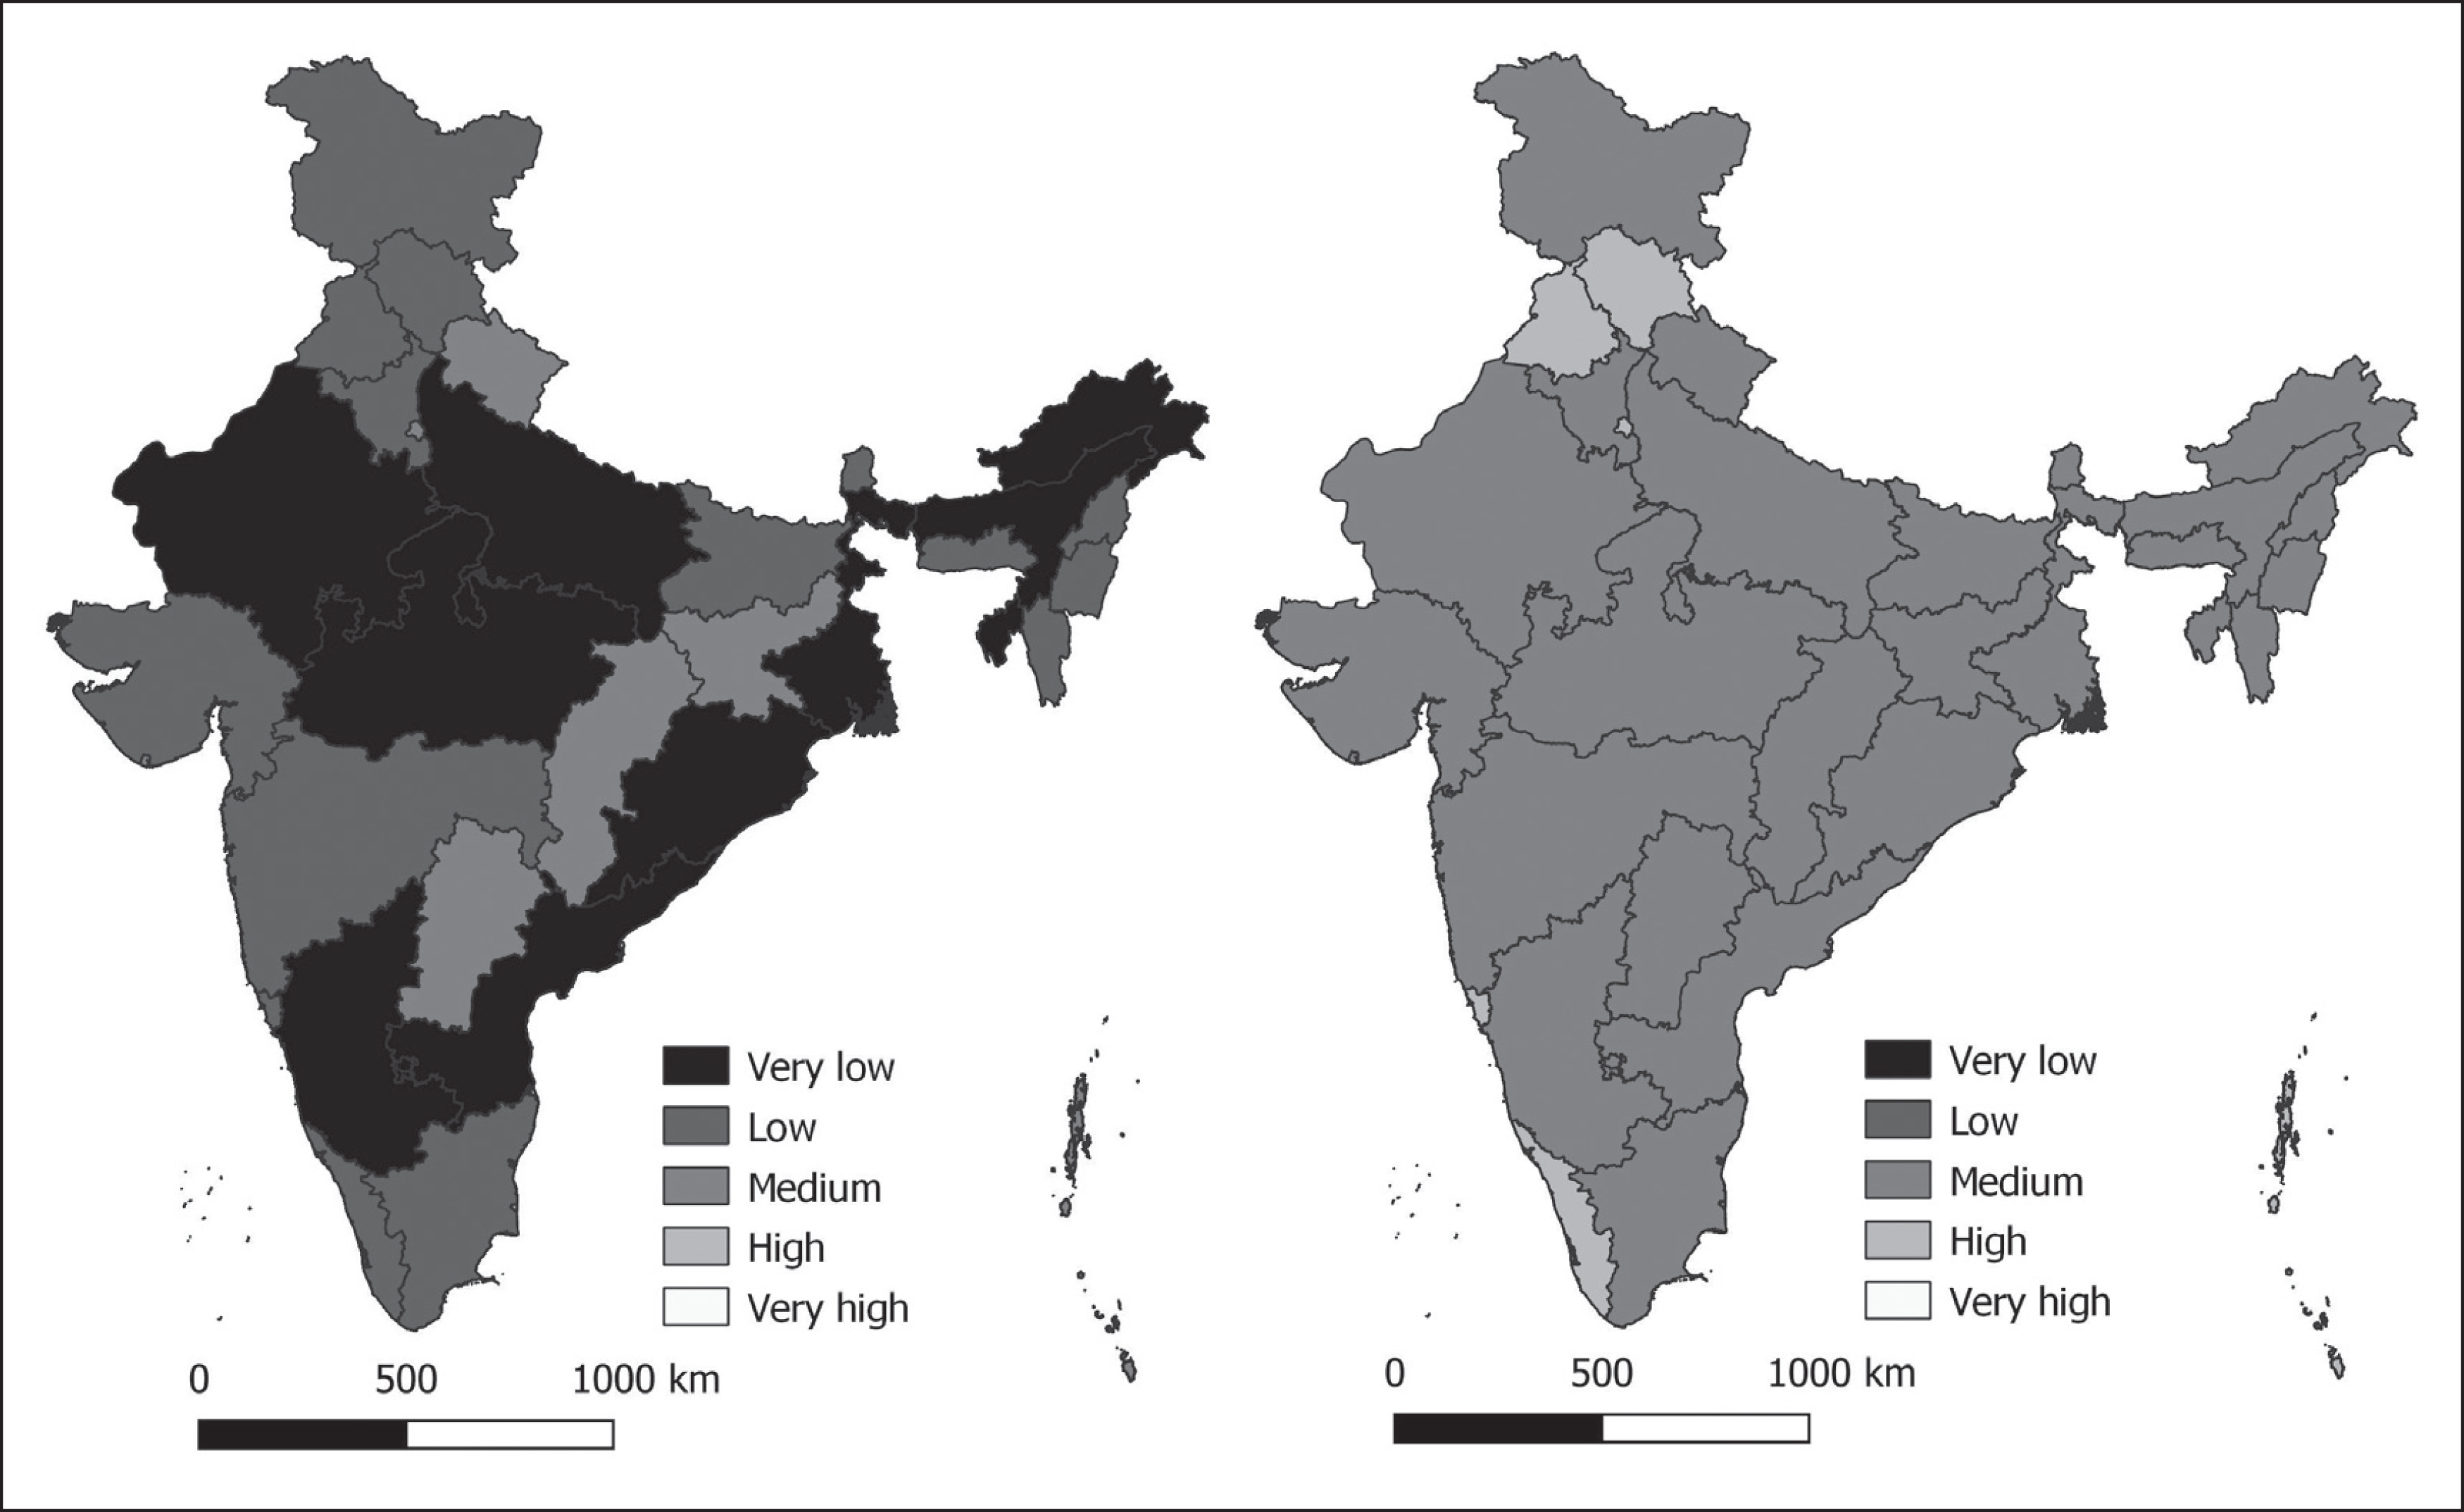
HDI as well as EDI, WBI and SLI varied widely across states and union territories of the country. In 1990, HDI was the highest in the union territory of Puducherry (0.713) but the lowest in Bihar (0.375). In 2015, however, the HDI was the highest in Kerala (0.757) but the lowest again in Bihar (0.556). There was no state/union territory where human development was either very high or very low in 2015, although there were nine states/union territories where human development was high in 2015 (Table 1). The scenario in 2015 was in quite a contrast to that in 1990 when human development was low in 25 and medium in 10 states/union territories (Figure 2). Similarly, EDI was low in 12, medium in 23 and high in only 1 state/union territory in 2015 whereas in 1990, it was low in 28, medium in 7 and high in 1 state/union territory of the country. The WBI, on the other hand, high in 27 and very high in 8 states/union territories in 2015 whereas it was medium in 21, high in 12 and very high in 2 states/union territories in 1990. Finally, SLI was low in 28 and medium in 8 states/union territories in 1991 but it was high in 12 states/union territories in 2015. Except for WBI, there was no state/union territory in the country where EDI and SLI were very high in 2015.
Distribution of States/Union Territories by the Level of Human Development in India
Human Development Index (HDI) in States/Union Territories
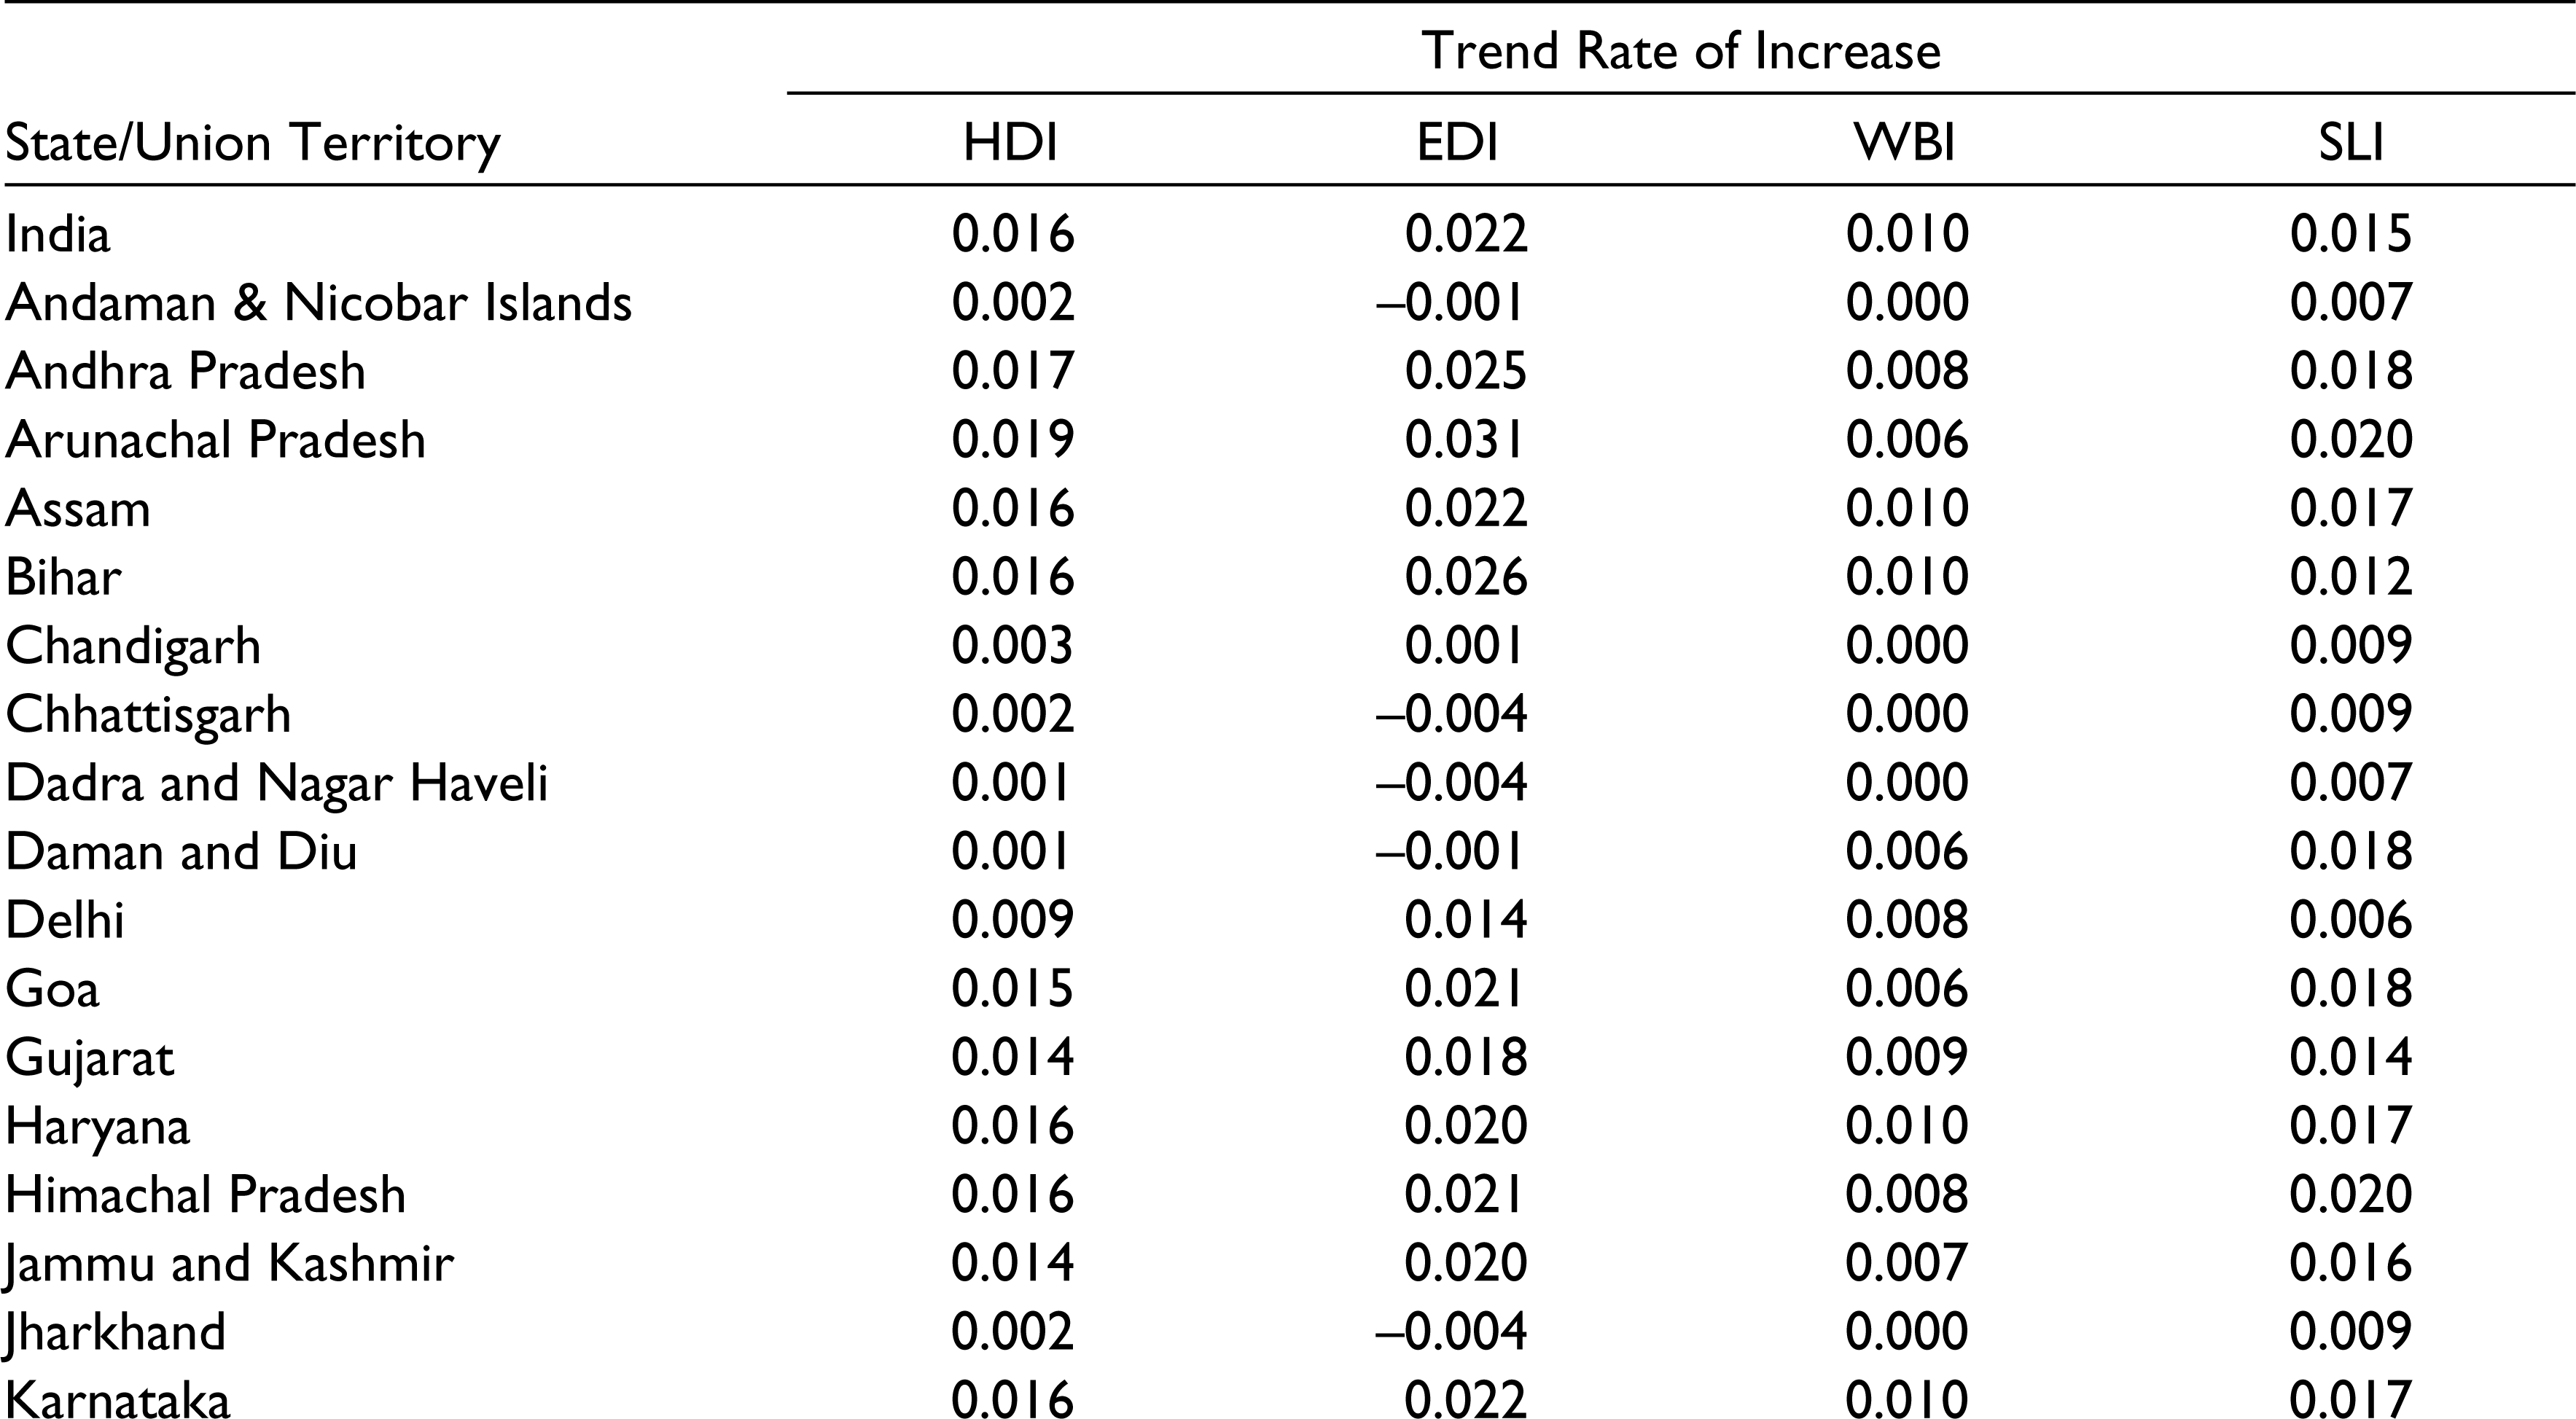
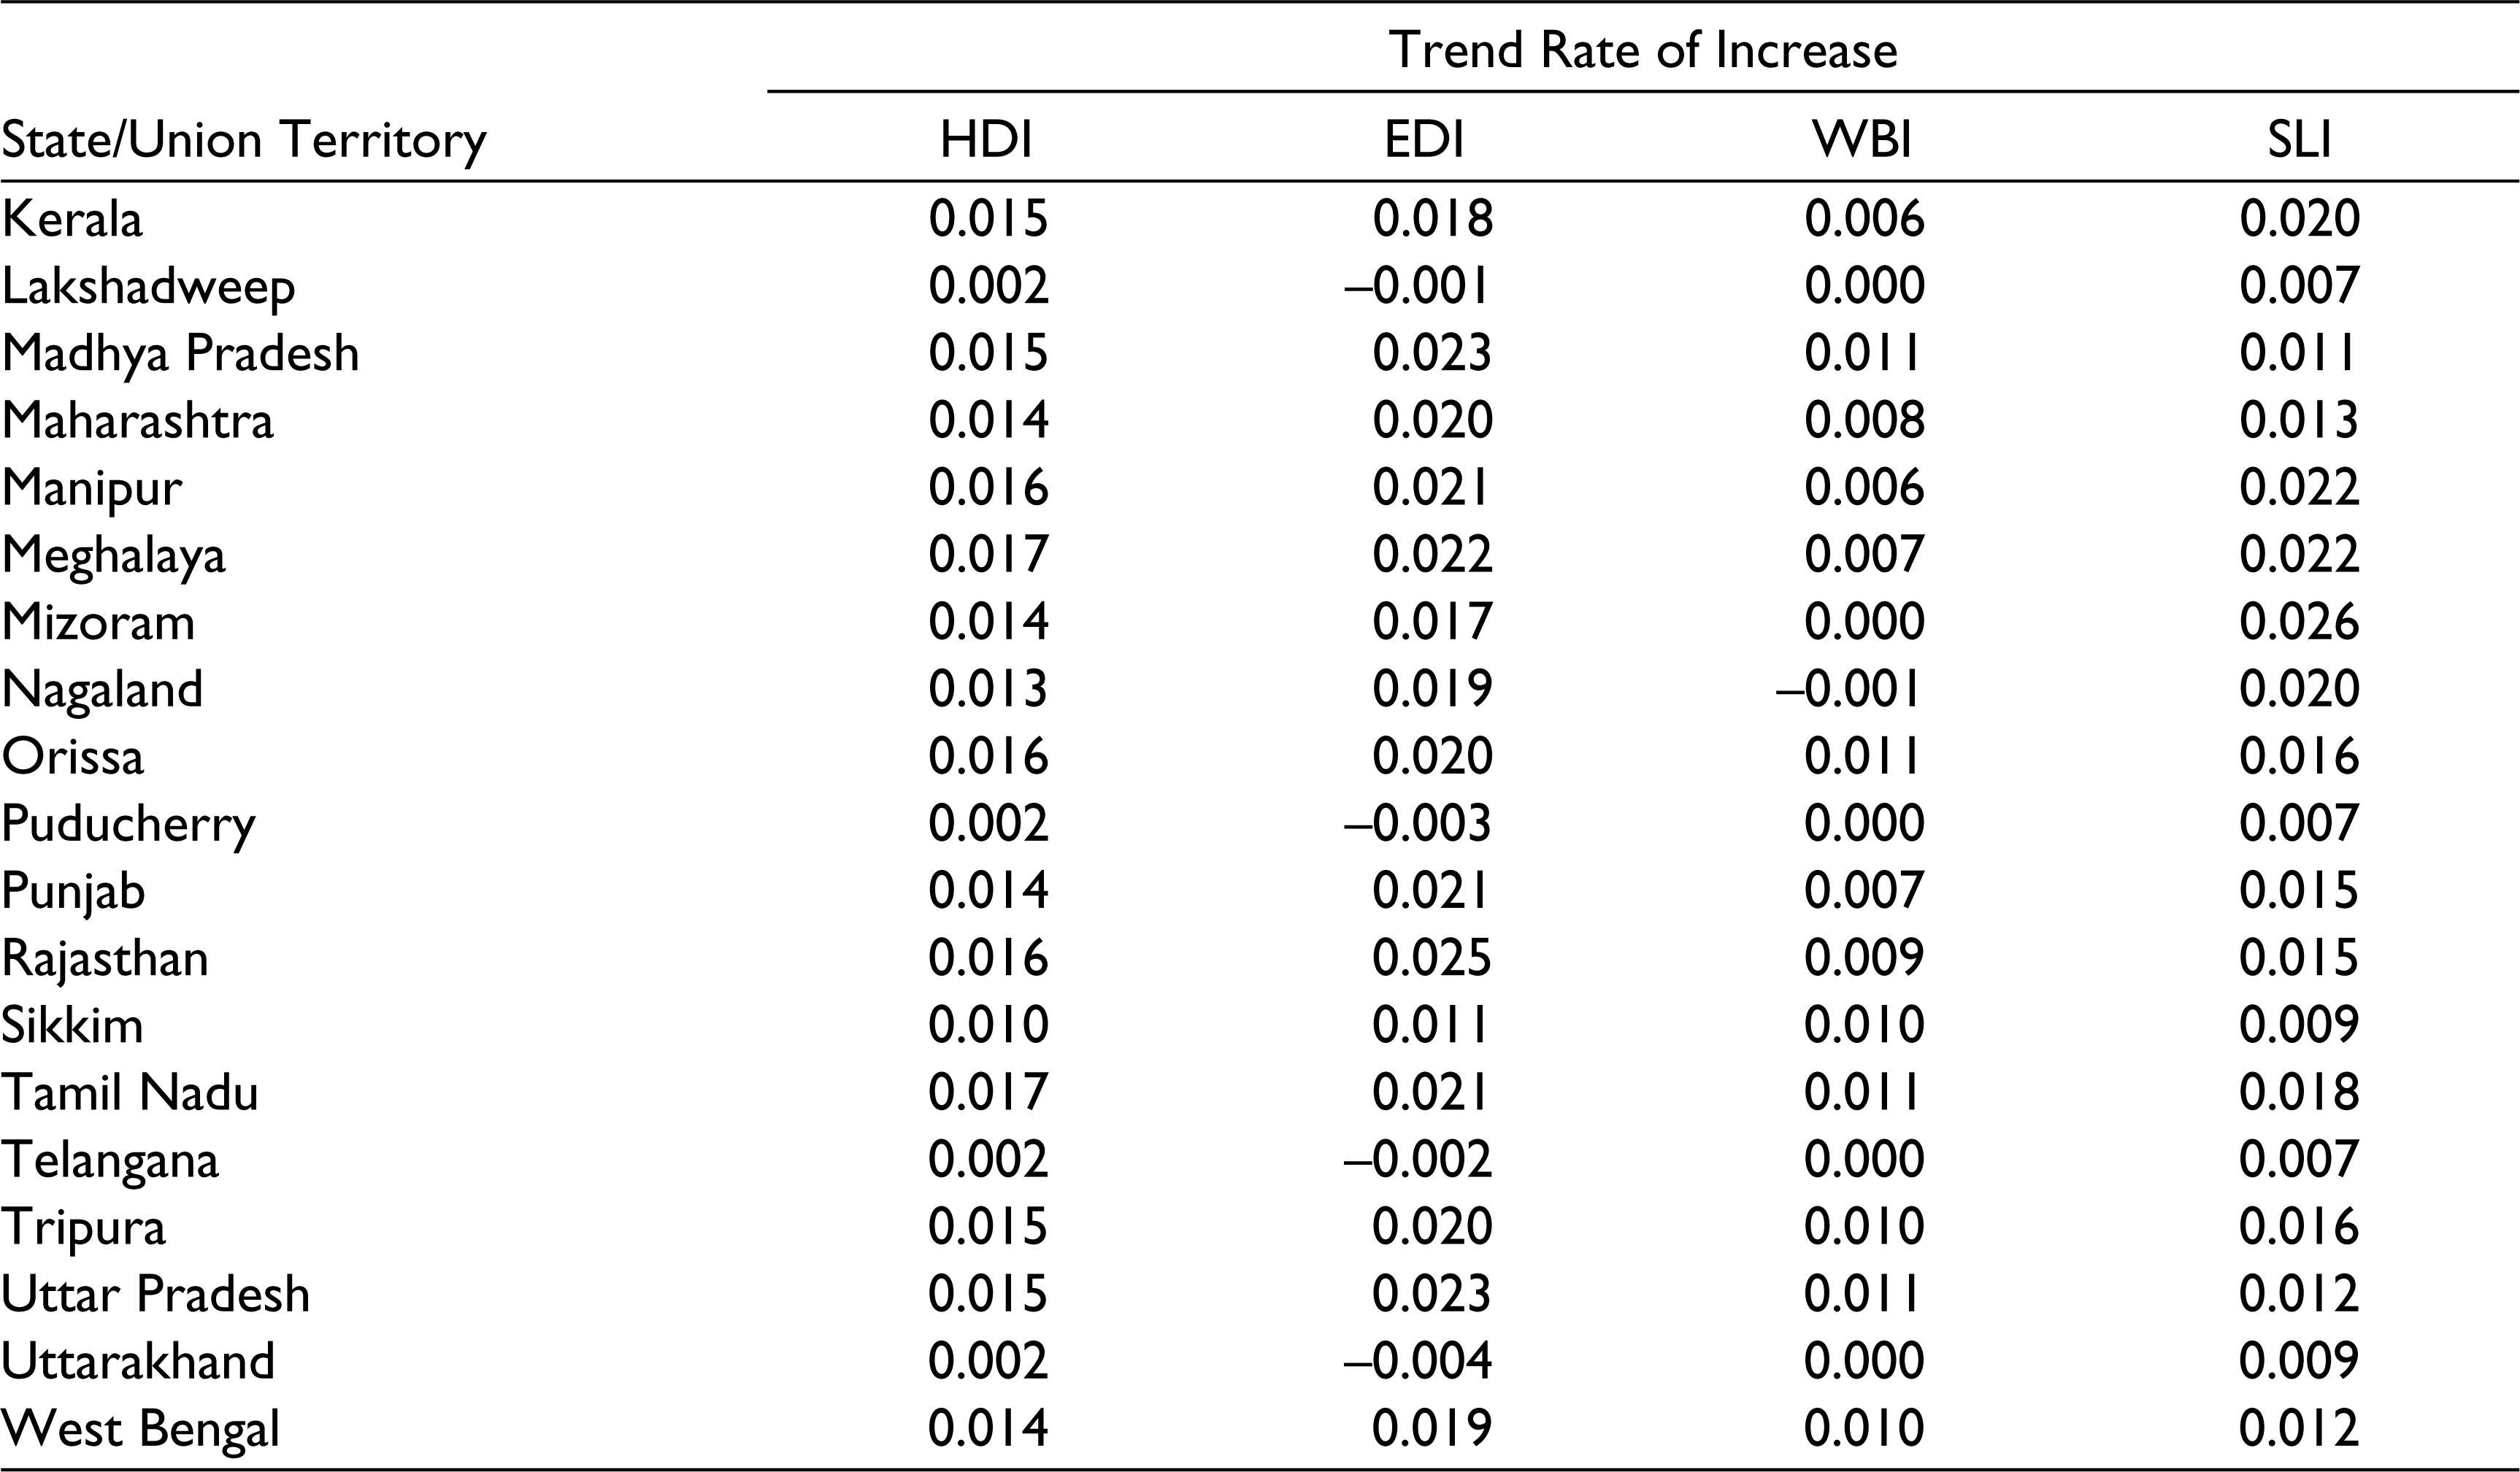
The HDI in India increased by around 46 per cent between 1990 and 2015 at an average annual trend growth rate of around 1.6 per cent per year (Table 2). On the other hand, in 10 states/union territories of the country, the pace of improvement in HDI was relatively faster than the national average with the most rapid improvement in HDI recorded in Arunachal Pradesh (Table 2). On the other hand, in 8 states/union territories, the improvement in HDI was, at best, marginal with the slowest improvement in HDI recorded in Dadra and Nagar Haveli. In these states/union territories, HDI increased by less than 10 per cent during the 25 years under reference. There are only 16 states/union territories in the country where HDI increased by 40–50 per cent during this period.
Analysis of the Trend in HDI, EDI, WBI and SLI in India and States/Union Territories, 1990–2015
Because of the differential pace of improvement, the relative rank of different states/union territories in terms of HDI vis-à-vis other states/union territories had changed substantially in 2015 as compared to that in 1990. The relative rank increased in some states/union territories but decreased in others during this period. A decrease in the relative rank of a state/union territory indicates that the improvement in HDI in the state/union territory was relatively slower than the improvement in HDI in other states/union territories and vice versa. There is only one state—Bihar—which ranked the lowest in HDI among different states/union territories throughout the period under reference, although the HDI in the state increased from 0.375 in 1990 to 0.556 in 2015. The rank in HDI also changed little in Meghalaya and West Bengal. On the other hand, in 12 states/union territories, the rank in HDI decreased in 2015 compared to that in 1990 with Jharkhand recording the maximum decrease in the rank in HDI indicating that the human progress, as reflected through HDI, was very slow in the state. Other states/union territories where the decrease in the rank of HDI was very substantial are Chhattisgarh, Dadra and Nagar Haveli, Telangana and Uttarakhand. In all these states/union territories, the rank in HDI decreased by more than 10 points between 1990 and 2015. On the other hand, Himachal Pradesh gained the most in terms of the rank in HDI across states/union territories. The state ranked 21 in 1990 but 8 in 2015 in HDI. The gain in the rank of HDI was also quite rapid in Kerala and Goa.
Among the three dimensions of human development, the pace of improvement was the most rapid in education dimension but the least rapid in health dimension. However, in 9 states/union territories, the trend growth rate in EDI was negative indicating deterioration, not an improvement, in this dimension of human development whereas Arunachal Pradesh recorded relatively the most rapid improvement in EDI. On the other hand, there was virtually no improvement in the health dimension in 11 states/union territories whereas in 13 states/union territories, the WBI increased at an annual growth rate of less than 1 per cent per year. There was no state/union territory where WBI increased at a rate of more than 1.1 per cent per year. Similarly, in 11 states/union territories, improvement in the standard of living dimension was marginal. In these states/union territories, SLI increased at a rate of less than 1 per cent per year. There are only 7 states/union territories where SLI increased at a rate of at least 2 per cent per year.
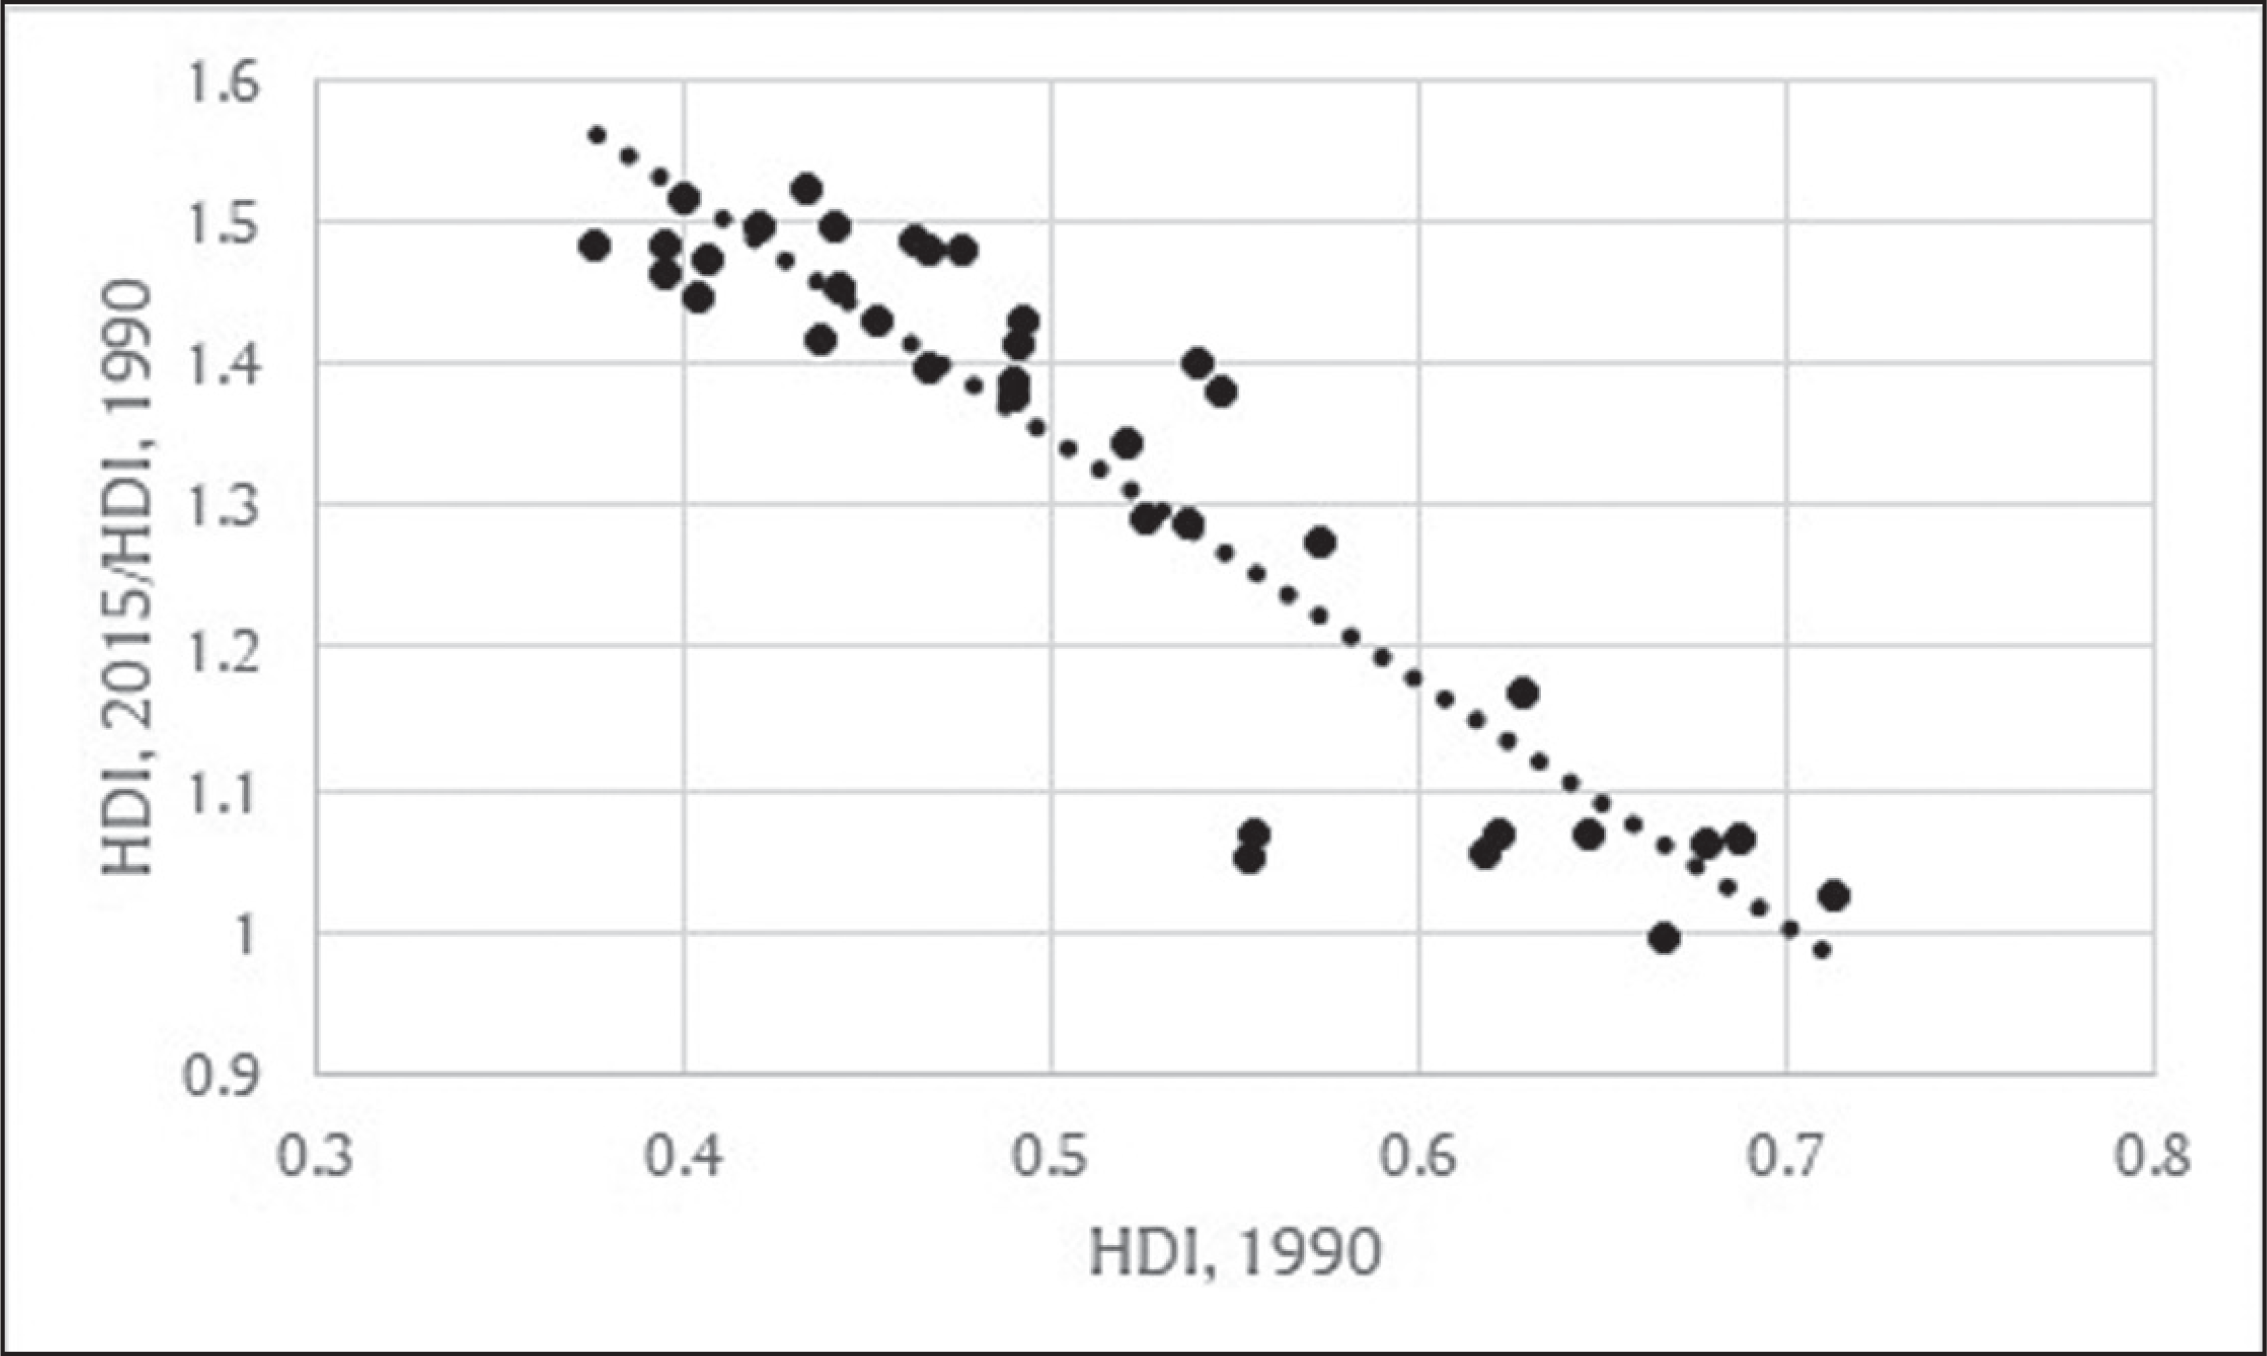
The improvement in HDI is found to be, in general, inversely related to the level of HDI in 1990—higher the HDI in 1990, slower the improvement during 1990–2015 (Figure 3). This is expected as it is well known that higher the level of human development, more difficult it is to improve it further. This means that the future progress in human development in the country is likely to get slower as human development advances, even though human development was not very high around 2015 either in the country or in its any of the states/union territories.
Scatter Diagram of HDI (1990) and the Ratio HDI (2015)/HDI (1990)
Convergence in Human Development
Annual estimates of HDI for states/union territories of the country clearly suggest that there has been progress towards human development across the country. These estimates also suggest that both the level and the pace of human progress have varied across states and union territories of the country. It is however not clear whether the progress in human development in India has also resulted in the convergence in human progress across states/union territories or states/union territories of the country have diverged as far as human progress is concerned. In order to examine the convergence or the divergence in human progress across states/union territories, we have tested β-convergence and σ-convergence. The relatively faster improvement in HDI in states/union territories where HDI is low as compared to the improvement in HDI in those states/union territories where HDI is high is an indication of β-convergence. On the other hand, a decrease in the dispersion or the disparity in HDI across states/union territories over time is an indication of σ-convergence which illustrates as to whether the distribution of HDI across states/union territories is getting more equitable or not (Friedman, 1992). It is well known that β-convergence is a necessary condition for σ-convergence. However, β-convergence is not sufficient for σ-convergence (Quah, 1993). As such, analysis of β-convergence needs to be complemented by the analysis of σ-convergence.
Let hij denote the HDI in state/union territory i in the year j. Then the average annual increase in HDI during the period t to t + k is defined as
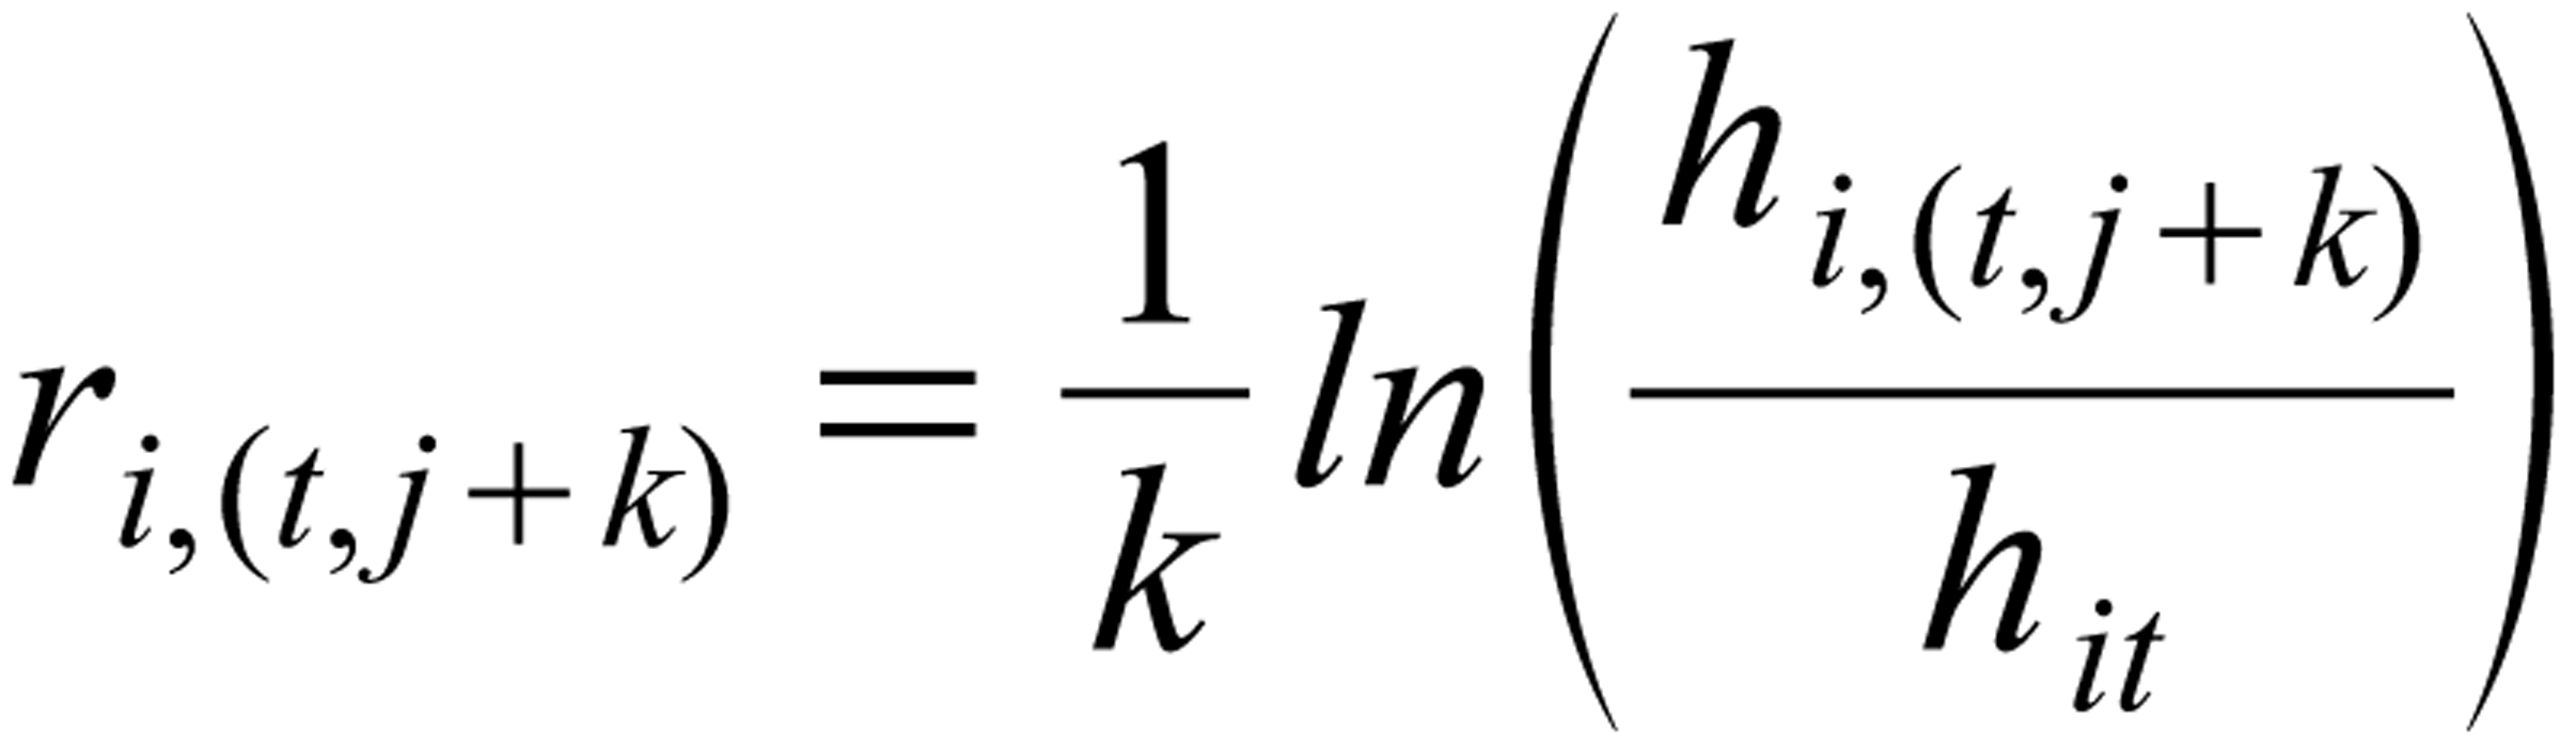
Now if the regression ri,(t,j+k) = α + βlnhi,t + εi has a negative slope, this implies that HDI converges across states/union territories. On the other hand, a positive slope is an indication of the divergence in HDI across states/union territories.
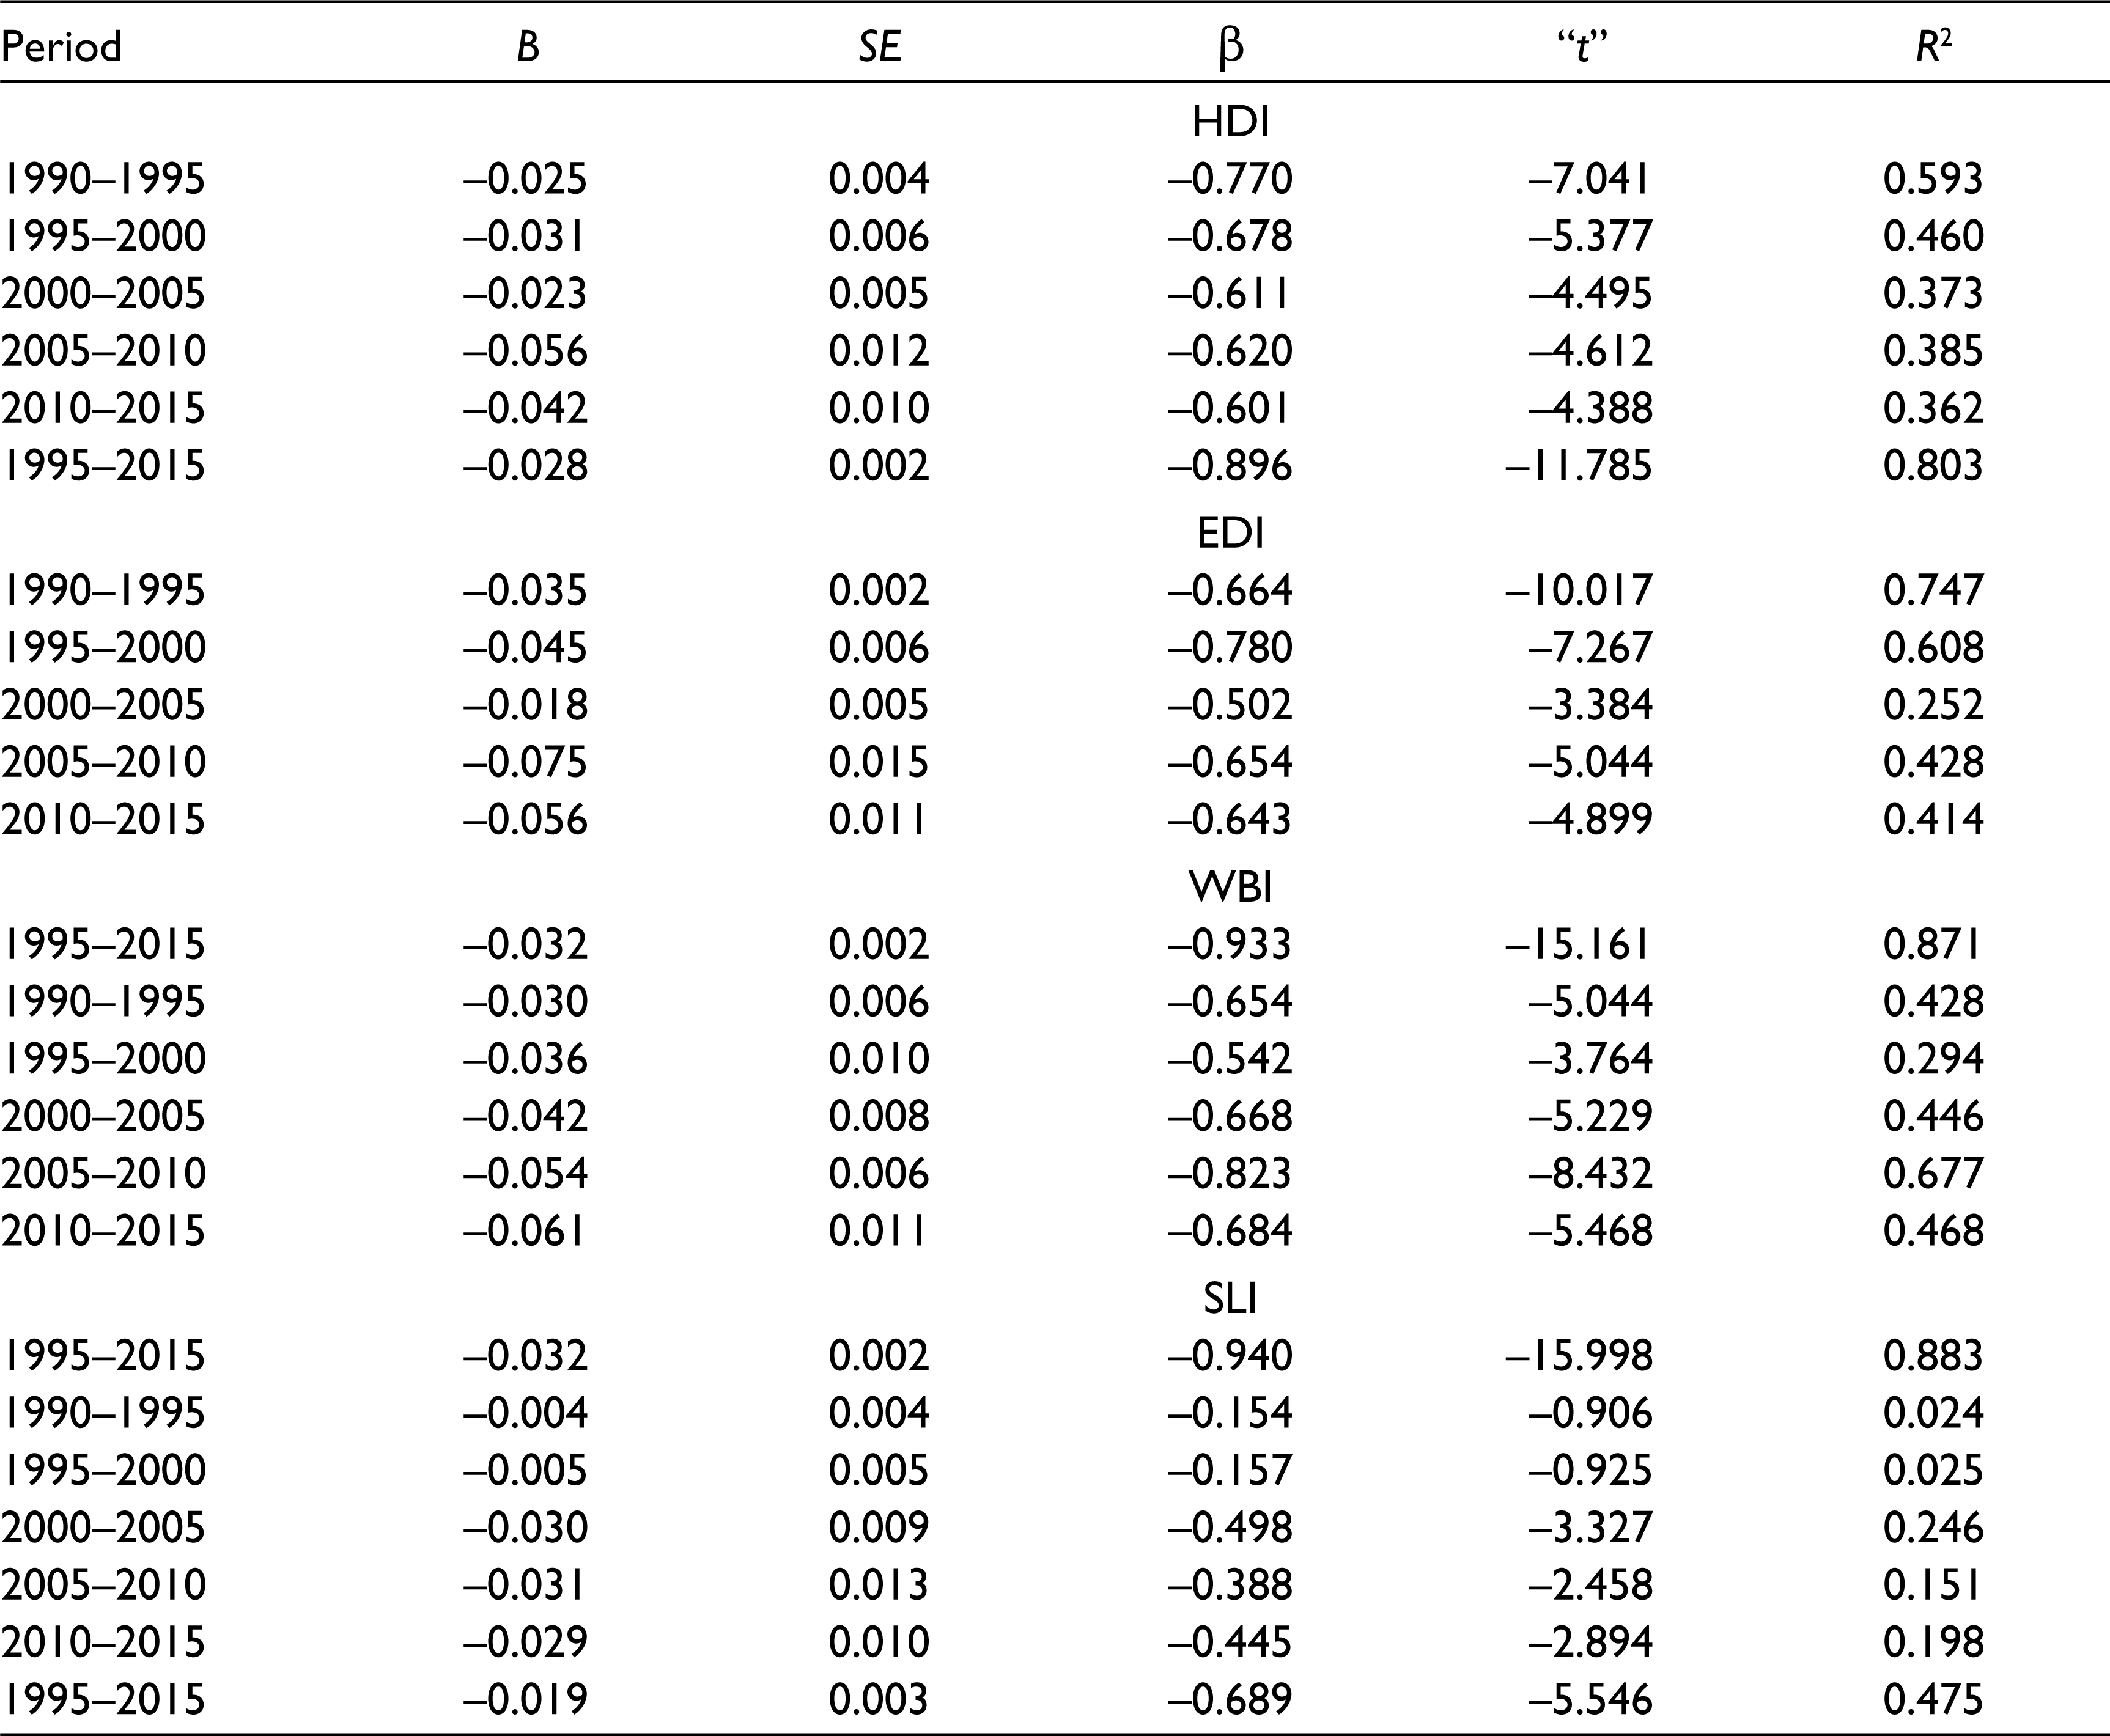
Results of the β-convergence analysis are presented in Table 3. The analysis has been carried out for the period 1990–2015 as well as for different five-year periods as the long-term assessment of convergence may hide the trend in convergence in different sub-periods. Moreover, from the policy perspective, improvement in HDI in the recent past is more important than the change in the past (Dorius, 2008). The negative regression coefficient of the average annual rate of the increase in HDI during 1995–2015 on the level of HDI in 1990 confirms β-convergence in HDI across states/union territories during the period under reference. This observation is also supported by Figure 3 which shows that, in general, lower the HDI in 1995, faster the improvement in HDI during 1995–2015. Table 3 also suggests β-convergence in HDI across states/union territories in different five-year sub-periods, although the speed of convergence was different in different five-year periods—the fastest during 2005–2010 but the slowest during 2000–2005. Among different dimensions of human development, the speed of convergence was very slow in the dimension of the standard of living compared to the speed of convergence in the health or well-being and the education dimension of human development.
Convergence Analysis of HDI in India
On the other hand, the coefficient of variation also decreased throughout the period under reference that indicates σ-convergence in HDI across states/union territories (Table 4). In 1990, the gap between the highest and the lowest HDI across states and union territories was 0.338 or the highest HDI was almost 90 per cent higher than the lowest HDI in 1990. By the year 2015, this gap reduced to 0.200 that implies that the highest HDI was only around 36 per cent higher than the lowest HDI in 2015. This means that progress during 1990–2015 was relatively faster in those states/union territories where human development was low in 1990 as compared to those states/union territories where human development was relatively advanced. The index of diversity (Shannon, 1948) in HDI across states/union territories also decreased during this period which confirms that the inter-state/union territory variation in HDI has decreased over time.
Inter-state Diversity in HDI in India, 1990–2015
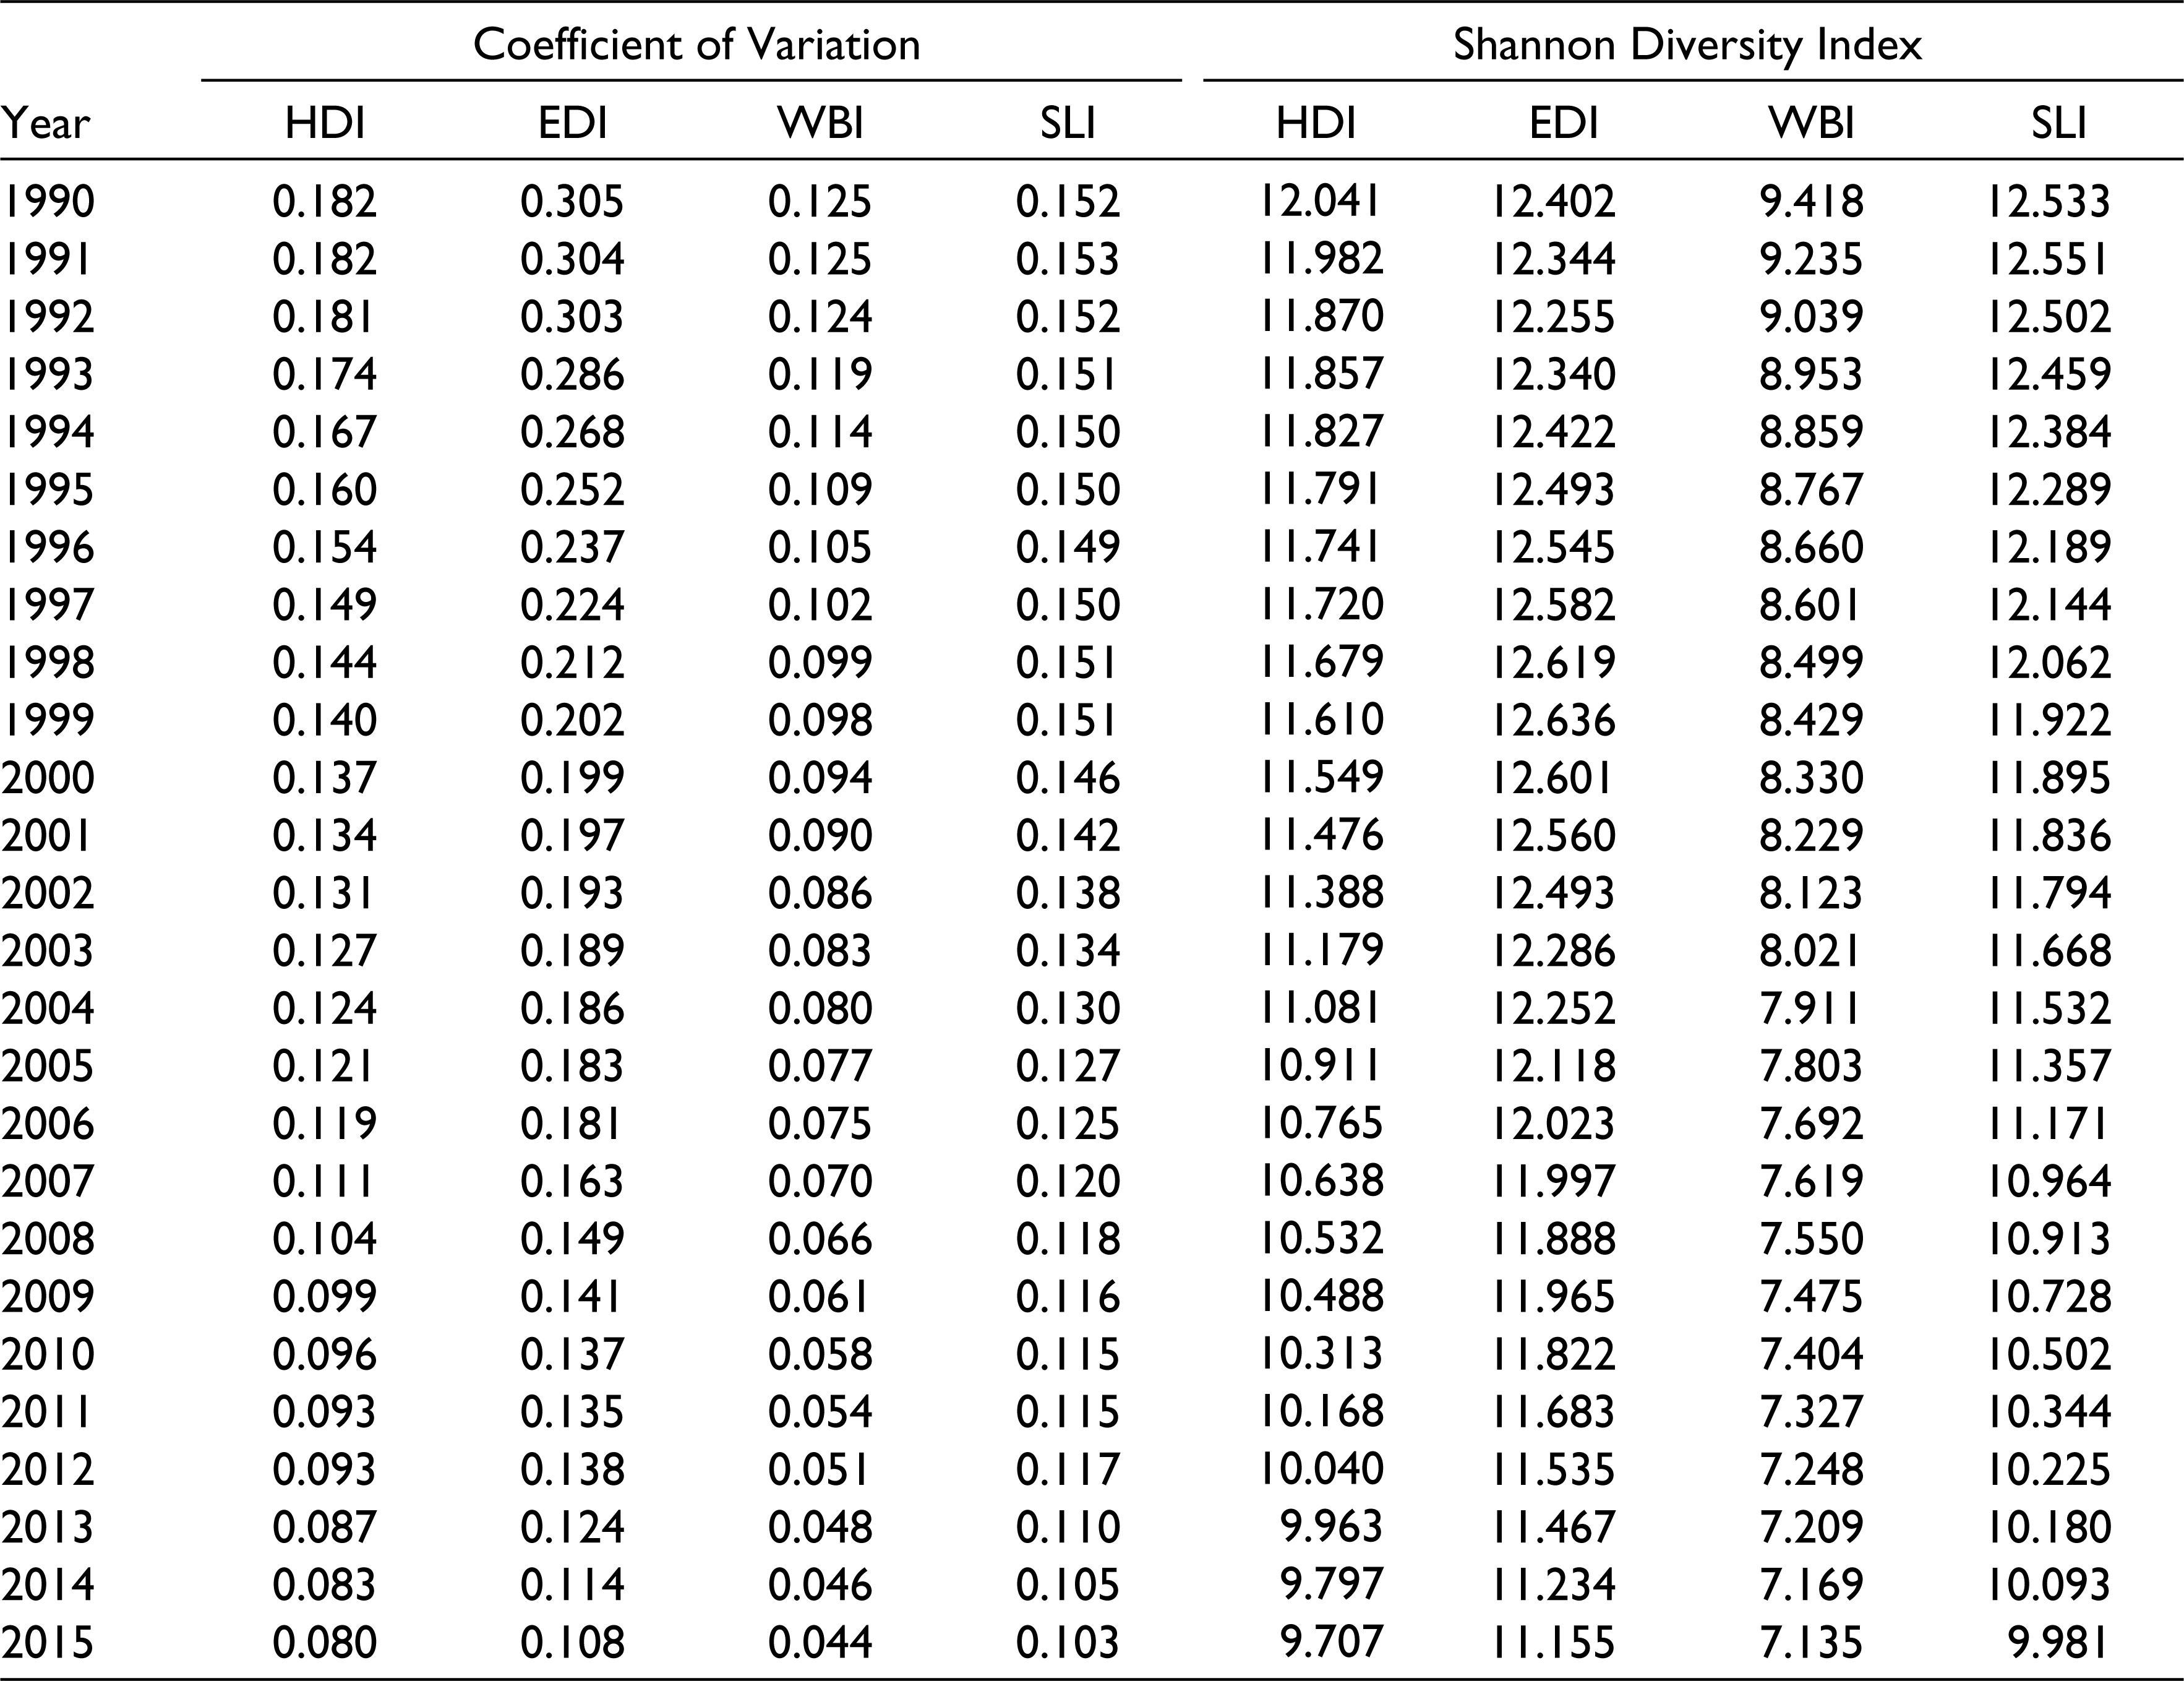
The σ-convergence across states/union territories in HDI was also associated with σ-convergence across states/union territories in all the three dimensions of human development. The decrease in the coefficient of variation was, however, the fastest in the education dimension but the slowest in the standard of living dimension. Similarly, the index of inter-state/union territory disparity in all the three dimensions of human development also decreased during the period under reference. In other words, the distribution of HDI, as well as EDI, WBI and SLI, across states/union territories was more equitable in 2015 compared to that in 1990. The fact that σ-convergence was associated with β-convergence suggests that the increased equality in human development across states/union territories was the result of the catching-up process which is a necessary precondition for β-convergence. The progress has been relatively faster in those states/union territories where human development was relatively low as compared to states/union territories where human development was relatively high in 1990. There is however still scope for further improvement in human development even in those states where human development was high in 2015 as there was not state/union territory where human development was very high in 2015.
Decomposition of the Change in HDI
The change in HDI is the result of the change in the change in EDI, WBI and SLI. By definition,
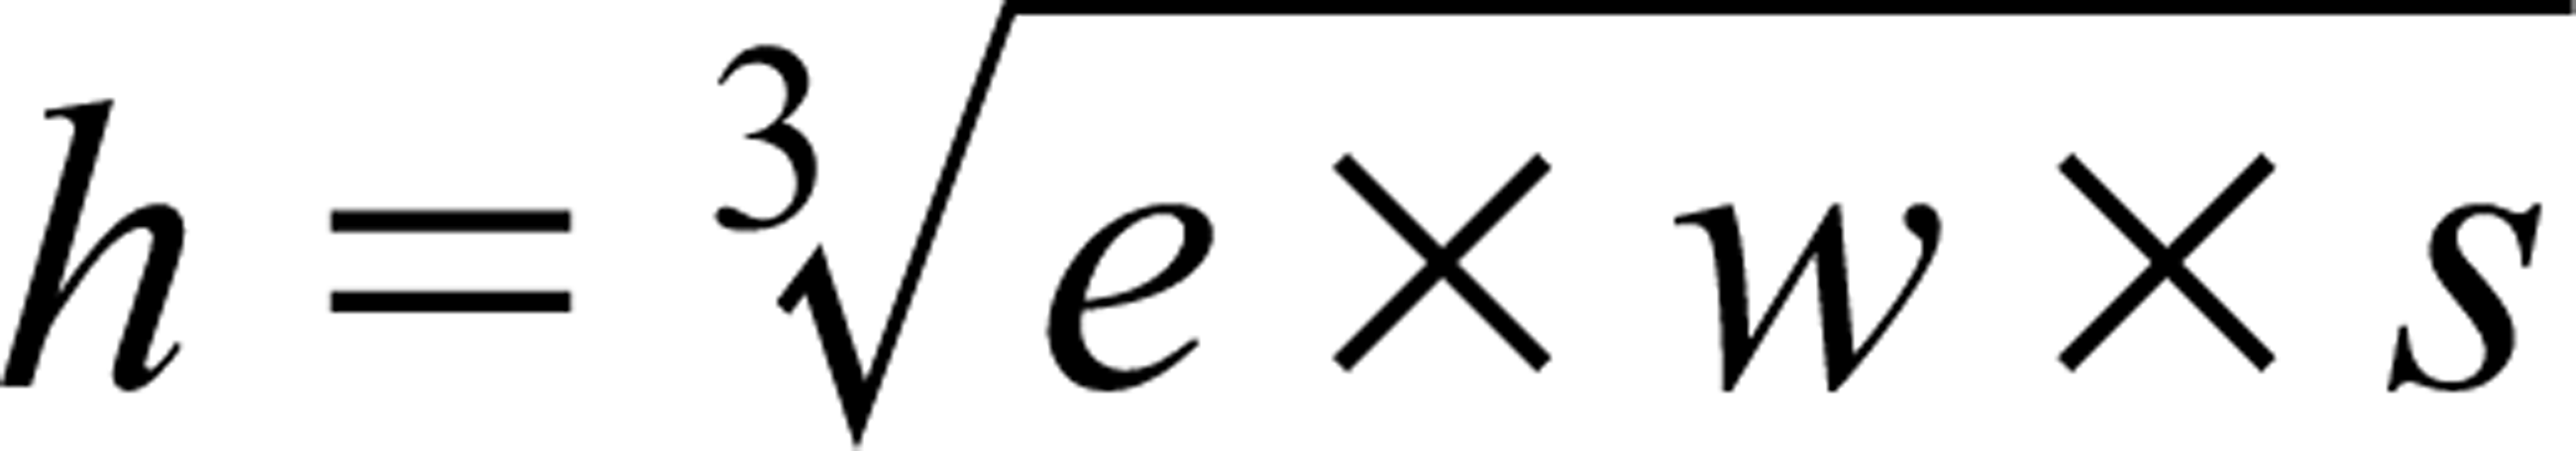
where h stands for HDI, e for EDI; w for WBI and s for SLI. Following Ang (2016), the change in h overtime may be decomposed as
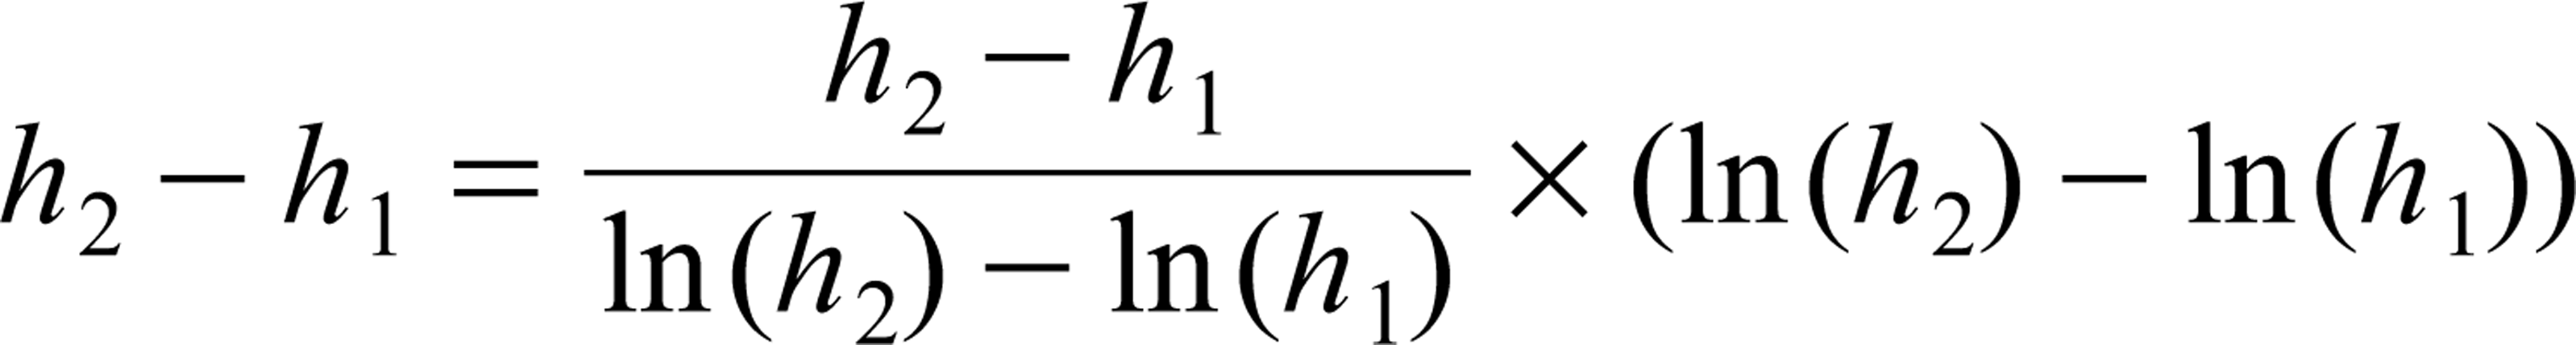
Now

Substituting, we get
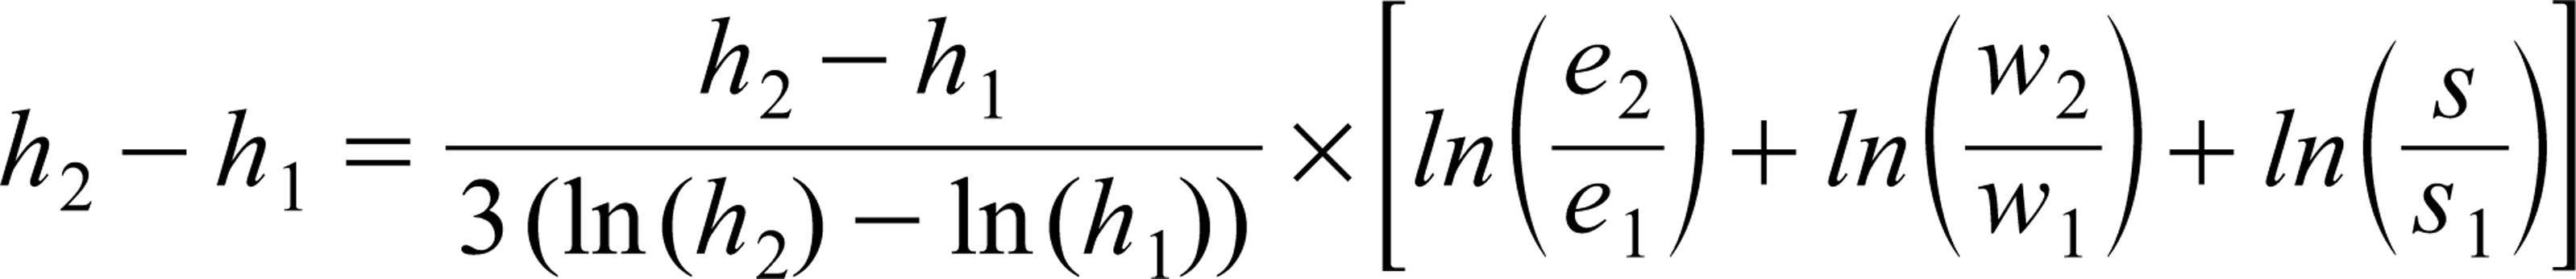
or

where
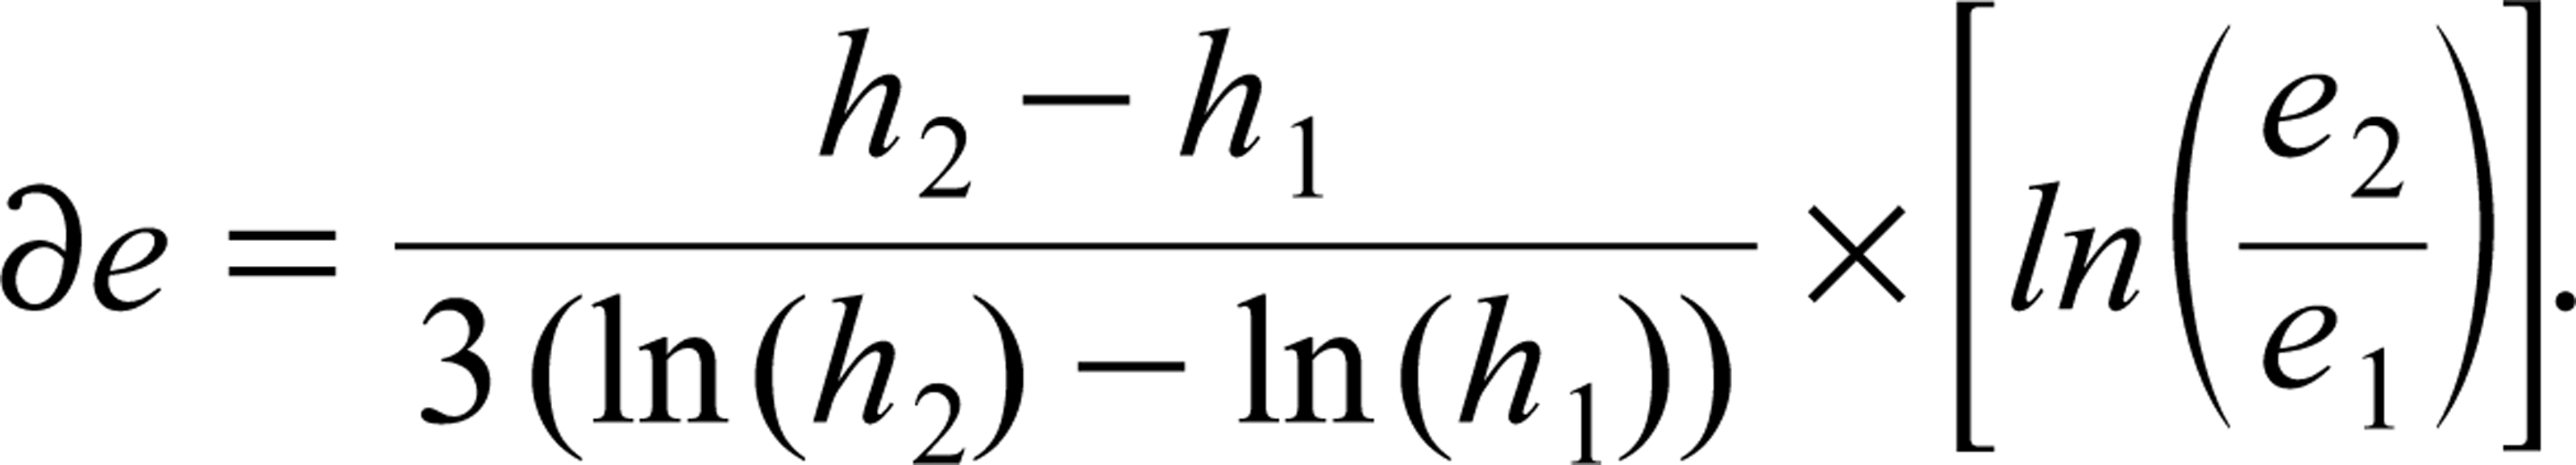
Results of the decomposition analysis are presented in Table 5. Almost half of the increase in HDI in India between 1990 and 2015 was attributed to the increase in EDI, around 30 per cent to the increase in SLI and only around 20 per cent to the increase in WBI. In other words, the progress in human development in India, during 1990–2015, had largely been the result of the progress in the education dimension of human development. On the other hand, the relatively slow progress in the health or well-being dimension of human development appeared to be largely responsible for relatively slow progress in human development in the country.
Decomposition of the Increase in HDI in India, 1990–2015
The relative contribution of the change in EDI, WBI and SLI to the change in HDI has also been different in different five-year periods of the period under reference. Interestingly, the relative contribution of the change in EDI and SLI to the change in HDI increased over time but the relative contribution of the change in WBI to the change in HDI decreased over time. During 1990–1995, change in WBI accounted for almost 30 per cent of the change in HDI and this contribution was larger than that of the contribution of the change in SLI. By comparison, the change in WBI accounted for less than 17 per cent of the change in HDI during 2010–2015. On the other hand, the relative contribution of the change in EDI and SLI to the change in HDI almost doubled during the period under reference. The decomposition analysis suggests that the improvement in the health dimension had been comparatively slower than that in the education and standard of living dimensions of human development.
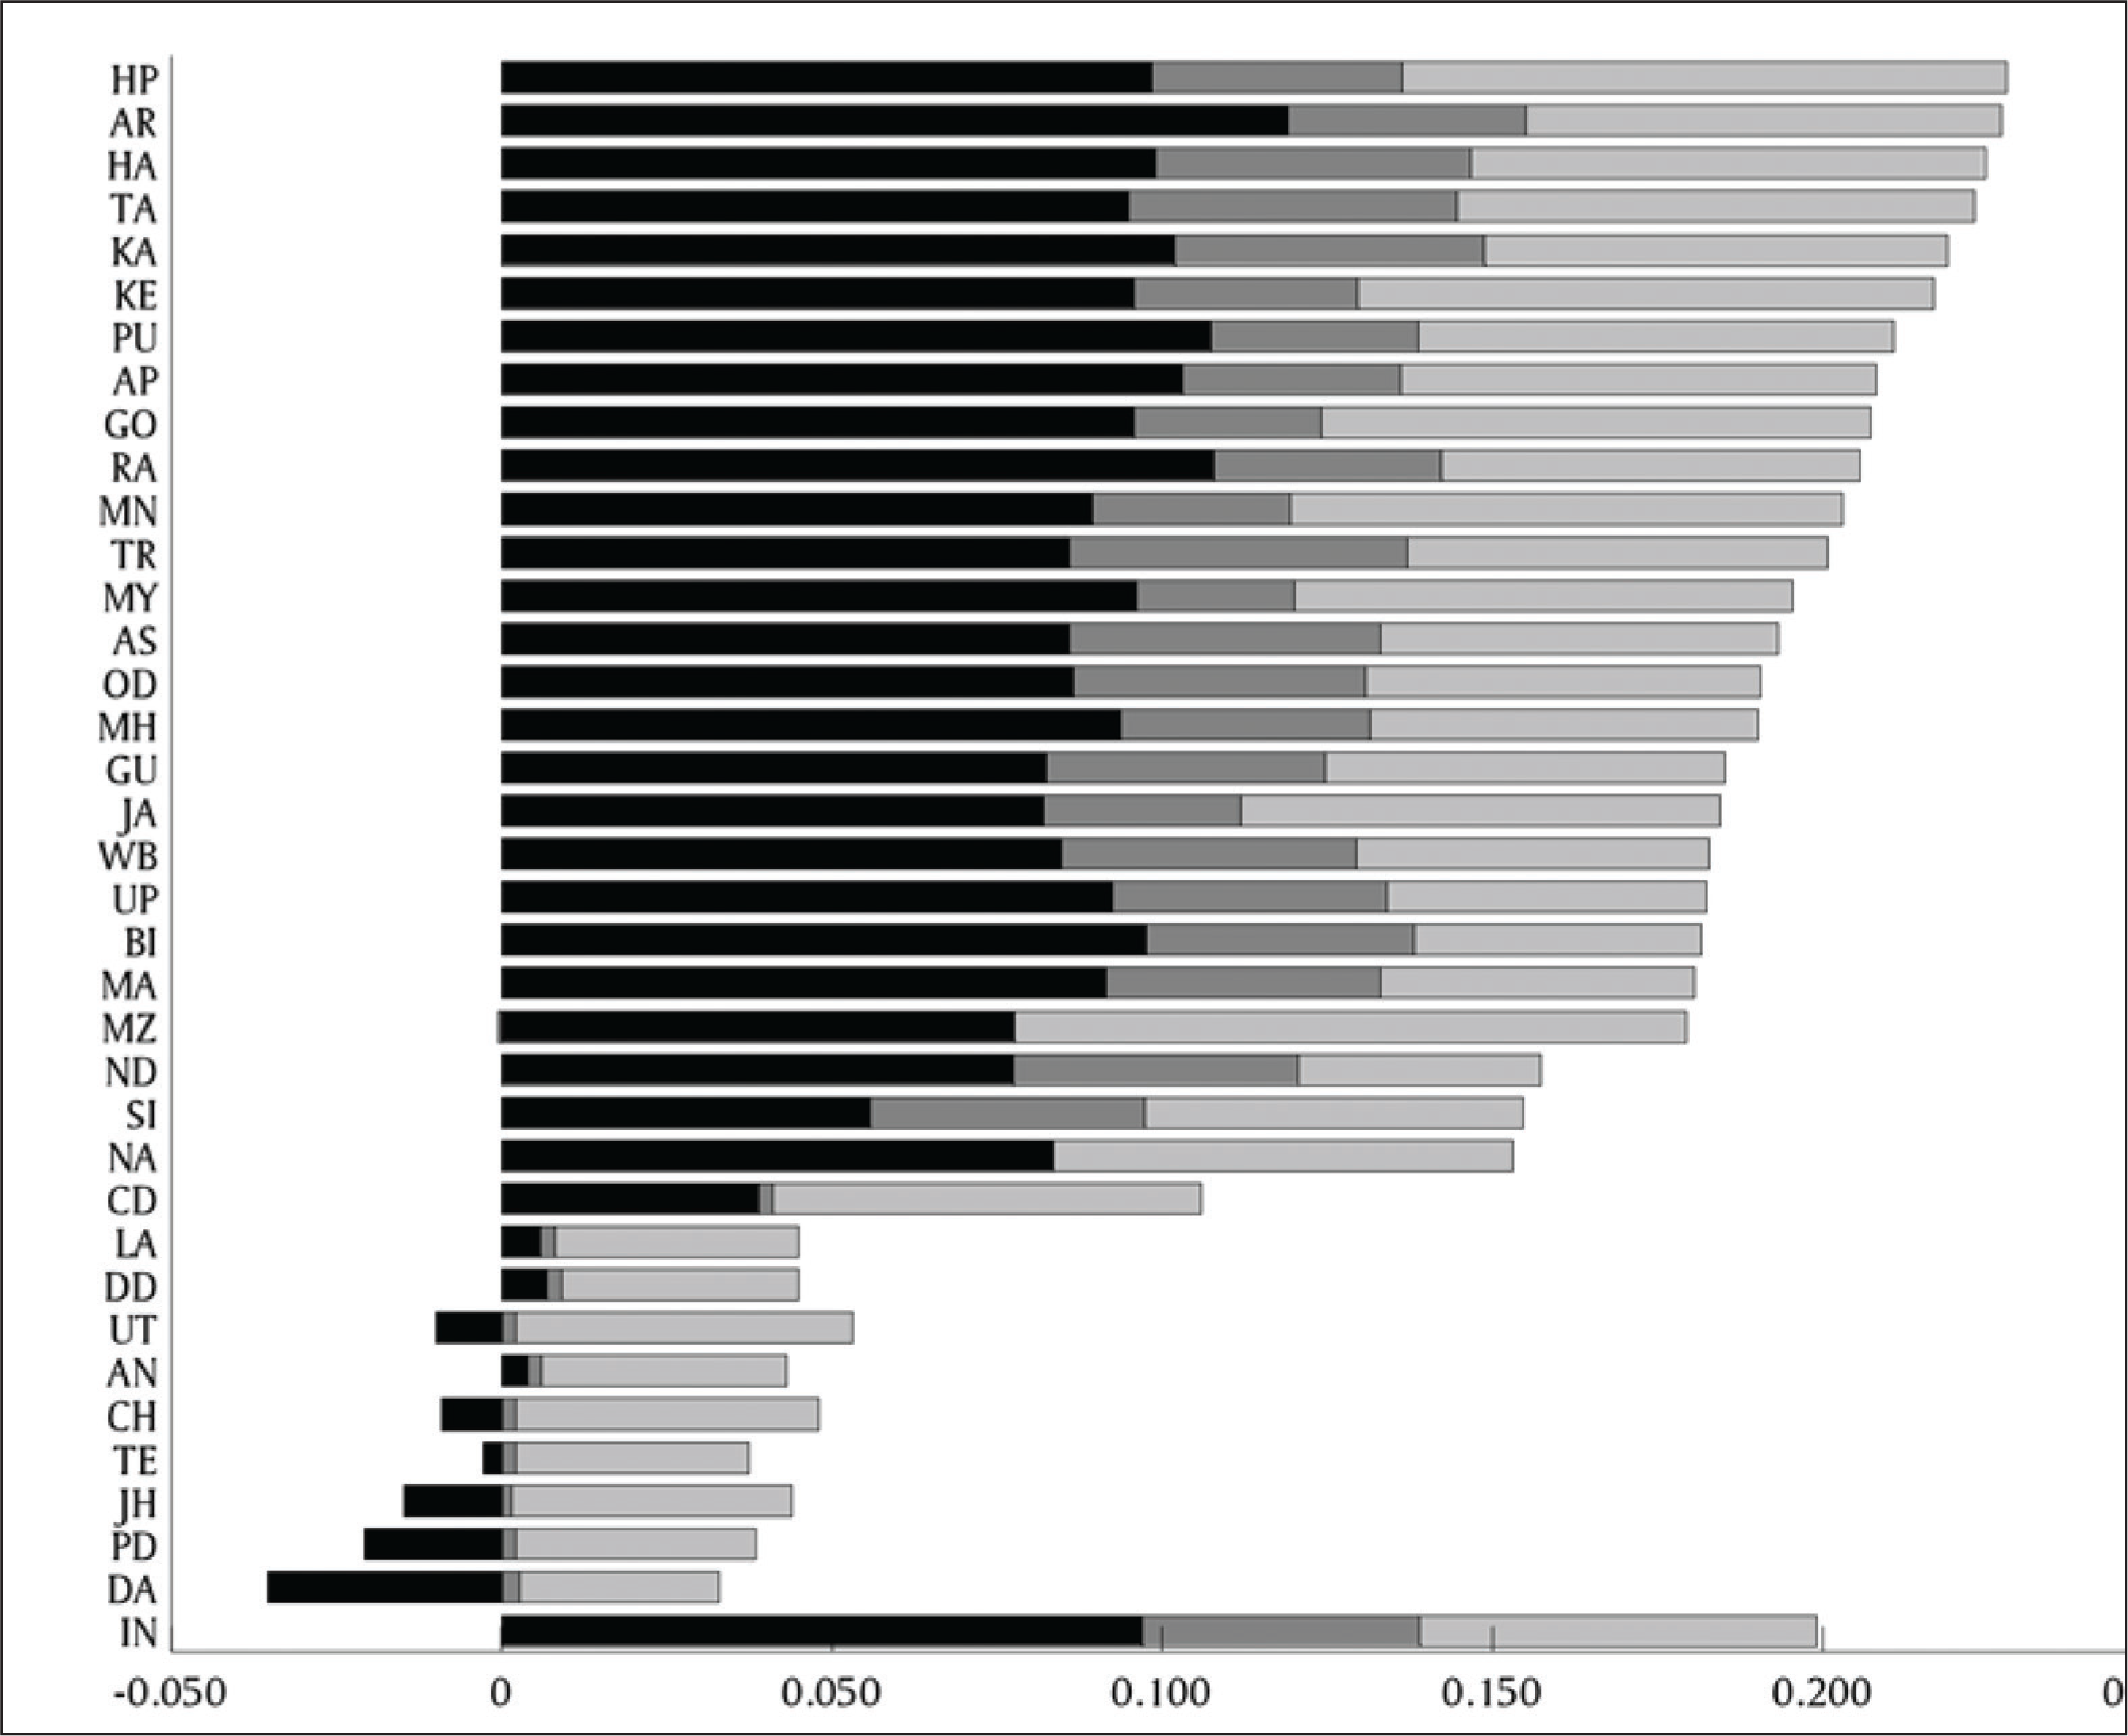
The contribution of the change in EDI, WBI and SLI to the change in HDI has also varied widely across states/union territories during the period under reference (Table 6). There is only one state/union territory—Dadra and Nagar Haveli—where HDI decreased, instead increased, during the period under reference, primarily because EDI decreased very rapidly from 0.691 in 1990 to 0.589 in 2015 and the increase in WBI was, at best, marginal (Figure 4). Although, SLI increased from 0.550 in 1991 to 0.680 in the union territory, yet, this increase in SLI was more than offset by the decrease in EDI. In addition, the increase in HDI was relatively slow in eight states/union territories. In five of these states/union territories, EDI decreased while the increase in WBI was very slow. The increase in HDI in these states/union territories was primarily due to the increase in SLI.
Decomposition of the Increase in HDI in States/Union Territories, 1990‒2015
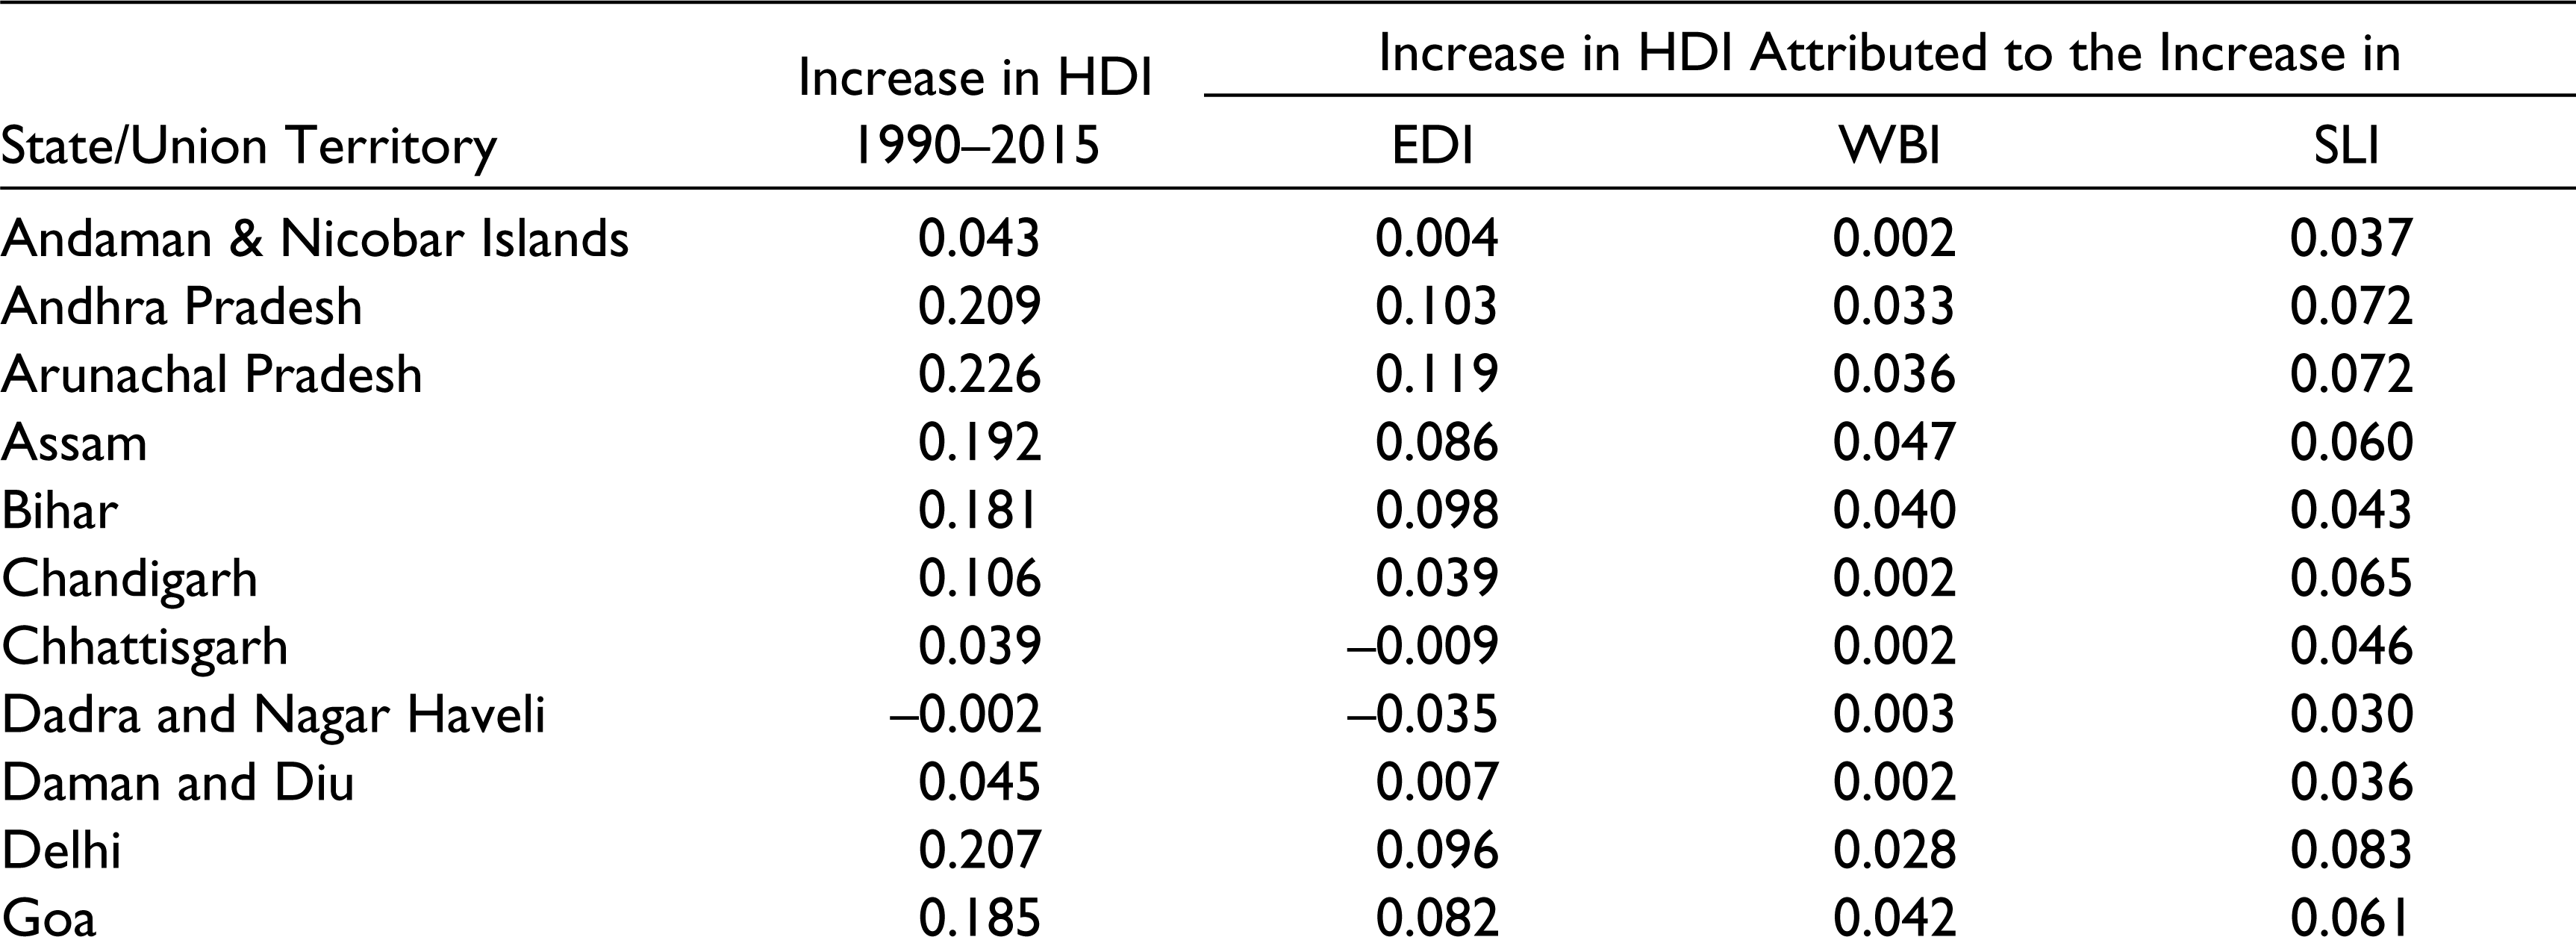
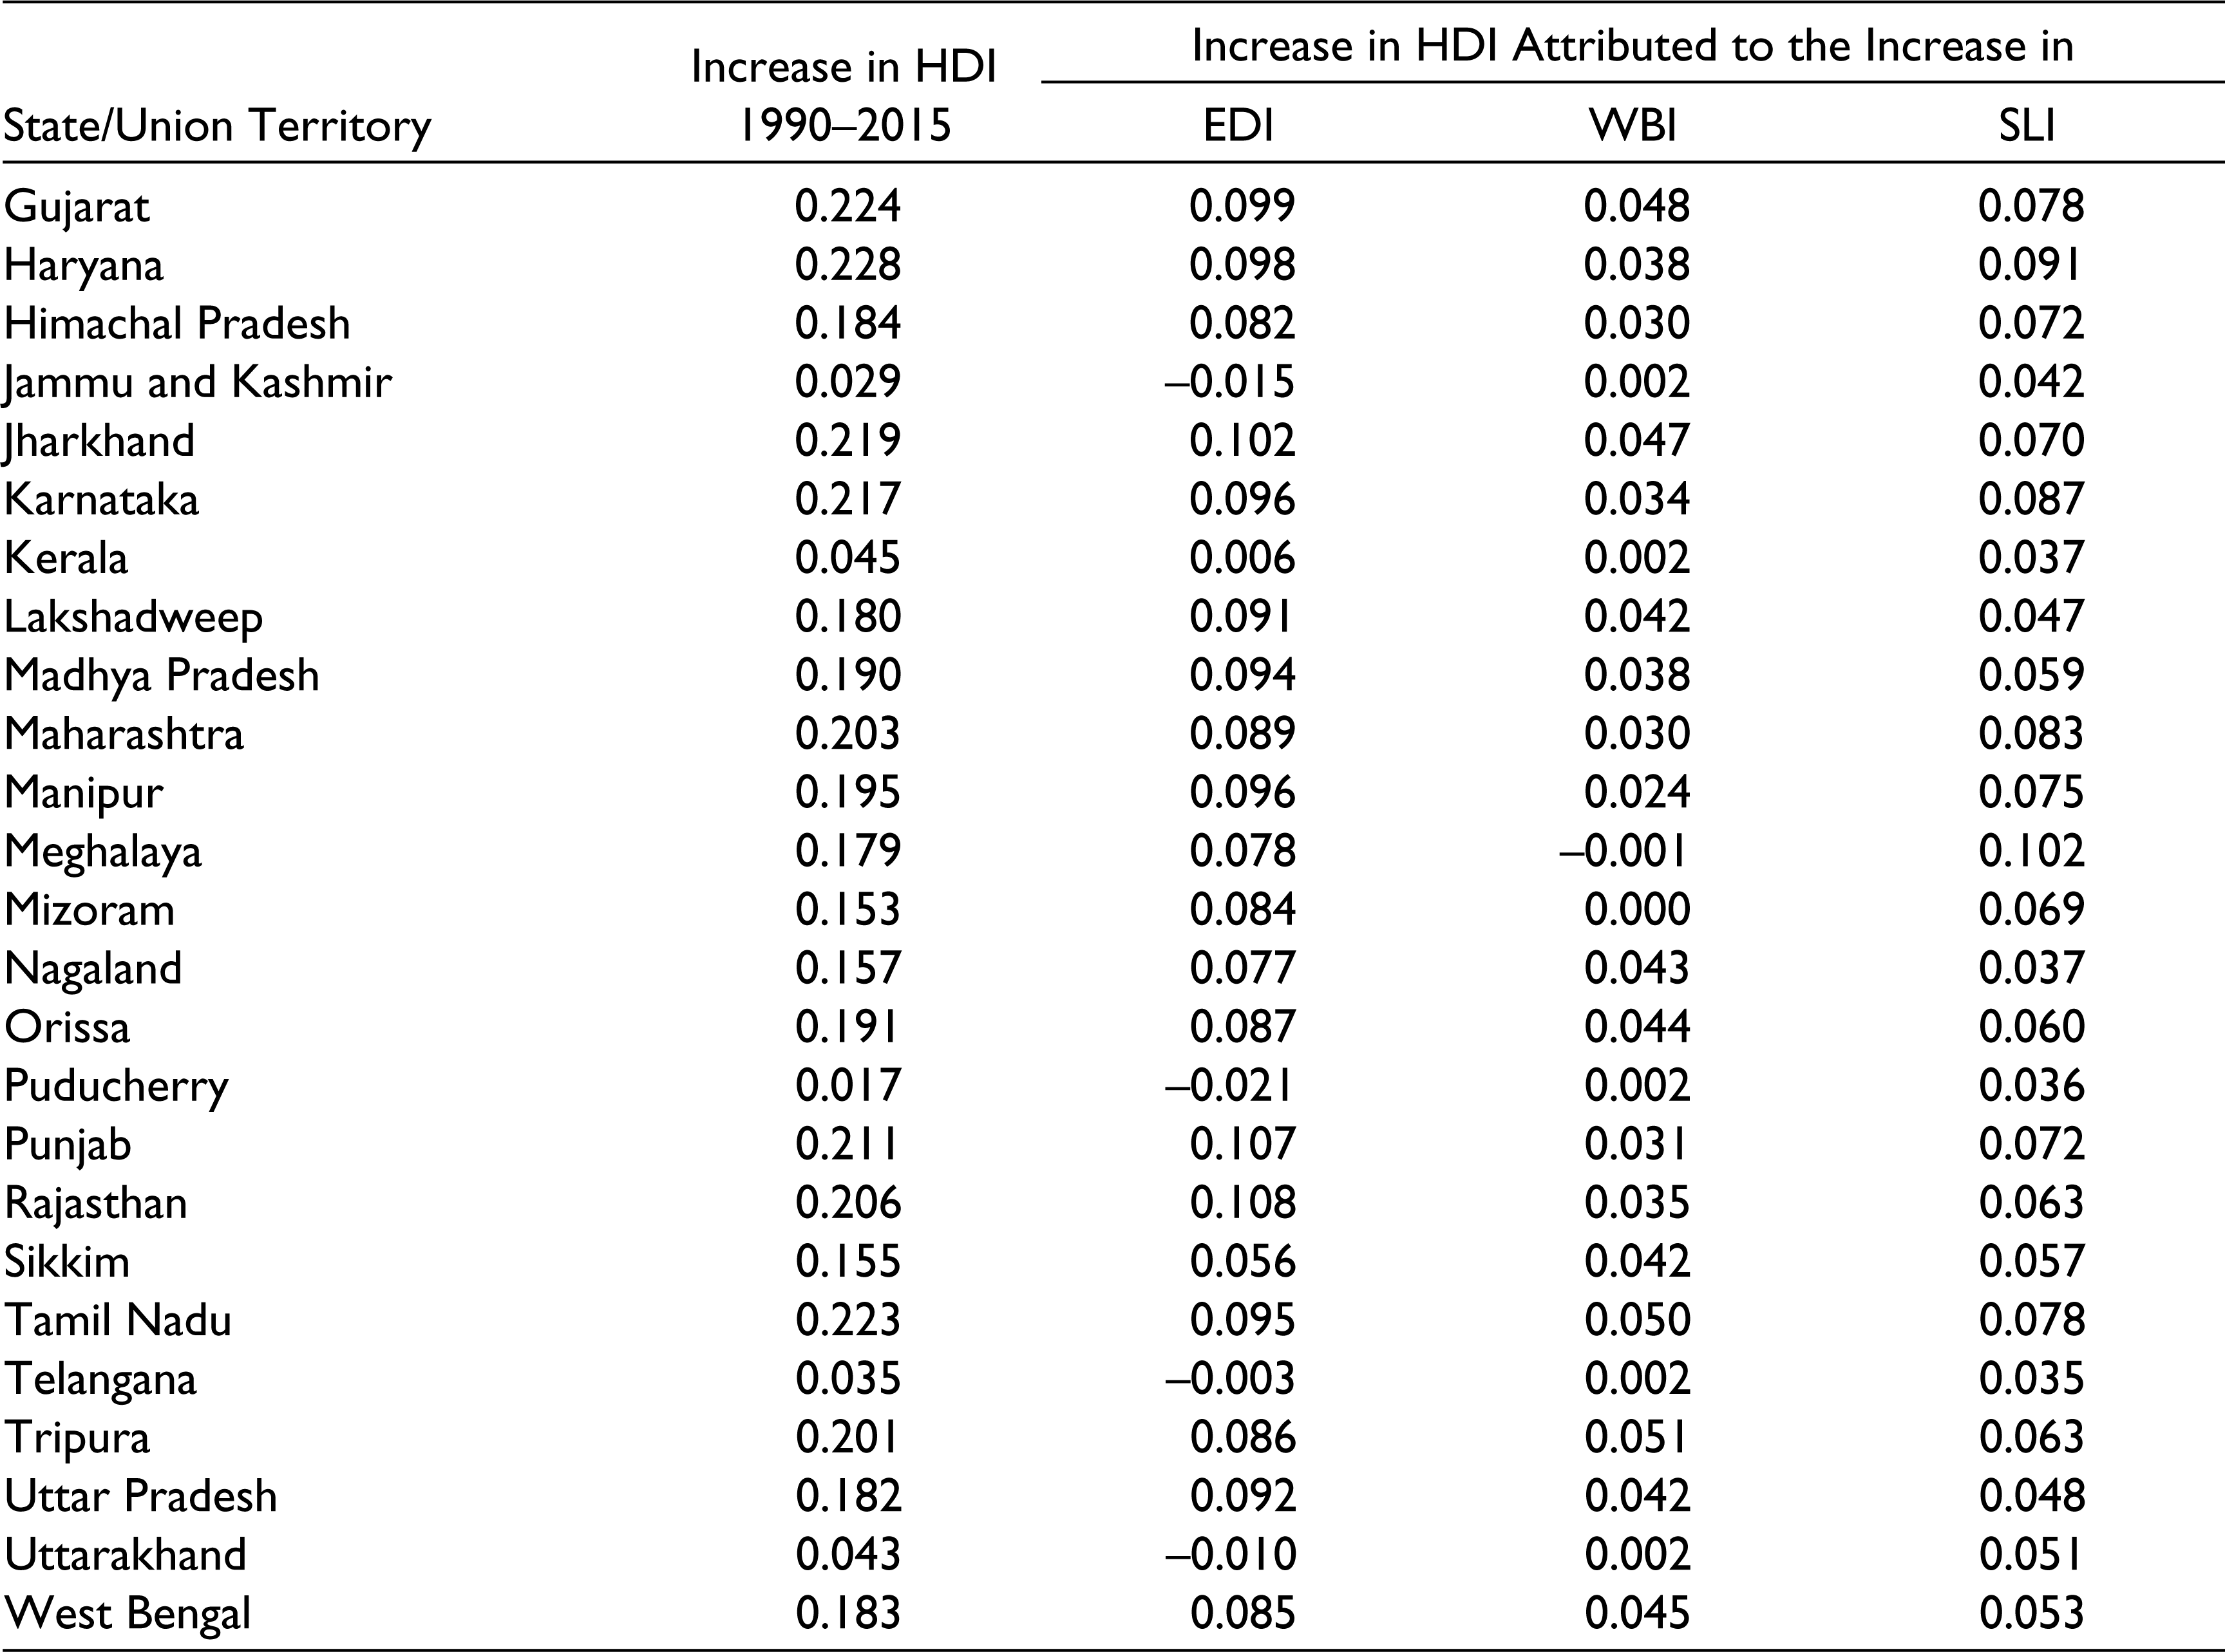
Decomposition of the Increase in HDI During 1990–2015
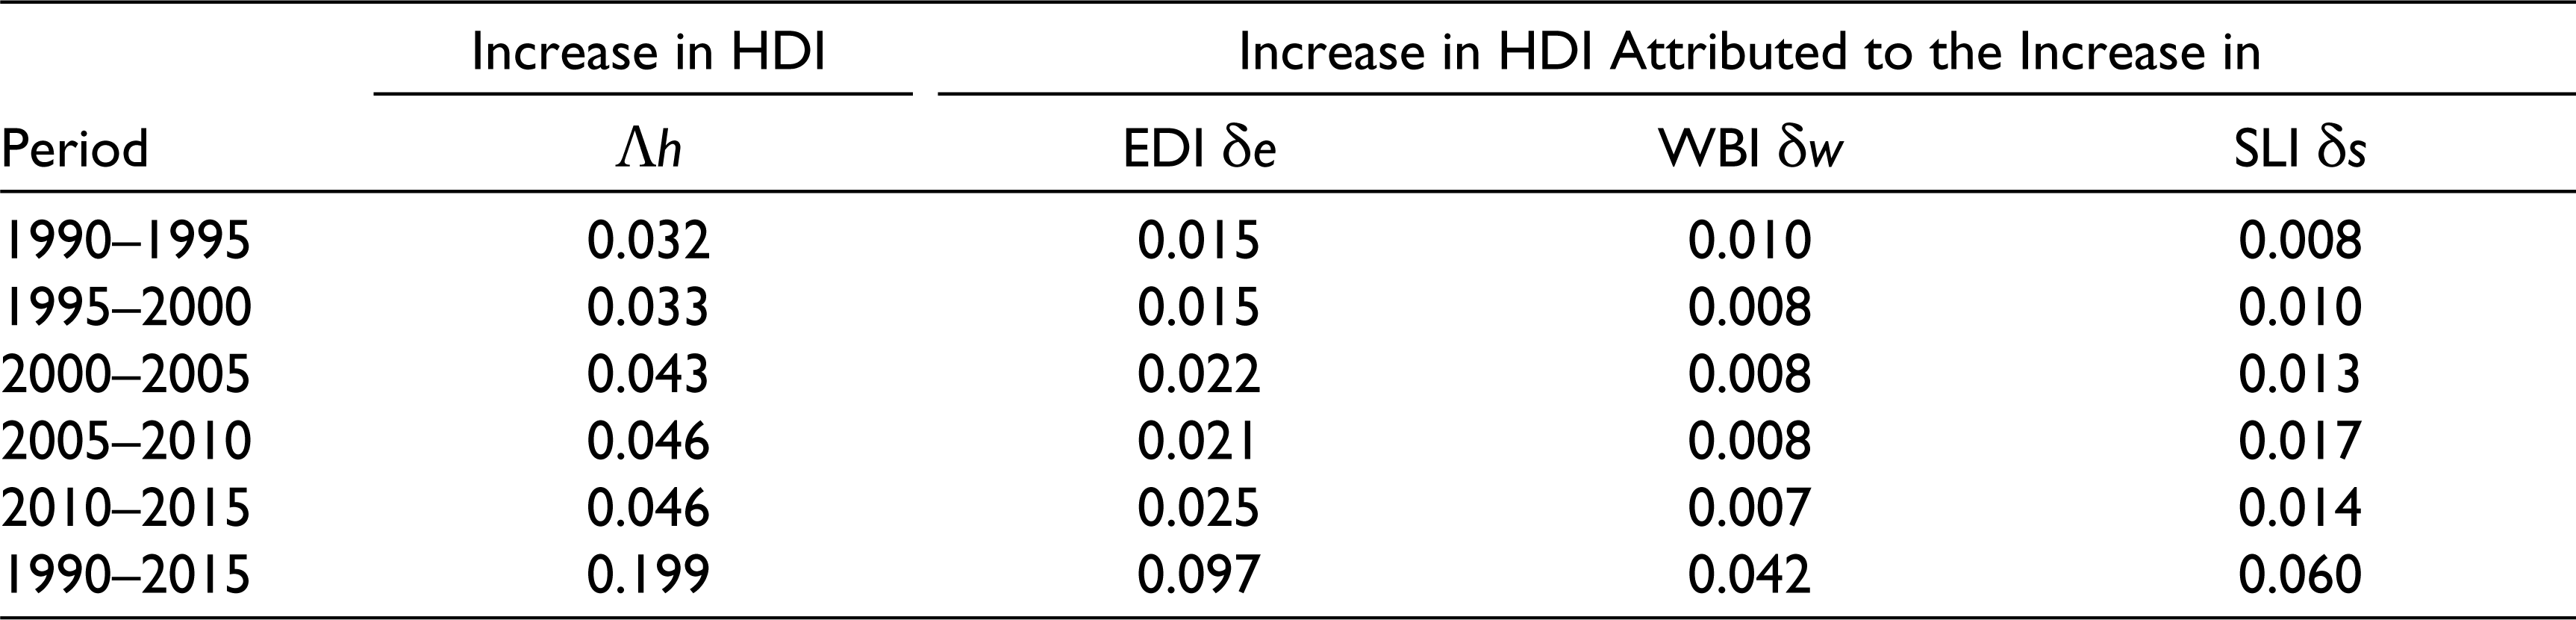
Since the change in HDI is determined by the change in EDI, WBI and SLI, the naive regression or correlation approaches to analyse how the change in EDI, WBI and SLI influence the change in HDI, which ignore the sum constraint, are potentially problematic (Poorter & van der Werf, 1998; Wright & Westoby, 2001). Alternatively, it is more appealing to decompose the inter-state/union territory variance in the change in HDI (Λh) into inter-state/union territory variance and covariance in the contribution of the change in EDI (δe), WBI (δw) and SLI (δs). It can be shown that
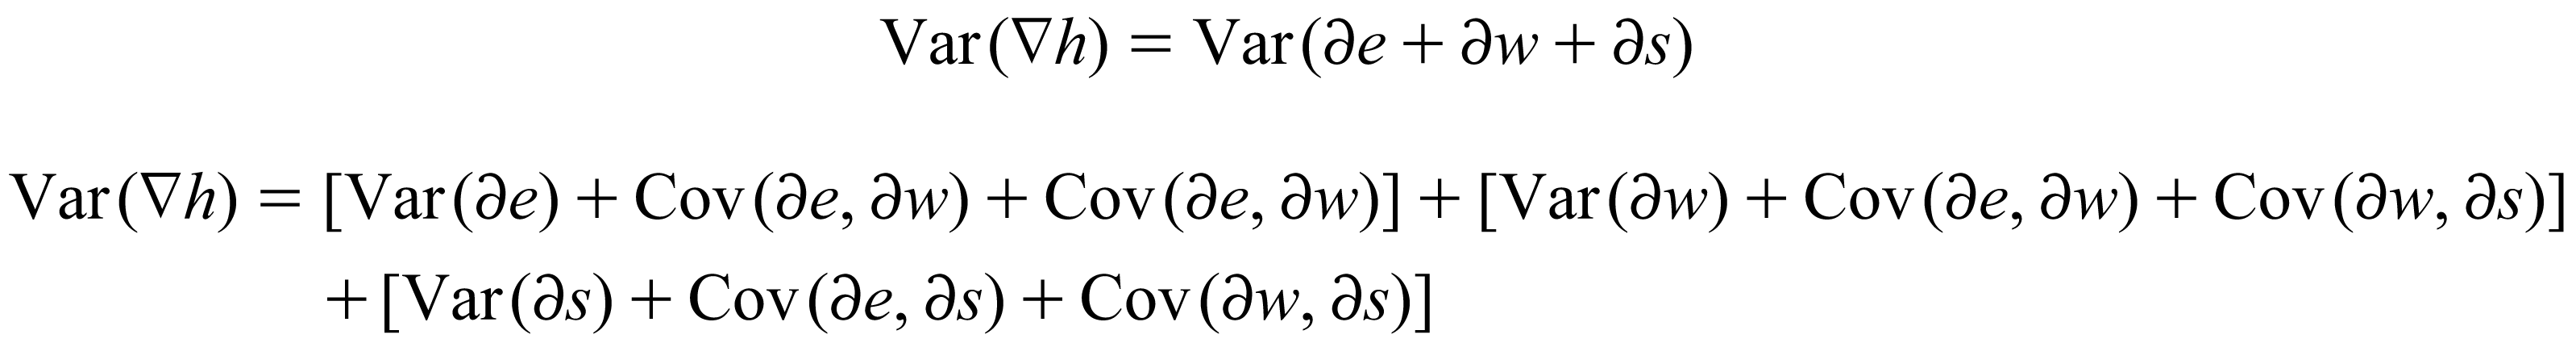
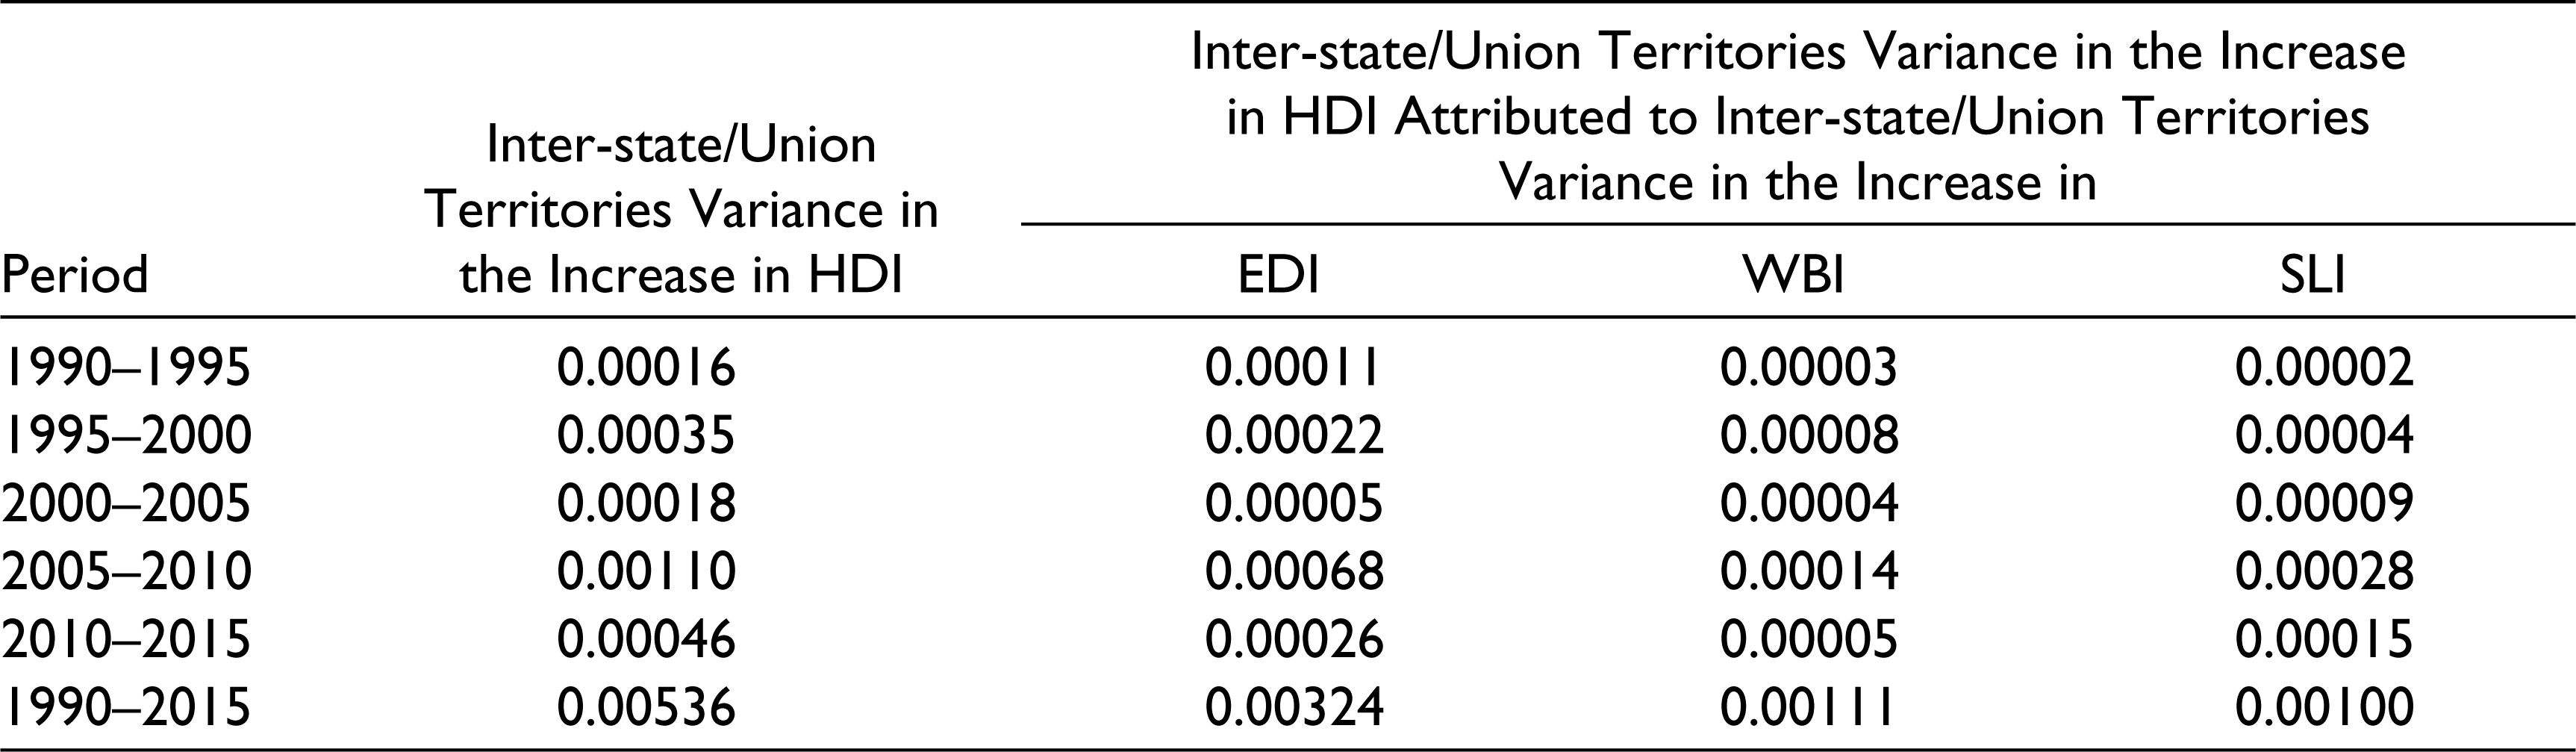
Results of the decomposition of the inter-state/union territory variance in the change in HDI are presented in Table 7. More than 60 per cent of the inter-state/union territory variance in the change in HDI was the result of the inter-state/union territory variation in the change in EDI. By contrast, the contribution of the inter-state/union territory variance in the change in WBI and SLI is only about 20 per cent. In other words, the volatility in the change in HDI across states/union territories was largely due to the volatility in the change in EDI. In many states/union territories, gains in health and standard of living dimensions offset, to a varying degree, by the losses in the education dimension of human development leading to the slowing down the progress in human development.
Decomposition of the Inter-state/Union Territory Variance in the Increase in HDI.
Discussion and Conclusions
The empirical evidence presented in the foregoing pages highlights the slow progress of human development in India and its constituent states and union territories during the 25 years between 1990 and 2015. The country still remains in the medium category of human development by international standards. Moreover, the unevenness in the human progress across states/union territories of the country continues to be quite pervasive, although there is evidence that the diversity in human development across states/union territories decreased during 1990–2015. There is, however, no state/union territory in the country where human development was very high as late as in 2015 as reflected through HDI. This means that there remains substantial scope for hastening the pace of human development even in those states/union territories where human development is relatively advanced vis-à-vis other states/union territories of the country.
The analysis also suggests that the progress in the three dimensions of human development has also been uneven in the country and its constituent states/union territories. The progress in the education dimension has been relatively the fastest at the country level but, at the same time, highly volatile at state/union territory level. There are many states/union territories where the situation appears to have worsened, not improved, despite all investment in education. On the other hand, the progress in health or well-being dimension of human development has been comparatively slower than that in the dimensions of the standard of living in all but one state/union territory. It is only in Delhi, where the contribution of the improvement in the dimension of health or well-being to the improvement in human development was more than that of the dimension of the standard of living.
From the policy perspective, the analysis emphasises the need for an integrated, state/union territory-specific approach to hasten the pace of human development. The analysis suggests that meeting the health needs of the people of the country probably and so obviously remains perhaps the most daunting challenge by way of progress in human development. At the same time, poor performance in the education dimension of human development in a number of states/union territories of the country also appears to be a cause of concern. It appears that reducing disparities across inter-state/union territory in the three dimensions of human development may contribute significantly towards hastening the pace of human development in the country. There is, therefore, the need for a state/union territory-specific approach of planning and programming for human development, which should be the basis for development planning and programming in the country.
One requirement for institutionalising such an approach is developing a system of monitoring the human progress at least at state/union territory level so that human development issues and concerns occupy the centre stage in the development discourse. This system may provide annual estimates of HDI for the states/union territories which may become the basis for giving human development orientation to development planning and programming. This is a challenging task as India’s official statistical system is not geared to measure and monitor human progress. In this context, it is suggested that the national sample survey conducted annually by the Ministry of Statistics and Programme Implementation of the Government of India should generate state/union territory-specific data related to indicators used to estimate HDI on an annual basis. The national sample survey already covers a number of issues and concerns related to human development but lacks a composite, human development, approach to generate data that can facilitate monitoring the human progress in the country. It is the need of the time that economic growth alone should not be the basis for development planning in India. Rather, a multi- dimensional approach encompassing health, education and other human development concerns are given due recognition in the development planning process of the country.
Footnotes
Declaration of Conflicting Interests
The author declared no potential conflicts of interest with respect to the research, authorship and/or publication of this article.
Funding
The author received no financial support for the research, authorship and/or publication of this article.
Appendix
Estimates of HDI, EDI, WBI and SLI for India and States/Union Territories, 1990–2015
| Country/State/Union Territory | 1990 | 1991 | 1992 | 1993 | 1994 | 1995 | 1996 | 1997 | 1998 | 1999 | 2000 | 2001 | 2002 | 2003 | 2004 | 2005 | 2006 | 2007 | 2008 | 2009 | 2010 | 2011 | 2012 | 2013 | 2014 | 2015 |
| HDI | ||||||||||||||||||||||||||
| India | 0.428 | 0.432 | 0.439 | 0.445 | 0.452 | 0.460 | 0.467 | 0.473 | 0.480 | 0.488 | 0.493 | 0.499 | 0.505 | 0.518 | 0.525 | 0.535 | 0.544 | 0.555 | 0.564 | 0.570 | 0.581 | 0.591 | 0.599 | 0.607 | 0.618 | 0.627 |
| Andaman & Nicobar Islands | 0.677 | 0.684 | 0.695 | 0.692 | 0.690 | 0.689 | 0.689 | 0.686 | 0.685 | 0.686 | 0.690 | 0.691 | 0.694 | 0.706 | 0.708 | 0.717 | 0.722 | 0.719 | 0.715 | 0.708 | 0.708 | 0.706 | 0.702 | 0.707 | 0.716 | 0.720 |
| Andhra Pradesh | 0.420 | 0.423 | 0.431 | 0.434 | 0.441 | 0.445 | 0.453 | 0.456 | 0.460 | 0.467 | 0.473 | 0.481 | 0.490 | 0.505 | 0.515 | 0.526 | 0.538 | 0.550 | 0.560 | 0.566 | 0.579 | 0.591 | 0.601 | 0.608 | 0.621 | 0.629 |
| Arunachal Pradesh | 0.433 | 0.437 | 0.444 | 0.451 | 0.458 | 0.467 | 0.475 | 0.479 | 0.487 | 0.495 | 0.499 | 0.502 | 0.508 | 0.519 | 0.524 | 0.533 | 0.540 | 0.567 | 0.591 | 0.611 | 0.638 | 0.663 | 0.683 | 0.675 | 0.670 | 0.659 |
| Assam | 0.406 | 0.410 | 0.418 | 0.425 | 0.433 | 0.443 | 0.453 | 0.460 | 0.468 | 0.477 | 0.483 | 0.489 | 0.497 | 0.510 | 0.518 | 0.528 | 0.537 | 0.546 | 0.553 | 0.558 | 0.568 | 0.576 | 0.583 | 0.586 | 0.594 | 0.598 |
| Bihar | 0.375 | 0.379 | 0.385 | 0.391 | 0.398 | 0.404 | 0.410 | 0.415 | 0.420 | 0.427 | 0.432 | 0.436 | 0.442 | 0.452 | 0.458 | 0.468 | 0.474 | 0.485 | 0.496 | 0.504 | 0.515 | 0.524 | 0.532 | 0.540 | 0.550 | 0.556 |
| Chandigarh | 0.627 | 0.633 | 0.644 | 0.640 | 0.639 | 0.636 | 0.636 | 0.633 | 0.632 | 0.631 | 0.633 | 0.636 | 0.638 | 0.650 | 0.653 | 0.659 | 0.666 | 0.662 | 0.658 | 0.650 | 0.650 | 0.647 | 0.645 | 0.673 | 0.706 | 0.733 |
| Chhattisgarh | 0.555 | 0.559 | 0.569 | 0.566 | 0.564 | 0.561 | 0.561 | 0.557 | 0.556 | 0.557 | 0.557 | 0.559 | 0.562 | 0.572 | 0.577 | 0.583 | 0.588 | 0.585 | 0.581 | 0.573 | 0.573 | 0.573 | 0.569 | 0.576 | 0.587 | 0.594 |
| Dadra and Nagar Haveli | 0.666 | 0.672 | 0.684 | 0.680 | 0.679 | 0.678 | 0.678 | 0.675 | 0.673 | 0.676 | 0.677 | 0.679 | 0.683 | 0.693 | 0.697 | 0.705 | 0.711 | 0.709 | 0.705 | 0.697 | 0.696 | 0.693 | 0.691 | 0.680 | 0.675 | 0.664 |
| Daman and Diu | 0.646 | 0.652 | 0.662 | 0.661 | 0.657 | 0.658 | 0.658 | 0.657 | 0.656 | 0.658 | 0.660 | 0.661 | 0.664 | 0.675 | 0.677 | 0.685 | 0.690 | 0.688 | 0.684 | 0.678 | 0.678 | 0.676 | 0.673 | 0.678 | 0.685 | 0.691 |
| Delhi | 0.572 | 0.577 | 0.588 | 0.596 | 0.606 | 0.615 | 0.627 | 0.636 | 0.644 | 0.657 | 0.660 | 0.663 | 0.665 | 0.677 | 0.680 | 0.688 | 0.693 | 0.698 | 0.701 | 0.702 | 0.707 | 0.711 | 0.714 | 0.717 | 0.727 | 0.730 |
| Goa | 0.546 | 0.551 | 0.561 | 0.566 | 0.571 | 0.577 | 0.583 | 0.588 | 0.593 | 0.601 | 0.608 | 0.617 | 0.628 | 0.645 | 0.654 | 0.669 | 0.680 | 0.697 | 0.709 | 0.719 | 0.736 | 0.750 | 0.763 | 0.758 | 0.758 | 0.753 |
| Gujarat | 0.466 | 0.471 | 0.479 | 0.483 | 0.488 | 0.493 | 0.500 | 0.504 | 0.510 | 0.516 | 0.524 | 0.530 | 0.538 | 0.551 | 0.558 | 0.570 | 0.580 | 0.587 | 0.593 | 0.597 | 0.606 | 0.612 | 0.620 | 0.629 | 0.641 | 0.651 |
| Haryana | 0.462 | 0.468 | 0.475 | 0.482 | 0.492 | 0.502 | 0.512 | 0.519 | 0.529 | 0.540 | 0.544 | 0.550 | 0.557 | 0.570 | 0.577 | 0.587 | 0.596 | 0.606 | 0.616 | 0.621 | 0.634 | 0.644 | 0.652 | 0.663 | 0.675 | 0.686 |
| Himachal Pradesh | 0.475 | 0.479 | 0.488 | 0.500 | 0.513 | 0.525 | 0.539 | 0.550 | 0.562 | 0.575 | 0.583 | 0.591 | 0.601 | 0.618 | 0.627 | 0.640 | 0.651 | 0.658 | 0.660 | 0.660 | 0.667 | 0.671 | 0.675 | 0.682 | 0.696 | 0.703 |
| Jammu and Kashmir | 0.489 | 0.493 | 0.501 | 0.503 | 0.505 | 0.508 | 0.511 | 0.510 | 0.512 | 0.517 | 0.523 | 0.533 | 0.542 | 0.559 | 0.570 | 0.584 | 0.596 | 0.609 | 0.618 | 0.626 | 0.640 | 0.650 | 0.661 | 0.664 | 0.670 | 0.673 |
| Jharkhand | 0.554 | 0.559 | 0.569 | 0.564 | 0.562 | 0.562 | 0.560 | 0.558 | 0.557 | 0.556 | 0.557 | 0.558 | 0.561 | 0.573 | 0.576 | 0.582 | 0.588 | 0.585 | 0.581 | 0.573 | 0.573 | 0.572 | 0.568 | 0.572 | 0.580 | 0.583 |
| Karnataka | 0.440 | 0.444 | 0.452 | 0.459 | 0.466 | 0.475 | 0.484 | 0.489 | 0.498 | 0.507 | 0.513 | 0.520 | 0.528 | 0.543 | 0.551 | 0.562 | 0.573 | 0.582 | 0.591 | 0.594 | 0.605 | 0.615 | 0.620 | 0.632 | 0.648 | 0.659 |
| Kerala | 0.540 | 0.544 | 0.554 | 0.556 | 0.560 | 0.564 | 0.568 | 0.571 | 0.574 | 0.579 | 0.592 | 0.606 | 0.620 | 0.641 | 0.656 | 0.674 | 0.690 | 0.698 | 0.703 | 0.705 | 0.715 | 0.721 | 0.726 | 0.735 | 0.749 | 0.757 |
| Lakshadweep | 0.687 | 0.694 | 0.705 | 0.702 | 0.700 | 0.698 | 0.700 | 0.697 | 0.696 | 0.697 | 0.698 | 0.702 | 0.705 | 0.716 | 0.719 | 0.727 | 0.733 | 0.730 | 0.726 | 0.719 | 0.719 | 0.716 | 0.714 | 0.718 | 0.726 | 0.732 |
| Madhya Pradesh | 0.403 | 0.405 | 0.413 | 0.417 | 0.423 | 0.430 | 0.435 | 0.439 | 0.444 | 0.450 | 0.456 | 0.461 | 0.468 | 0.480 | 0.487 | 0.498 | 0.506 | 0.516 | 0.524 | 0.527 | 0.538 | 0.547 | 0.555 | 0.563 | 0.576 | 0.584 |
| Maharashtra | 0.490 | 0.494 | 0.502 | 0.507 | 0.514 | 0.521 | 0.528 | 0.534 | 0.539 | 0.547 | 0.552 | 0.559 | 0.567 | 0.579 | 0.588 | 0.599 | 0.609 | 0.619 | 0.627 | 0.632 | 0.643 | 0.652 | 0.661 | 0.666 | 0.675 | 0.680 |
| Manipur | 0.490 | 0.494 | 0.503 | 0.508 | 0.515 | 0.521 | 0.529 | 0.535 | 0.542 | 0.550 | 0.555 | 0.559 | 0.566 | 0.578 | 0.583 | 0.594 | 0.603 | 0.624 | 0.644 | 0.660 | 0.682 | 0.701 | 0.720 | 0.710 | 0.703 | 0.693 |
| Meghalaya | 0.452 | 0.456 | 0.464 | 0.463 | 0.464 | 0.464 | 0.467 | 0.465 | 0.464 | 0.465 | 0.472 | 0.481 | 0.492 | 0.508 | 0.516 | 0.530 | 0.541 | 0.562 | 0.582 | 0.597 | 0.618 | 0.638 | 0.656 | 0.651 | 0.651 | 0.648 |
| Mizoram | 0.520 | 0.525 | 0.534 | 0.536 | 0.540 | 0.543 | 0.546 | 0.548 | 0.551 | 0.556 | 0.565 | 0.574 | 0.585 | 0.602 | 0.611 | 0.627 | 0.641 | 0.652 | 0.665 | 0.672 | 0.687 | 0.699 | 0.711 | 0.705 | 0.704 | 0.699 |
| Nagaland | 0.526 | 0.533 | 0.541 | 0.535 | 0.532 | 0.528 | 0.526 | 0.521 | 0.517 | 0.514 | 0.517 | 0.523 | 0.527 | 0.540 | 0.545 | 0.553 | 0.561 | 0.589 | 0.613 | 0.635 | 0.661 | 0.685 | 0.710 | 0.697 | 0.691 | 0.678 |
| Orissa | 0.395 | 0.400 | 0.408 | 0.412 | 0.418 | 0.426 | 0.431 | 0.436 | 0.443 | 0.451 | 0.453 | 0.458 | 0.464 | 0.476 | 0.482 | 0.491 | 0.499 | 0.510 | 0.518 | 0.524 | 0.536 | 0.546 | 0.554 | 0.563 | 0.575 | 0.585 |
| Puducherry | 0.713 | 0.718 | 0.725 | 0.727 | 0.725 | 0.724 | 0.724 | 0.721 | 0.721 | 0.722 | 0.724 | 0.727 | 0.731 | 0.742 | 0.745 | 0.752 | 0.759 | 0.756 | 0.753 | 0.744 | 0.744 | 0.742 | 0.739 | 0.735 | 0.735 | 0.730 |
| Punjab | 0.492 | 0.495 | 0.505 | 0.514 | 0.523 | 0.532 | 0.542 | 0.550 | 0.559 | 0.571 | 0.574 | 0.578 | 0.584 | 0.598 | 0.602 | 0.611 | 0.619 | 0.629 | 0.640 | 0.645 | 0.657 | 0.667 | 0.676 | 0.683 | 0.694 | 0.702 |
| Rajasthan | 0.399 | 0.402 | 0.410 | 0.417 | 0.424 | 0.431 | 0.439 | 0.445 | 0.452 | 0.459 | 0.465 | 0.470 | 0.477 | 0.491 | 0.497 | 0.507 | 0.516 | 0.526 | 0.533 | 0.538 | 0.548 | 0.557 | 0.566 | 0.577 | 0.591 | 0.605 |
| Sikkim | 0.537 | 0.542 | 0.550 | 0.548 | 0.545 | 0.544 | 0.542 | 0.540 | 0.539 | 0.538 | 0.544 | 0.549 | 0.557 | 0.569 | 0.577 | 0.588 | 0.596 | 0.608 | 0.617 | 0.622 | 0.632 | 0.643 | 0.651 | 0.664 | 0.679 | 0.691 |
| Tamil Nadu | 0.466 | 0.471 | 0.480 | 0.485 | 0.492 | 0.500 | 0.508 | 0.514 | 0.521 | 0.529 | 0.538 | 0.546 | 0.554 | 0.572 | 0.581 | 0.595 | 0.607 | 0.618 | 0.628 | 0.634 | 0.646 | 0.655 | 0.666 | 0.673 | 0.682 | 0.689 |
| Telangana | 0.617 | 0.622 | 0.634 | 0.629 | 0.628 | 0.626 | 0.626 | 0.622 | 0.621 | 0.620 | 0.623 | 0.625 | 0.627 | 0.639 | 0.642 | 0.648 | 0.654 | 0.652 | 0.647 | 0.639 | 0.638 | 0.637 | 0.633 | 0.638 | 0.647 | 0.652 |
| Tripura | 0.442 | 0.446 | 0.455 | 0.463 | 0.472 | 0.483 | 0.495 | 0.502 | 0.511 | 0.524 | 0.525 | 0.530 | 0.533 | 0.545 | 0.549 | 0.558 | 0.564 | 0.577 | 0.589 | 0.595 | 0.610 | 0.621 | 0.632 | 0.634 | 0.640 | 0.642 |
| Uttar Pradesh | 0.394 | 0.398 | 0.403 | 0.410 | 0.417 | 0.426 | 0.434 | 0.439 | 0.446 | 0.453 | 0.458 | 0.464 | 0.471 | 0.484 | 0.491 | 0.501 | 0.511 | 0.518 | 0.524 | 0.526 | 0.535 | 0.544 | 0.548 | 0.557 | 0.569 | 0.576 |
| Uttarakhand | 0.621 | 0.626 | 0.637 | 0.633 | 0.631 | 0.630 | 0.628 | 0.624 | 0.623 | 0.623 | 0.623 | 0.626 | 0.628 | 0.641 | 0.644 | 0.652 | 0.657 | 0.654 | 0.649 | 0.641 | 0.640 | 0.638 | 0.635 | 0.644 | 0.655 | 0.664 |
| West Bengal | 0.437 | 0.441 | 0.448 | 0.455 | 0.462 | 0.469 | 0.475 | 0.482 | 0.488 | 0.496 | 0.501 | 0.506 | 0.508 | 0.521 | 0.527 | 0.535 | 0.544 | 0.551 | 0.559 | 0.562 | 0.573 | 0.580 | 0.588 | 0.596 | 0.610 | 0.620 |
| EDI | ||||||||||||||||||||||||||
| India | 0.311 | 0.317 | 0.326 | 0.332 | 0.338 | 0.344 | 0.351 | 0.358 | 0.364 | 0.371 | 0.377 | 0.383 | 0.392 | 0.412 | 0.418 | 0.429 | 0.438 | 0.450 | 0.465 | 0.466 | 0.480 | 0.494 | 0.506 | 0.516 | 0.534 | 0.543 |
| Andaman & Nicobar Islands | 0.619 | 0.632 | 0.649 | 0.633 | 0.619 | 0.606 | 0.596 | 0.586 | 0.575 | 0.568 | 0.578 | 0.581 | 0.587 | 0.612 | 0.612 | 0.626 | 0.629 | 0.618 | 0.613 | 0.591 | 0.586 | 0.582 | 0.574 | 0.589 | 0.615 | 0.629 |
| Andhra Pradesh | 0.286 | 0.289 | 0.298 | 0.301 | 0.307 | 0.307 | 0.314 | 0.317 | 0.317 | 0.324 | 0.330 | 0.339 | 0.351 | 0.373 | 0.382 | 0.396 | 0.408 | 0.422 | 0.437 | 0.437 | 0.452 | 0.468 | 0.481 | 0.490 | 0.511 | 0.521 |
| Arunachal Pradesh | 0.298 | 0.304 | 0.310 | 0.322 | 0.331 | 0.343 | 0.353 | 0.359 | 0.372 | 0.381 | 0.382 | 0.383 | 0.389 | 0.403 | 0.403 | 0.412 | 0.416 | 0.457 | 0.502 | 0.530 | 0.575 | 0.619 | 0.656 | 0.628 | 0.610 | 0.577 |
| Assam | 0.317 | 0.323 | 0.335 | 0.338 | 0.344 | 0.350 | 0.357 | 0.363 | 0.369 | 0.373 | 0.386 | 0.395 | 0.410 | 0.436 | 0.448 | 0.462 | 0.477 | 0.481 | 0.491 | 0.487 | 0.496 | 0.502 | 0.509 | 0.514 | 0.528 | 0.533 |
| Bihar | 0.248 | 0.254 | 0.260 | 0.266 | 0.274 | 0.277 | 0.283 | 0.290 | 0.293 | 0.299 | 0.306 | 0.308 | 0.317 | 0.331 | 0.334 | 0.346 | 0.351 | 0.365 | 0.385 | 0.394 | 0.411 | 0.424 | 0.438 | 0.448 | 0.463 | 0.469 |
| Chandigarh | 0.561 | 0.570 | 0.588 | 0.571 | 0.558 | 0.544 | 0.531 | 0.521 | 0.513 | 0.502 | 0.506 | 0.512 | 0.518 | 0.541 | 0.543 | 0.551 | 0.560 | 0.546 | 0.538 | 0.519 | 0.513 | 0.507 | 0.502 | 0.553 | 0.616 | 0.666 |
| Chhattisgarh | 0.539 | 0.548 | 0.563 | 0.549 | 0.533 | 0.516 | 0.506 | 0.493 | 0.482 | 0.474 | 0.475 | 0.478 | 0.487 | 0.506 | 0.512 | 0.523 | 0.526 | 0.514 | 0.507 | 0.484 | 0.479 | 0.479 | 0.471 | 0.483 | 0.504 | 0.514 |
| Dadra and Nagar Haveli | 0.691 | 0.703 | 0.724 | 0.705 | 0.692 | 0.675 | 0.663 | 0.653 | 0.639 | 0.635 | 0.639 | 0.642 | 0.654 | 0.676 | 0.678 | 0.693 | 0.702 | 0.688 | 0.681 | 0.656 | 0.650 | 0.641 | 0.636 | 0.617 | 0.611 | 0.589 |
| Daman and Diu | 0.575 | 0.587 | 0.602 | 0.592 | 0.575 | 0.567 | 0.557 | 0.550 | 0.542 | 0.538 | 0.542 | 0.545 | 0.551 | 0.573 | 0.573 | 0.584 | 0.590 | 0.579 | 0.574 | 0.555 | 0.552 | 0.546 | 0.541 | 0.556 | 0.576 | 0.593 |
| Delhi | 0.466 | 0.475 | 0.490 | 0.497 | 0.506 | 0.509 | 0.520 | 0.533 | 0.537 | 0.550 | 0.557 | 0.564 | 0.570 | 0.593 | 0.596 | 0.608 | 0.614 | 0.618 | 0.629 | 0.623 | 0.630 | 0.637 | 0.642 | 0.646 | 0.666 | 0.667 |
| Goa | 0.442 | 0.451 | 0.463 | 0.469 | 0.470 | 0.473 | 0.478 | 0.485 | 0.488 | 0.496 | 0.503 | 0.512 | 0.524 | 0.551 | 0.556 | 0.574 | 0.583 | 0.607 | 0.629 | 0.639 | 0.666 | 0.689 | 0.711 | 0.702 | 0.702 | 0.690 |
| Gujarat | 0.346 | 0.352 | 0.361 | 0.365 | 0.366 | 0.366 | 0.371 | 0.374 | 0.378 | 0.382 | 0.392 | 0.398 | 0.409 | 0.429 | 0.434 | 0.449 | 0.458 | 0.464 | 0.473 | 0.471 | 0.480 | 0.488 | 0.498 | 0.510 | 0.528 | 0.541 |
| Haryana | 0.353 | 0.362 | 0.371 | 0.374 | 0.381 | 0.387 | 0.394 | 0.398 | 0.407 | 0.414 | 0.418 | 0.421 | 0.430 | 0.450 | 0.453 | 0.464 | 0.471 | 0.482 | 0.501 | 0.501 | 0.522 | 0.536 | 0.551 | 0.564 | 0.583 | 0.596 |
| Himachal Pradesh | 0.383 | 0.389 | 0.401 | 0.411 | 0.420 | 0.429 | 0.439 | 0.449 | 0.459 | 0.466 | 0.479 | 0.489 | 0.504 | 0.533 | 0.542 | 0.559 | 0.572 | 0.578 | 0.581 | 0.573 | 0.582 | 0.587 | 0.593 | 0.603 | 0.628 | 0.636 |
| Jammu and Kashmir | 0.381 | 0.389 | 0.398 | 0.396 | 0.393 | 0.390 | 0.388 | 0.382 | 0.379 | 0.380 | 0.387 | 0.399 | 0.411 | 0.437 | 0.449 | 0.467 | 0.479 | 0.497 | 0.514 | 0.521 | 0.542 | 0.558 | 0.577 | 0.577 | 0.584 | 0.584 |
| Jharkhand | 0.542 | 0.554 | 0.569 | 0.549 | 0.533 | 0.522 | 0.506 | 0.499 | 0.488 | 0.477 | 0.478 | 0.481 | 0.487 | 0.512 | 0.514 | 0.523 | 0.532 | 0.518 | 0.510 | 0.488 | 0.485 | 0.479 | 0.471 | 0.480 | 0.495 | 0.501 |
| Karnataka | 0.320 | 0.326 | 0.335 | 0.341 | 0.347 | 0.354 | 0.361 | 0.364 | 0.374 | 0.381 | 0.390 | 0.396 | 0.408 | 0.431 | 0.439 | 0.453 | 0.465 | 0.468 | 0.480 | 0.472 | 0.483 | 0.491 | 0.494 | 0.513 | 0.543 | 0.562 |
| Kerala | 0.454 | 0.463 | 0.478 | 0.479 | 0.486 | 0.489 | 0.493 | 0.501 | 0.507 | 0.514 | 0.524 | 0.537 | 0.548 | 0.577 | 0.586 | 0.603 | 0.615 | 0.624 | 0.637 | 0.633 | 0.648 | 0.659 | 0.669 | 0.682 | 0.703 | 0.710 |
| Lakshadweep | 0.647 | 0.662 | 0.679 | 0.663 | 0.650 | 0.633 | 0.627 | 0.617 | 0.606 | 0.599 | 0.603 | 0.609 | 0.618 | 0.640 | 0.642 | 0.654 | 0.663 | 0.649 | 0.644 | 0.622 | 0.617 | 0.610 | 0.606 | 0.620 | 0.646 | 0.663 |
| Madhya Pradesh | 0.281 | 0.283 | 0.292 | 0.298 | 0.304 | 0.311 | 0.317 | 0.321 | 0.327 | 0.333 | 0.343 | 0.346 | 0.357 | 0.377 | 0.383 | 0.397 | 0.403 | 0.414 | 0.427 | 0.424 | 0.436 | 0.447 | 0.459 | 0.468 | 0.487 | 0.493 |
| Maharashtra | 0.373 | 0.379 | 0.388 | 0.394 | 0.401 | 0.407 | 0.411 | 0.421 | 0.424 | 0.431 | 0.438 | 0.447 | 0.459 | 0.479 | 0.488 | 0.503 | 0.512 | 0.524 | 0.539 | 0.540 | 0.554 | 0.568 | 0.584 | 0.587 | 0.603 | 0.606 |
| Manipur | 0.427 | 0.433 | 0.448 | 0.449 | 0.456 | 0.459 | 0.466 | 0.473 | 0.480 | 0.487 | 0.492 | 0.495 | 0.504 | 0.524 | 0.524 | 0.537 | 0.543 | 0.568 | 0.600 | 0.614 | 0.643 | 0.670 | 0.696 | 0.688 | 0.686 | 0.675 |
| Meghalaya | 0.336 | 0.342 | 0.351 | 0.354 | 0.360 | 0.363 | 0.372 | 0.376 | 0.378 | 0.385 | 0.383 | 0.387 | 0.394 | 0.409 | 0.406 | 0.416 | 0.419 | 0.444 | 0.474 | 0.488 | 0.515 | 0.544 | 0.569 | 0.565 | 0.573 | 0.571 |
| Mizoram | 0.431 | 0.440 | 0.452 | 0.452 | 0.456 | 0.456 | 0.457 | 0.461 | 0.464 | 0.468 | 0.475 | 0.482 | 0.491 | 0.514 | 0.517 | 0.533 | 0.545 | 0.554 | 0.573 | 0.574 | 0.593 | 0.607 | 0.623 | 0.622 | 0.634 | 0.633 |
| Nagaland | 0.402 | 0.414 | 0.423 | 0.420 | 0.420 | 0.417 | 0.418 | 0.419 | 0.419 | 0.417 | 0.418 | 0.422 | 0.425 | 0.443 | 0.443 | 0.449 | 0.453 | 0.487 | 0.522 | 0.546 | 0.580 | 0.613 | 0.649 | 0.631 | 0.629 | 0.611 |
| Orissa | 0.294 | 0.303 | 0.312 | 0.315 | 0.321 | 0.327 | 0.331 | 0.338 | 0.344 | 0.351 | 0.351 | 0.354 | 0.361 | 0.378 | 0.381 | 0.389 | 0.396 | 0.407 | 0.419 | 0.420 | 0.434 | 0.446 | 0.458 | 0.470 | 0.488 | 0.503 |
| Puducherry | 0.737 | 0.747 | 0.753 | 0.754 | 0.734 | 0.721 | 0.709 | 0.696 | 0.686 | 0.676 | 0.683 | 0.689 | 0.701 | 0.726 | 0.728 | 0.739 | 0.751 | 0.734 | 0.730 | 0.702 | 0.697 | 0.691 | 0.683 | 0.679 | 0.685 | 0.676 |
| Punjab | 0.353 | 0.359 | 0.371 | 0.381 | 0.390 | 0.399 | 0.409 | 0.419 | 0.429 | 0.442 | 0.443 | 0.446 | 0.452 | 0.473 | 0.472 | 0.478 | 0.484 | 0.499 | 0.521 | 0.524 | 0.542 | 0.559 | 0.574 | 0.584 | 0.599 | 0.609 |
| Rajasthan | 0.253 | 0.256 | 0.265 | 0.274 | 0.283 | 0.289 | 0.298 | 0.308 | 0.317 | 0.323 | 0.330 | 0.333 | 0.342 | 0.362 | 0.367 | 0.376 | 0.384 | 0.393 | 0.402 | 0.403 | 0.411 | 0.422 | 0.434 | 0.447 | 0.468 | 0.486 |
| Sikkim | 0.460 | 0.469 | 0.481 | 0.470 | 0.456 | 0.445 | 0.432 | 0.424 | 0.416 | 0.408 | 0.413 | 0.413 | 0.423 | 0.437 | 0.443 | 0.453 | 0.456 | 0.477 | 0.501 | 0.507 | 0.527 | 0.550 | 0.571 | 0.581 | 0.599 | 0.605 |
| Tamil Nadu | 0.372 | 0.381 | 0.393 | 0.393 | 0.397 | 0.400 | 0.404 | 0.408 | 0.411 | 0.415 | 0.427 | 0.439 | 0.451 | 0.479 | 0.488 | 0.508 | 0.523 | 0.529 | 0.541 | 0.539 | 0.548 | 0.556 | 0.569 | 0.582 | 0.601 | 0.613 |
| Telangana | 0.552 | 0.561 | 0.579 | 0.562 | 0.549 | 0.535 | 0.525 | 0.512 | 0.504 | 0.493 | 0.500 | 0.503 | 0.509 | 0.532 | 0.534 | 0.542 | 0.551 | 0.540 | 0.532 | 0.510 | 0.504 | 0.501 | 0.493 | 0.508 | 0.531 | 0.545 |
| Tripura | 0.364 | 0.373 | 0.385 | 0.391 | 0.397 | 0.406 | 0.416 | 0.423 | 0.429 | 0.442 | 0.442 | 0.448 | 0.451 | 0.474 | 0.473 | 0.485 | 0.491 | 0.506 | 0.528 | 0.529 | 0.550 | 0.567 | 0.586 | 0.583 | 0.592 | 0.589 |
| Uttar Pradesh | 0.282 | 0.288 | 0.293 | 0.302 | 0.308 | 0.317 | 0.327 | 0.333 | 0.339 | 0.346 | 0.352 | 0.358 | 0.367 | 0.387 | 0.393 | 0.404 | 0.413 | 0.422 | 0.437 | 0.434 | 0.448 | 0.462 | 0.468 | 0.481 | 0.497 | 0.503 |
| Uttarakhand | 0.624 | 0.636 | 0.653 | 0.634 | 0.618 | 0.604 | 0.586 | 0.573 | 0.562 | 0.552 | 0.552 | 0.558 | 0.564 | 0.592 | 0.594 | 0.609 | 0.614 | 0.601 | 0.590 | 0.565 | 0.559 | 0.553 | 0.546 | 0.562 | 0.582 | 0.596 |
| West Bengal | 0.328 | 0.334 | 0.343 | 0.349 | 0.352 | 0.355 | 0.358 | 0.365 | 0.368 | 0.374 | 0.381 | 0.387 | 0.390 | 0.410 | 0.416 | 0.427 | 0.436 | 0.442 | 0.457 | 0.454 | 0.468 | 0.479 | 0.491 | 0.500 | 0.521 | 0.533 |
| WBI | ||||||||||||||||||||||||||
| India | 0.583 | 0.591 | 0.598 | 0.606 | 0.614 | 0.622 | 0.629 | 0.635 | 0.643 | 0.649 | 0.655 | 0.662 | 0.668 | 0.674 | 0.680 | 0.686 | 0.692 | 0.698 | 0.705 | 0.711 | 0.717 | 0.723 | 0.729 | 0.734 | 0.738 | 0.743 |
| Andaman & Nicobar Islands | 0.829 | 0.838 | 0.849 | 0.851 | 0.854 | 0.855 | 0.858 | 0.858 | 0.862 | 0.862 | 0.862 | 0.862 | 0.863 | 0.863 | 0.863 | 0.863 | 0.865 | 0.862 | 0.858 | 0.857 | 0.854 | 0.851 | 0.849 | 0.845 | 0.842 | 0.837 |
| Andhra Pradesh | 0.617 | 0.626 | 0.634 | 0.638 | 0.643 | 0.649 | 0.654 | 0.657 | 0.663 | 0.666 | 0.671 | 0.677 | 0.682 | 0.688 | 0.694 | 0.698 | 0.705 | 0.709 | 0.715 | 0.722 | 0.726 | 0.732 | 0.738 | 0.742 | 0.746 | 0.749 |
| Arunachal Pradesh | 0.634 | 0.643 | 0.651 | 0.654 | 0.658 | 0.663 | 0.666 | 0.669 | 0.672 | 0.675 | 0.675 | 0.674 | 0.674 | 0.672 | 0.672 | 0.672 | 0.671 | 0.683 | 0.695 | 0.708 | 0.720 | 0.731 | 0.743 | 0.754 | 0.765 | 0.774 |
| Assam | 0.551 | 0.558 | 0.566 | 0.583 | 0.600 | 0.618 | 0.637 | 0.652 | 0.671 | 0.686 | 0.685 | 0.683 | 0.682 | 0.680 | 0.678 | 0.677 | 0.675 | 0.682 | 0.689 | 0.695 | 0.702 | 0.708 | 0.715 | 0.720 | 0.725 | 0.731 |
| Bihar | 0.560 | 0.566 | 0.574 | 0.583 | 0.592 | 0.602 | 0.611 | 0.618 | 0.628 | 0.635 | 0.640 | 0.645 | 0.649 | 0.655 | 0.660 | 0.665 | 0.669 | 0.675 | 0.683 | 0.691 | 0.697 | 0.705 | 0.712 | 0.717 | 0.723 | 0.729 |
| Chandigarh | 0.792 | 0.802 | 0.812 | 0.814 | 0.817 | 0.818 | 0.822 | 0.822 | 0.823 | 0.823 | 0.825 | 0.825 | 0.825 | 0.825 | 0.826 | 0.826 | 0.826 | 0.823 | 0.822 | 0.818 | 0.817 | 0.814 | 0.812 | 0.808 | 0.805 | 0.800 |
| Chhattisgarh | 0.709 | 0.718 | 0.726 | 0.729 | 0.731 | 0.732 | 0.735 | 0.735 | 0.737 | 0.738 | 0.738 | 0.738 | 0.738 | 0.738 | 0.740 | 0.740 | 0.740 | 0.738 | 0.735 | 0.734 | 0.731 | 0.729 | 0.726 | 0.723 | 0.720 | 0.717 |
| Dadra and Nagar Haveli | 0.778 | 0.789 | 0.798 | 0.800 | 0.803 | 0.805 | 0.808 | 0.808 | 0.809 | 0.811 | 0.811 | 0.811 | 0.811 | 0.811 | 0.812 | 0.812 | 0.812 | 0.811 | 0.808 | 0.805 | 0.803 | 0.800 | 0.798 | 0.794 | 0.791 | 0.788 |
| Daman and Diu | 0.786 | 0.795 | 0.805 | 0.806 | 0.809 | 0.811 | 0.814 | 0.814 | 0.815 | 0.817 | 0.817 | 0.817 | 0.817 | 0.818 | 0.818 | 0.818 | 0.818 | 0.817 | 0.814 | 0.812 | 0.809 | 0.808 | 0.805 | 0.802 | 0.797 | 0.794 |
| Delhi | 0.648 | 0.655 | 0.665 | 0.674 | 0.683 | 0.692 | 0.703 | 0.711 | 0.720 | 0.728 | 0.734 | 0.740 | 0.745 | 0.751 | 0.757 | 0.762 | 0.768 | 0.771 | 0.774 | 0.777 | 0.780 | 0.783 | 0.786 | 0.788 | 0.789 | 0.791 |
| Goa | 0.720 | 0.729 | 0.738 | 0.740 | 0.740 | 0.742 | 0.743 | 0.743 | 0.745 | 0.743 | 0.751 | 0.760 | 0.768 | 0.775 | 0.783 | 0.791 | 0.798 | 0.802 | 0.805 | 0.808 | 0.811 | 0.814 | 0.817 | 0.818 | 0.820 | 0.822 |
| Gujarat | 0.605 | 0.614 | 0.622 | 0.628 | 0.635 | 0.642 | 0.649 | 0.654 | 0.662 | 0.666 | 0.672 | 0.678 | 0.685 | 0.689 | 0.695 | 0.702 | 0.708 | 0.714 | 0.720 | 0.726 | 0.732 | 0.738 | 0.746 | 0.751 | 0.755 | 0.760 |
| Haryana | 0.600 | 0.608 | 0.615 | 0.626 | 0.637 | 0.648 | 0.658 | 0.668 | 0.678 | 0.688 | 0.695 | 0.703 | 0.711 | 0.718 | 0.726 | 0.734 | 0.742 | 0.746 | 0.749 | 0.754 | 0.757 | 0.762 | 0.765 | 0.768 | 0.769 | 0.772 |
| Himachal Pradesh | 0.637 | 0.645 | 0.654 | 0.668 | 0.682 | 0.695 | 0.709 | 0.722 | 0.735 | 0.748 | 0.751 | 0.755 | 0.760 | 0.763 | 0.768 | 0.772 | 0.775 | 0.775 | 0.777 | 0.777 | 0.777 | 0.778 | 0.778 | 0.778 | 0.777 | 0.775 |
| Jammu and Kashmir | 0.666 | 0.674 | 0.683 | 0.685 | 0.686 | 0.686 | 0.688 | 0.688 | 0.689 | 0.689 | 0.698 | 0.708 | 0.715 | 0.725 | 0.734 | 0.743 | 0.752 | 0.755 | 0.758 | 0.763 | 0.766 | 0.769 | 0.772 | 0.775 | 0.777 | 0.778 |
| Jharkhand | 0.734 | 0.742 | 0.751 | 0.754 | 0.755 | 0.758 | 0.760 | 0.760 | 0.763 | 0.763 | 0.763 | 0.763 | 0.763 | 0.765 | 0.765 | 0.765 | 0.765 | 0.763 | 0.760 | 0.758 | 0.755 | 0.754 | 0.752 | 0.748 | 0.745 | 0.740 |
| Karnataka | 0.608 | 0.615 | 0.623 | 0.632 | 0.640 | 0.649 | 0.657 | 0.665 | 0.672 | 0.680 | 0.686 | 0.694 | 0.700 | 0.708 | 0.714 | 0.720 | 0.728 | 0.735 | 0.742 | 0.749 | 0.757 | 0.765 | 0.771 | 0.777 | 0.783 | 0.788 |
| Kerala | 0.722 | 0.729 | 0.738 | 0.748 | 0.757 | 0.765 | 0.774 | 0.782 | 0.789 | 0.797 | 0.802 | 0.806 | 0.811 | 0.814 | 0.818 | 0.823 | 0.828 | 0.831 | 0.832 | 0.835 | 0.838 | 0.840 | 0.843 | 0.843 | 0.845 | 0.846 |
| Lakshadweep | 0.797 | 0.806 | 0.815 | 0.818 | 0.820 | 0.823 | 0.825 | 0.826 | 0.828 | 0.828 | 0.828 | 0.829 | 0.829 | 0.829 | 0.829 | 0.831 | 0.831 | 0.828 | 0.826 | 0.823 | 0.822 | 0.818 | 0.817 | 0.812 | 0.808 | 0.805 |
| Madhya Pradesh | 0.551 | 0.558 | 0.566 | 0.569 | 0.574 | 0.577 | 0.580 | 0.582 | 0.586 | 0.588 | 0.597 | 0.608 | 0.617 | 0.626 | 0.635 | 0.646 | 0.655 | 0.662 | 0.669 | 0.675 | 0.683 | 0.689 | 0.695 | 0.702 | 0.706 | 0.712 |
| Maharashtra | 0.652 | 0.660 | 0.668 | 0.674 | 0.680 | 0.685 | 0.691 | 0.695 | 0.700 | 0.705 | 0.711 | 0.718 | 0.725 | 0.732 | 0.740 | 0.746 | 0.754 | 0.758 | 0.763 | 0.768 | 0.772 | 0.777 | 0.782 | 0.786 | 0.789 | 0.792 |
| Manipur | 0.682 | 0.689 | 0.698 | 0.702 | 0.706 | 0.709 | 0.714 | 0.715 | 0.720 | 0.722 | 0.728 | 0.732 | 0.738 | 0.743 | 0.749 | 0.754 | 0.760 | 0.765 | 0.769 | 0.774 | 0.778 | 0.783 | 0.788 | 0.789 | 0.792 | 0.795 |
| Meghalaya | 0.672 | 0.680 | 0.689 | 0.678 | 0.668 | 0.657 | 0.646 | 0.634 | 0.622 | 0.609 | 0.625 | 0.638 | 0.654 | 0.669 | 0.683 | 0.698 | 0.712 | 0.718 | 0.726 | 0.732 | 0.738 | 0.745 | 0.752 | 0.757 | 0.762 | 0.766 |
| Mizoram | 0.751 | 0.760 | 0.769 | 0.763 | 0.757 | 0.752 | 0.746 | 0.738 | 0.732 | 0.725 | 0.731 | 0.735 | 0.742 | 0.746 | 0.752 | 0.758 | 0.763 | 0.762 | 0.762 | 0.760 | 0.758 | 0.757 | 0.757 | 0.754 | 0.751 | 0.749 |
| Nagaland | 0.778 | 0.788 | 0.798 | 0.786 | 0.774 | 0.762 | 0.749 | 0.735 | 0.723 | 0.708 | 0.711 | 0.712 | 0.714 | 0.715 | 0.717 | 0.718 | 0.720 | 0.728 | 0.734 | 0.742 | 0.748 | 0.755 | 0.763 | 0.768 | 0.774 | 0.778 |
| Orissa | 0.558 | 0.566 | 0.574 | 0.582 | 0.589 | 0.598 | 0.606 | 0.612 | 0.620 | 0.628 | 0.634 | 0.642 | 0.648 | 0.655 | 0.662 | 0.669 | 0.675 | 0.683 | 0.689 | 0.697 | 0.703 | 0.711 | 0.717 | 0.723 | 0.728 | 0.734 |
| Puducherry | 0.805 | 0.815 | 0.825 | 0.826 | 0.829 | 0.831 | 0.834 | 0.834 | 0.837 | 0.837 | 0.837 | 0.837 | 0.838 | 0.838 | 0.838 | 0.838 | 0.838 | 0.837 | 0.834 | 0.832 | 0.829 | 0.828 | 0.825 | 0.820 | 0.817 | 0.812 |
| Punjab | 0.665 | 0.672 | 0.682 | 0.685 | 0.689 | 0.692 | 0.697 | 0.698 | 0.702 | 0.705 | 0.711 | 0.717 | 0.725 | 0.731 | 0.737 | 0.745 | 0.751 | 0.754 | 0.758 | 0.762 | 0.766 | 0.769 | 0.774 | 0.775 | 0.778 | 0.780 |
| Rajasthan | 0.600 | 0.608 | 0.615 | 0.615 | 0.615 | 0.615 | 0.617 | 0.615 | 0.615 | 0.614 | 0.623 | 0.632 | 0.642 | 0.651 | 0.660 | 0.669 | 0.678 | 0.686 | 0.694 | 0.700 | 0.708 | 0.715 | 0.723 | 0.729 | 0.734 | 0.740 |
| Sikkim | 0.652 | 0.660 | 0.668 | 0.671 | 0.672 | 0.674 | 0.677 | 0.677 | 0.678 | 0.678 | 0.692 | 0.708 | 0.722 | 0.735 | 0.749 | 0.763 | 0.777 | 0.780 | 0.783 | 0.786 | 0.789 | 0.792 | 0.795 | 0.797 | 0.798 | 0.800 |
| Tamil Nadu | 0.618 | 0.628 | 0.635 | 0.646 | 0.658 | 0.671 | 0.683 | 0.692 | 0.705 | 0.715 | 0.723 | 0.731 | 0.738 | 0.748 | 0.755 | 0.763 | 0.771 | 0.775 | 0.780 | 0.783 | 0.788 | 0.792 | 0.795 | 0.798 | 0.802 | 0.803 |
| Telangana | 0.763 | 0.772 | 0.782 | 0.783 | 0.786 | 0.788 | 0.791 | 0.791 | 0.792 | 0.794 | 0.794 | 0.794 | 0.794 | 0.794 | 0.795 | 0.795 | 0.795 | 0.794 | 0.791 | 0.788 | 0.786 | 0.783 | 0.782 | 0.778 | 0.774 | 0.771 |
| Tripura | 0.588 | 0.595 | 0.603 | 0.618 | 0.634 | 0.649 | 0.665 | 0.678 | 0.694 | 0.708 | 0.708 | 0.709 | 0.711 | 0.711 | 0.712 | 0.712 | 0.714 | 0.722 | 0.731 | 0.738 | 0.748 | 0.755 | 0.763 | 0.771 | 0.777 | 0.783 |
| Uttar Pradesh | 0.531 | 0.538 | 0.545 | 0.554 | 0.563 | 0.572 | 0.580 | 0.588 | 0.597 | 0.603 | 0.611 | 0.617 | 0.623 | 0.631 | 0.637 | 0.643 | 0.651 | 0.655 | 0.660 | 0.665 | 0.669 | 0.675 | 0.680 | 0.683 | 0.686 | 0.689 |
| Uttarakhand | 0.749 | 0.758 | 0.768 | 0.771 | 0.772 | 0.774 | 0.777 | 0.777 | 0.780 | 0.780 | 0.780 | 0.780 | 0.780 | 0.782 | 0.782 | 0.782 | 0.782 | 0.780 | 0.777 | 0.775 | 0.772 | 0.771 | 0.768 | 0.765 | 0.762 | 0.757 |
| West Bengal | 0.600 | 0.608 | 0.615 | 0.628 | 0.642 | 0.654 | 0.666 | 0.678 | 0.691 | 0.702 | 0.706 | 0.709 | 0.714 | 0.717 | 0.722 | 0.725 | 0.729 | 0.735 | 0.740 | 0.746 | 0.752 | 0.757 | 0.763 | 0.768 | 0.771 | 0.775 |
| SLI | ||||||||||||||||||||||||||
| India | 0.431 | 0.429 | 0.434 | 0.438 | 0.445 | 0.454 | 0.462 | 0.465 | 0.472 | 0.482 | 0.484 | 0.489 | 0.493 | 0.501 | 0.510 | 0.521 | 0.532 | 0.545 | 0.548 | 0.558 | 0.570 | 0.578 | 0.584 | 0.591 | 0.600 | 0.610 |
| Andaman & Nicobar Islands | 0.606 | 0.603 | 0.609 | 0.614 | 0.621 | 0.630 | 0.639 | 0.642 | 0.648 | 0.659 | 0.658 | 0.660 | 0.660 | 0.666 | 0.673 | 0.682 | 0.691 | 0.698 | 0.696 | 0.701 | 0.708 | 0.710 | 0.710 | 0.709 | 0.709 | 0.710 |
| Andhra Pradesh | 0.420 | 0.418 | 0.423 | 0.427 | 0.435 | 0.443 | 0.452 | 0.455 | 0.462 | 0.472 | 0.477 | 0.485 | 0.491 | 0.502 | 0.514 | 0.527 | 0.541 | 0.557 | 0.563 | 0.576 | 0.591 | 0.602 | 0.611 | 0.618 | 0.627 | 0.637 |
| Arunachal Pradesh | 0.430 | 0.428 | 0.433 | 0.436 | 0.442 | 0.449 | 0.456 | 0.458 | 0.463 | 0.472 | 0.481 | 0.491 | 0.500 | 0.515 | 0.530 | 0.547 | 0.564 | 0.583 | 0.593 | 0.609 | 0.628 | 0.643 | 0.655 | 0.649 | 0.645 | 0.642 |
| Assam | 0.383 | 0.381 | 0.386 | 0.389 | 0.394 | 0.401 | 0.408 | 0.410 | 0.415 | 0.423 | 0.427 | 0.433 | 0.438 | 0.448 | 0.458 | 0.470 | 0.482 | 0.496 | 0.501 | 0.513 | 0.527 | 0.537 | 0.544 | 0.545 | 0.547 | 0.550 |
| Bihar | 0.380 | 0.378 | 0.383 | 0.385 | 0.389 | 0.394 | 0.400 | 0.400 | 0.403 | 0.411 | 0.412 | 0.416 | 0.419 | 0.427 | 0.435 | 0.445 | 0.454 | 0.463 | 0.463 | 0.469 | 0.477 | 0.481 | 0.483 | 0.489 | 0.496 | 0.504 |
| Chandigarh | 0.556 | 0.554 | 0.560 | 0.564 | 0.571 | 0.579 | 0.588 | 0.591 | 0.597 | 0.608 | 0.607 | 0.609 | 0.609 | 0.615 | 0.621 | 0.630 | 0.638 | 0.645 | 0.643 | 0.648 | 0.654 | 0.657 | 0.657 | 0.683 | 0.711 | 0.740 |
| Chhattisgarh | 0.447 | 0.445 | 0.450 | 0.453 | 0.460 | 0.468 | 0.475 | 0.478 | 0.484 | 0.493 | 0.493 | 0.494 | 0.494 | 0.500 | 0.506 | 0.513 | 0.521 | 0.528 | 0.525 | 0.530 | 0.536 | 0.538 | 0.538 | 0.547 | 0.557 | 0.568 |
| Dadra and Nagar Haveli | 0.550 | 0.548 | 0.553 | 0.557 | 0.564 | 0.573 | 0.581 | 0.584 | 0.590 | 0.601 | 0.600 | 0.602 | 0.602 | 0.608 | 0.614 | 0.623 | 0.631 | 0.638 | 0.636 | 0.641 | 0.647 | 0.650 | 0.650 | 0.642 | 0.635 | 0.630 |
| Daman and Diu | 0.596 | 0.594 | 0.600 | 0.604 | 0.611 | 0.620 | 0.629 | 0.632 | 0.638 | 0.649 | 0.649 | 0.650 | 0.650 | 0.657 | 0.663 | 0.672 | 0.681 | 0.688 | 0.686 | 0.691 | 0.698 | 0.700 | 0.700 | 0.699 | 0.699 | 0.700 |
| Delhi | 0.621 | 0.619 | 0.625 | 0.633 | 0.645 | 0.659 | 0.673 | 0.680 | 0.691 | 0.707 | 0.702 | 0.699 | 0.694 | 0.696 | 0.698 | 0.702 | 0.706 | 0.713 | 0.709 | 0.714 | 0.720 | 0.722 | 0.722 | 0.725 | 0.730 | 0.736 |
| Goa | 0.512 | 0.510 | 0.516 | 0.523 | 0.534 | 0.546 | 0.558 | 0.564 | 0.574 | 0.588 | 0.596 | 0.605 | 0.614 | 0.628 | 0.642 | 0.659 | 0.676 | 0.695 | 0.704 | 0.720 | 0.739 | 0.753 | 0.765 | 0.759 | 0.756 | 0.754 |
| Gujarat | 0.484 | 0.483 | 0.488 | 0.493 | 0.500 | 0.510 | 0.519 | 0.523 | 0.530 | 0.541 | 0.545 | 0.551 | 0.555 | 0.566 | 0.576 | 0.589 | 0.602 | 0.612 | 0.613 | 0.622 | 0.632 | 0.638 | 0.641 | 0.650 | 0.660 | 0.672 |
| Haryana | 0.466 | 0.465 | 0.470 | 0.479 | 0.491 | 0.504 | 0.517 | 0.526 | 0.537 | 0.553 | 0.555 | 0.561 | 0.564 | 0.574 | 0.583 | 0.595 | 0.607 | 0.620 | 0.623 | 0.633 | 0.645 | 0.653 | 0.659 | 0.672 | 0.687 | 0.703 |
| Himachal Pradesh | 0.440 | 0.438 | 0.443 | 0.455 | 0.470 | 0.486 | 0.502 | 0.513 | 0.527 | 0.546 | 0.552 | 0.560 | 0.567 | 0.580 | 0.593 | 0.608 | 0.623 | 0.635 | 0.636 | 0.645 | 0.655 | 0.662 | 0.666 | 0.677 | 0.691 | 0.705 |
| Jammu and Kashmir | 0.460 | 0.458 | 0.463 | 0.470 | 0.479 | 0.489 | 0.500 | 0.506 | 0.514 | 0.527 | 0.531 | 0.537 | 0.542 | 0.552 | 0.563 | 0.575 | 0.588 | 0.602 | 0.606 | 0.618 | 0.632 | 0.641 | 0.648 | 0.654 | 0.662 | 0.671 |
| Jharkhand | 0.427 | 0.425 | 0.430 | 0.434 | 0.440 | 0.448 | 0.456 | 0.458 | 0.464 | 0.473 | 0.473 | 0.474 | 0.474 | 0.480 | 0.485 | 0.493 | 0.500 | 0.507 | 0.505 | 0.509 | 0.515 | 0.517 | 0.517 | 0.522 | 0.528 | 0.534 |
| Karnataka | 0.439 | 0.437 | 0.442 | 0.448 | 0.457 | 0.467 | 0.477 | 0.482 | 0.490 | 0.503 | 0.506 | 0.511 | 0.515 | 0.524 | 0.534 | 0.545 | 0.557 | 0.573 | 0.579 | 0.592 | 0.607 | 0.618 | 0.627 | 0.632 | 0.639 | 0.647 |
| Kerala | 0.480 | 0.478 | 0.483 | 0.479 | 0.478 | 0.479 | 0.479 | 0.474 | 0.472 | 0.474 | 0.493 | 0.515 | 0.535 | 0.561 | 0.588 | 0.616 | 0.645 | 0.655 | 0.655 | 0.662 | 0.672 | 0.677 | 0.679 | 0.692 | 0.706 | 0.721 |
| Lakshadweep | 0.629 | 0.627 | 0.633 | 0.637 | 0.644 | 0.653 | 0.662 | 0.665 | 0.672 | 0.683 | 0.682 | 0.684 | 0.684 | 0.691 | 0.698 | 0.707 | 0.715 | 0.723 | 0.720 | 0.726 | 0.733 | 0.735 | 0.735 | 0.734 | 0.734 | 0.735 |
| Madhya Pradesh | 0.423 | 0.421 | 0.426 | 0.429 | 0.435 | 0.442 | 0.449 | 0.452 | 0.457 | 0.465 | 0.464 | 0.465 | 0.465 | 0.470 | 0.476 | 0.483 | 0.490 | 0.501 | 0.503 | 0.512 | 0.523 | 0.530 | 0.535 | 0.544 | 0.555 | 0.566 |
| Maharashtra | 0.483 | 0.481 | 0.487 | 0.491 | 0.499 | 0.508 | 0.517 | 0.521 | 0.528 | 0.539 | 0.541 | 0.545 | 0.547 | 0.555 | 0.564 | 0.574 | 0.585 | 0.597 | 0.599 | 0.609 | 0.621 | 0.628 | 0.633 | 0.639 | 0.646 | 0.654 |
| Manipur | 0.405 | 0.403 | 0.408 | 0.415 | 0.424 | 0.435 | 0.446 | 0.452 | 0.460 | 0.473 | 0.477 | 0.482 | 0.487 | 0.496 | 0.506 | 0.518 | 0.530 | 0.559 | 0.578 | 0.605 | 0.633 | 0.658 | 0.680 | 0.659 | 0.640 | 0.621 |
| Meghalaya | 0.410 | 0.408 | 0.413 | 0.413 | 0.415 | 0.419 | 0.423 | 0.422 | 0.424 | 0.429 | 0.439 | 0.451 | 0.462 | 0.478 | 0.494 | 0.512 | 0.531 | 0.556 | 0.572 | 0.595 | 0.620 | 0.641 | 0.660 | 0.645 | 0.633 | 0.621 |
| Mizoram | 0.435 | 0.433 | 0.438 | 0.446 | 0.455 | 0.467 | 0.478 | 0.484 | 0.493 | 0.507 | 0.520 | 0.535 | 0.549 | 0.568 | 0.588 | 0.610 | 0.632 | 0.658 | 0.673 | 0.697 | 0.722 | 0.743 | 0.761 | 0.746 | 0.733 | 0.720 |
| Nagaland | 0.464 | 0.463 | 0.468 | 0.464 | 0.463 | 0.464 | 0.464 | 0.459 | 0.457 | 0.459 | 0.466 | 0.475 | 0.483 | 0.496 | 0.510 | 0.525 | 0.541 | 0.575 | 0.600 | 0.632 | 0.666 | 0.695 | 0.723 | 0.699 | 0.677 | 0.657 |
| Orissa | 0.375 | 0.373 | 0.378 | 0.381 | 0.387 | 0.394 | 0.400 | 0.402 | 0.407 | 0.416 | 0.418 | 0.423 | 0.427 | 0.435 | 0.444 | 0.454 | 0.465 | 0.478 | 0.481 | 0.492 | 0.504 | 0.512 | 0.519 | 0.525 | 0.534 | 0.543 |
| Puducherry | 0.610 | 0.608 | 0.614 | 0.618 | 0.625 | 0.634 | 0.643 | 0.646 | 0.653 | 0.664 | 0.663 | 0.665 | 0.665 | 0.671 | 0.678 | 0.687 | 0.695 | 0.703 | 0.700 | 0.705 | 0.712 | 0.715 | 0.715 | 0.712 | 0.710 | 0.709 |
| Punjab | 0.506 | 0.504 | 0.509 | 0.519 | 0.531 | 0.545 | 0.559 | 0.568 | 0.580 | 0.596 | 0.599 | 0.604 | 0.607 | 0.617 | 0.627 | 0.639 | 0.651 | 0.662 | 0.664 | 0.673 | 0.683 | 0.690 | 0.694 | 0.704 | 0.716 | 0.729 |
| Rajasthan | 0.419 | 0.417 | 0.422 | 0.429 | 0.439 | 0.450 | 0.460 | 0.466 | 0.475 | 0.488 | 0.489 | 0.492 | 0.494 | 0.501 | 0.508 | 0.517 | 0.527 | 0.539 | 0.542 | 0.552 | 0.564 | 0.572 | 0.578 | 0.589 | 0.601 | 0.615 |
| Sikkim | 0.515 | 0.513 | 0.518 | 0.522 | 0.529 | 0.537 | 0.545 | 0.548 | 0.554 | 0.564 | 0.564 | 0.566 | 0.567 | 0.573 | 0.580 | 0.588 | 0.597 | 0.603 | 0.599 | 0.603 | 0.608 | 0.609 | 0.608 | 0.631 | 0.656 | 0.682 |
| Tamil Nadu | 0.440 | 0.438 | 0.443 | 0.449 | 0.457 | 0.466 | 0.476 | 0.481 | 0.488 | 0.500 | 0.503 | 0.508 | 0.512 | 0.522 | 0.532 | 0.543 | 0.555 | 0.575 | 0.586 | 0.604 | 0.623 | 0.639 | 0.652 | 0.655 | 0.659 | 0.664 |
| Telangana | 0.558 | 0.556 | 0.562 | 0.566 | 0.573 | 0.581 | 0.590 | 0.593 | 0.599 | 0.610 | 0.609 | 0.611 | 0.611 | 0.617 | 0.623 | 0.632 | 0.640 | 0.647 | 0.645 | 0.650 | 0.657 | 0.659 | 0.659 | 0.658 | 0.658 | 0.659 |
| Tripura | 0.403 | 0.401 | 0.406 | 0.411 | 0.419 | 0.428 | 0.438 | 0.442 | 0.449 | 0.460 | 0.463 | 0.468 | 0.472 | 0.481 | 0.490 | 0.502 | 0.513 | 0.525 | 0.529 | 0.539 | 0.551 | 0.560 | 0.565 | 0.567 | 0.571 | 0.575 |
| Uttar Pradesh | 0.408 | 0.406 | 0.411 | 0.413 | 0.418 | 0.425 | 0.431 | 0.433 | 0.437 | 0.445 | 0.448 | 0.453 | 0.456 | 0.465 | 0.473 | 0.484 | 0.495 | 0.502 | 0.500 | 0.505 | 0.512 | 0.515 | 0.516 | 0.526 | 0.539 | 0.552 |
| Uttarakhand | 0.512 | 0.510 | 0.516 | 0.520 | 0.527 | 0.535 | 0.543 | 0.546 | 0.552 | 0.562 | 0.561 | 0.563 | 0.563 | 0.569 | 0.575 | 0.583 | 0.591 | 0.598 | 0.596 | 0.601 | 0.607 | 0.610 | 0.610 | 0.621 | 0.635 | 0.649 |
| West Bengal | 0.424 | 0.422 | 0.427 | 0.430 | 0.436 | 0.443 | 0.450 | 0.452 | 0.457 | 0.466 | 0.467 | 0.471 | 0.472 | 0.480 | 0.487 | 0.496 | 0.506 | 0.515 | 0.516 | 0.524 | 0.534 | 0.539 | 0.543 | 0.552 | 0.564 | 0.576 |