
Abstract
This article attempts to evaluate differential progress in educational attainment across social groups segregating the attainments at the level of age cohorts. It argues that mapping of educational attainment across age cohorts offers a robust understanding of educational progress, as it sheds light on the likelihood of younger age-groups getting educated in comparison with the older ones. This article examines attainments across five levels of education among the population subgroups which are categorised based on region (rural–urban), social background (SC/ST and Others), and gender (male–female) among others. The analysis reveals that group disparities tend to be lower among the younger age groups but increase along with rising levels of educational attainment. Gender disparity nearly disappears in the youngest age cohort among the better off groups. This exercise at the level of age cohorts offers an optimism that differentials seem to narrow down in recent times, which is not as stark at the aggregate subgroup levels.
Keywords
Introduction
Expanding educational opportunities has always been a key policy challenge for India. Though, India has observed rapid educational expansion in recent years, and this is evident in terms of the increasing number of educational institutions and improvement in enrolment at each level, however, with the expansion of educational opportunities, there is also the challenge of ending group disparity in educational attainment. It is well known that development outcomes in India are not evenly distributed across various subgroups of the population. The most frequently discussed aspects of group disparity in India are as follows: gender, social group and rural–urban.
Given this background, the present study is an attempt to evaluate educational progress in India from a distributional perspective. The focus of the article is to evaluate group disparity in educational attainment. Group disparities in educational outcomes need to be considered differently from other outcomes as educational outcomes are accomplished or not accomplished at a certain age in life course and continue to remain with an individual throughout his/her life.
Age-specific analysis seems to be more appropriate for providing a better presentation of educational progress/disparity. Therefore, the evaluation of educational progress/disparity in the present article was carried out by comparing the educational attainment of younger age cohorts with that of older ones. The relevance of age cohort analysis arises from the fact that every younger age cohort enjoys better educational opportunities than older ones as educational opportunity expands over the years. The likelihood of a person’s educational attainment is determined by the schooling opportunities available at their school/college-going age. Such information on educational attainment can be utilised to plan responsive, feasible and effective educational policies. The second section of the article discusses the approach followed and data source. Educational progress in India is analysed in the third section of the article. The fourth and fifth sections present the group disparity in educational progress. Sixth section concludes the findings.
Data and Analytics
The importance of the present study lies in the data source and approach used to analyse group disparity in educational attainment. The indicators used to analyse educational progress/group disparity can be broadly categorised into two groups: flow variables and stock variables. Flow variables include the enrolment ratio at different levels of schooling, such as primary, secondary and tertiary enrolment ratios. Enrolment ratio is defined as the number of pupils in a given educational cycle expressed as a percentage of ‘the population of related school age’. The population of related school age is defined by the legal age of admission to the cycle and duration in years. The enrolment ratio is the most frequently used indicator to assess educational progress in India. The enrolment ratio is undoubtedly very useful in policy formulation. It not only describes entry into education but also progress in participation in education. It helps in understanding the potential to improve participation at any specific level of education and to assess related resource requirements. However, the enrolment ratio is not a true representation of a society’s educational progress. Besides not accounting for repetition and drop out, one of the problems of using enrolment ratio to assess educational progress is that it only measures the flow of the population’s education or access to education. It does not show the cumulated educational attainment/outcome.
Educational variables such as literacy rate, elementary completed, secondary completed or graduation completed in the working age population or proportion of the population are known as the stock variables. They represent the human capital of the population with specific ability. These variables are frequently used in the literature to analyse the impact of education on various aspects of development. These variables present the specific capability of the individual and the population. The change over the years in the human capital, measured in terms of the stock variables, can be used to represent the overall educational progress of a society. However, the changes in the stock of human capital fail to inform about the expansion of educational opportunities. This limitation is largely due to the generational shift in the population. If every older generation experiences lower educational attainment than their younger counterparts at any point of time, then overall educational attainment of whole population tends to improve even without any explicit advantage of the greater educational potential of the population in coming years. While it is necessary that analysis of educational progress should inform about the expansion in educational opportunities, it can alternatively be captured by comparing the educational attainment of younger generation to the older ones.
Many studies in India have evaluated educational progress/disparity for the aggregate population, despite the fact that every individual does not have the opportunity to obtain formal education beyond a particular age. Individuals attend formal educational institutions up to a specific age. However, any aggregate analysis of educational progress/disparity overlooks this reality. For example, in a recent study, Agrawal (2014) evaluated educational inequality in Indian states during the period 1993–1994 to 2009–2010, where educational inequality was measured using the Education Gini for the population age 15 years and above. This analysis suffers from two major shortcomings, namely, inclusion of the younger population that is in the initial stage of their educational cycle and the older population that has passed the school going age. With this kind of comparison, we end up in a situation where a large share of the population is at a stage with potential of nearly no improvement or in an incomplete educational cycle. Therefore, this type of analysis cannot provide a proper understanding of the changing state of educational inequality and the effect of expansion in educational opportunities, and the generational shifts in shaping such inequality.
In order to overcome the above limitation, inequality needs to be verified within well-defined characteristic groups of the population. Such characteristic groups may comprise age cohorts like 25–29, 30–34, …, 65–69 and comparing these would be more appropriate to analyse the dynamics of educational progress/disparity. Many studies analyse educational progress/disparity in India by comparing the overlapping population where a substantial proportion of individuals have little or no possibility of altering their educational status. Some recent studies in this category include Ray and Majumder (2010), Asadullah and Yalonetzky (2012), Bhakta (2015) and Katiyar (2016).
The present analysis exclusively relies on the data provided by the ‘Office of the Registrar General and Census Commissioner of India’ collected under the decadal population census. The latest data is available for the year 2011. Information on educational achievements is released under the Social and Cultural series of the census, best known as C-series. It contains detailed information about individual educational achievements such as the level of education completed. In the present article, educational progress has been analysed through five educational indicators, namely, literacy rate, elementary completed, lower secondary completed, higher secondary completed and graduation completed. These indicators are computed for nine age cohorts aggregated at a 5-year interval, where the first age cohort (70–74) is made up of individuals born between 1937 and 1941, and the youngest age cohort (10–14) includes individual born between 1997 and 2001. Throughout the analysis, the oldest age cohort remains the same for all the educational indicators while youngest age cohort varies. In case of literacy, (10–14) is considered as youngest age cohort, followed by elementary completion (15–19), secondary and higher secondary (20–24) and graduation (25–29).
Educational Progress in India
Figure 1 presents the educational progress in India by age cohort. It is observed from the figure that for a typical age profile, at one point in time, there is higher proportion of educated people in the younger age cohort than in older ones. This is primarily due to the greater access to education among the most recent cohorts compared to those who are older. This is called a cohort effect (or a generation effect) in social sciences. A cohort (generation) is defined here as a group of people born in the same year or a period and who therefore get older with the passage of time. In almost every country in the world, older cohorts are less educated than younger cohorts because education is concentrated in the younger age groups and most education systems have expanded over time.
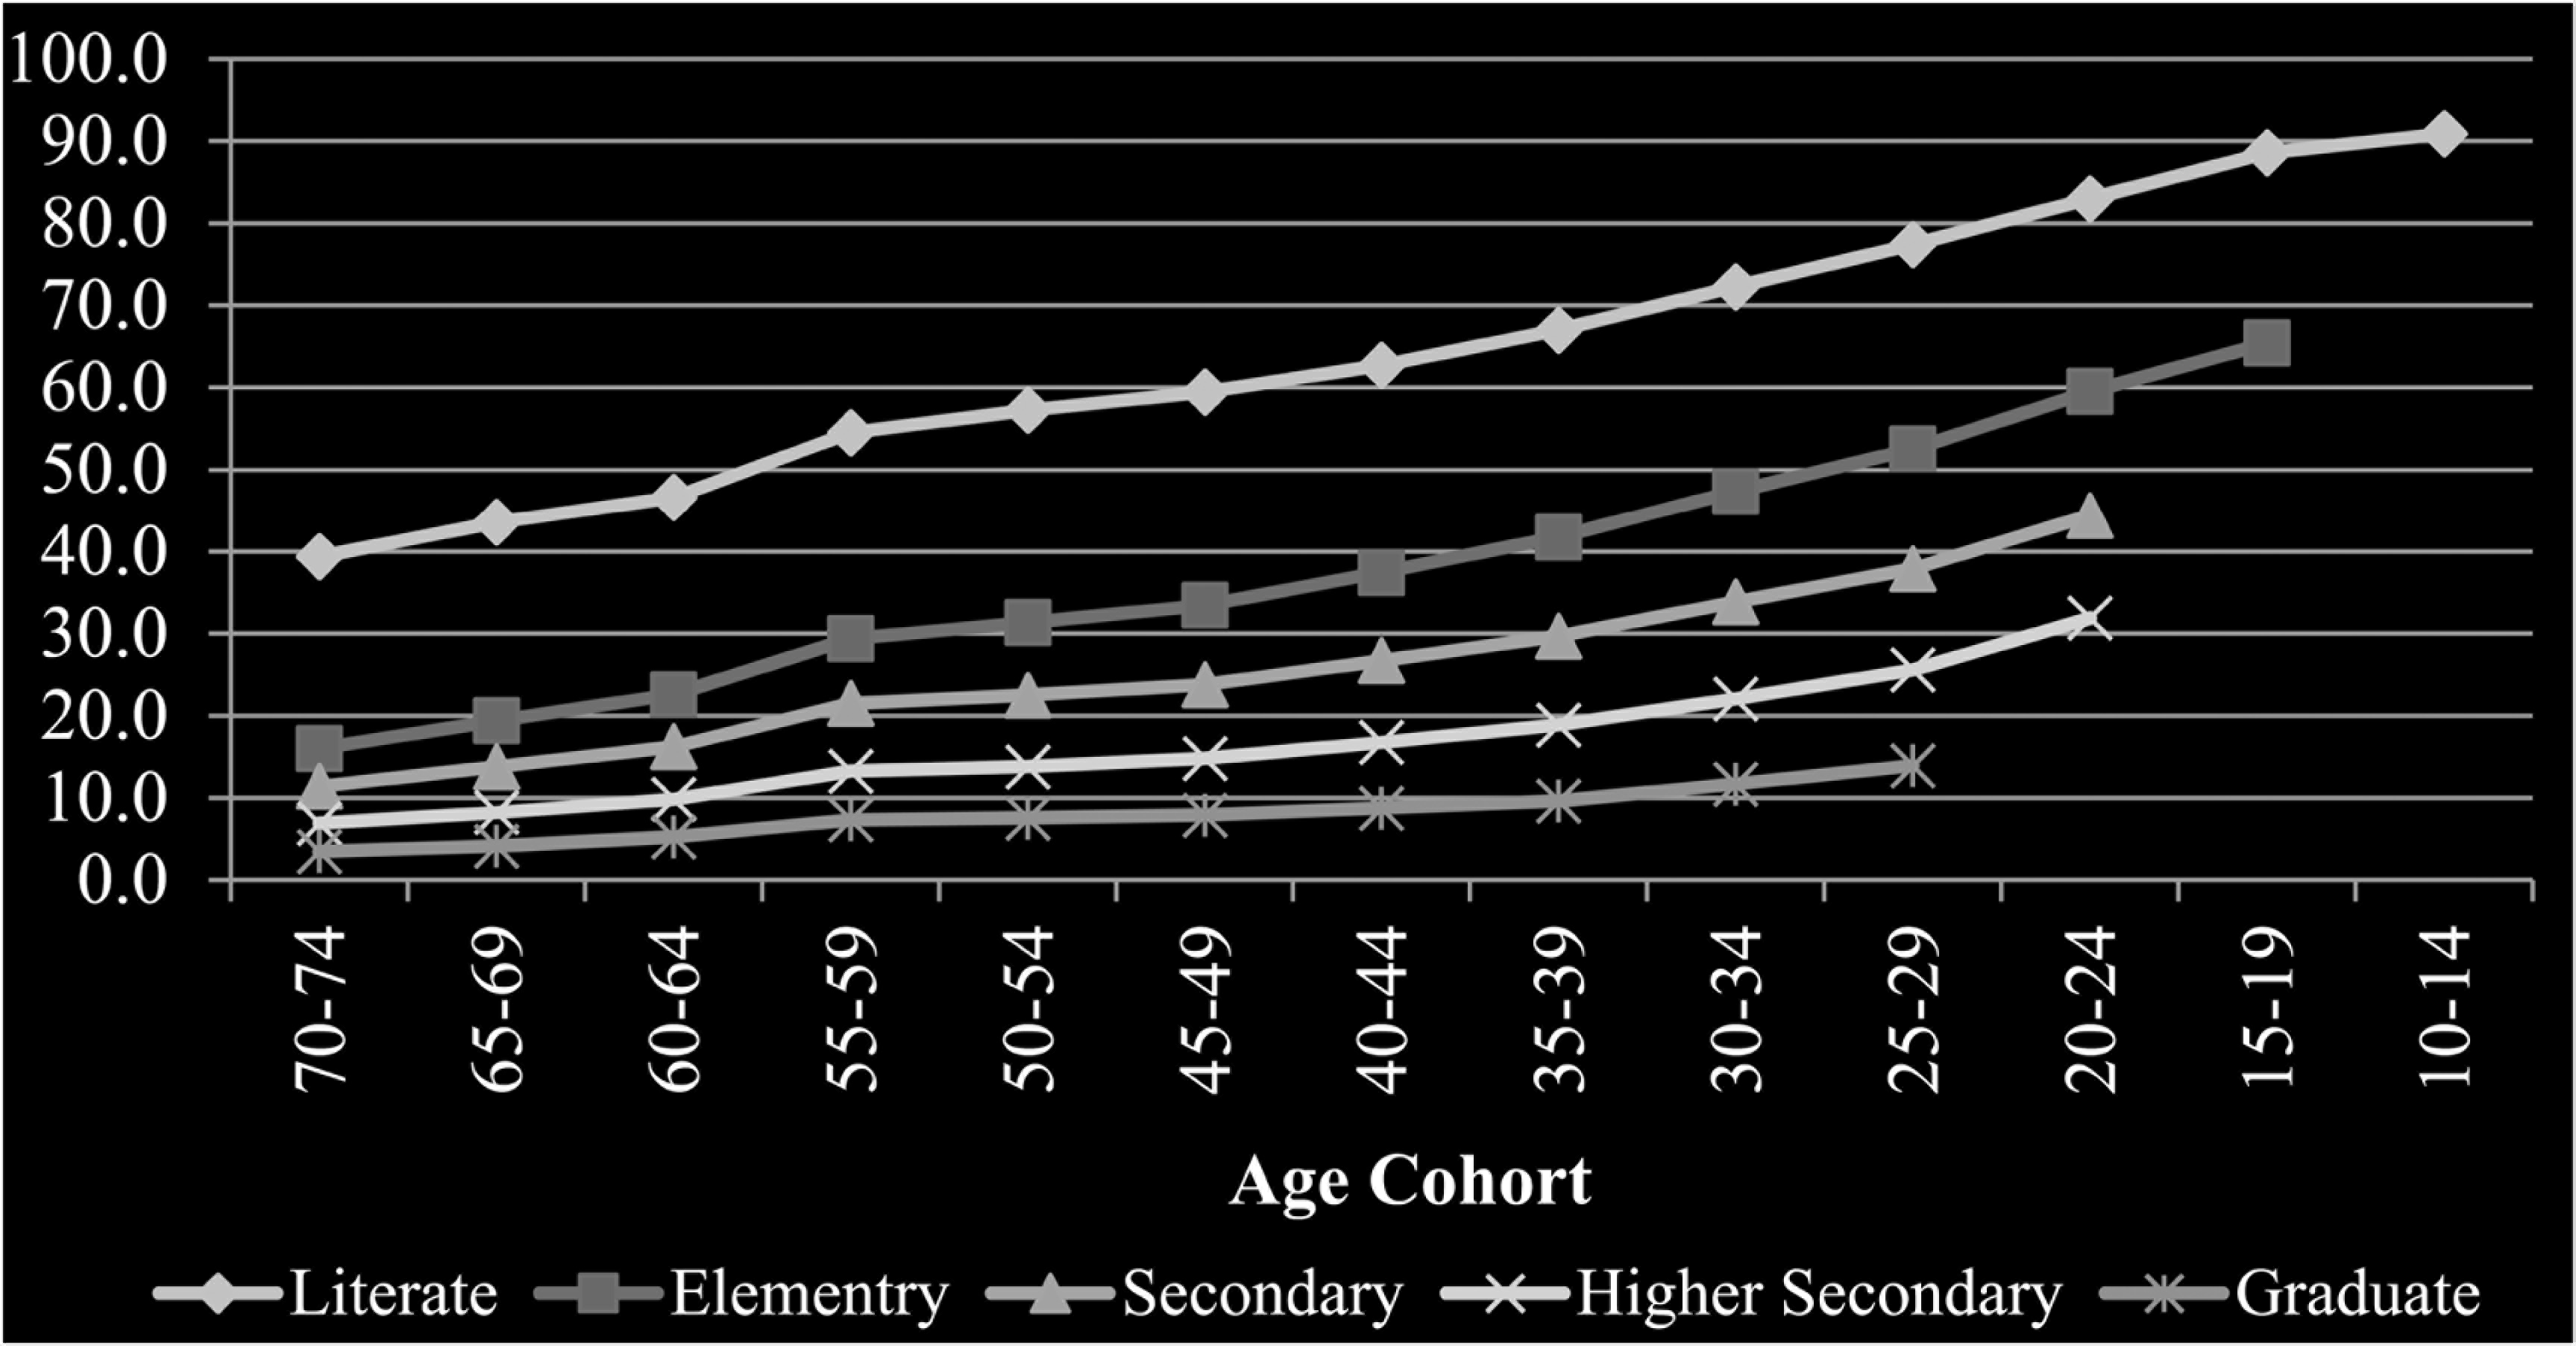
It is observed that the proportion of people with a specific level of educational attainment increases over the age cohort. This reflects a negative relationship between age cohorts and educational attainment. The educational attainment of the youngest age cohort, when compared with that of the older ones, reflects improvement in the expansion of educational opportunities. Once the youngest age cohort achieves an optimum point—from where no further improvement is possible—overall educational improvement can be experienced only through age cohort replacement. For example, once full literacy is achieved for the youngest age cohort (10–14) further improvement in overall literacy can be observed only by replacement of the immediate older age cohort by the youngest age cohort. The population will attain full literacy when this youngest age cohort becomes the oldest age cohort. The age cohort analysis provides the long-term dynamics of progress in educational attainment with the help of the data collected at one point of time (Census 2011 in the present case). It provides a picture of the progress in educational attainment for a period of 60 years and enriches one’s understanding about educational progress by indicating the changes in educational attainment at every 5 years.
India has seen tremendous improvement in educational attainment over the age cohorts. The literacy rate improved from 39% for the age cohort (70–74) to 91% for the age cohort (10–14), the elementary completion rate 16% for the age cohort (70–74) to 65.4% for the age cohort (15–19), the secondary completion rate from 11.4% for the age cohort (70–74) to 44.4% for the age cohort (20–24), the higher secondary completion rate from 6.9% for the age cohort (70–74) to 31.9% for the age cohort (20–24) and the graduation completion rate from 3.4% for the age cohort (70–74) to 13.9% for the age cohort (25–29).
Group Disparity in Education
Gender, social group and rural–urban are widely discussed aspects of group disparity in Indian development literature of which education is not an exception. Educational disparity on all these stated dimensions are discussed in detail in this analysis.
Gender Disparity
Gender equality in terms of participation in and attainment of education is considered the first step towards overall gender justice. Figures 2–6 present educational progress for both males and females for all levels of educational attainment—basic literacy, elementary, secondary, higher secondary and graduation. Educational attainment is measured by computing the proportion of individuals attaining a specific level of education. The age cohort analysis reveals the continuous progress in educational attainment for both genders. The progress is observed for all levels of educational attainment. The continuous progress over the age cohorts is a reflection of the fact that every younger age cohort enjoys better educational opportunities than their older counterpart. The oldest age cohort suffers with the lowest level of educational attainment, while the younger age cohort enjoys the highest attainment.
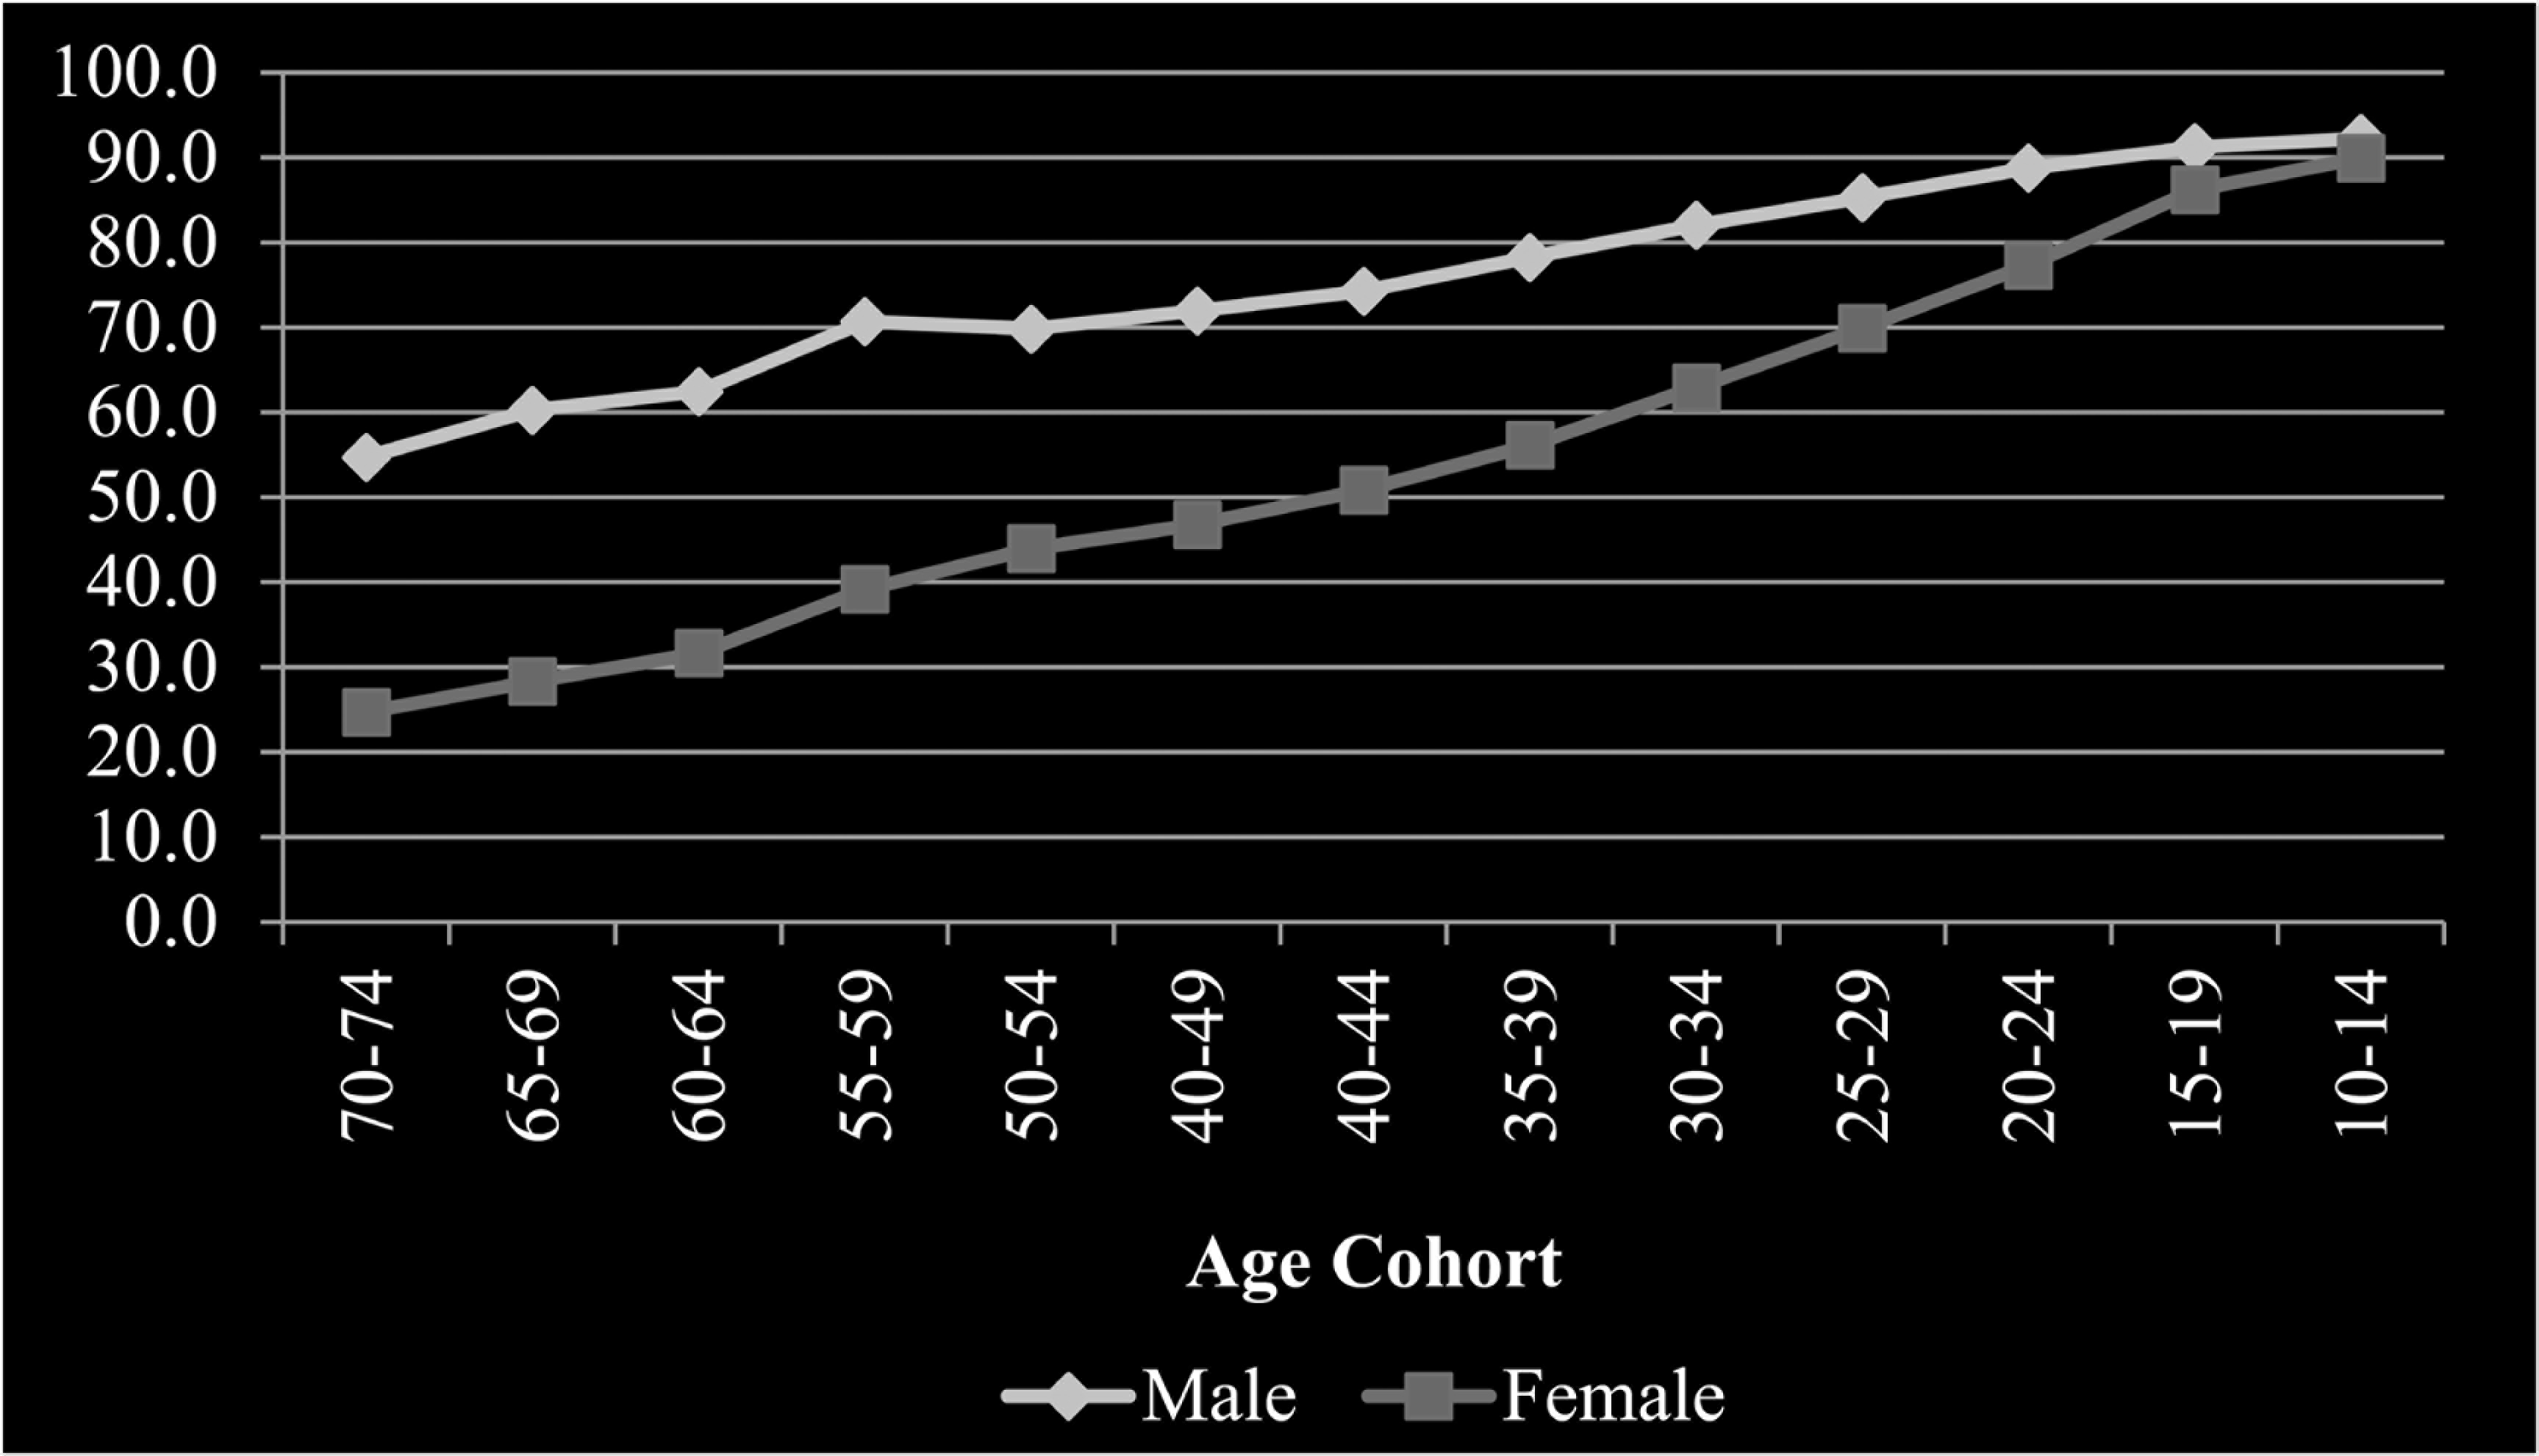
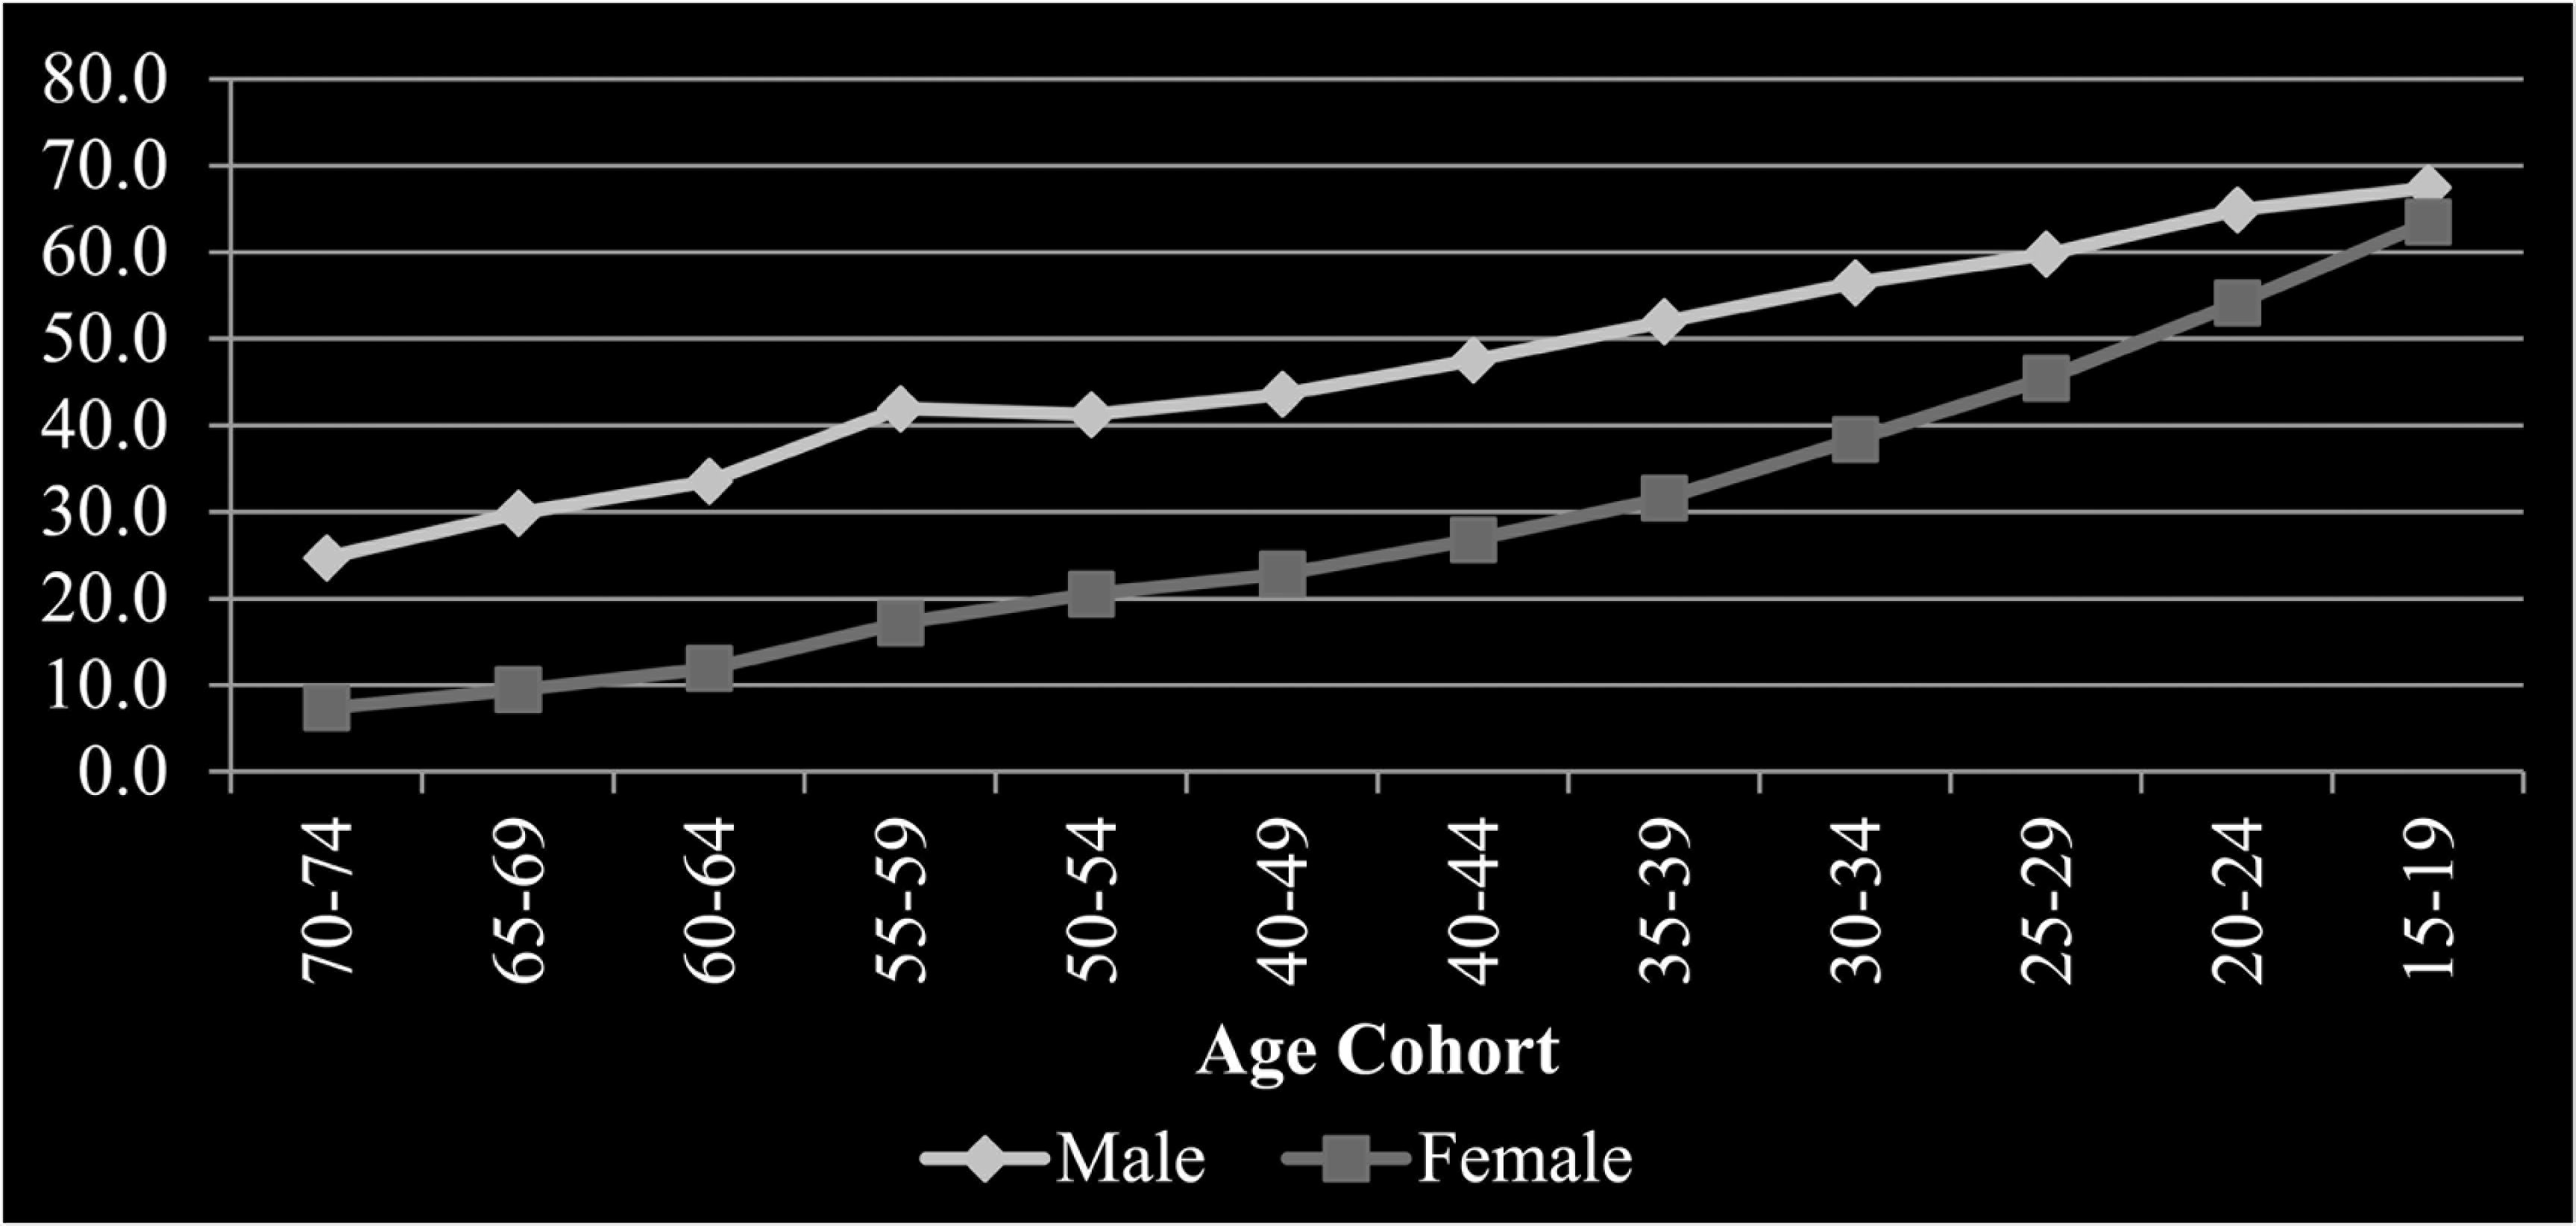
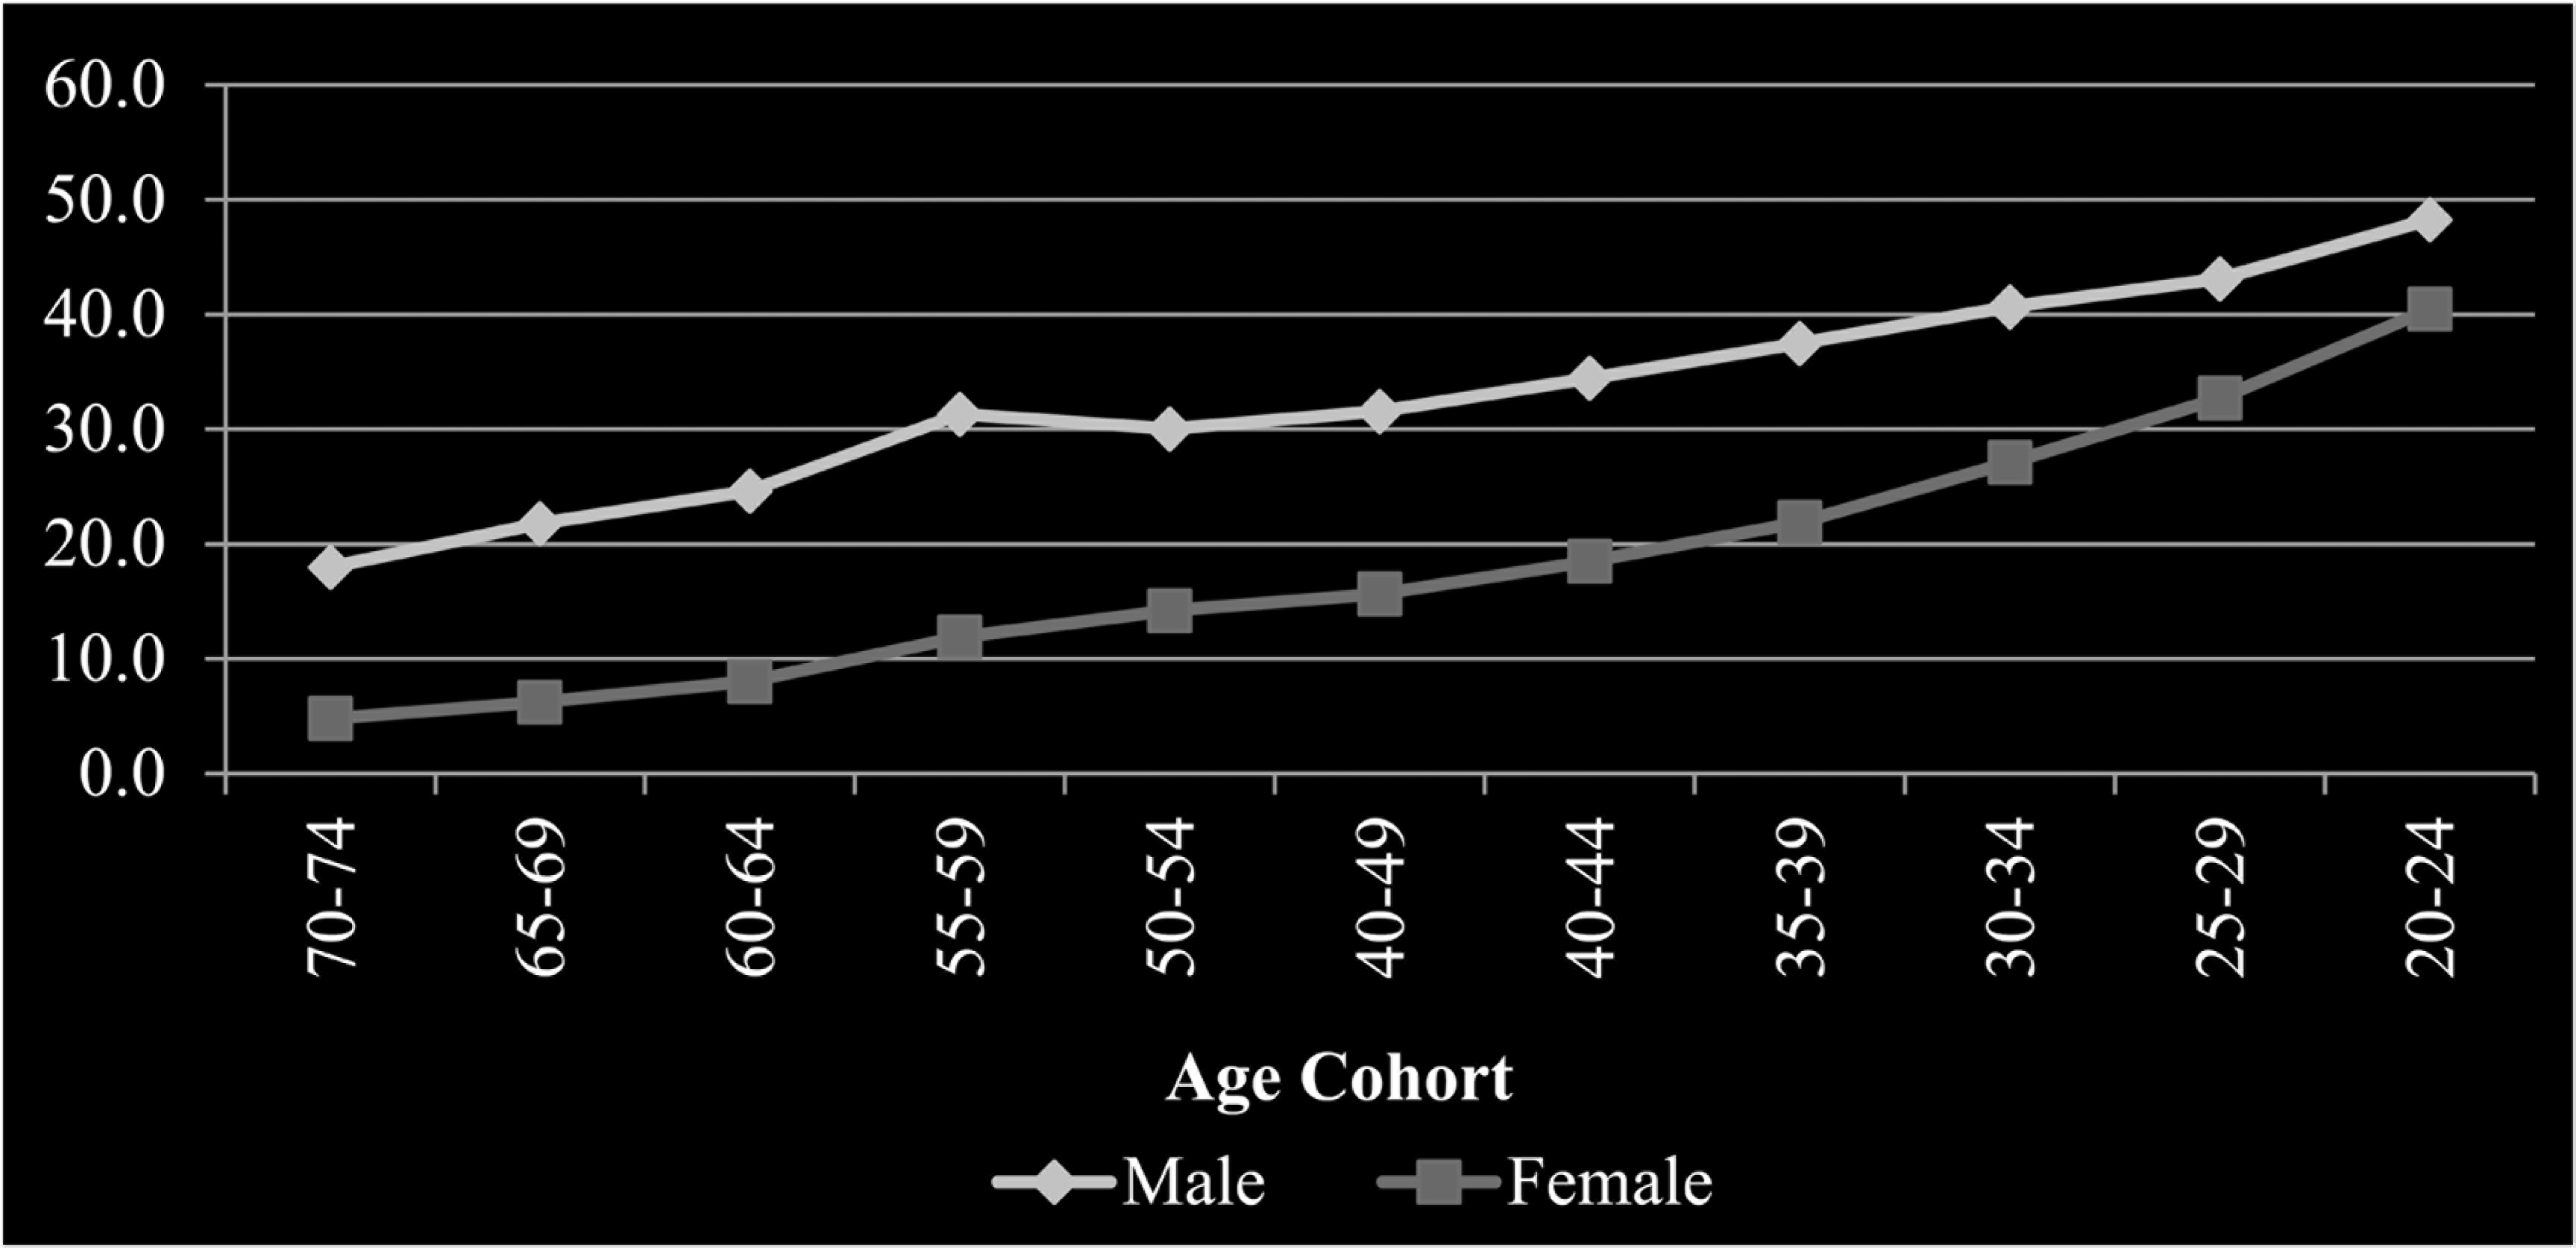
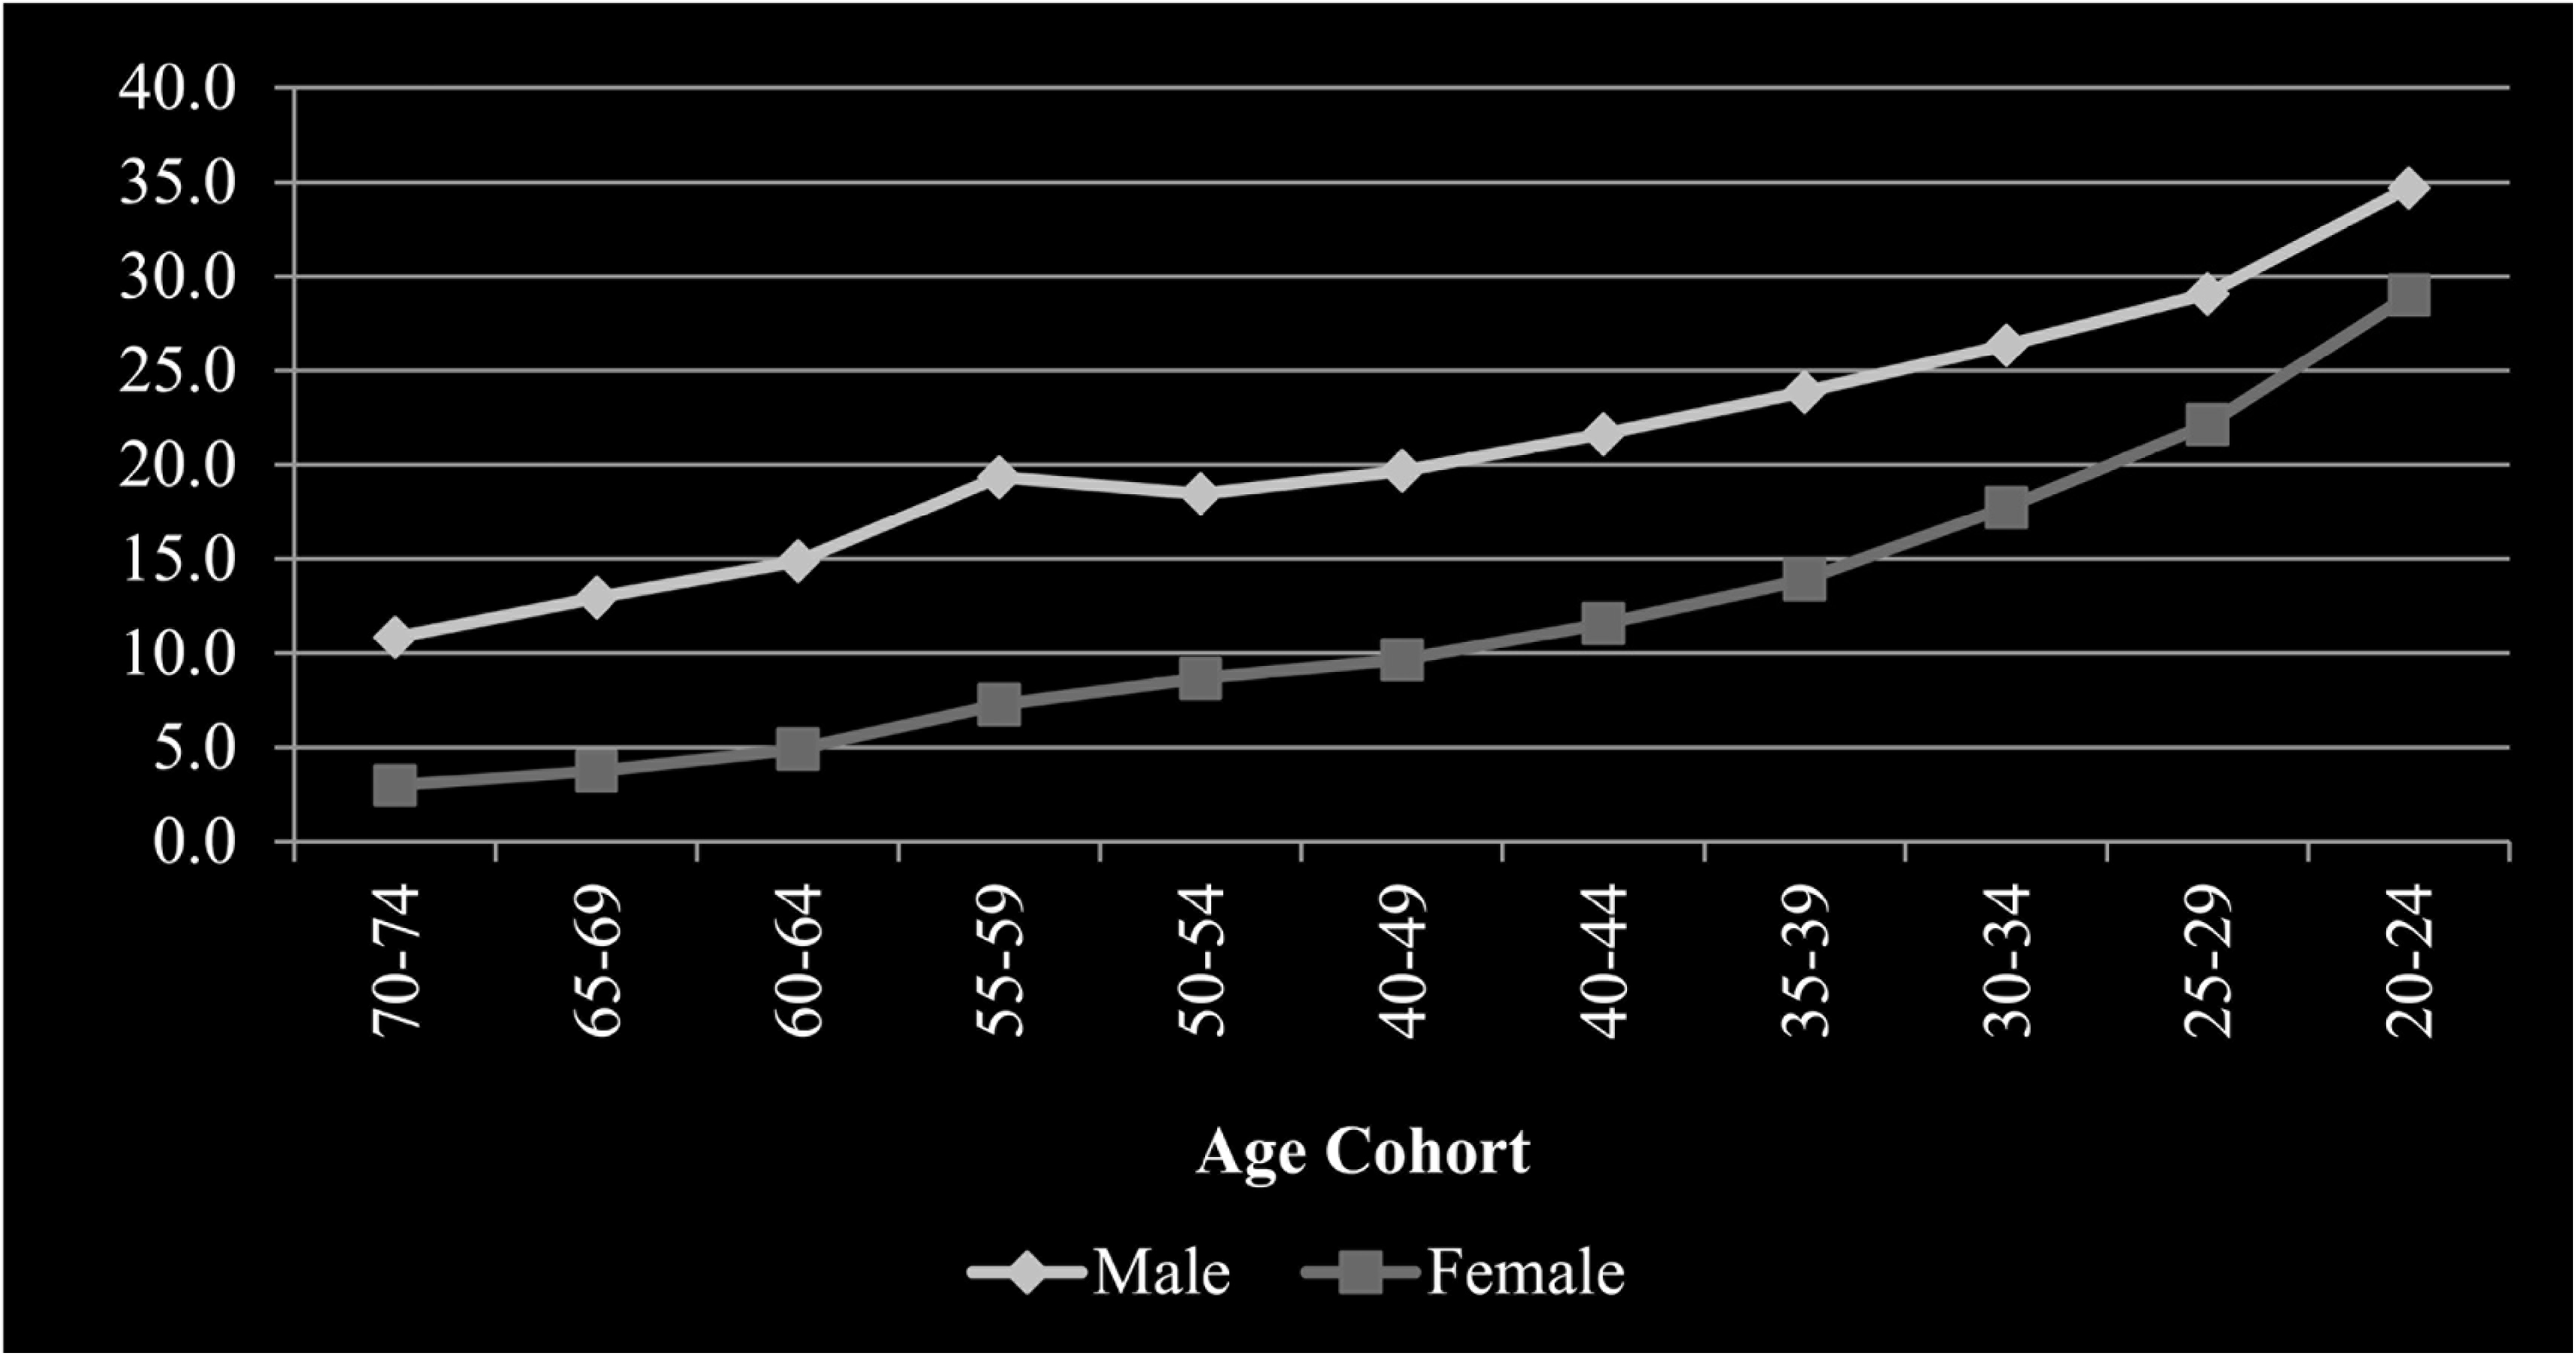
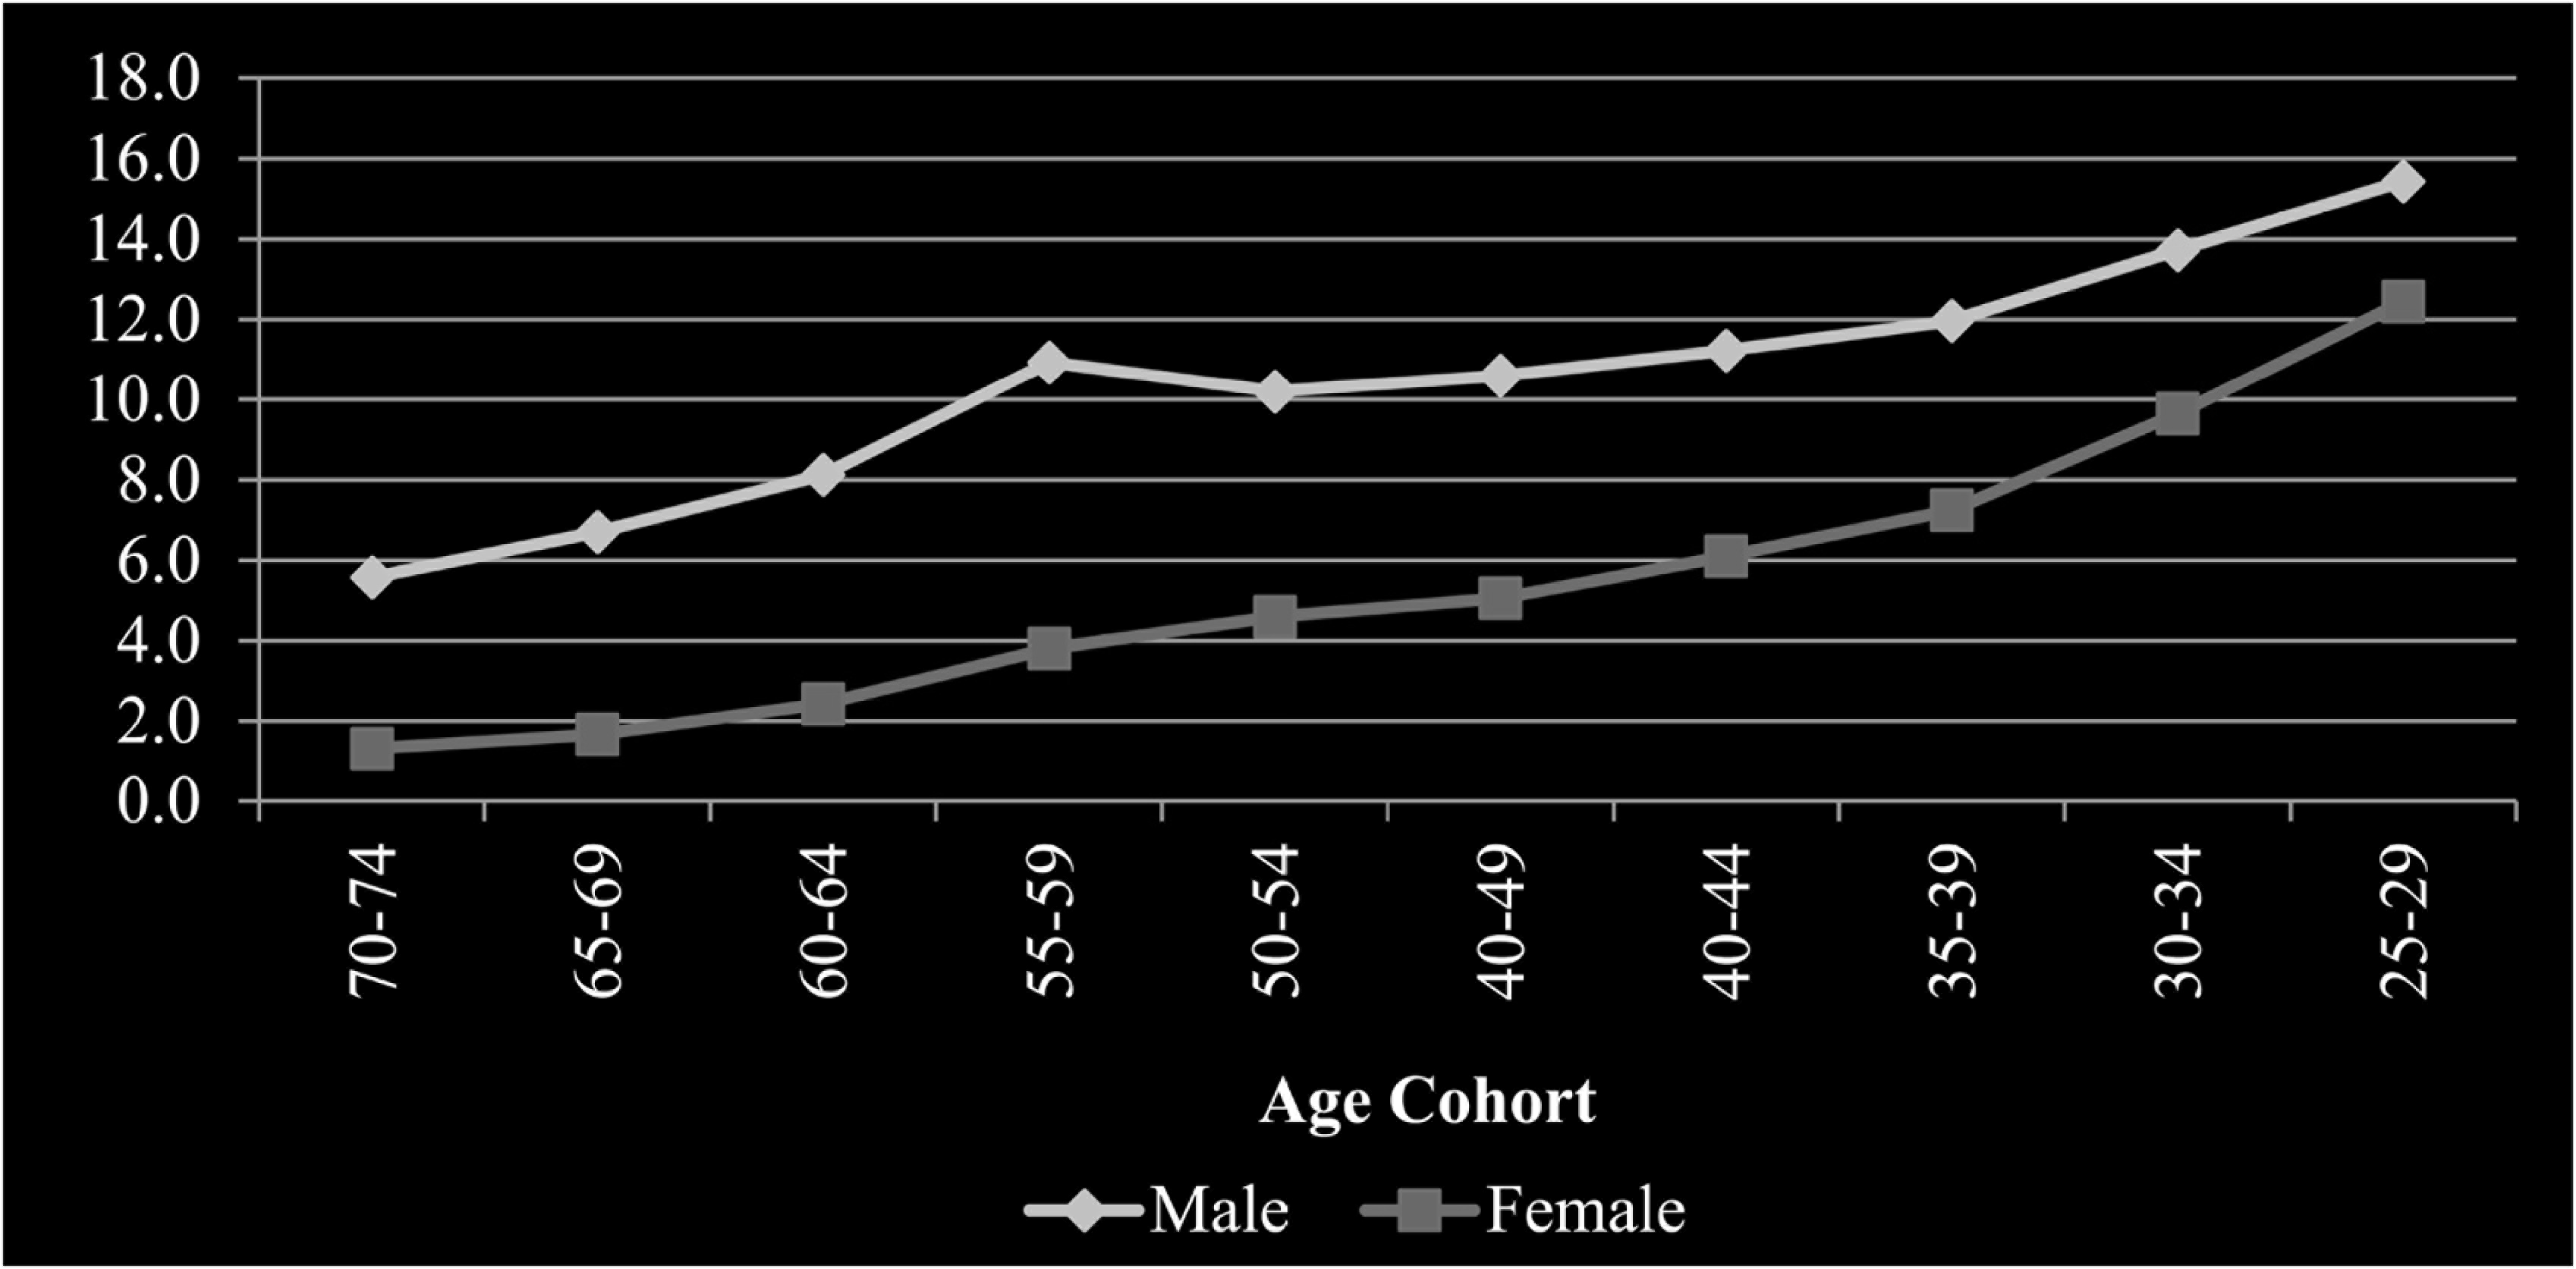
Females have a lower educational attainment rate than males. The gap in educational attainment rate between both the genders is found to be continuously declining from the oldest to youngest age cohort. It is lowest for the youngest age cohort and highest for the oldest. In the case of the literacy and elementary completion rate, equalisation is achieved for the youngest age cohort. Gender equalisation in education for the youngest age cohort is the first step for overall gender equity. It can be achieved when the youngest age cohort with gender equality in educational attainment replaces the oldest age cohort. Gender disparity at a higher educational level as indicated by the secondary, higher secondary and graduation completion rate, too declines from the oldest to youngest age cohort. If gender equality achieved at the elementary completion rate persists towards a higher educational level, it could be observed at every educational level. Therefore, policies are needed to prevent the dropout of females at the higher levels of education. However, gender equality in the aggregate outcome cannot be materialised ever rather it is to be read in terms of the experience in younger age cohorts vis-à-vis the older ones.
Social Disparity
Social disparity is another important aspect of group disparity. It is well established that people belonging to the SC/ST social group are in a disadvantaged position compared to the rest of the population for almost every aspect of development. Therefore, addressing the social disparity in education has always been one of the prime policy objectives in India. Figures 7–11 present the educational attainment for two broad social groups: ‘SC/ST’ and ‘Others’. A continuous improvement is observed in the educational attainment rate for both social groups over the age cohort. Social group ‘others’ has an advantage over the ‘SC/ST’ group over the entire age cohort. The gap in the educational attainment rate between both the social groups continuously declines from the oldest to the youngest age cohort.
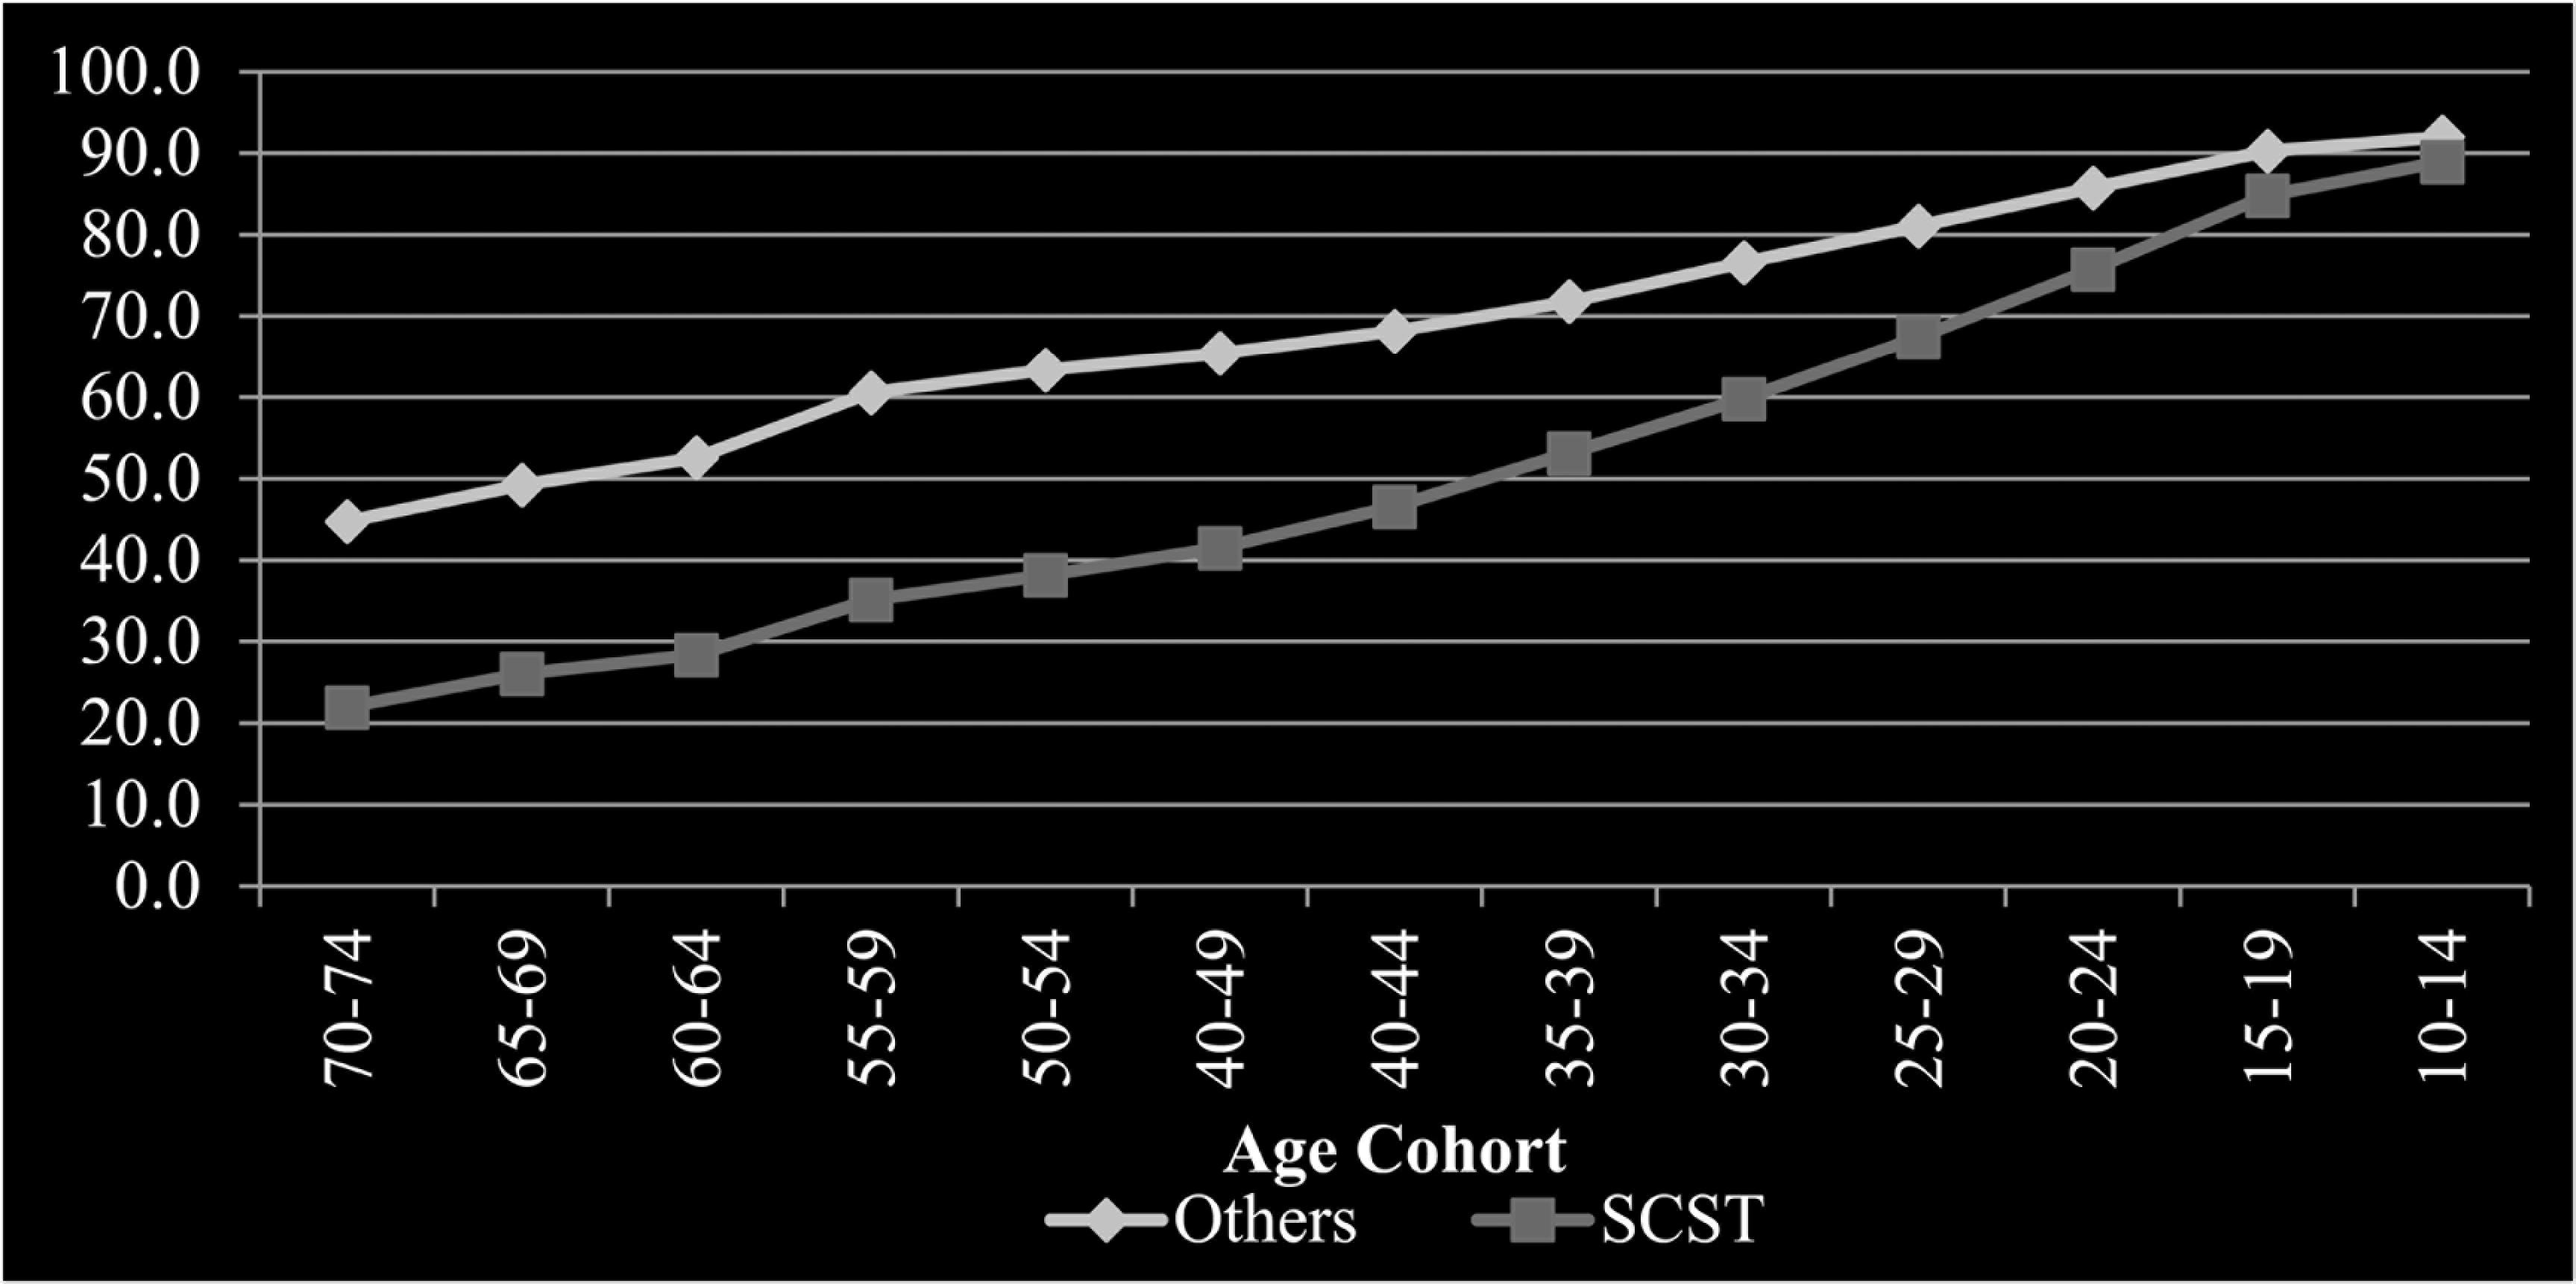
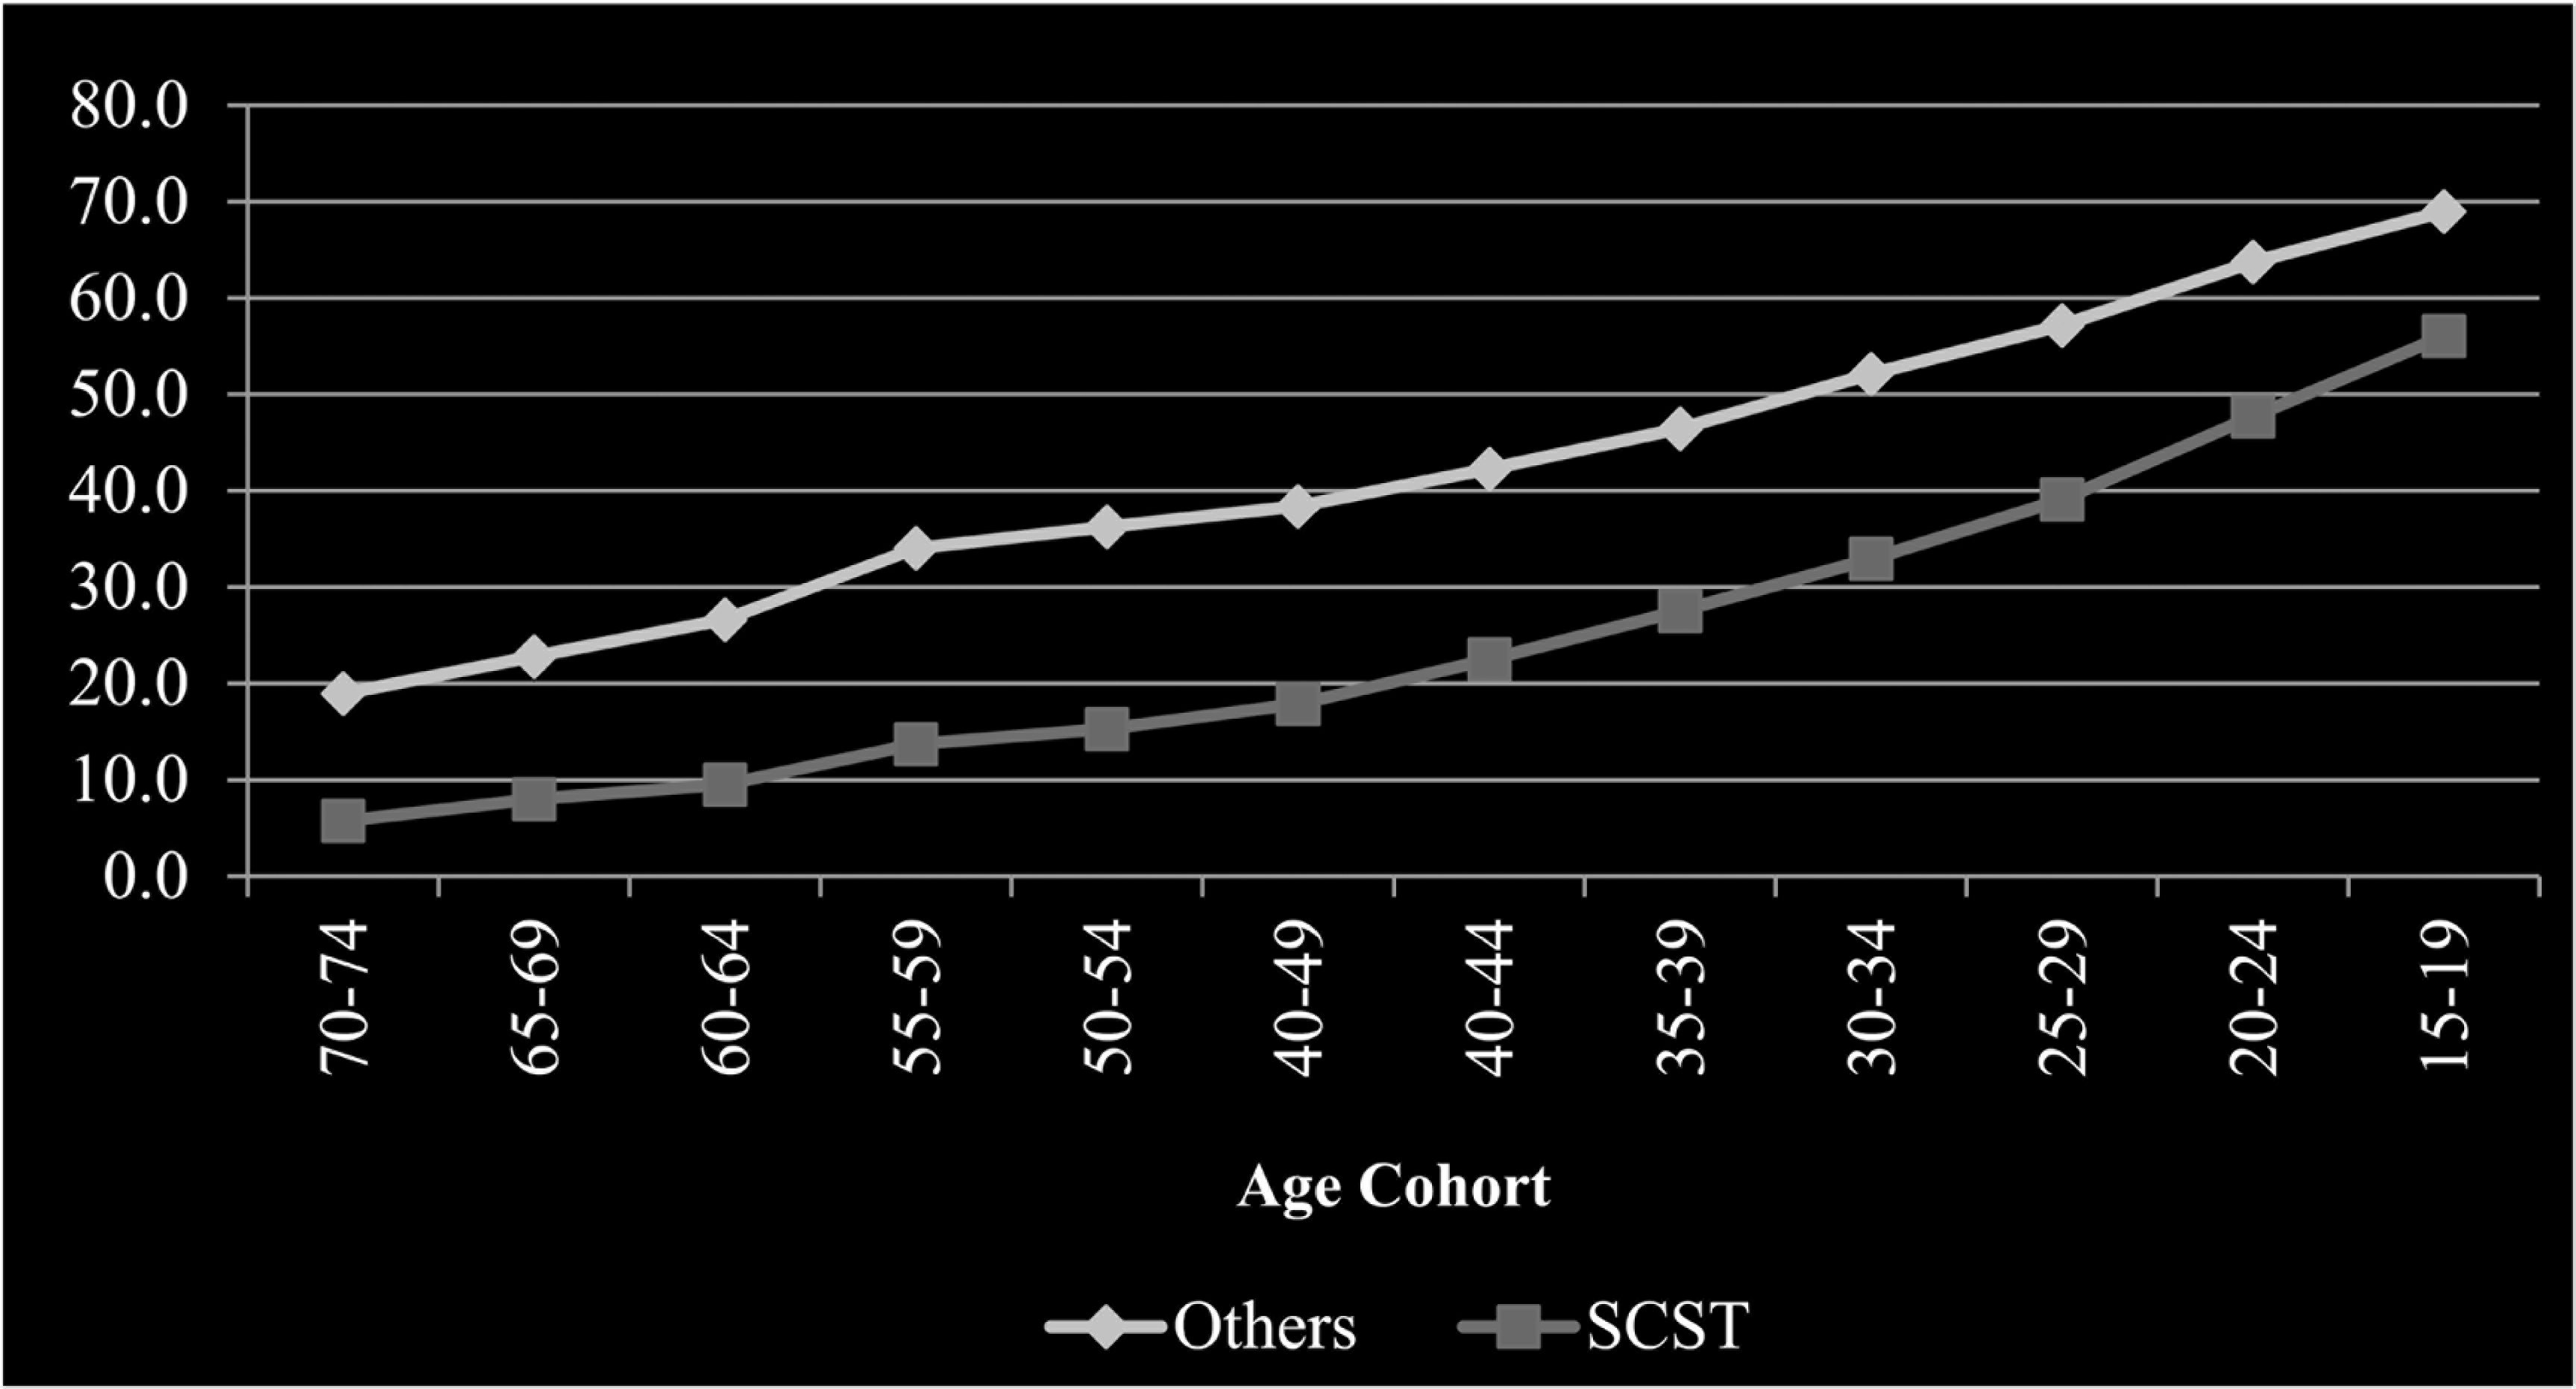
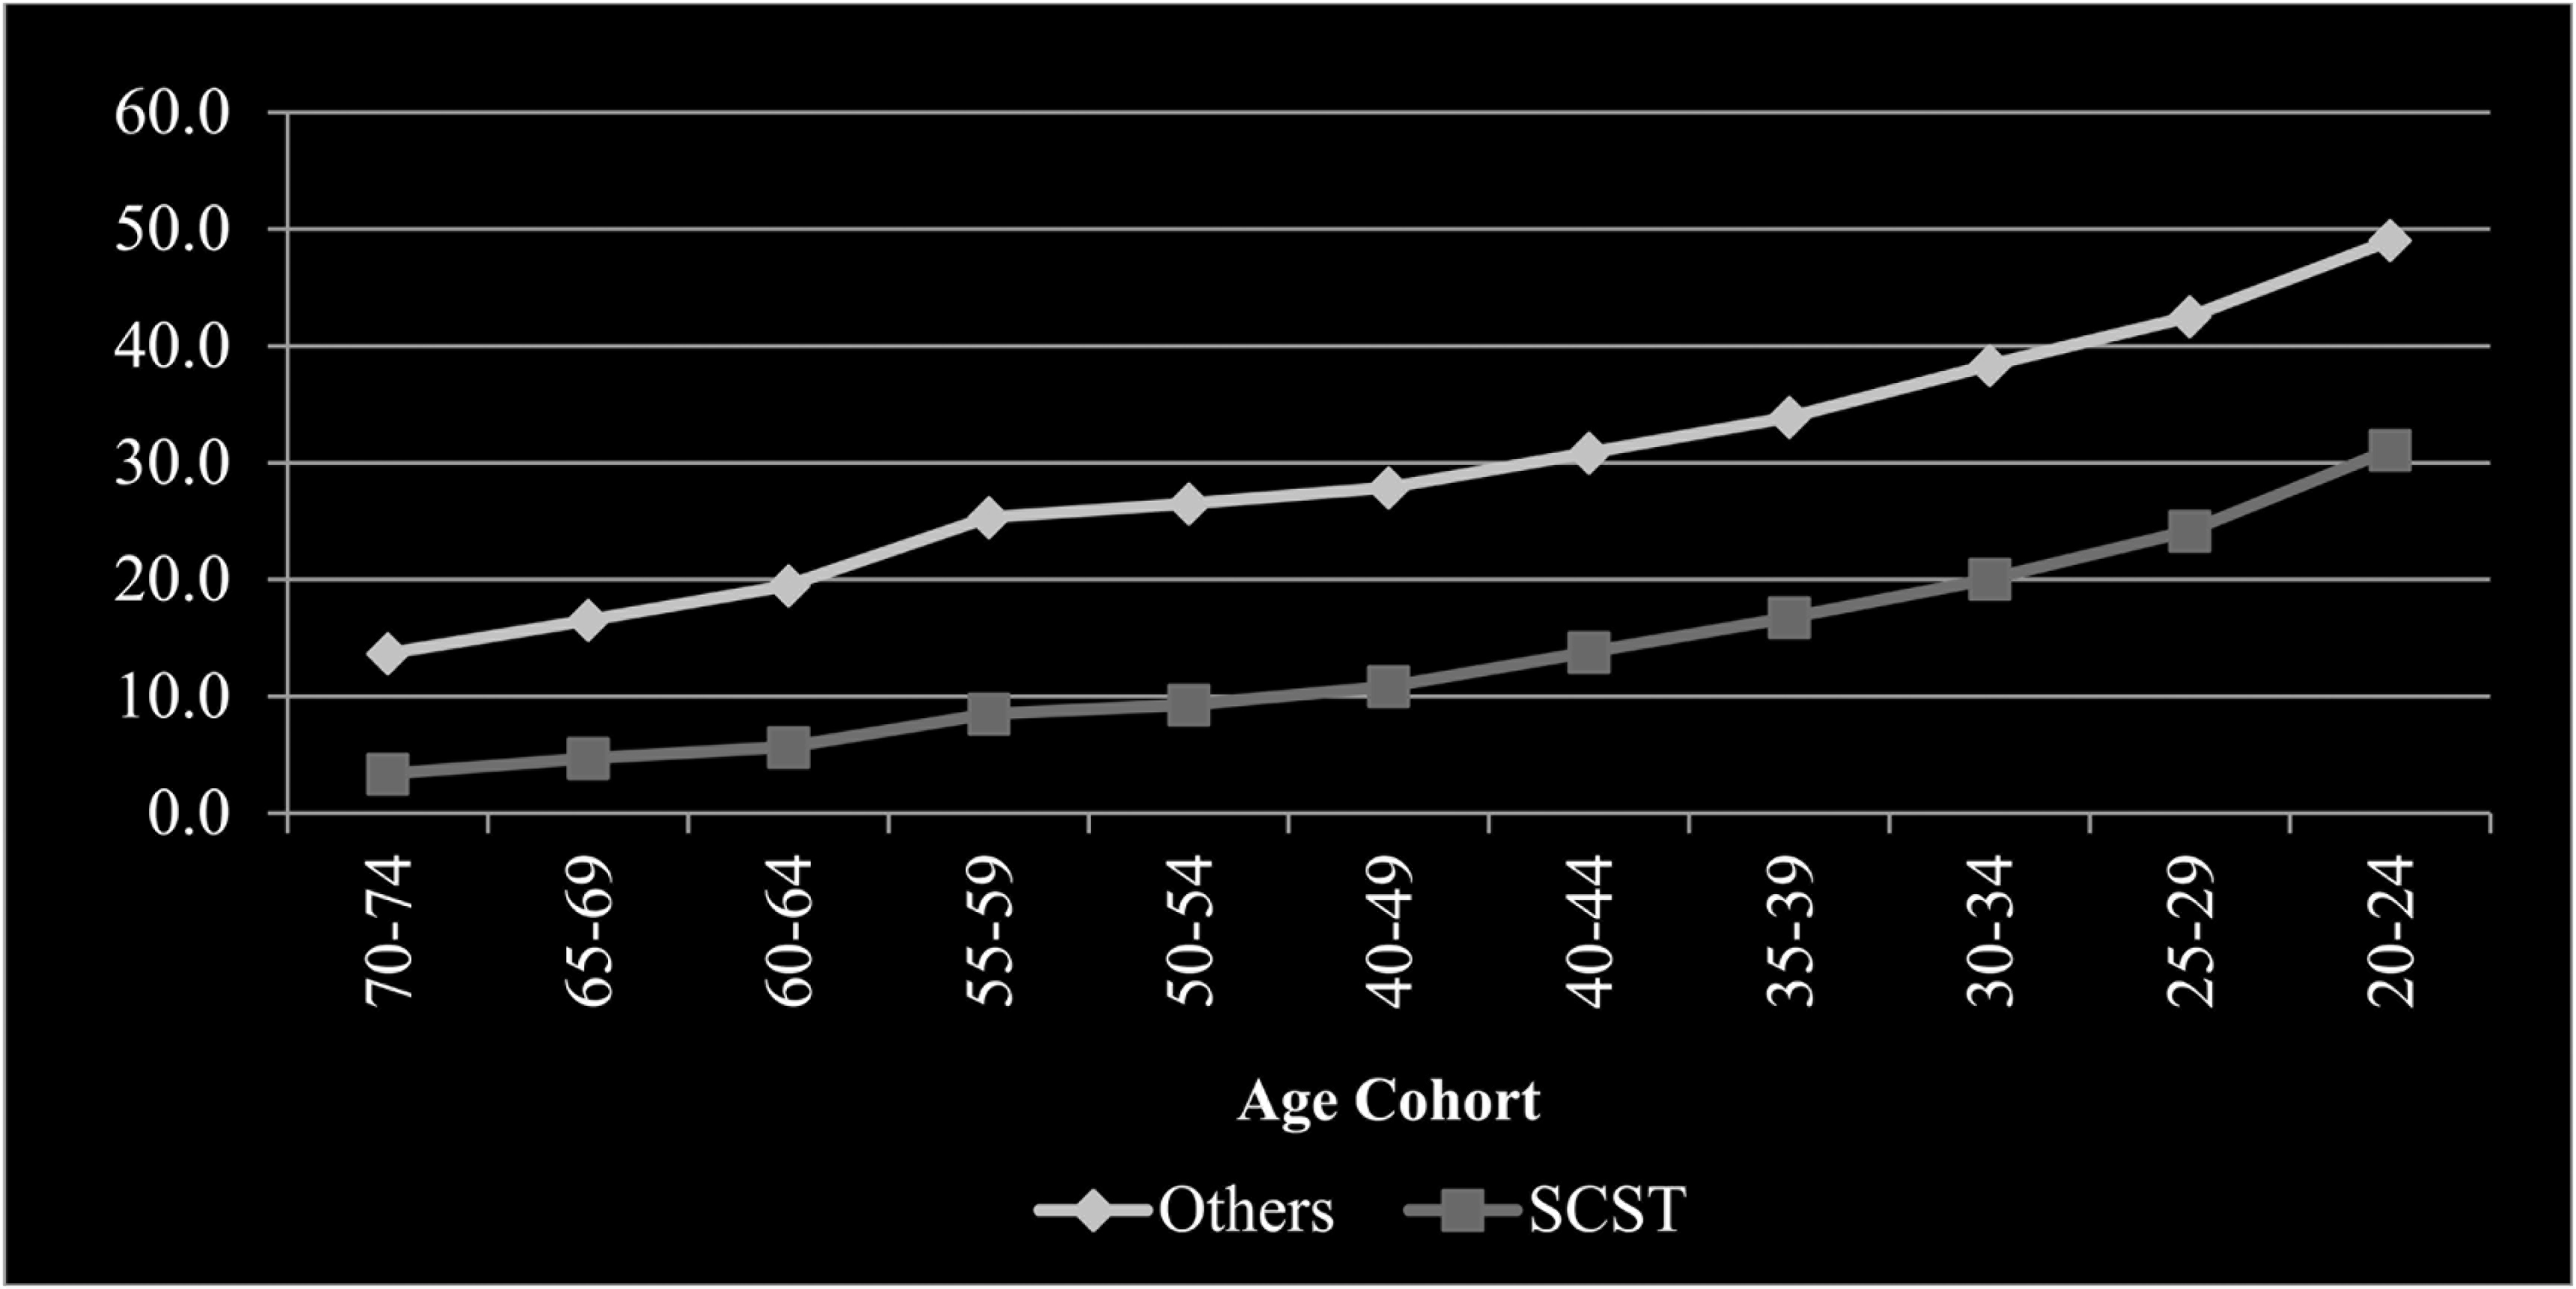
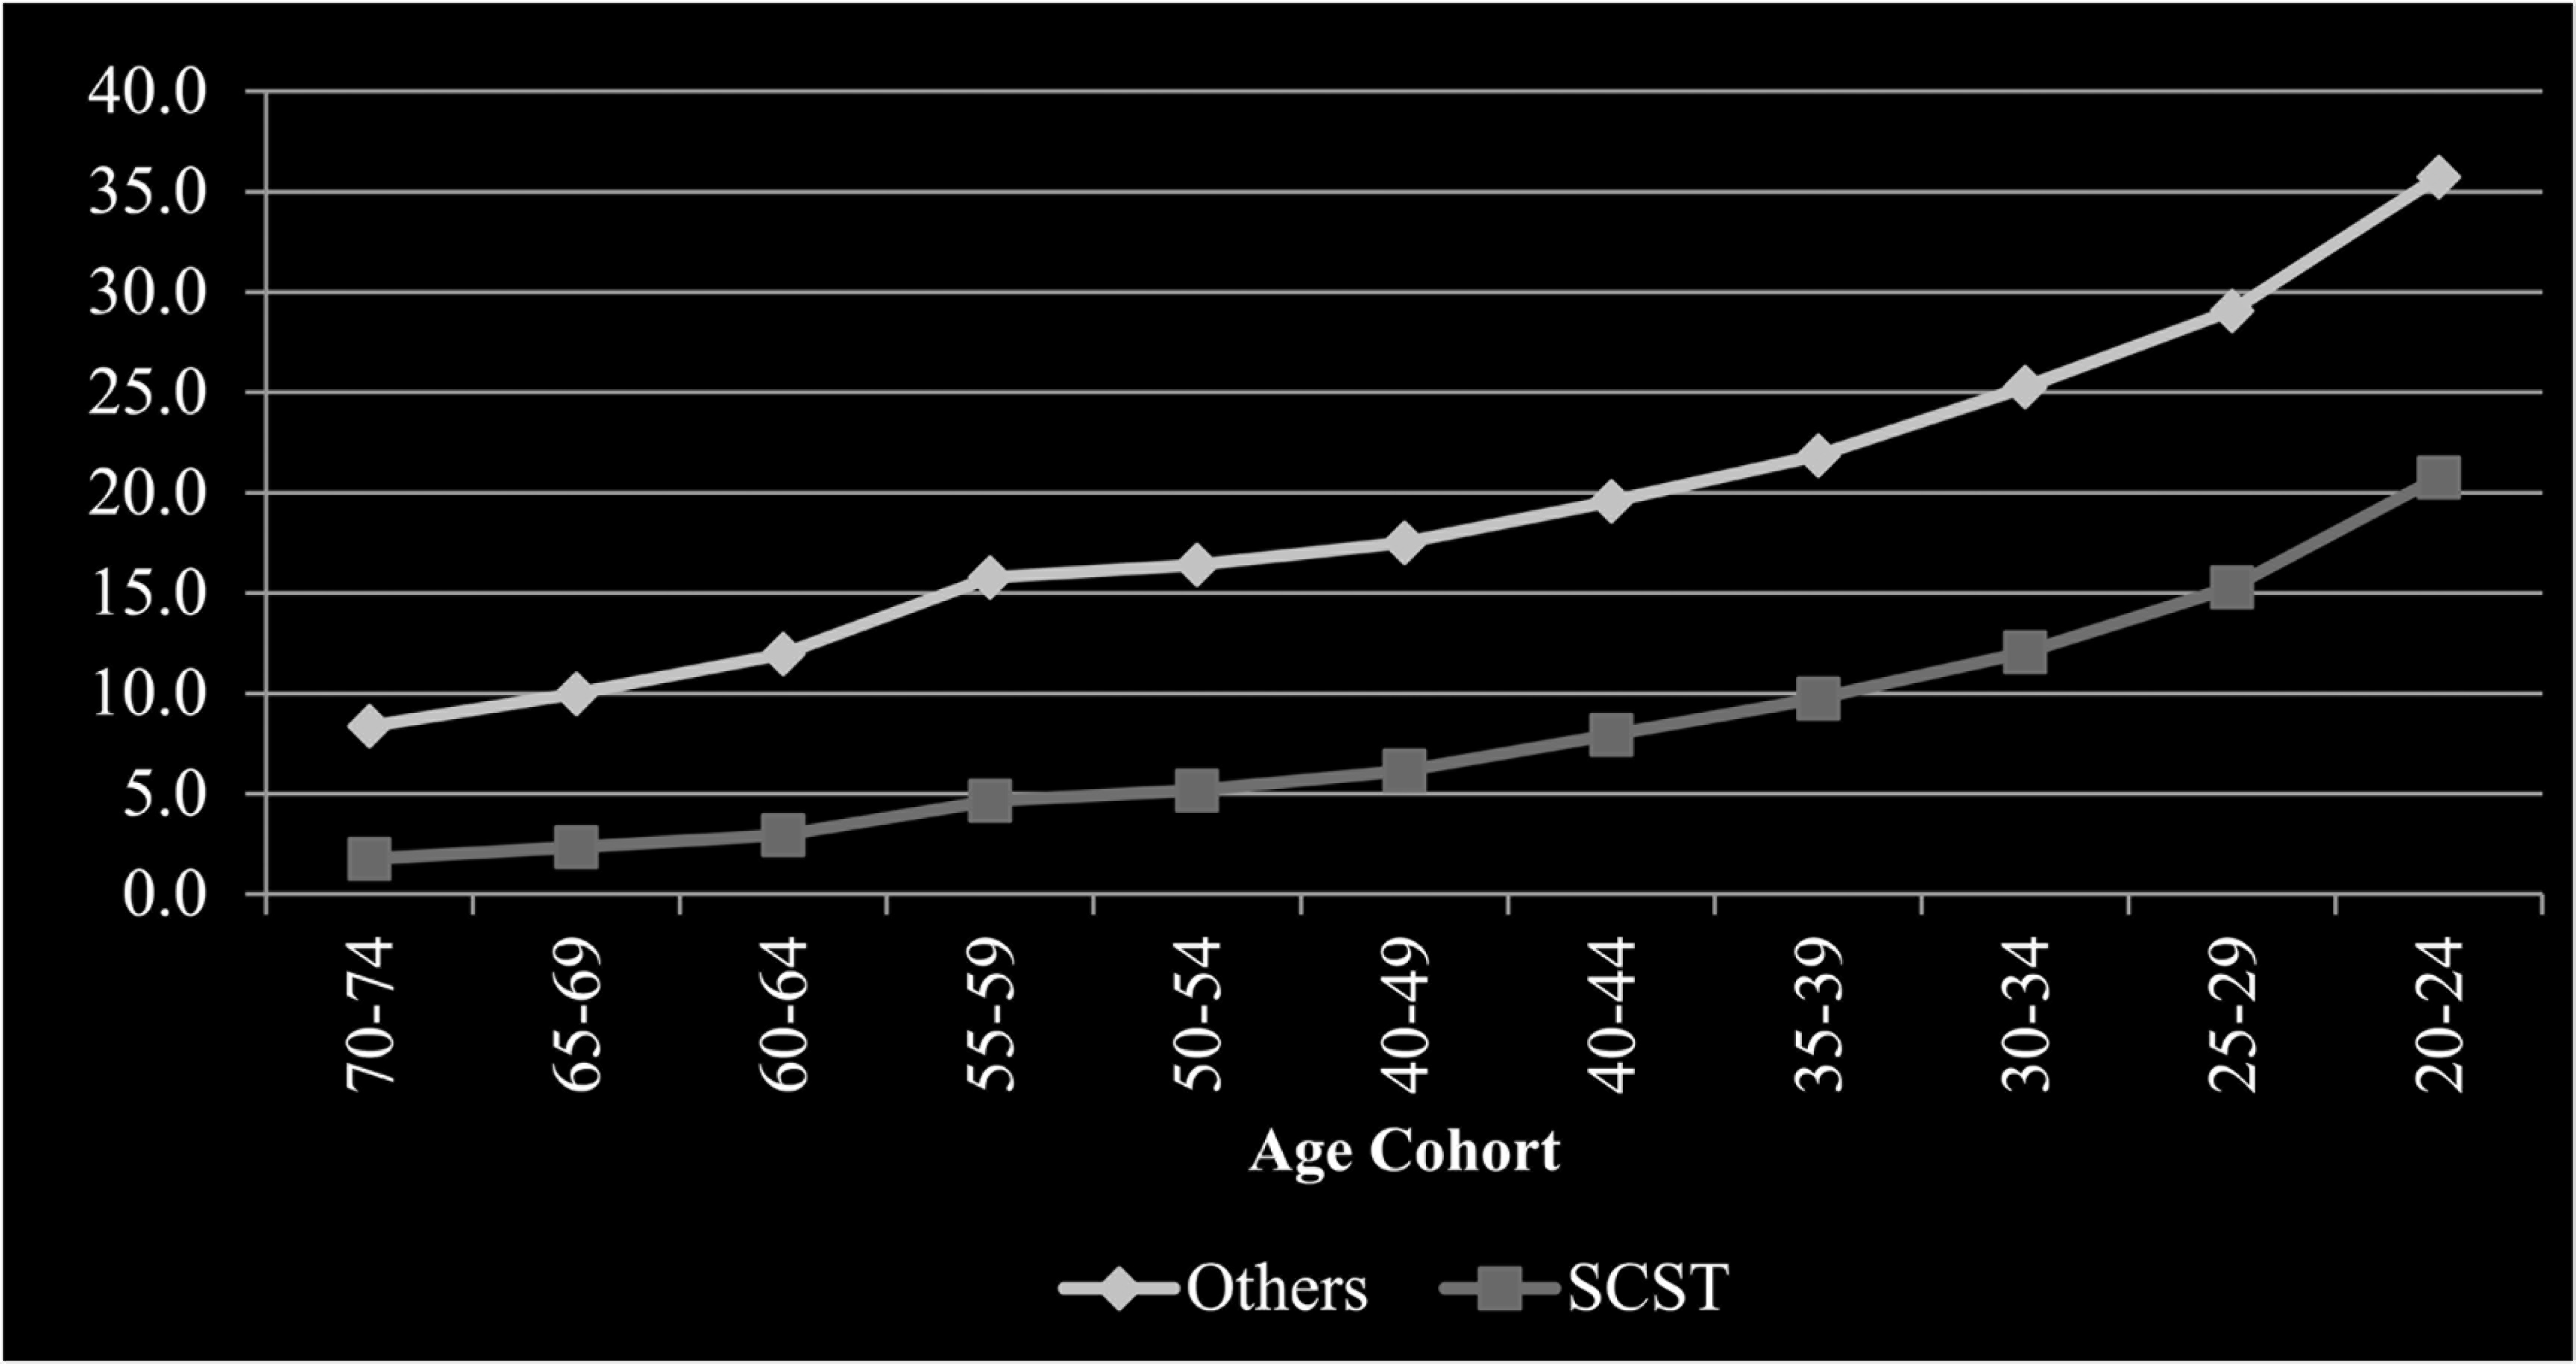
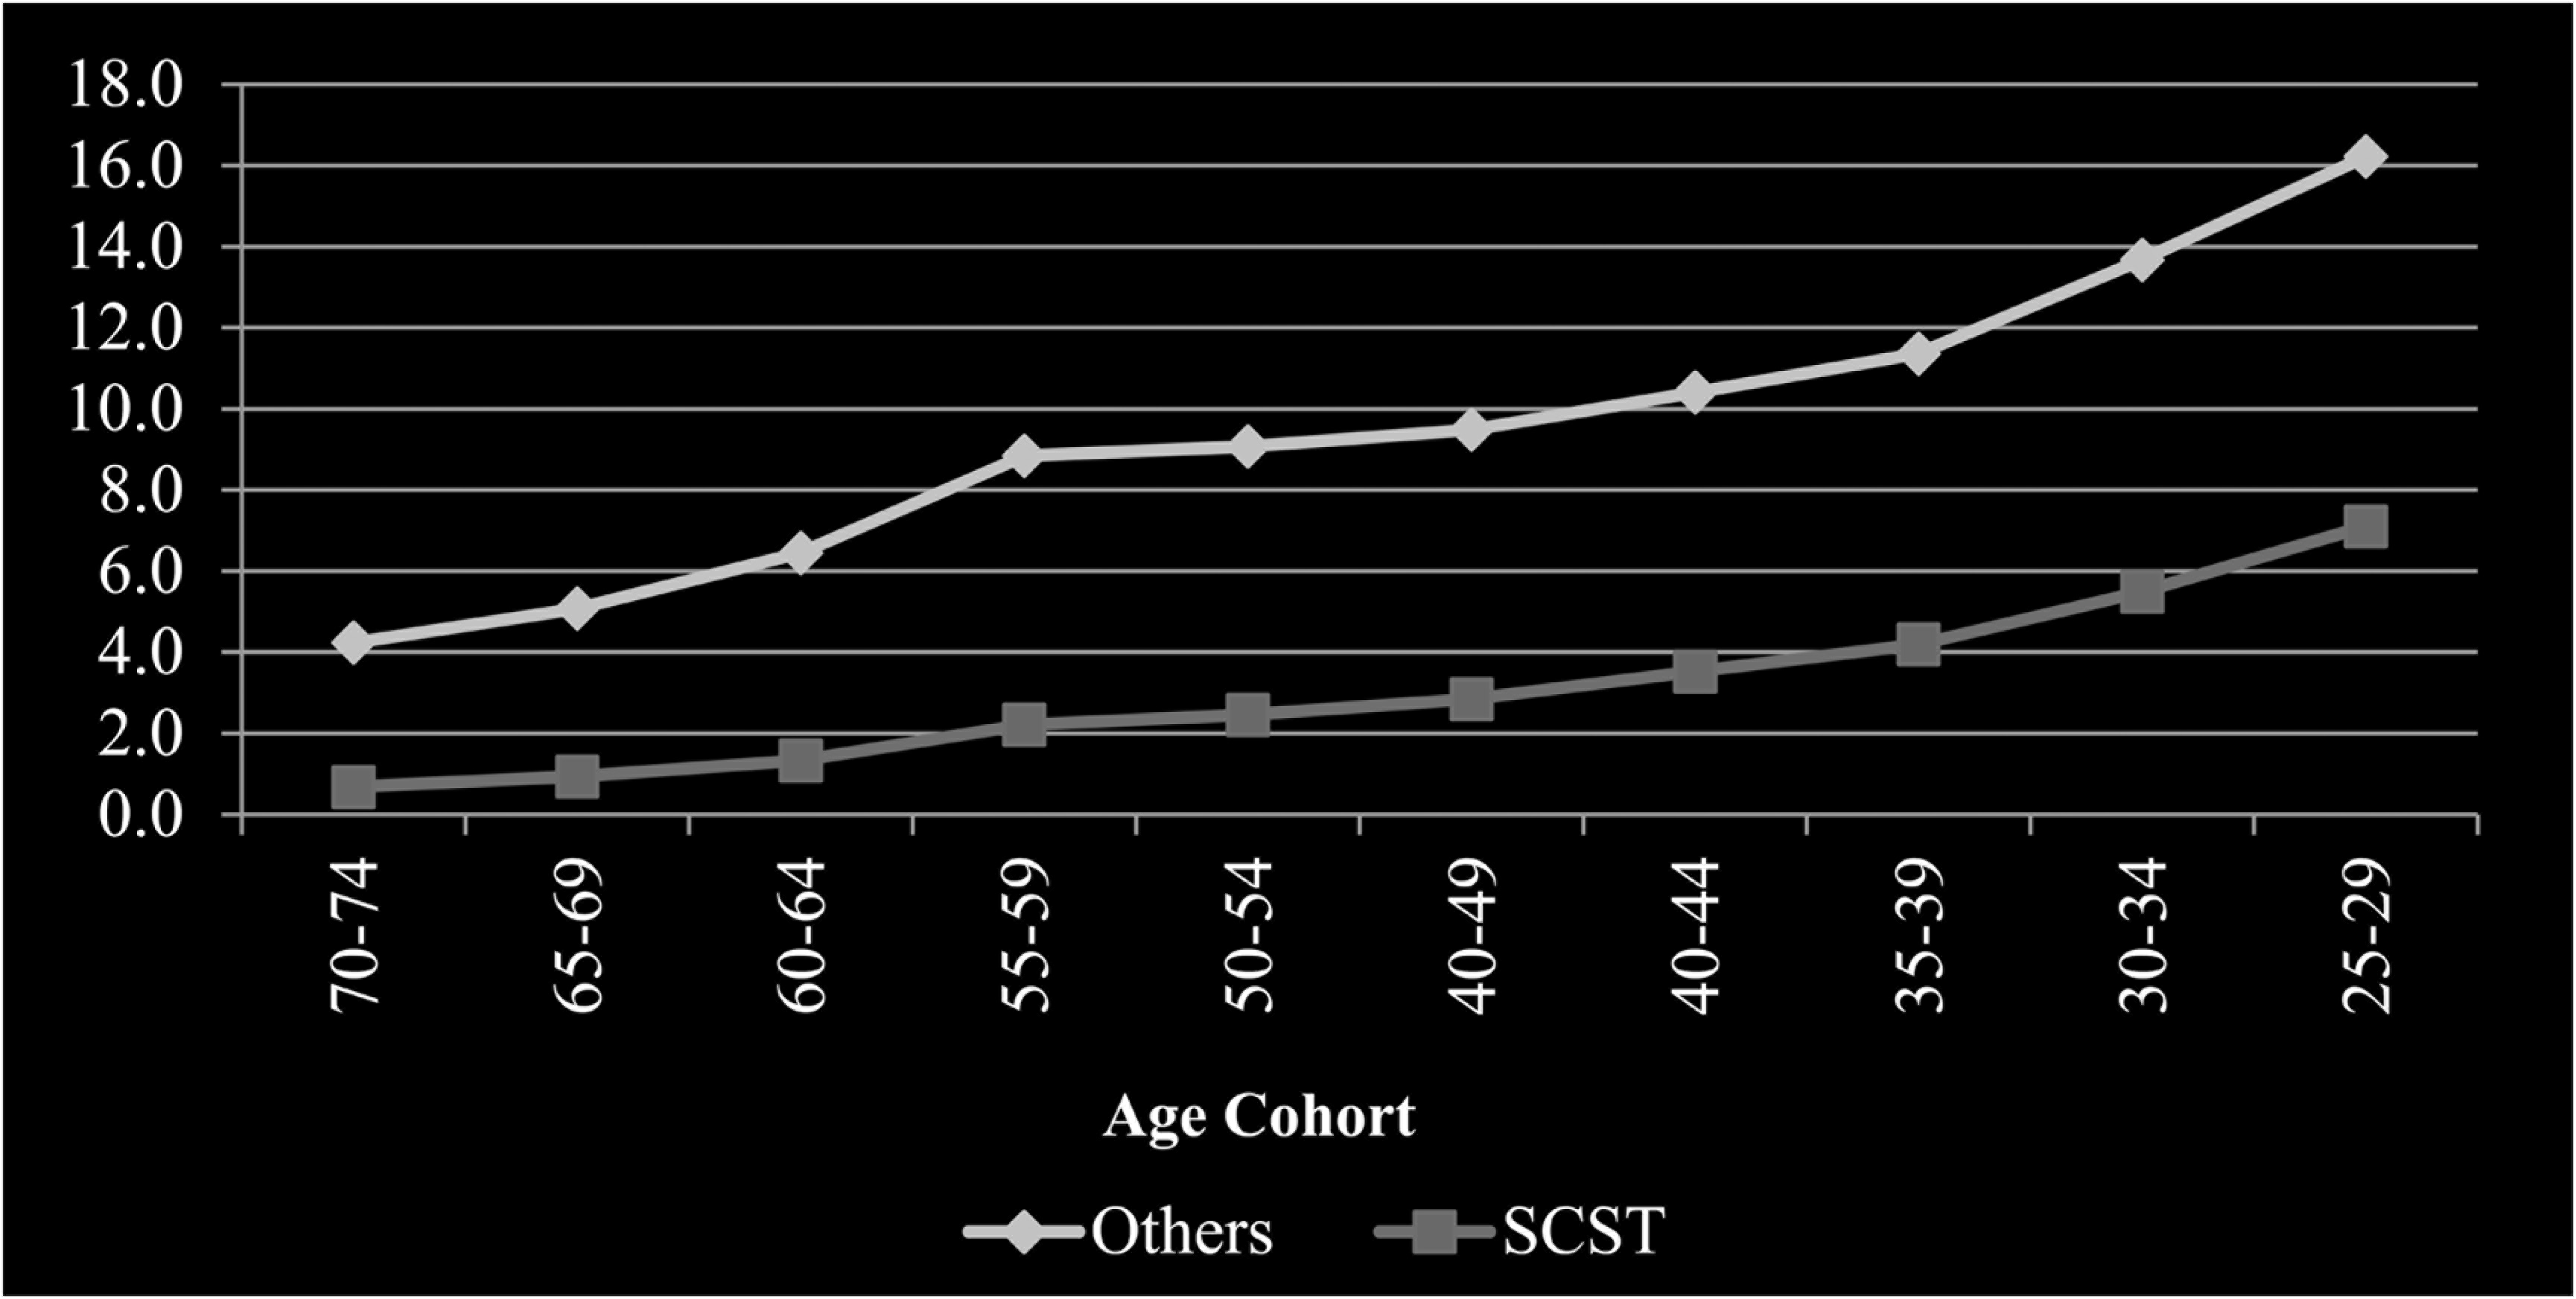
Like gender dichotomy, social group equity in literacy has been almost achieved for the youngest age cohort (10–14). If such a trend continues, there would be no social disparity in literacy when this youngest age cohort becomes the oldest age cohort of the population. However, for other educational indicators, there still exists quite a large gap between both the social groups. In the case of elementary education, a regular decline in the elementary completion rate is observed starting from the age cohort (30–34) onwards. A similar pattern is also observed in case of the secondary completion rate. A slight decline in the gap is observed for the younger age cohorts.
Group disparity is found to be increasing in case of the higher secondary completion rate as the gap between both the groups widens. The percentage point gap between both the groups, which was 12% for the age cohort (35–39), increased to 15% for the age cohort (20–24). Increase in social disparity in education is also observed at the graduation level. The gap between both the social groups, measured in terms of percentage point difference, continuously increases from the oldest to youngest age cohort. It is observed to be the lowest at 3.6 percentage points for the oldest age cohort (70–74) and the highest at 9.1 percentage point for the youngest age cohort (25–29). The graduation completion rate for the youngest age cohort (25–29) was 7% among SC/ST and 16% for ‘Others’.
Rural–Urban Disparity
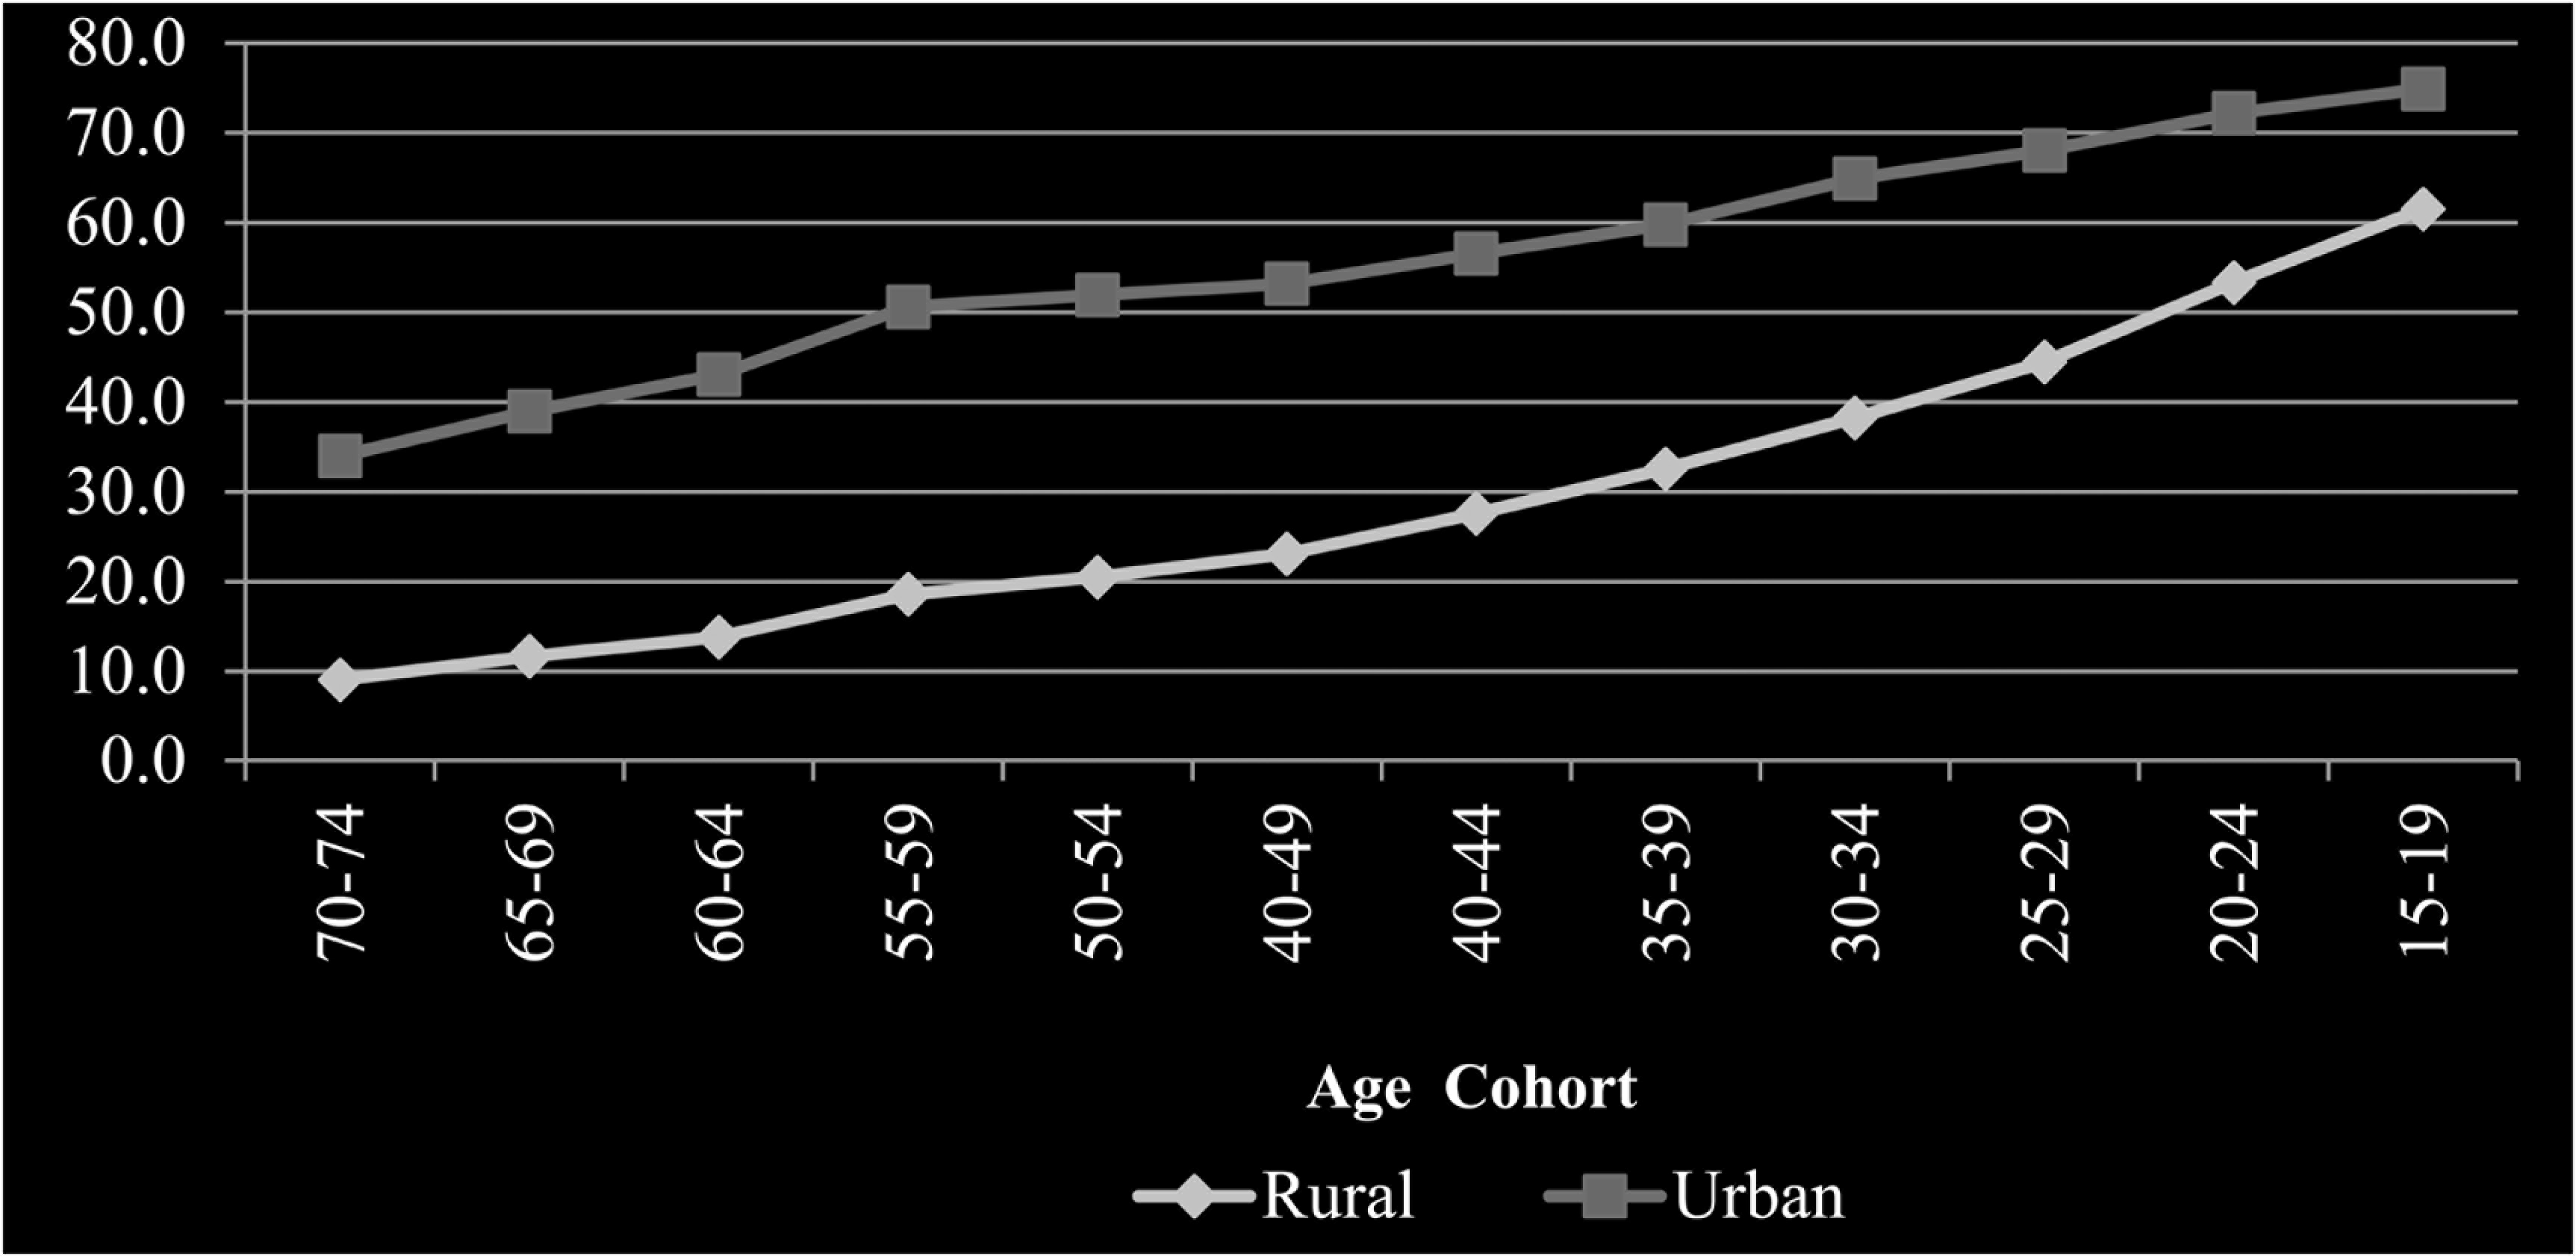
Rural–urban dichotomy is another aspect of group disparity frequently discussed in Indian development literature. Unlike the two earlier dichotomies, it is not that much discussed in case of education except in case of literacy. Therefore, there is hardly any systemic effort at educational expansion targeting the rural population. The urban sector has a higher educational attainment rate than the rural sector (Figures 12–16). In the case of literacy, rural–urban disparity continuously declines over the age cohorts and near equity is achieved for the youngest age cohort (10–14). Decline in rural–urban disparity is observed in case of the elementary completion rate too. However, unlike literacy rate, quite large gaps exist between both the sectors for the youngest age cohort (15–19). The elementary completion rate for the youngest age cohort (15–19) is 61.5% for the rural sector and 75% for the urban sector, which is far short of the universal completion rate.
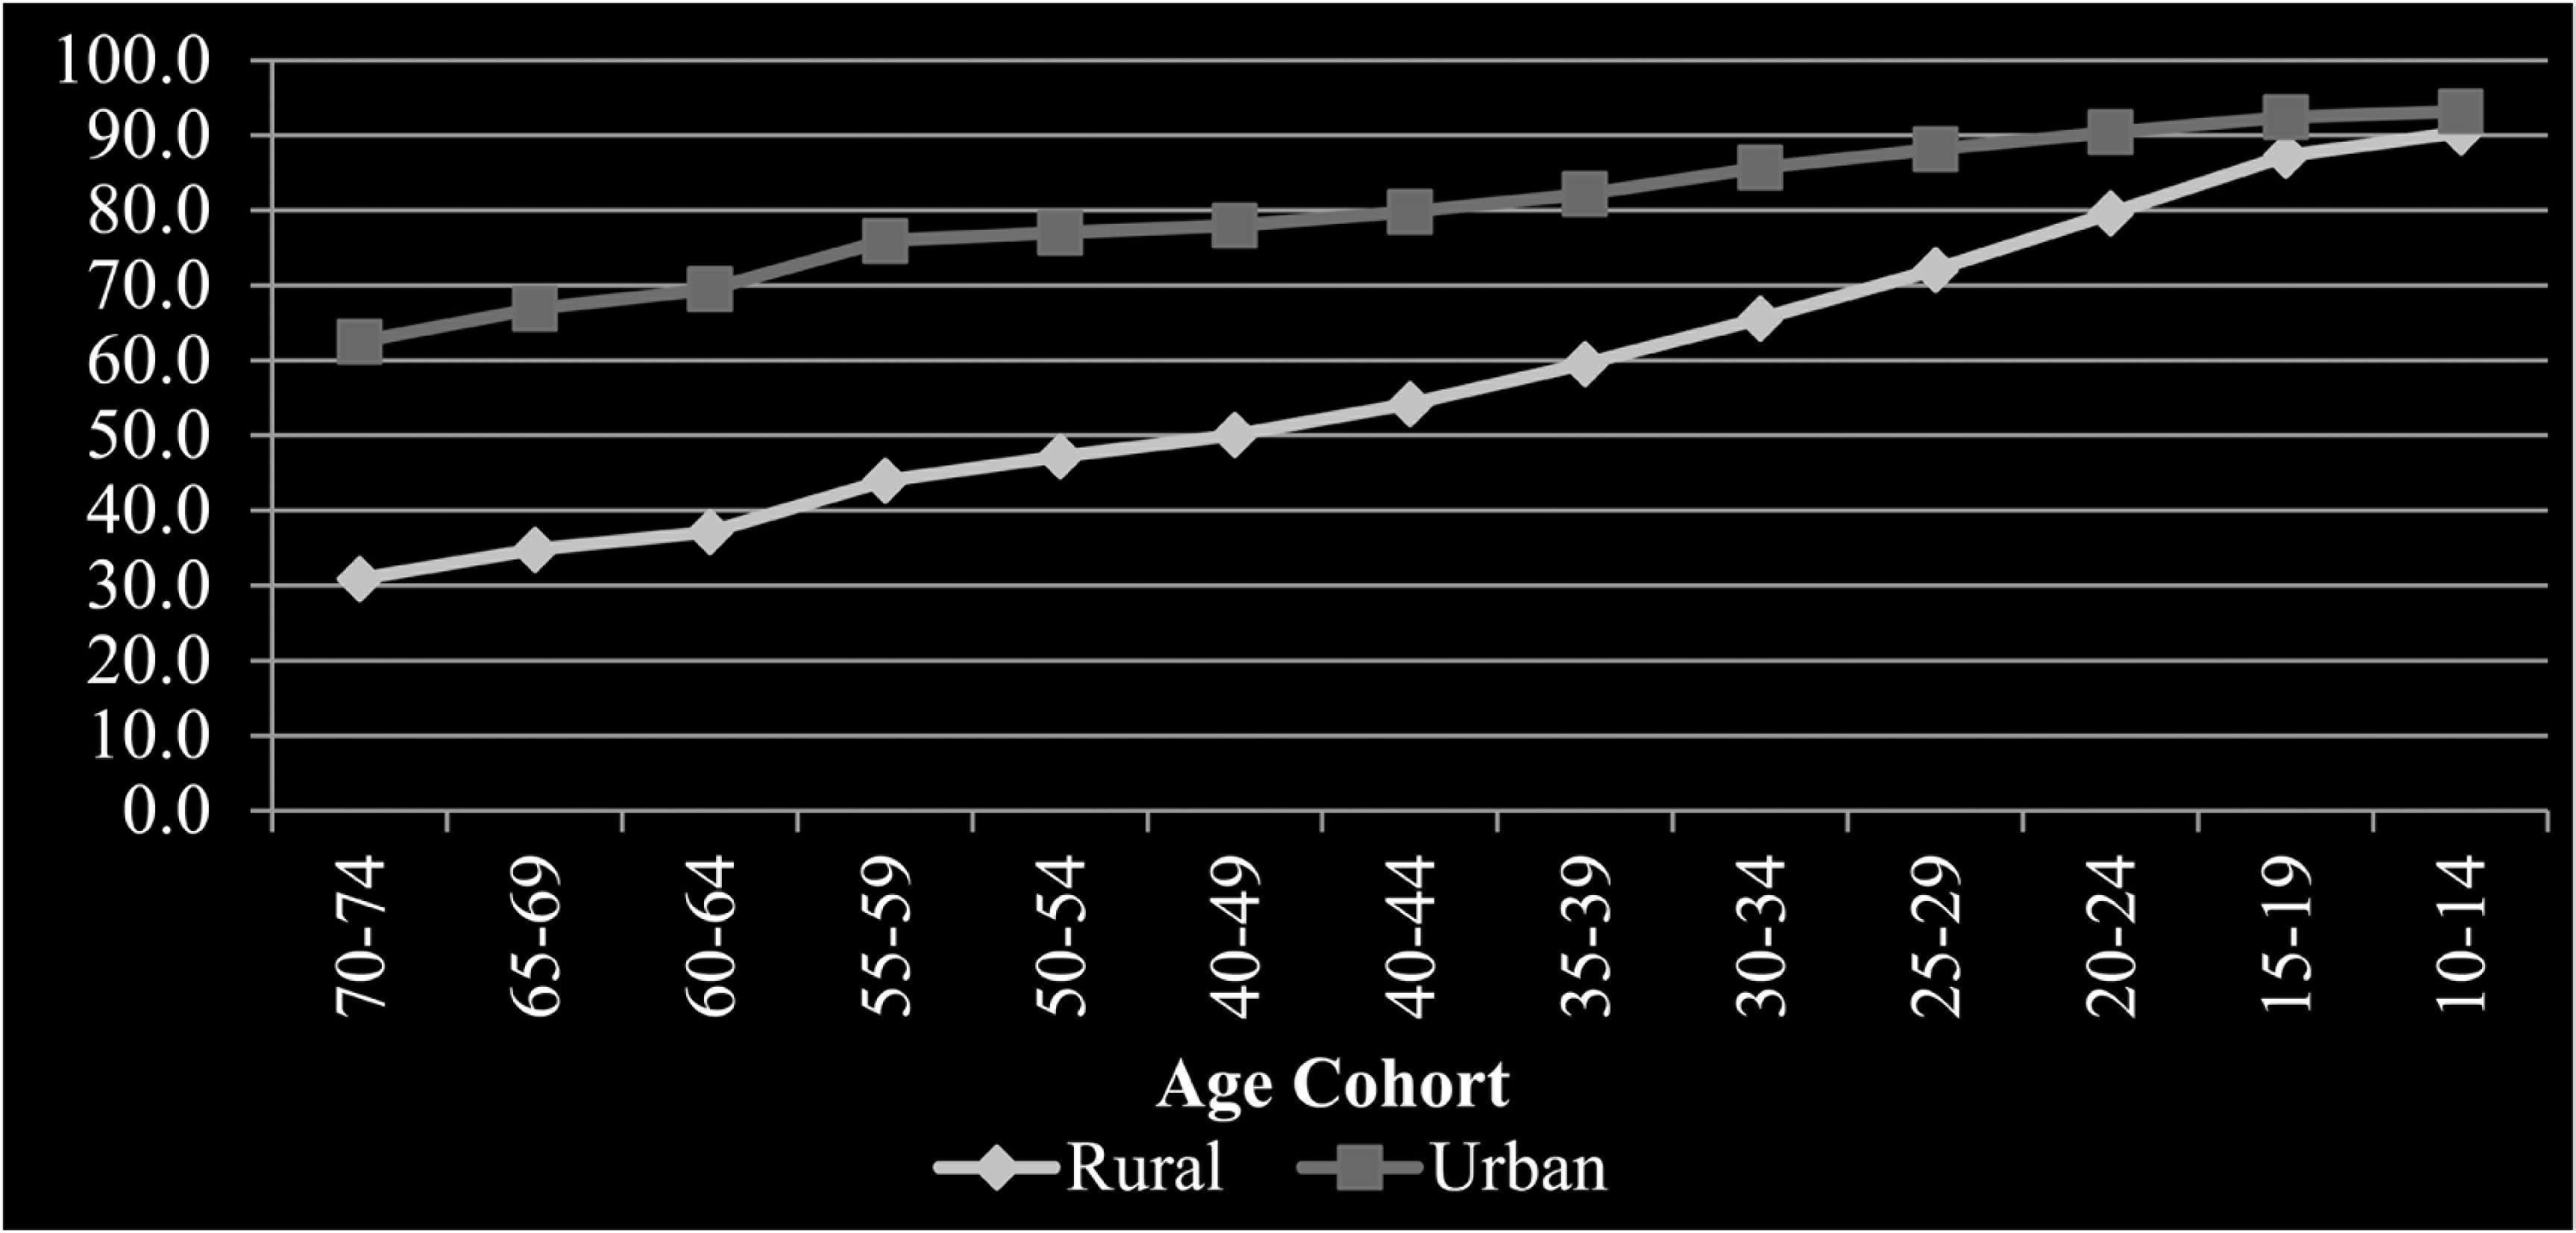
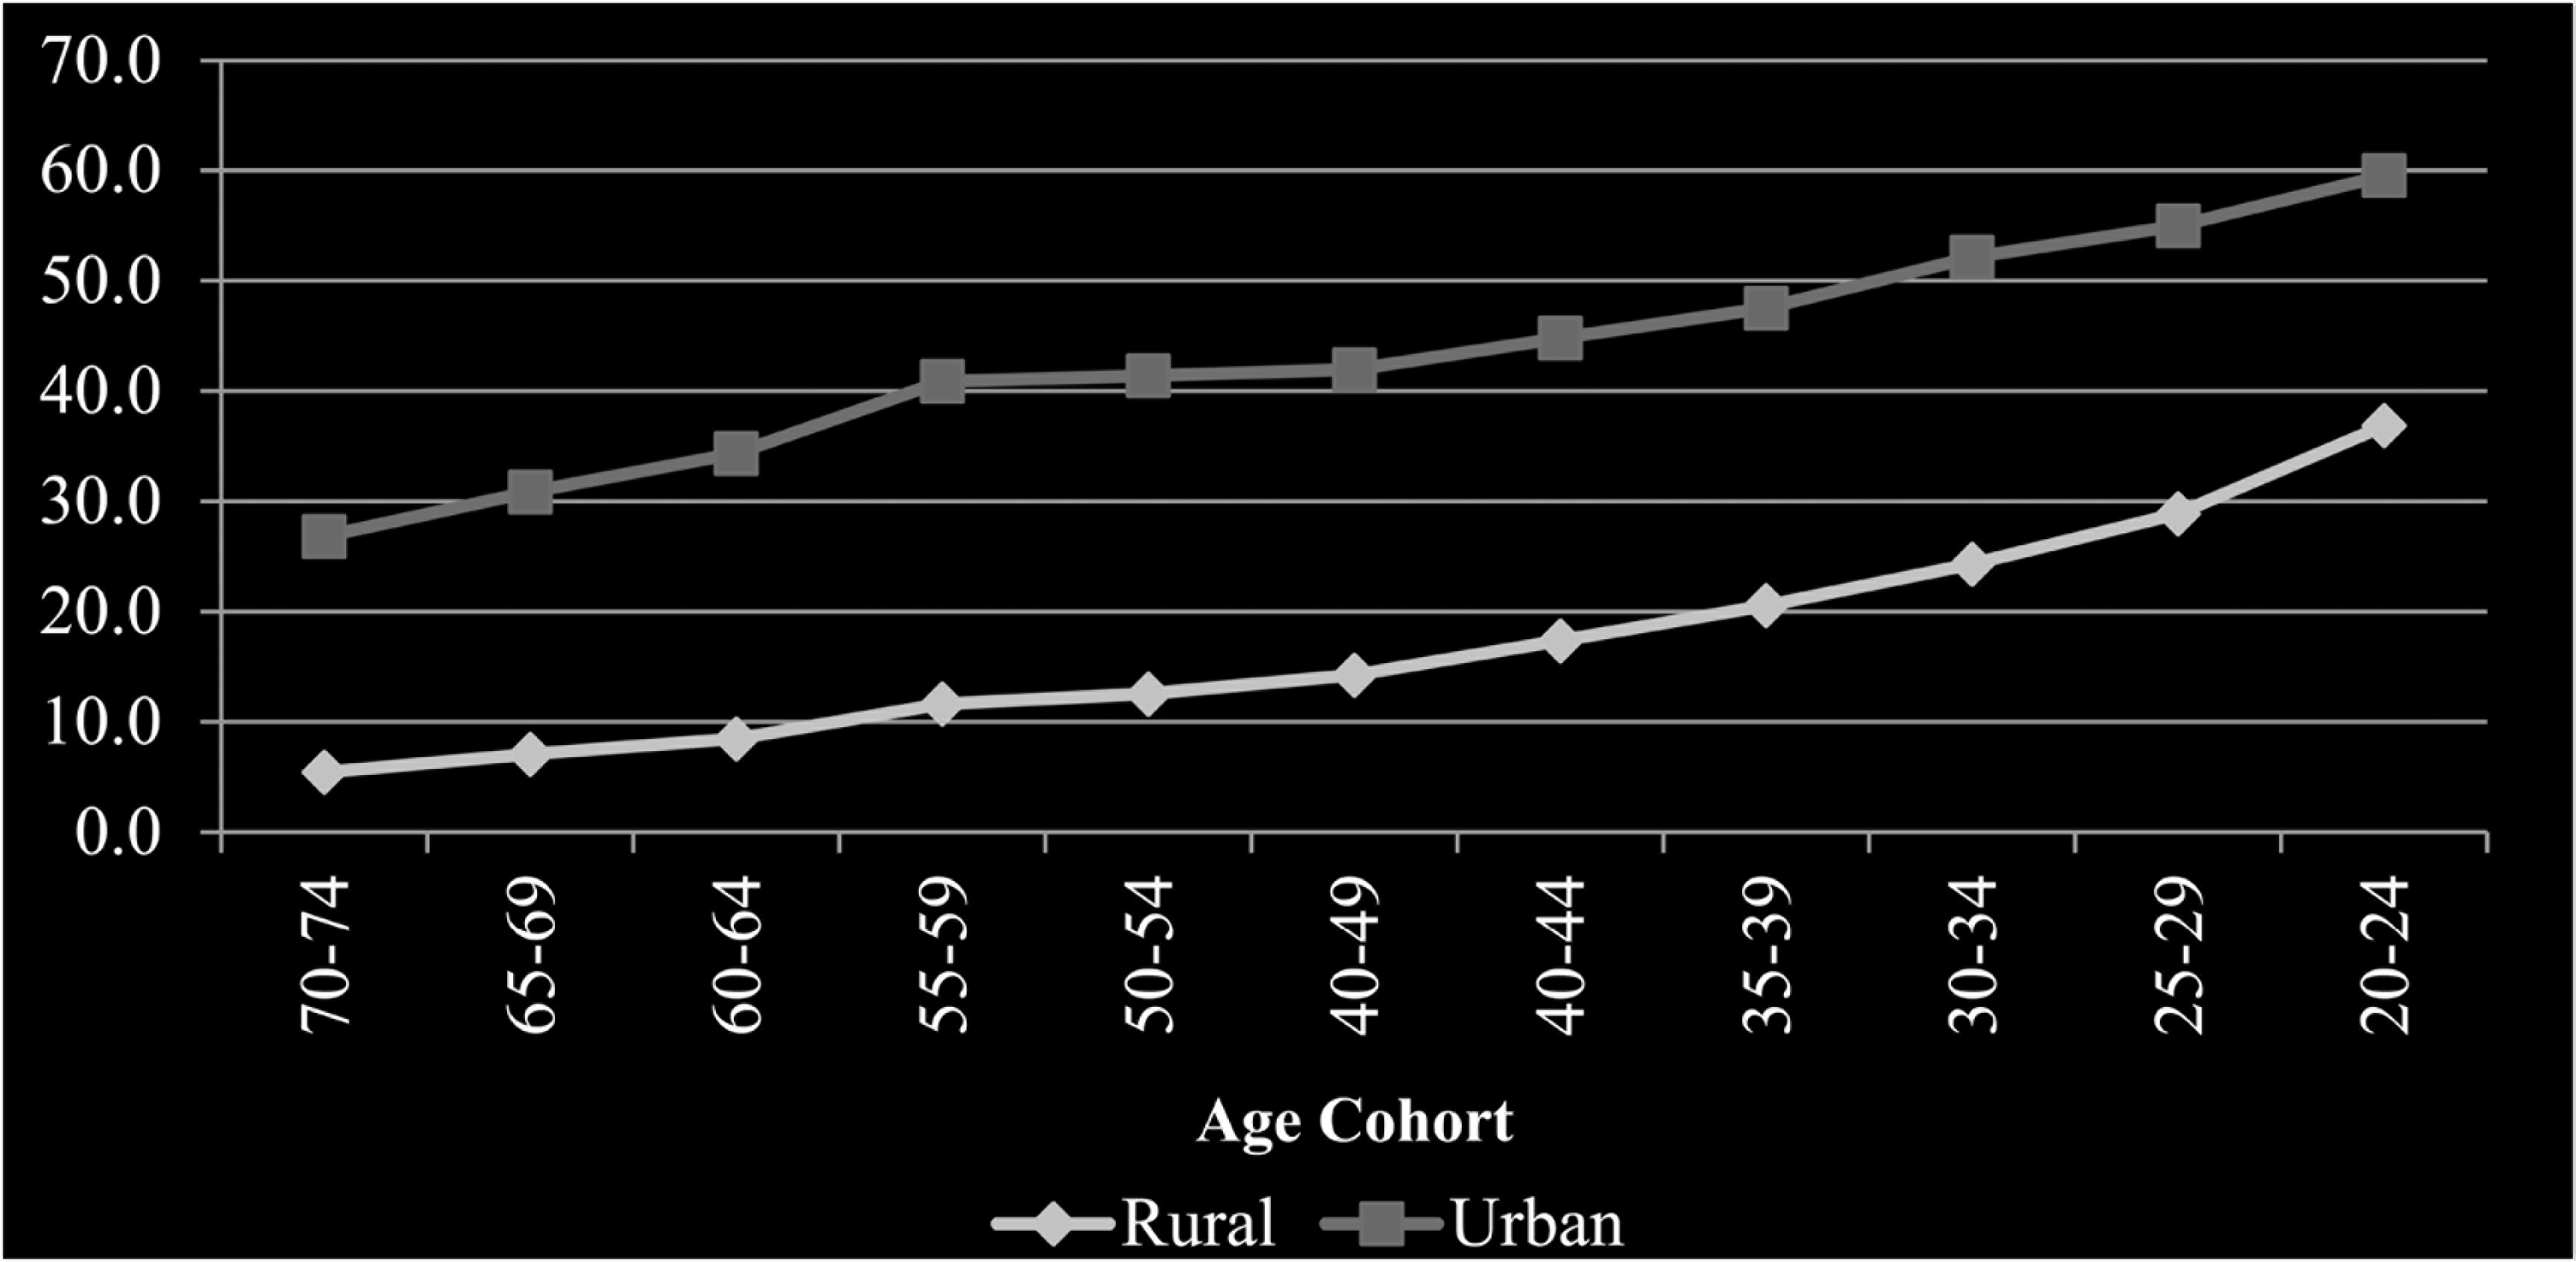

The secondary completion rate has continuously improved for both the sectors from oldest to youngest age cohort. However, disparity between both the sectors, measured in terms of the percentage point gap, declined only recently. It declined for last two youngest age cohorts. A similar trend and pattern is observed in the case of higher secondary education too.
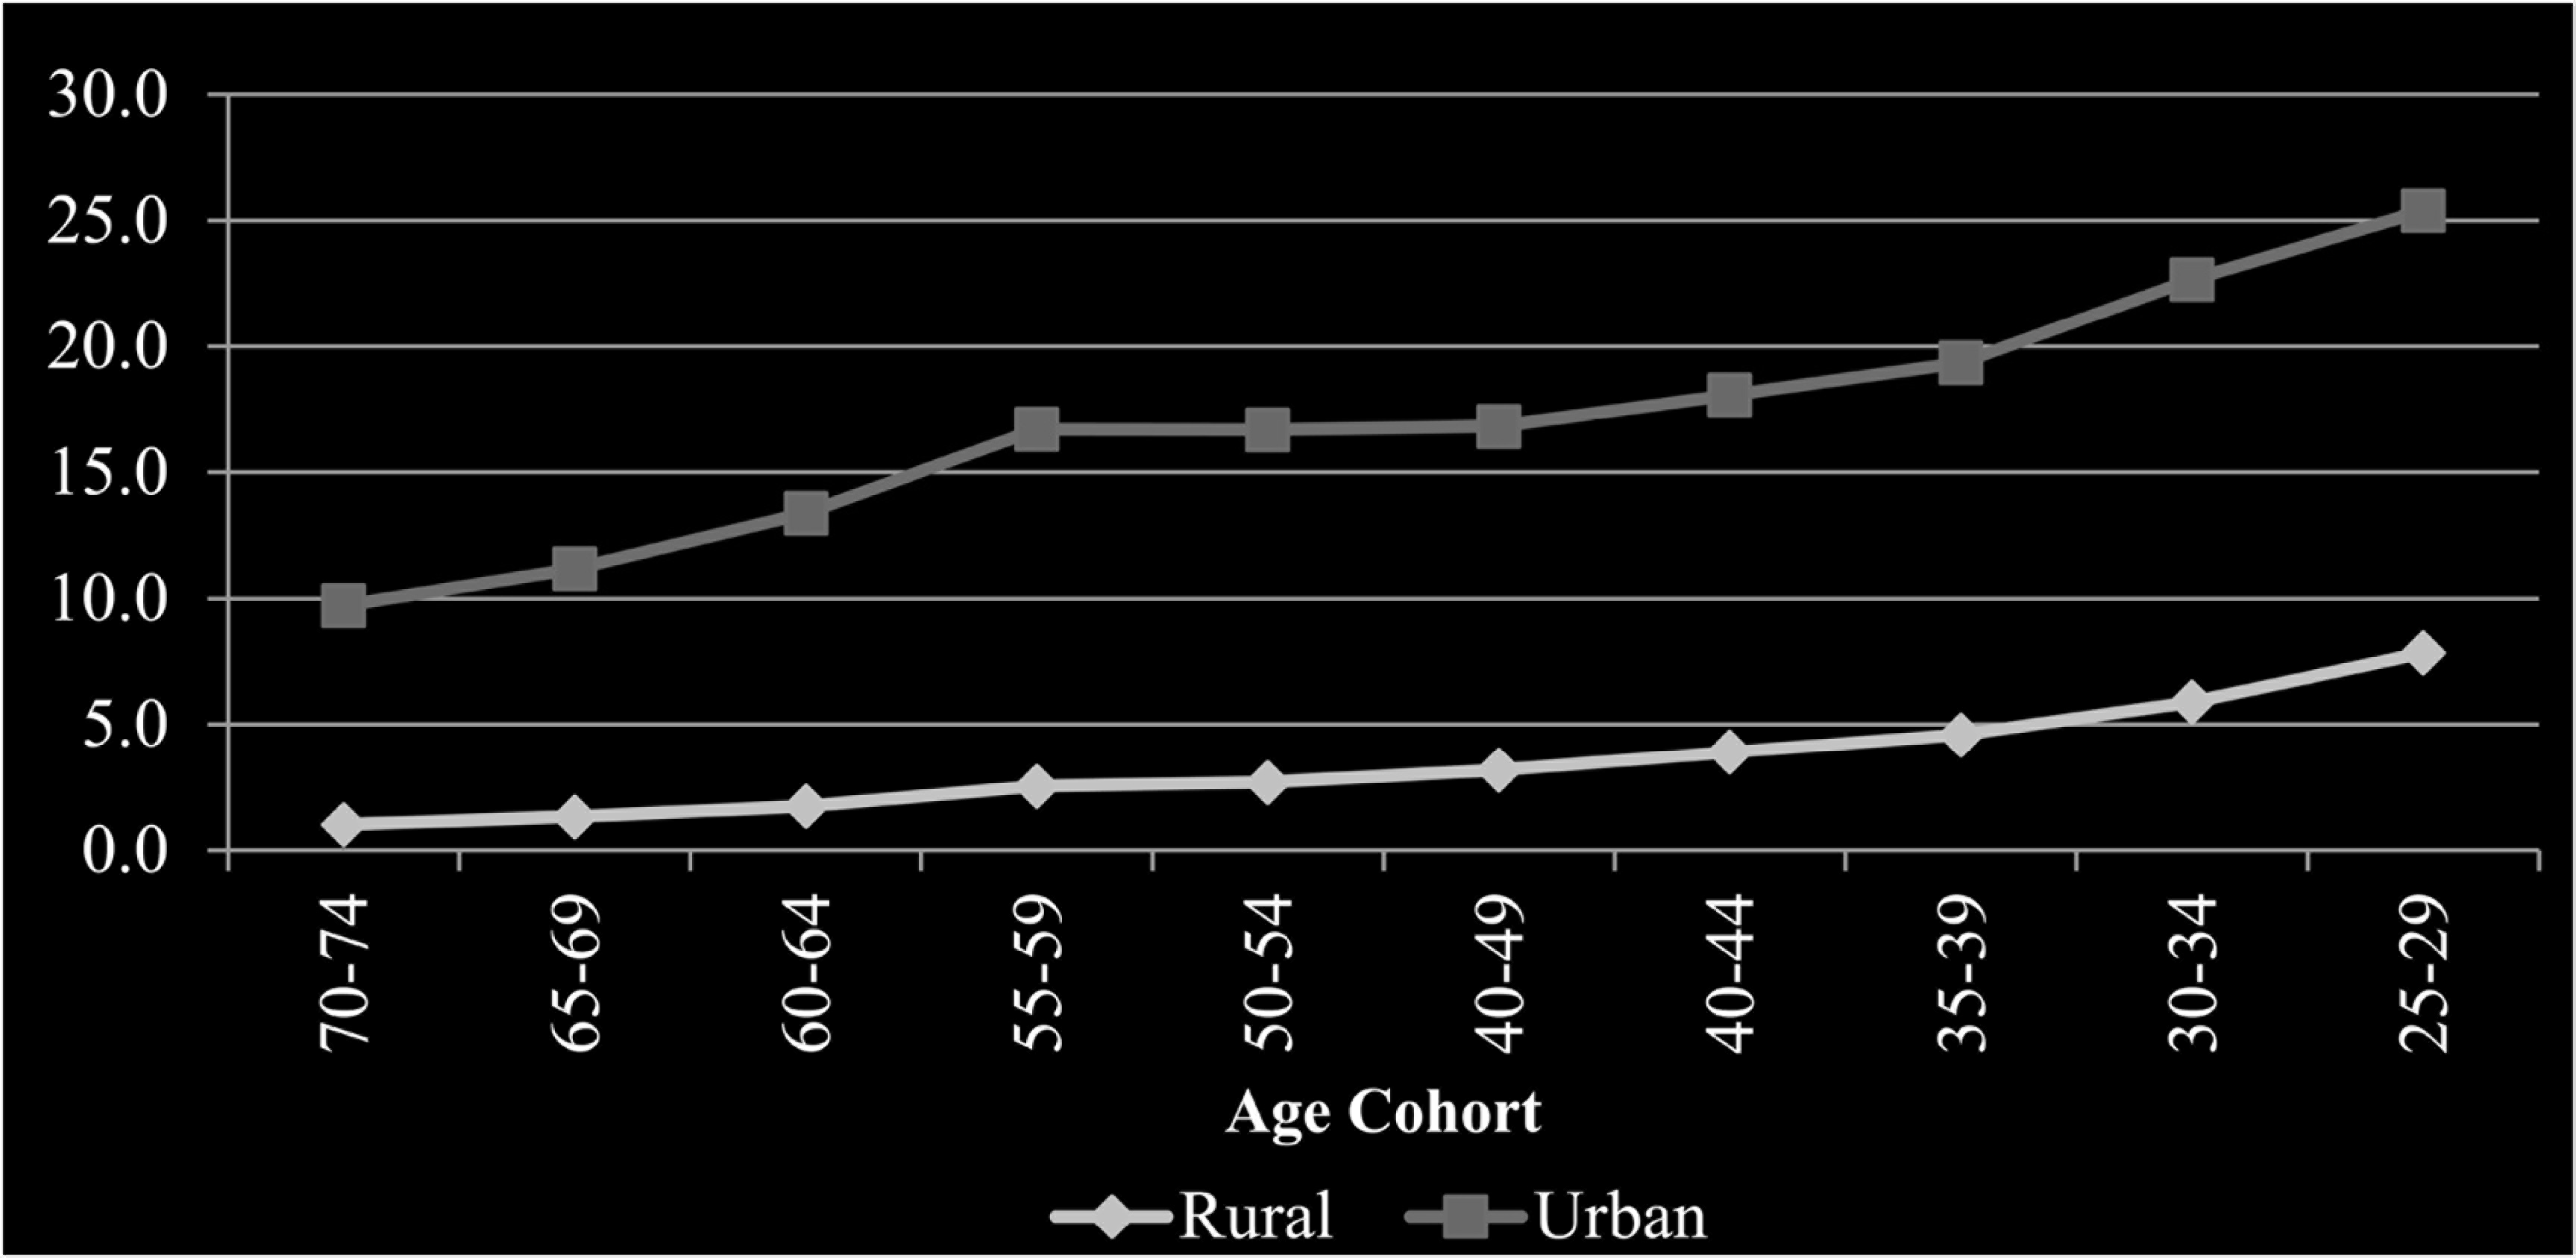
The graduation completion rate for the urban population improved at a much faster rate than for the rural population. Therefore, the percentage point gap in graduation completion rate between both the sectors increased over the age cohorts. Looking at some recent age cohorts, it is found that the percentage point gap increased from 14.7 for the age cohort (35–39) to 17.6 for the age cohort (25–29). In fact, the rural population seems to gain very little from recent expansion in higher education institutions compared to the urban population. For the youngest age cohort (25–29), the graduation completion rate of the rural sector (7.8%) is more than three times lower than that of the urban sector (25.4%).
Consolidated Picture of Group Disparity
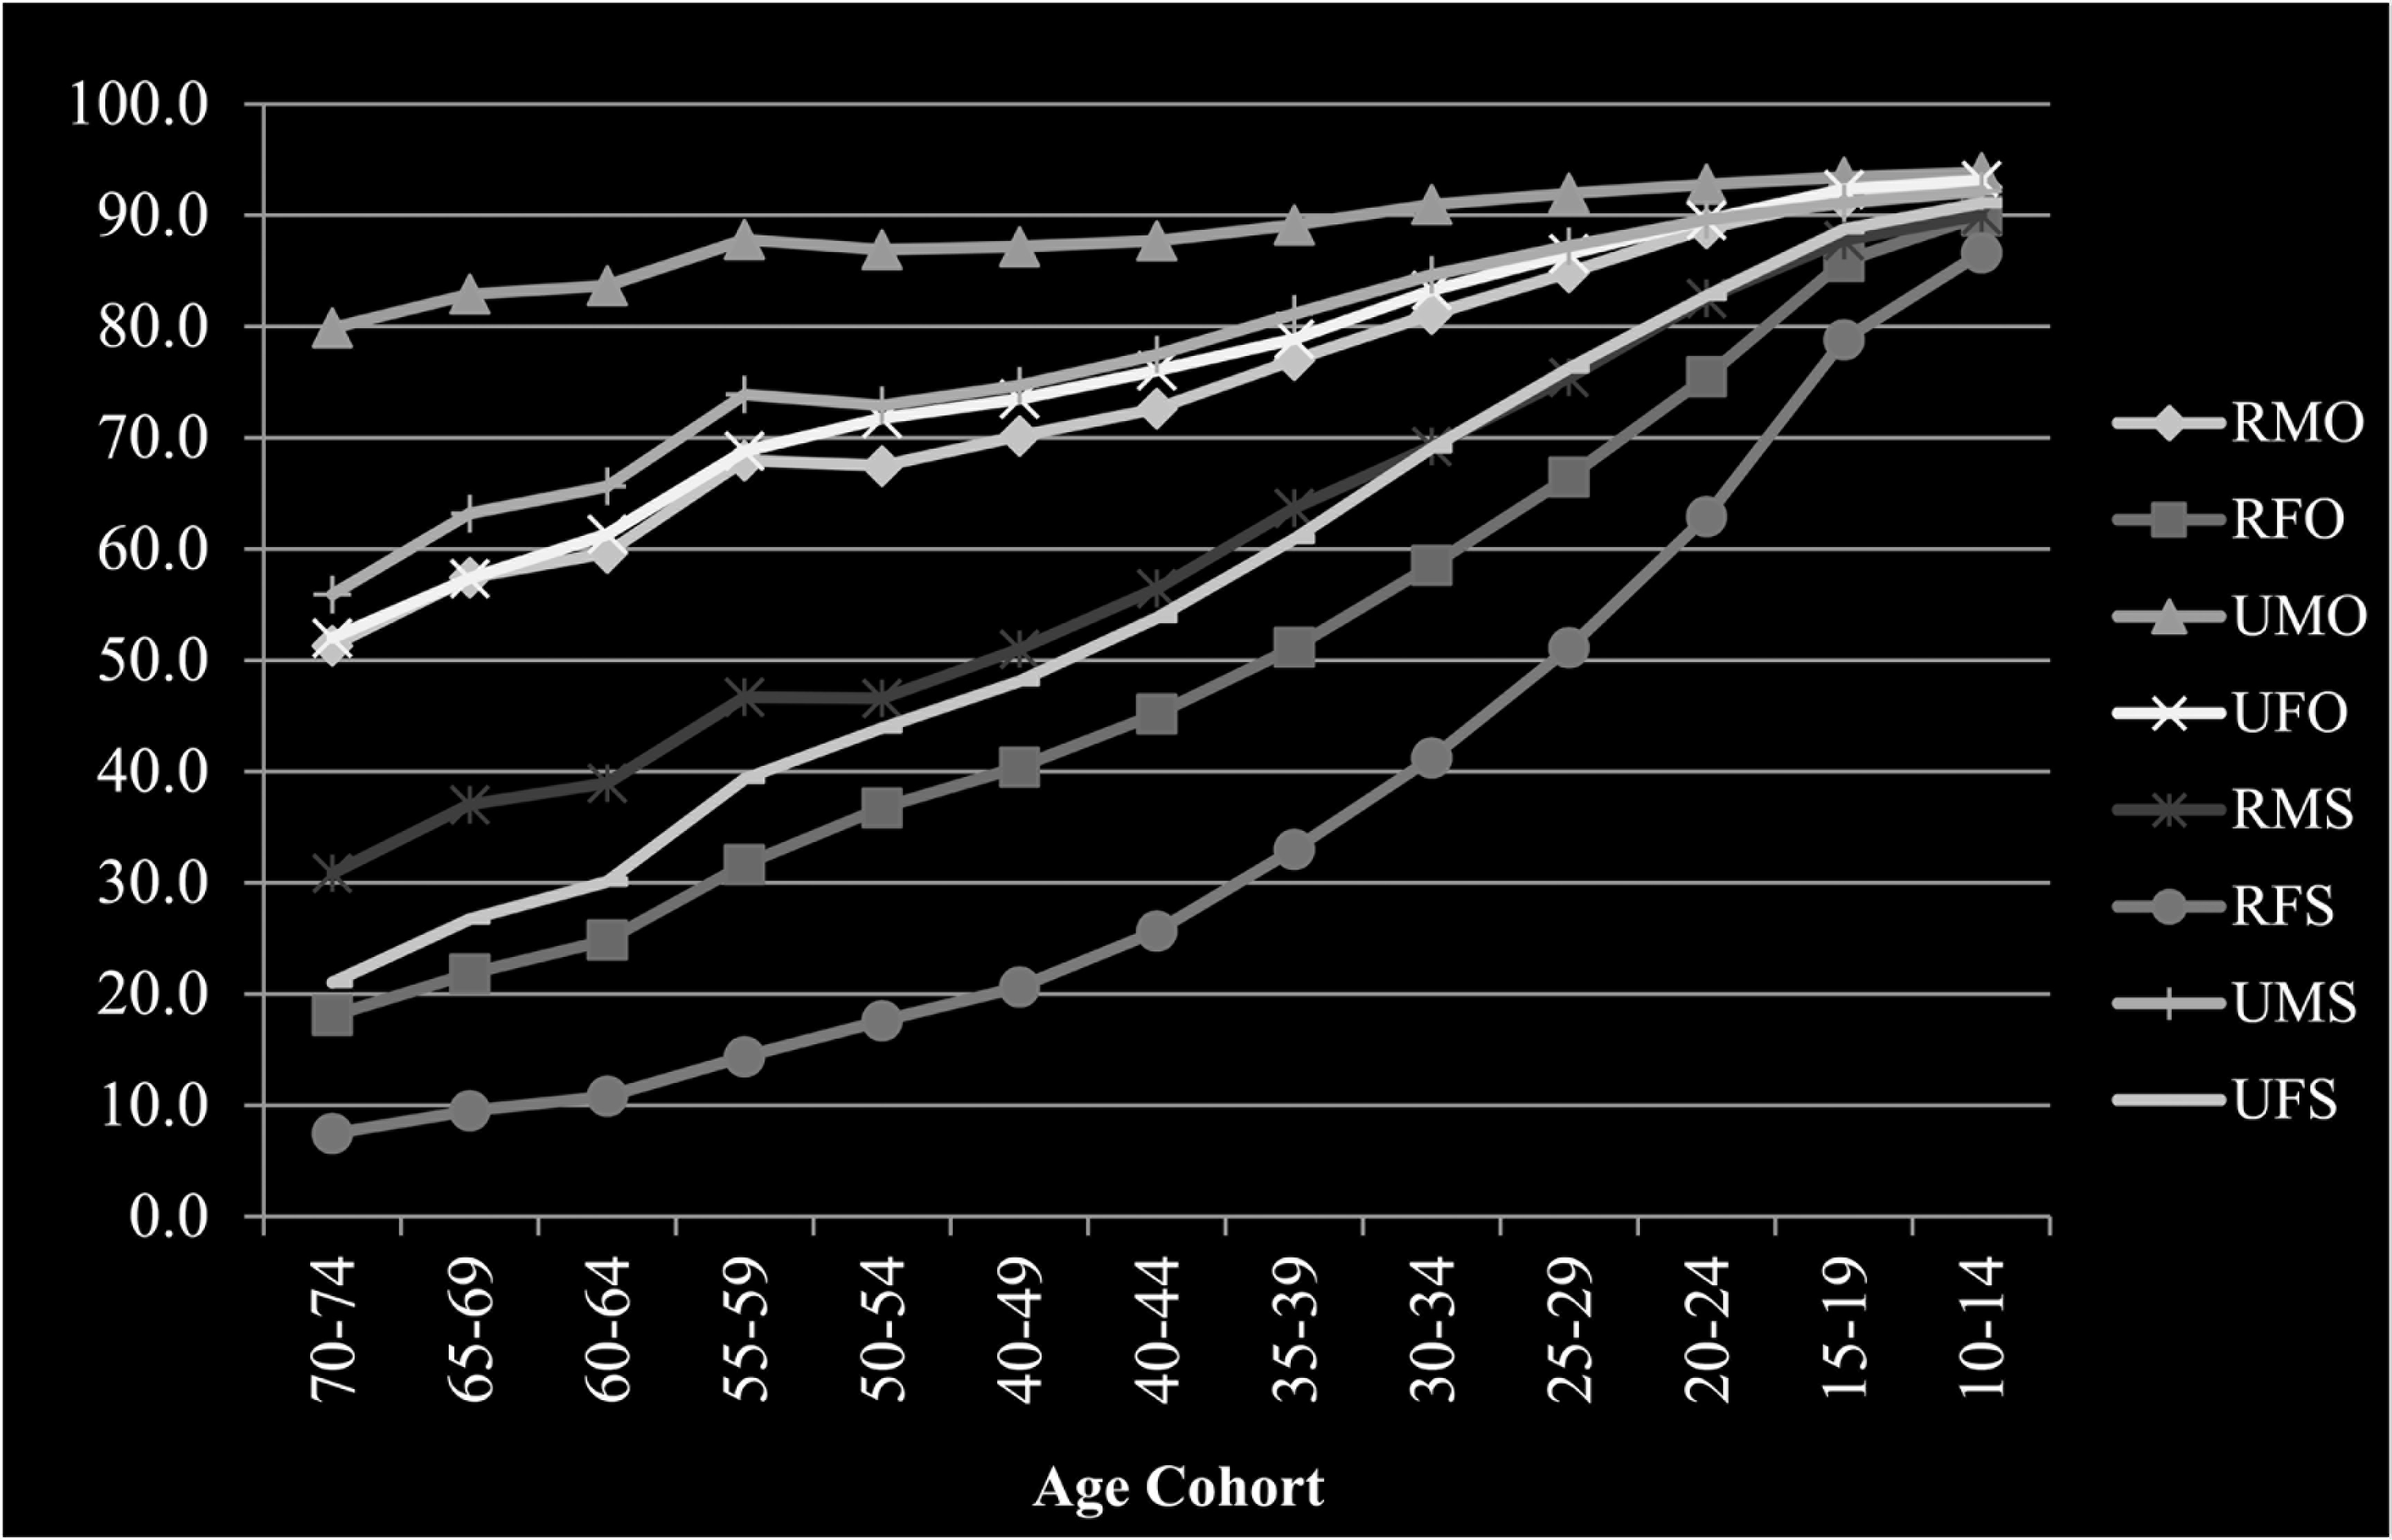
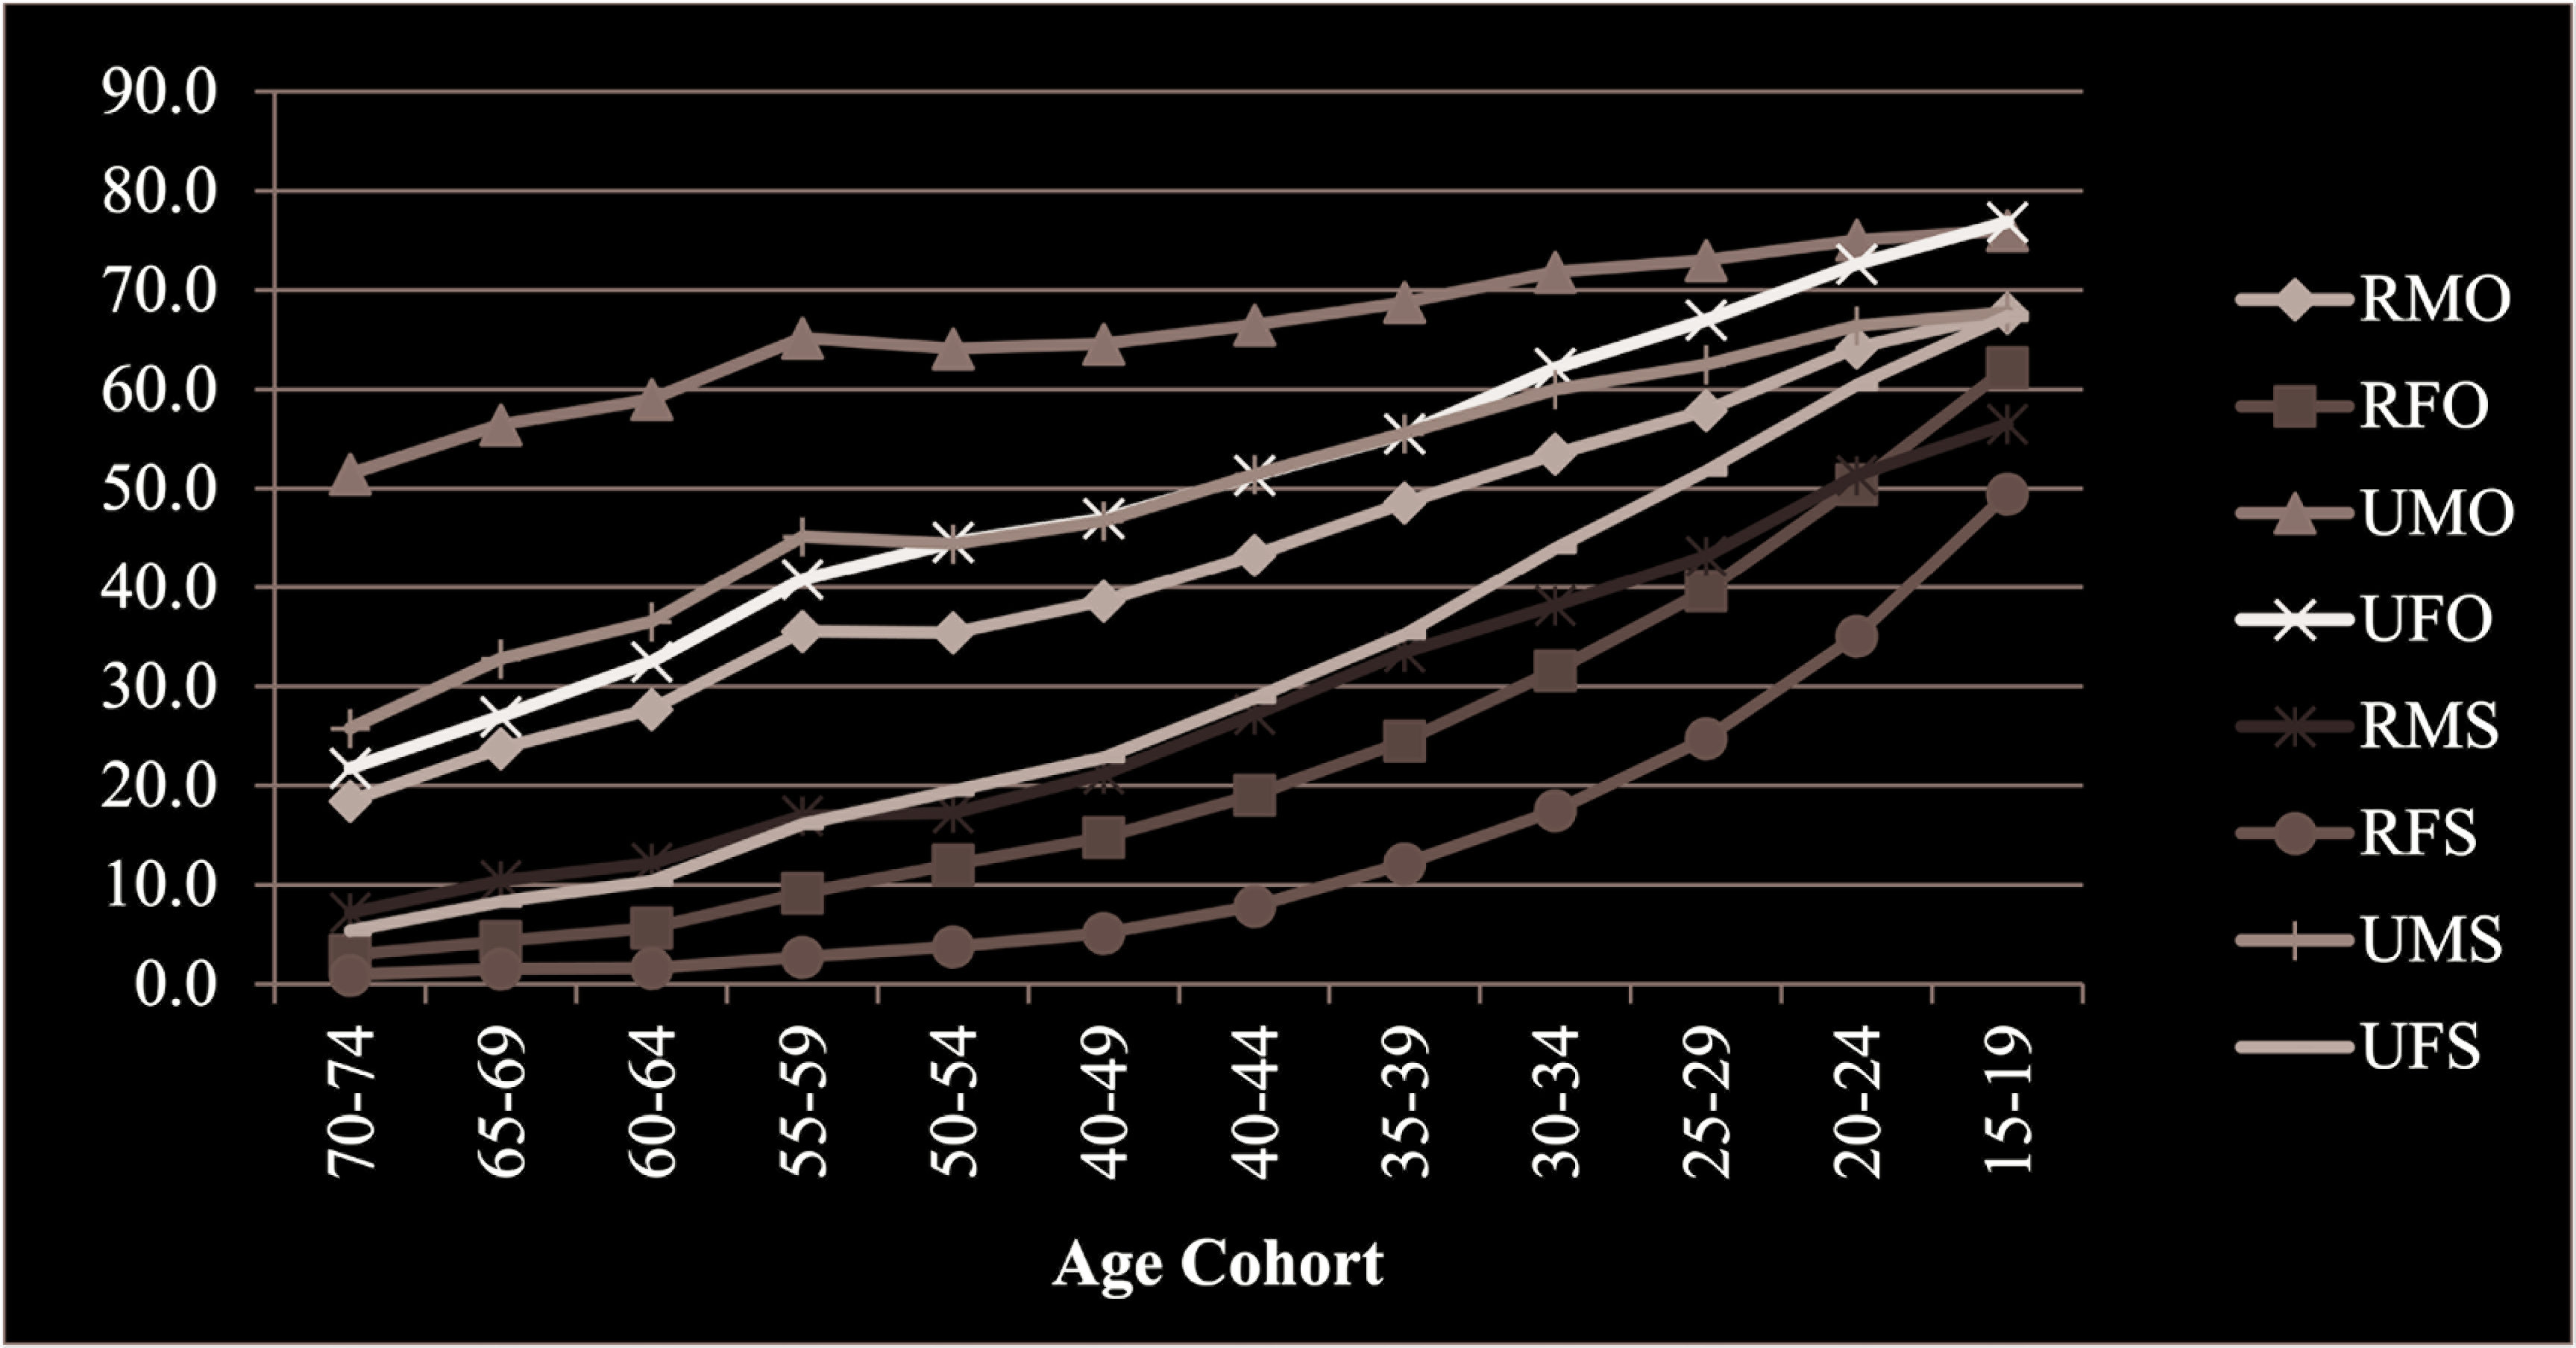
In order to obtain a more comprehensive picture of the inequitable distribution of educational achievement across various subgroups of the population, groups with multiple advantages/disadvantages are created. Given a binary classification of the population by gender (‘male’ and ‘female’) by sector of origin (‘rural’ and ‘urban’) and by social groups (‘SC/ST’ and ‘others’), we reconstructed a set of eight mutually exclusive and completely exhaustive subgroups denoted as: urban, others, male (UOM); urban, others, female (UOF); urban, SCs/STs, male (USM); urban, SCs/STs, female (USF); rural, others, male (ROM); rural, others, female (ROF); rural, SCs/STs, male (RSM); and rural, SCs/ STs, female (RSF).
Figure 17 presents the literacy rate in India over the age cohorts for eight mutually exclusive subgroups of the population. With respect to literacy rate, all the eight subgroups of the population are found to be converging if one moves towards the youngest age cohort. This indicates that group disparity in literacy disappears for newer age cohorts. Such disparity is typically demonstrated with age, that is, older age cohorts are more disparate compared to the younger ones. If the group equity persists with subsequently newer age cohorts, overall group equity in literacy would be achieved when the first age cohort with group equity becomes the oldest one. If formal schooling is the only medium of improving literacy without any initiative for adult literacy, it would take a long time to achieve group equity in literacy.
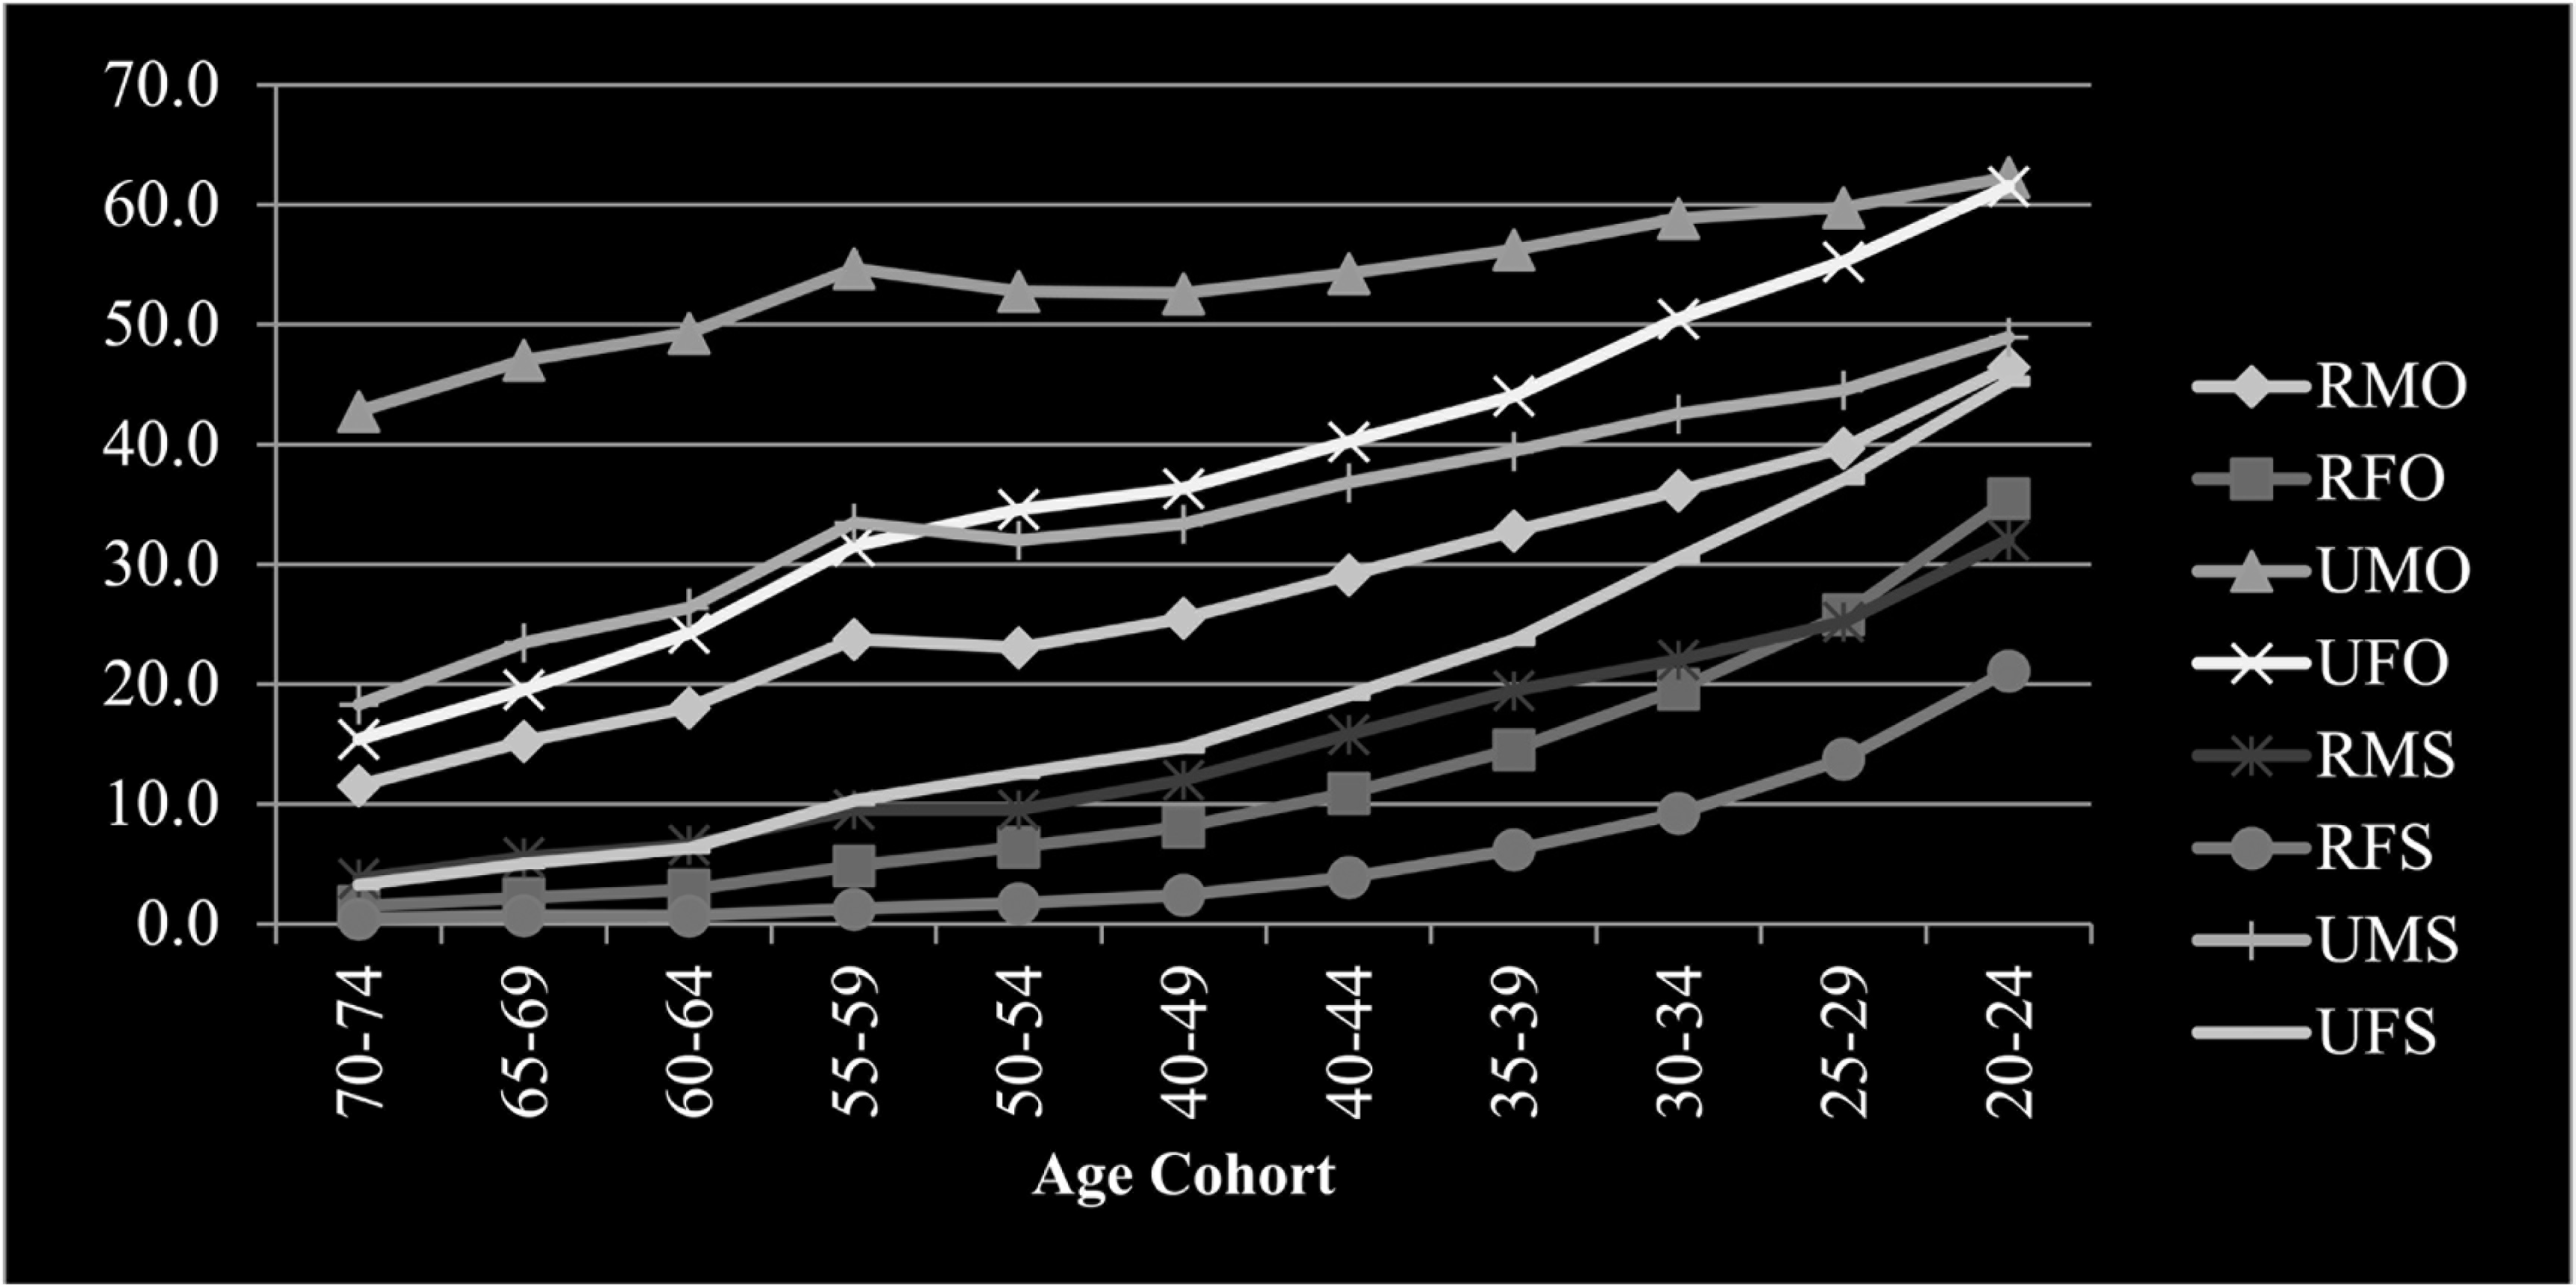
The advantage of using eight disjoint subgroups rather than a dichotomous classification to analyse educational progress can provide more detailed information about group disparity in educational outcomes. Taking the case of the literacy rate, there seems no group disparity in the dichotomous classification—be it gender, social group or rural–urban. However, there is a gap of 5.6 percentage points between the best-off (UMO) and worst-off (RFS) subgroup of the population for the youngest age cohort. Similarly, in case of the elementary completion rate, it is observed that disparity does not exist among all the subgroups of the youngest age cohort (Figure 18). Group disparity is totally absent between the first two best-off subgroups (UMO & UFO) of the population. In other words, there is no gender disparity among ‘urban other’. Similarly, no disparity is observed in the elementary completion rate for the youngest age cohort between the UMS and UFS. This denotes that there is no gender disparity among the urban SC/ST in the elementary completion rate. However, there is a fairly large gap between both the social groups in urban sector. The rural–urban disparity is clearly observed in the elementary completion rate. Out of four rural population subgroups, three are in disadvantaged position relative to any urban subgroup. The best-off rural subgroup, RMO, placed itself with the ‘worst-off’ subgroup in the urban population (UMS & UFS). In the rural population, there is a clear dominance of ‘others’ over the SC/ST as both the ‘rural others’ subgroups registered a higher elementary completion rate as in the case of both the rural SC/ST subgroups. It also needs to be mentioned here that, for a long time, RMS were well ahead of RFO, though recently, the latter dominates over the former. Overall trends in the rural sector indicate that both the social groups are moving towards gender equality separately.
Gender equity among urban others, UMO and UFO for the youngest age cohort is observed for all the levels of educational attainment (Figures 17–21). Educational attainment rate of the ‘urban others’ group is much higher than the remaining subgroups of the population. The educational attainment gap between ‘urban others’ and remaining subgroups of the population is higher for higher levels of education. Although, gender equality among ‘urban SC/ST’ has not been achieved, gender convergence is observed for this group. It seems that gender equity will soon be achieved among them as well. Overall, it can be expected that gender equity at all the educational levels would be achieved soon.
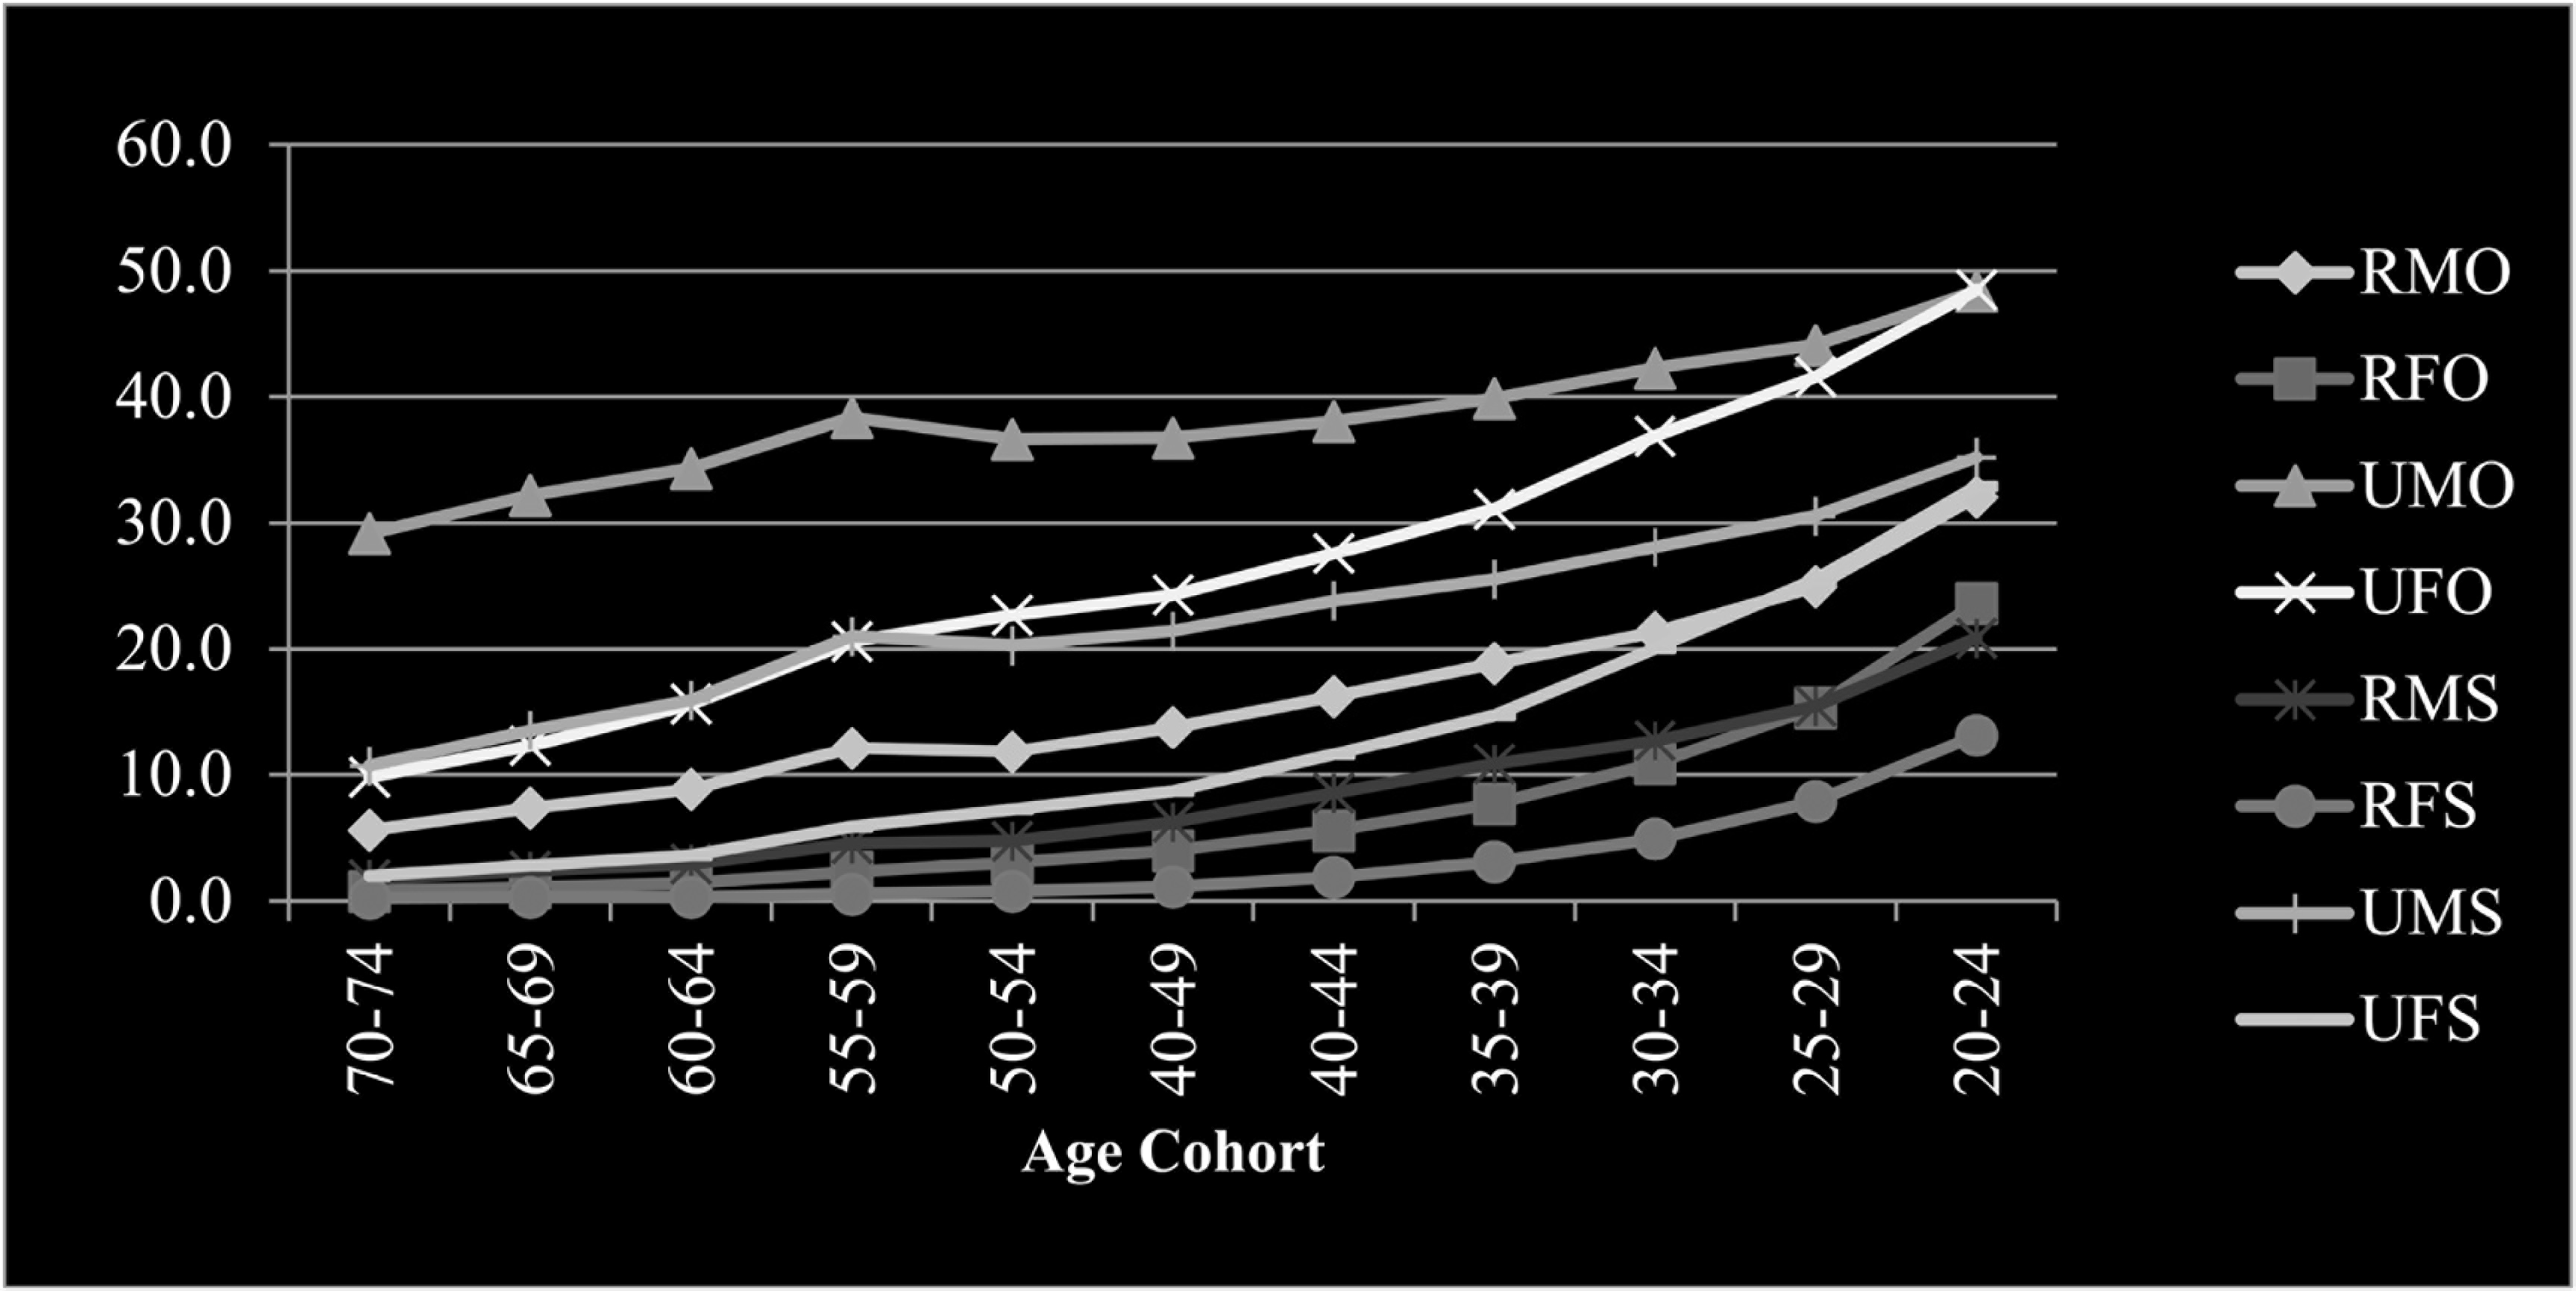
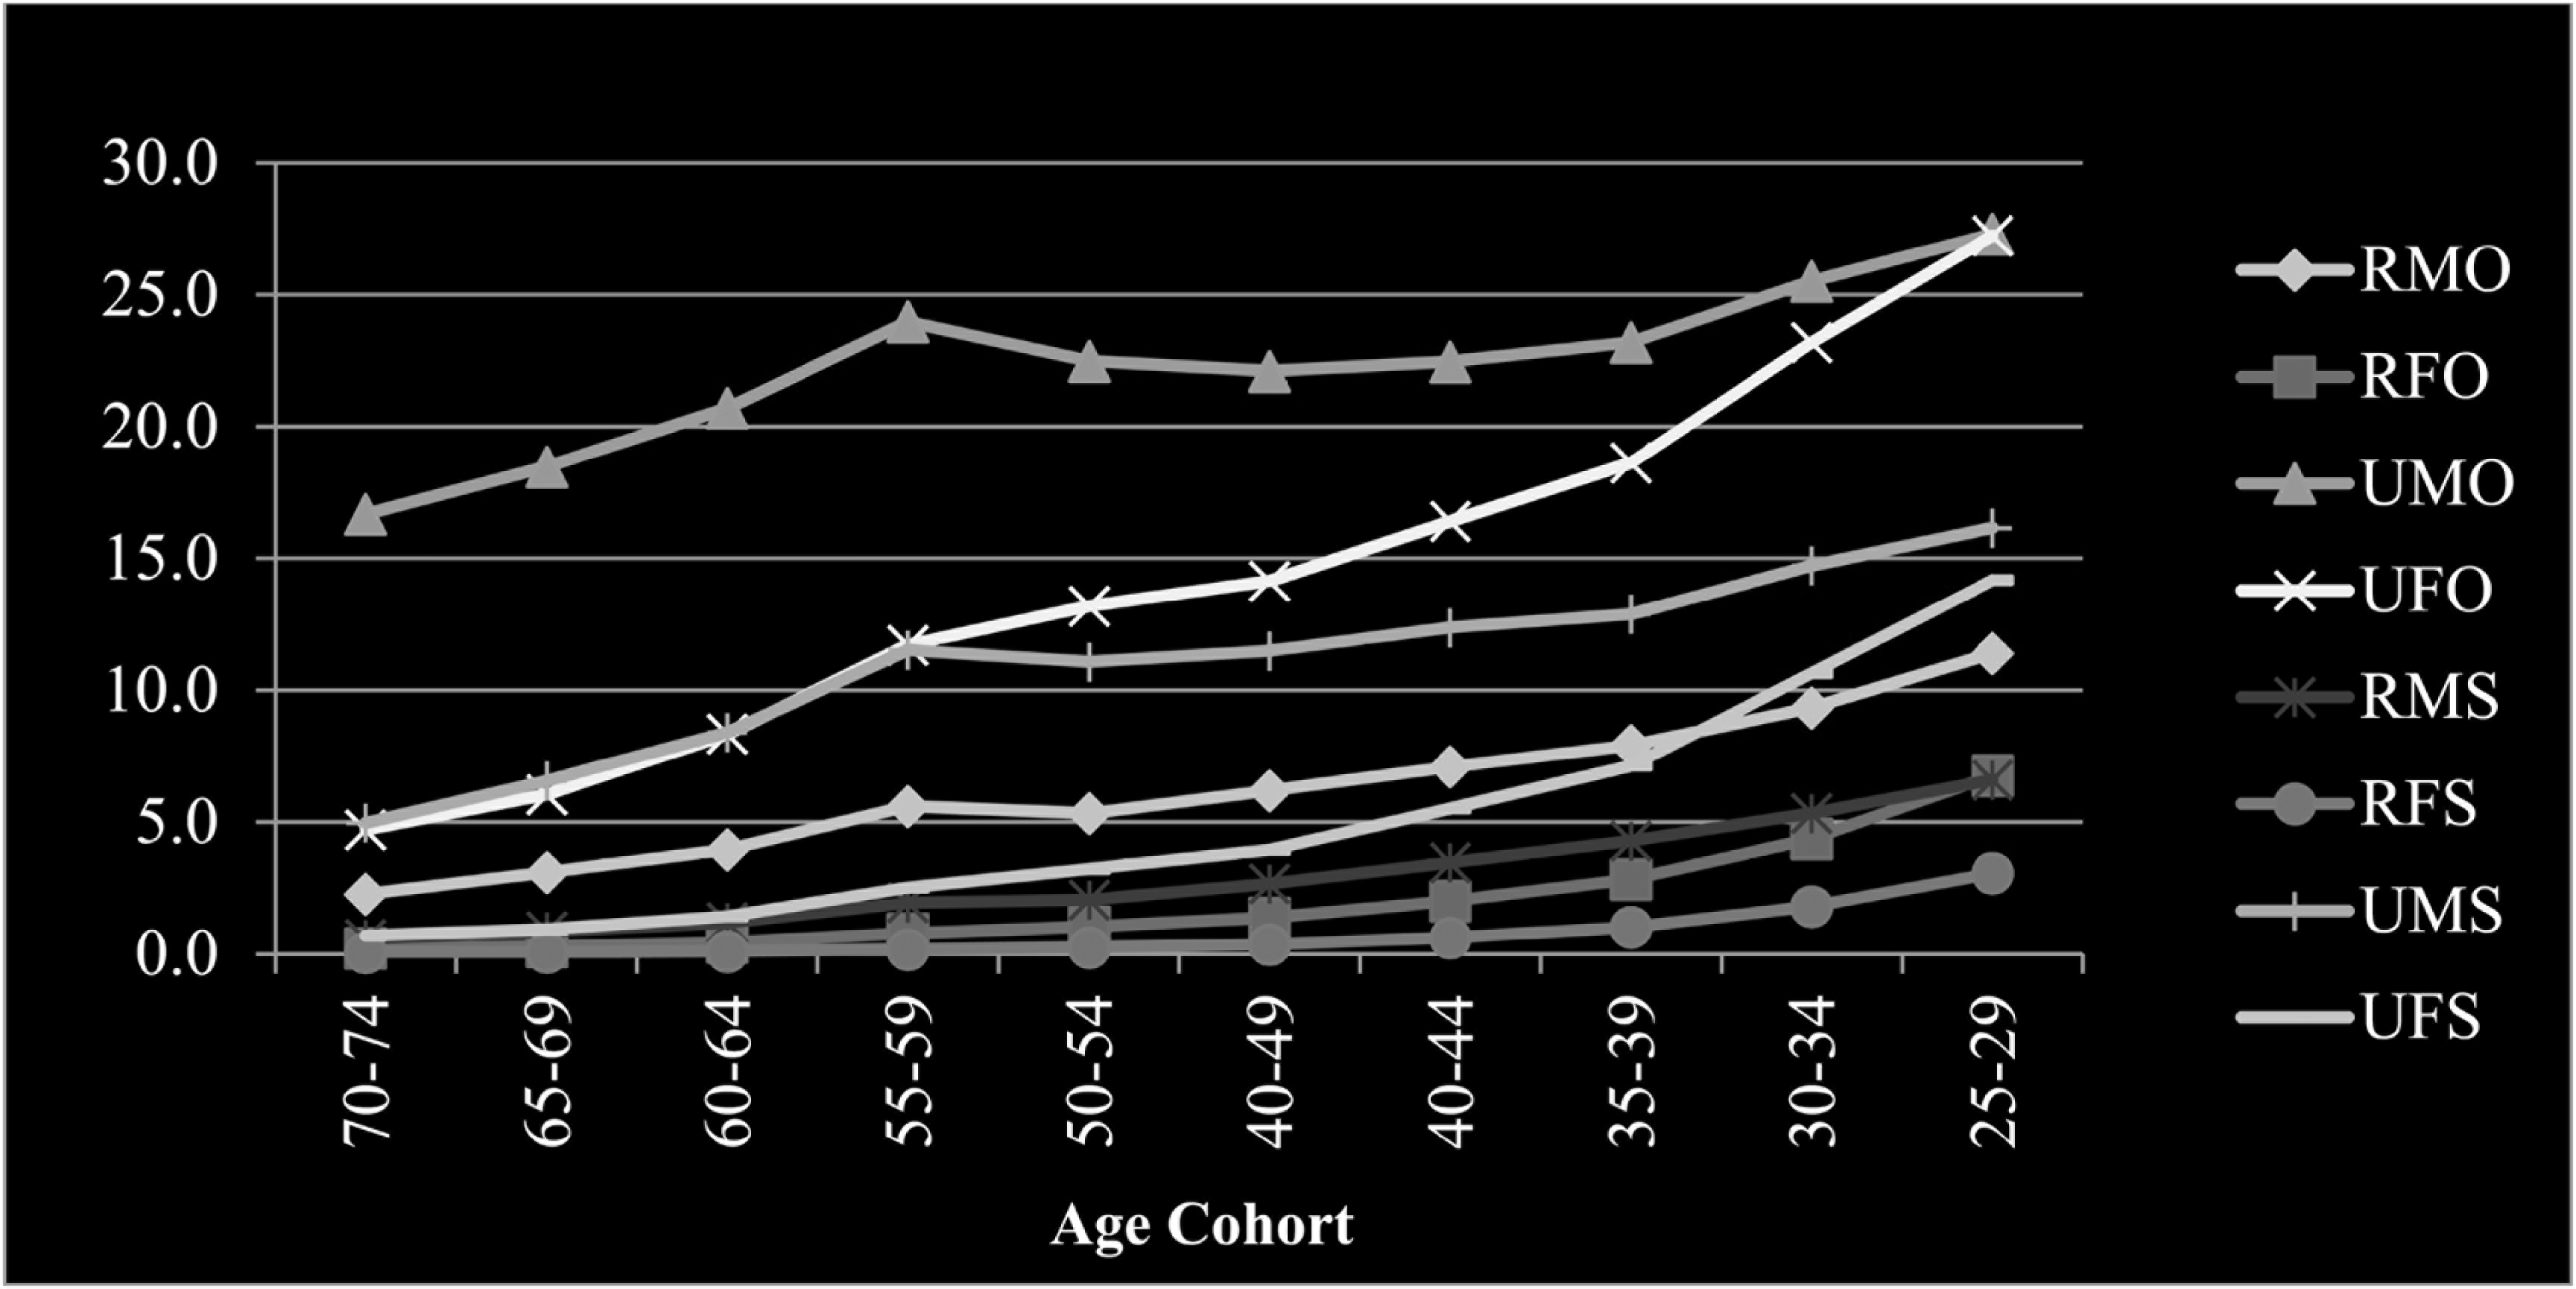
The rural population remains in disadvantaged position at all the educational levels with varying intensity. The disadvantage is higher for higher educational levels such as higher secondary and graduation. At the higher secondary level, progress for rural sector is observed only after age cohort (40–44). The graduation completion rate for rural sector is still very low. Moreover, their relative position is seen to become worse over the age cohort. This is true for all the subgroups of rural population, which is evident from the fact that best-off subgroup (RMO) of the rural population that was in a more advantageous position than the worst-off subgroup (UFS) of urban population, was pushed to a disadvantaged position. For the worst-off rural subgroup, RFS, progress is observed only recently.
Conclusion
The study demonstrates that mapping of educational attainment over the age cohorts offers a robust understanding of educational progress. It informs regarding the change in the likelihood of being educated for every age cohort of the population. It facilitates comparison of the educational attainment rate of any age cohort with other age cohorts in the population. The information obtained from this analysis would be much more useful for policy formulation and analysis than that provided by previous studies. For example, if the policy objective is to achieve gender equity, it is necessary to be informed about whether the older age cohort or the younger one is responsible for the observed disparity. Moreover, despite using a single data point, this article provides a long-term perspective of educational progress.
The analysis confirms continuous improvement in educational attainment in India over the age cohorts. This is observed at every educational level. The literacy rate has improved to 90% for the youngest age cohort (10–14) with equitable distribution across the various subgroups of the population. Unlike literacy, group disparity behaves differently at each educational level. Continuous decline is observed in gender disparity at all educational levels from the oldest to the youngest age cohort. Social disparity declines at elementary education but a similar trend is not observed for other educational levels. Rural–urban disparity presents a story similar to social disparity.
It is possible to get a better understanding about group disparity in educational attainment when it is analysed for eight disjointed subgroups of the population rather than through binary classification. There is a huge gap in educational attainment rate between the best-off (UMO) and the worst-off (RFS) subgroups of the population. This gap is higher for higher educational levels. This analysis observed a complete absence of gender disparity among ‘urban others’ for the youngest age cohort at all educational levels. Gender disparity is absent among ‘urban SC/ST’ at the elementary education level. For higher educational levels, a similar pattern persists, although the convergence is slow. These findings may be crucial for policymaking aimed at gender equity. Moreover, both the social groups in urban sector are also seen to be converging.
The rural sector is a disadvantaged subgroup of the population. There is a clear dominance of the urban sector over the rural sector in terms of the educational attainment rate. The educational attainment rate for all the four rural subgroups is lower than for the urban subgroups. The educational attainment rate is also lower for the best-off rural subgroup than the worst-off urban subgroup for younger age cohorts at all the educational levels. The graduate completion rate in the rural sector remains low despite the recent expansion in higher education.
Footnotes
Declaration of Conflicting Interests
The author declared no potential conflicts of interest with respect to the research, authorship and/or publication of this article.
Funding
The author received no financial support for the research, authorship and/or publication of this article.