
Abstract
The present research presents a case study of welfare outcomes among the horticulture farmers from the Hmar-dominated tribal area of the Lakhipur sub-division of the Cachar district in Assam. Using primary data collected from 335 farming households, the study attempts to evaluate the extent and character of poverty among the indigenous tribes of the region. By using a combination of the Multidimensional Poverty Index (MPI) of the United Nations Development Programme (UNDP) and the Multidimensional Poverty Measure (MPM) of the World Bank, the study contributes to the literature by developing a Composite Welfare Indicator (CWI) based on Multiple Correspondence Analysis (MCA), thereby facilitating a data-driven and holistic view of deprivation. The study finds that the incidence of multidimensional poverty is much higher than that reflected by monetary measures, thereby alluding to the inability of monetary measures to capture the full extent of deprivation in key capabilities. The severe shortage of sanitation, drinking water and health infrastructure in the study area clearly underscores the need for public interventions to reduce deprivation in these spheres. There is also evidence of sizeable asset poverty in the region, reflecting low living standards. The results indicate that households that depend solely on income from farming experience greater poverty than households that have diversified sources of income. This underscores the need for specific support measures for farmers in the form of Minimum Support Prices and crop insurance, along with efforts to enhance the scope for value addition in agriculture. The regression model estimated for identifying the determinants of poverty shows that outreach activities in the form of extension services and training help reduce the incidence of poverty among pineapple farmers.
Keywords
Introduction
Poverty has been described as ‘pronounced deprivation in well-being’ (Haughton & Khandker, 2009). However, the framework within which deprivation is conceived and measured has evolved significantly over time. While traditionally deprivation has been measured in terms of shortfall of income or expenditure to attain a minimally acceptable standard of living, since the human development revolution of the 1990s, deprivation has increasingly come to be interpreted in a multidimensional sense. The nascent approach to poverty measurement is rooted in the capability approach, which postulates that poverty depends not only on household income or consumption but also on the ability to convert available resources into achievement of valuable functioning (doings and beings) (Sen, 1984). As Sen observes, ‘Human lives are battered and diminished in all kinds of different ways, and the first task… is to acknowledge that deprivations of very different kinds have to be accommodated within a general overarching framework’ (Sen, 2000). At the same time, it also needs to be emphasised that public facilities, which represent institutional responses to human needs, also play a vital role in enabling individuals, households or communities in achieving desired functioning and therefore, have an important role to play in determining incidence and quantum of deprivation (Majid, 2022). While Sen’s approach has unleashed a voluminous amount of research on multidimensional poverty, it has also generated a heated debate on the dimensions that need to be considered in measuring such deprivation and the best way to aggregate deprivations in multiple spheres into a single measure (Alkire, 2013; Decancq, 2004). The influence of the capabilities approach on global perceptions of poverty is clearly reflected in the United Nations Development Programme’s (UNDP) adoption of the Sustainable Development Goals (SDGs). The debate on the dimensions of multidimensional poverty notwithstanding, the UNDP, in partnership with the Oxford Poverty and Human Development Initiative (OPHI), has also developed the Multidimensional Poverty Index (MPI), which has become the workhorse model for measuring capability deprivation across three key dimensions of welfare, namely health, education and standard of living. The MPI, however, completely ignores traditional welfare indicators such as income or consumption. In contrast, the Multidimensional Poverty Measure (MPM) developed by the World Bank considers poverty in terms of three dimensions, namely monetary poverty, education and basic infrastructure services, thus juxtaposing monetary and non-monetary indicators in a single framework (World Bank, 2024). While the MPI and the MPM are usually compiled at the national level, their proponents advocate that they should be increasingly used at the micro level for understanding the needs of specific communities and for designing suitable interventions. Against this backdrop, this article uses primary data collected from 335 pineapple-growing households (PGH) in Lakhipur sub-division of Cachar district of Assam to explore the unique aspects of poverty in this predominantly tribal region. Lakhipur sub-division in Assam is home to the ethnic Hmar tribe and is famous for the cultivation of pineapples. Cultivation of crops in the areas is done organically as the local tribes believe that the use of chemical fertilisers and pesticides would cause irreparable damage to the soil. Since 2019, pineapples from the area have also been exported to the Middle East countries. While the area represents a unique model of organic horticulture, there is little research on the economic conditions of the pineapple growers. Here, it may be mentioned that in current literature in agricultural economics, horticulture and organic farming are two key focus areas. While diversification towards horticultural crops is considered to be lucrative in terms of their ability to produce higher returns, organically grown horticultural crops are sought after because of their nutritional value (Das et al., 2019, 2020; Yadav et al., 2013). Unlike cereals, the cultivation of several horticultural crops followed by a mixed cropping pattern can generate income throughout the year and is suitable for marginal and small farmers. This article, therefore, represents a case study of the welfare outcomes of organic horticulture. The study contributes to existing literature by offering a comprehensive view of multidimensional poverty by combining both the MPI and MPM approaches. The objectives of the research are: (a) to assess the extent and nature of poverty among pineapple farming households in the study area, and (b) to identify the socio-economic factors that influence the poverty levels of these households. The article is organised into five sections, including the introduction. A brief description of the study area is given in Section ‘Locale of the Study’. Section ‘Data and Methods’ contains details about the sampling design and the methodology used in the study. The analytical findings of the study are reported in Section ‘Results and Discussion’. In light of the findings, the final section outlines the policy requirements for improving the economic status of the pineapple cultivators in the study area.
Locale of the Study
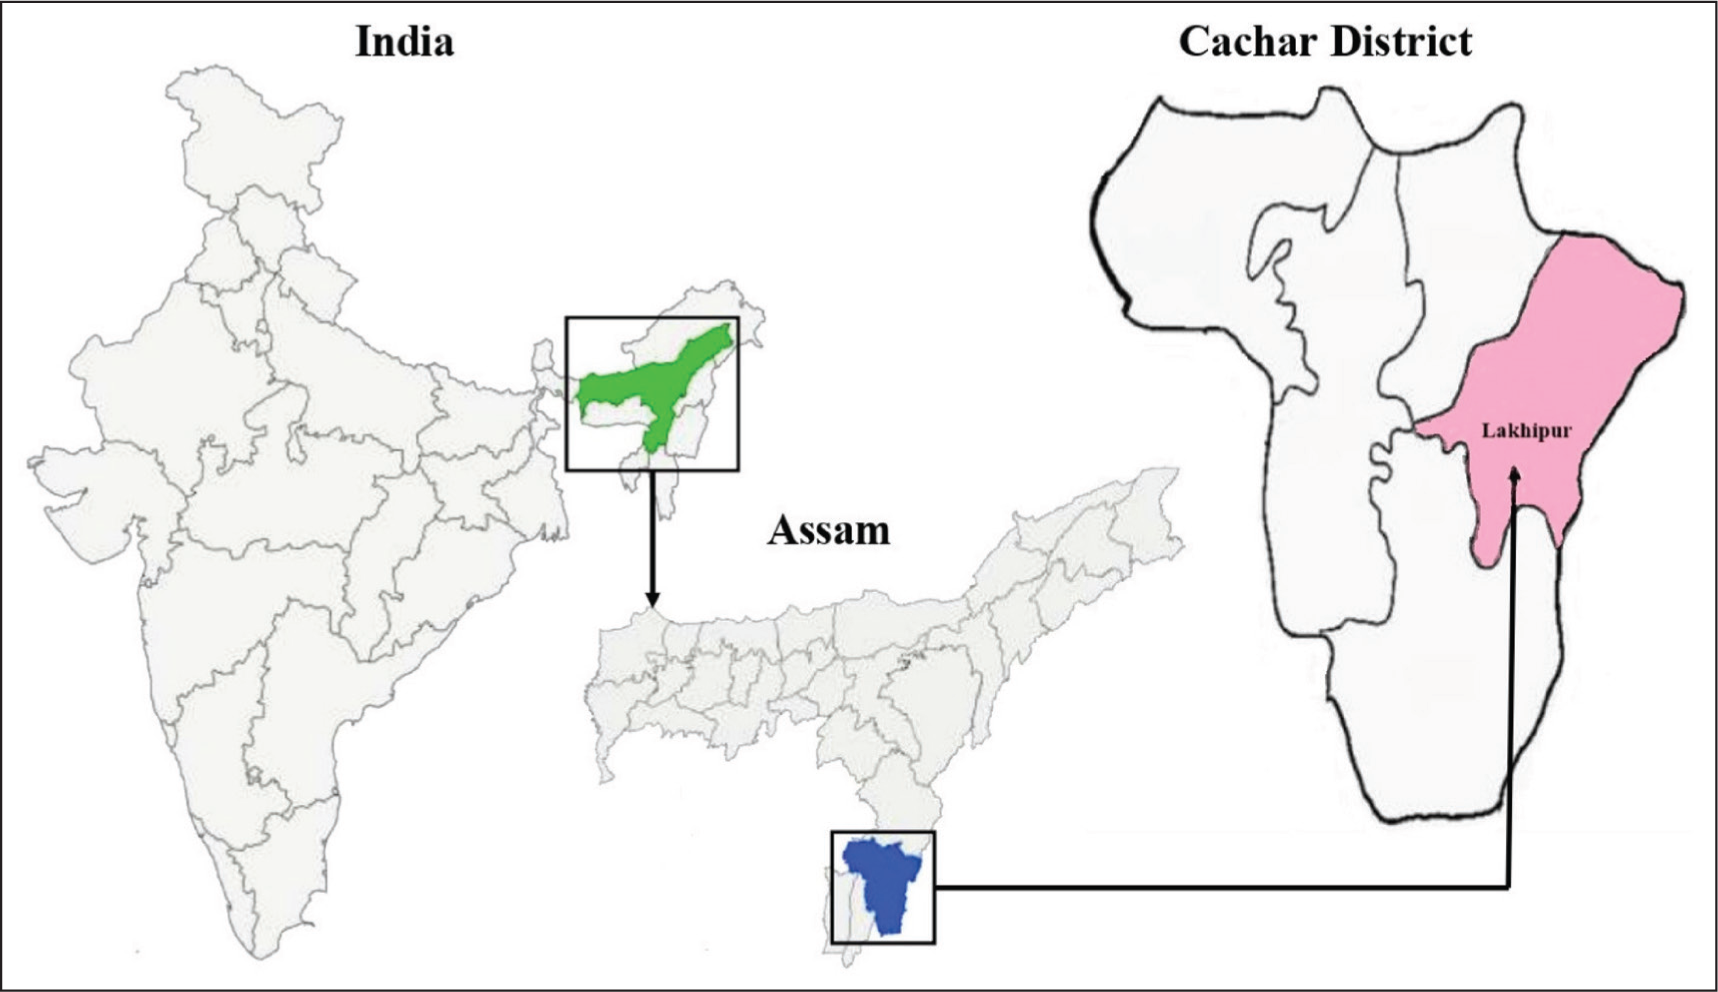
Lakhipur sub-division is one of two sub-divisions in Cachar district, situated in the southern part of the state of Assam in North-East India. The sub-division was founded in 1992. It is enclosed by the state of Manipur to the east, the Silchar sub-division to the west, the Dima Hasao district to the North and the Sonai Circle to the south. The sub-division is located at 92.02° East and 24.80° North. According to the Strategic Research and Extension Plan 2016–2017 report, Agricultural Technology Management Agency Cachar, this particular area encompasses 126,943 ha geographical area. The soil, rainfall and temperature in the area are suitable for cultivating high-value horticultural crops, particularly fruits and vegetables. Soils in the district range from alluvial to lateritic. The texture varies from clayey loam to clay. The pH level in the region varies from 4.5 to 6.0, which is optimal for growing pineapples (Mwangi et al., 2021). As per the 2011 Population Census of India, Lakhipur sub-division consists of 253 villages. Some of them are situated in hilly areas, while others are in forest areas, and a few are in plain areas. The total population in the sub-division is 276,682. A substantial portion of the sub-division is inhabited by indigenous tribes, chiefly the Hmar, who are engaged in the cultivation of a variety of horticultural crops. The sub-division has four Community Development (CD) blocks, namely Lakhipur block, Rajabazar block, Banskandi block and Binnakandi block. These CD blocks of the sub-division are an essential part of the local governance structure, playing an important role in developing and administering their local communities (Figure 1).
Data and Methods
Sampling Design
The study is based on primary data. Rural households in the study area constitute the final sampling units (FSUs). A multistage mixed sampling method was employed to select the sample. In the first stage, Lakhipur sub-division was chosen purposively because pineapple is cultivated and marketed in this particular sub-division of Cachar district. In the second stage, two blocks from the sub-division were purposively chosen for the survey. As previously mentioned, Lakhipur sub-division is divided into four CD blocks, out of which Lakhipur block and Rajabazar block are the two principal pineapple-producing areas. Therefore, these two blocks were purposively chosen as the study area. According to information gathered from the Chairman of Hmar Agro Organic Producer Company Limited (HAOPCL) in Lakhipur, 14 villages in Lakhipur block and 8 villages in Rajabazar block are currently involved in intensive pineapple cultivation. Consequently, in the third stage, two-thirds (or 67%) of the villages involved in pineapple farming from each block were surveyed. Therefore, nine villages were randomly selected from Lakhipur block, and five villages were chosen from Rajabazar block. The selection of villages was carried out randomly using a lottery method. In the final stage, a random selection was made of 20% of the households in each of these villages, resulting in a total sample of 335 households. The field survey was carried out between March 2022 and November 2022. Cross-sectional data related to various aspects of pineapple production for the preceding cropping season, that is, 2021–2022 was collected along with other information required for the assessment of poverty status. Data on consumption expenditure were collected on a 30-day recall basis. A well-structured questionnaire was employed to obtain the required information from the respondents. Sampling weights have been used to derive the estimates for the population. 1
Methodology
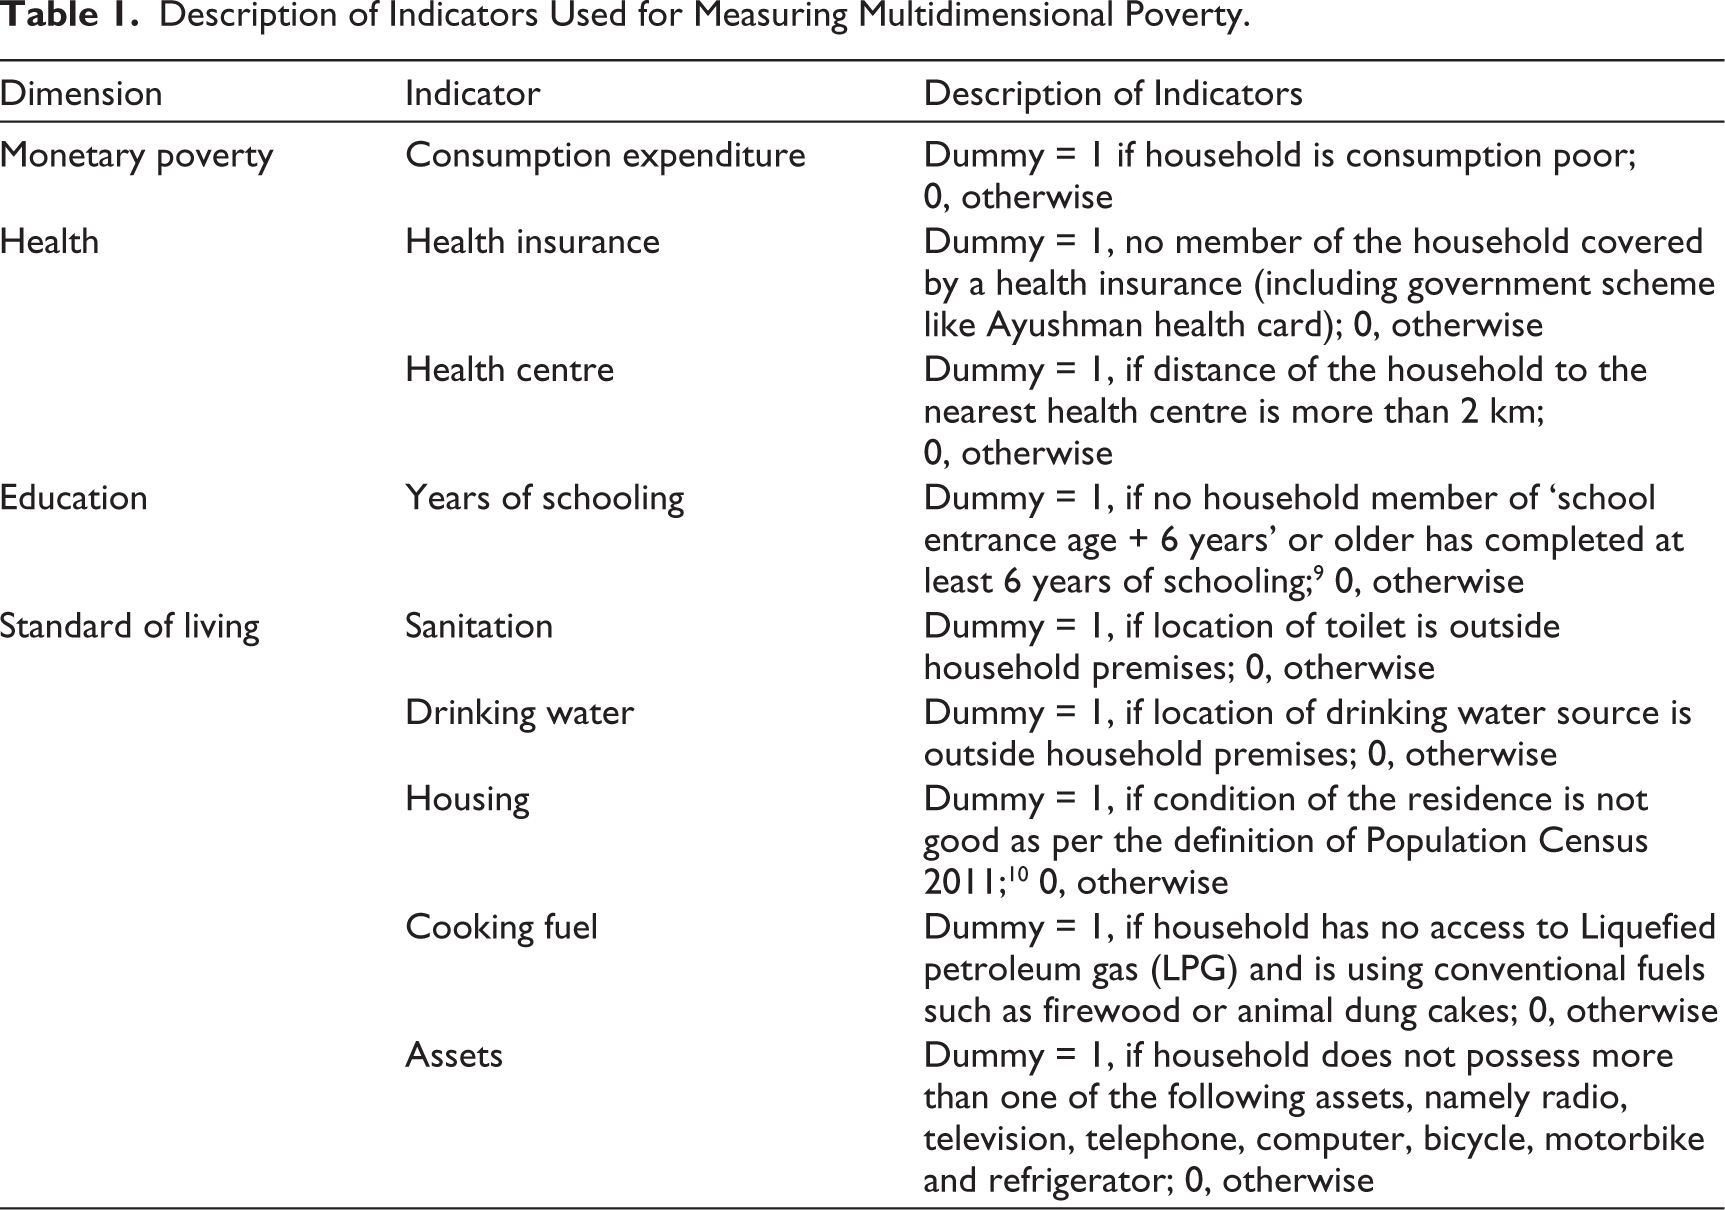
The MPI and MPM are the two prominent methods for measuring multidimensional poverty globally. On the other hand, the most acclaimed approach to measurement of monetary poverty is the Foster–Geer–Thorbecke (FGT) class of poverty measures. The MPI measures deprivation in three key areas of well-being, namely health, education and standard of living. A total of 10 indicators are used by the UNDP to derive the MPI. The dimensions used for health are nutrition and child mortality, while those for education are years of schooling and school attendance. A total of six indicators are used to capture deprivation in the standard of living. The MPM, on the other hand, integrates income or consumption poverty along with deprivation in other indicators. Three dimensions are used by the World Bank for compiling the MPM, namely monetary poverty, education and basic infrastructure services. Monetary poverty in the MPM is captured by the FGT head count of income or consumption, that is, FGT-1. Further, education in MPM has two indicators, namely school enrolment and educational attainment, while basic infrastructure comprises electricity, sanitation and drinking water. Thus, while the MPI totally leaves out monetary poverty from the analysis, the MPM ignores access to basic healthcare and support services while using a limited number of indicators to measure standard of living. The present research, therefore, develops a comprehensive measure of multidimensional poverty by integrating consumption poverty into the framework and, at the same time, adding a fourth dimension, namely health, to the MPM. Also, the third dimension of MPM, that is, basic infrastructure service, is replaced by standard of living, which includes two services mentioned by the World Bank, namely sanitation and drinking water, but adds three more goods or services to the list, namely quality of housing, cooking fuel and assets. 2 Here, it may be stated that the UNDP evaluates nutrition on the basis of the body mass index (BMI). However, due to the individual nature of the work, it was not feasible to use this indicator for measuring deprivations in health. Hence, other indicators used in literature have been employed (Government of Gujarat, 2016; Saikia & Bhattacharjee, 2011). Details of the poverty indicators used in the present research are given in Table 1.
Description of Indicators Used for Measuring Multidimensional Poverty.
The selection of dimensions and indicators constitutes the first step in measurement of multidimensional poverty. The second step consists of determining the weights of individual indicators. This is again an area of substantial debate in the literature. Interestingly, both the UNDP and the World Bank assign equal weights to all indicators. This approach, however, has been challenged in various quarters. Dissidents of this approach maintain that weights should be data-driven and should be determined by local conditions and needs. Many authors have advocated the use of alternative approaches such as Principal Component Analysis, Multiple Correspondence Analysis (MCA) and Fuzzy Set approach for determining the weights of indicators (Asselin & Anh, 2008; Ezzrar & Verme, 2013; Njong & Ningaye, 2008). Given that all indicators used in the present analysis are binary in nature, the study employs MCA to aggregate deprivation across indicators into a singular index. Here, it is important to note that MCA gives negative weights to the indicator value, which represent deprivation or lack of access to the corresponding good or service and positive weight to the value of the indicator, which represents the absence of deprivation. Hence, households facing higher levels of deprivation have lower index values and vice versa. As higher values of the index represent lower deprivation across multiple indicators, the index obtained by applying MCA to the household data is called the Composite Welfare Indicator (CWI). The identification of the poor households on the basis of CWI score requires the setting of a poverty line. Following discussions in literature, the poverty line is fixed at 60% of the median value of the index. According to Ki et al. (2005), the functional form of CWI, based on MCA, can be written as
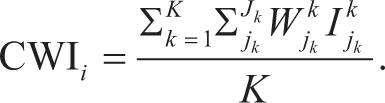
where, K is the number of dimensions, Jk is the number of indicators across K dimensions, Wkjk is the weight (standardised score on the first axis, i.e.,
In addition to the setting of a poverty line for identifying multidimensionally poor households on the basis of CWI, identification of monetary poverty requires the determination of an income or consumption threshold called the poverty line, such that all the individuals or households less than the threshold are deemed to be poor. In India, the official income poverty line for each state used to be given by the erstwhile Planning Commission. However, since 2011–2012, the practice of announcing the poverty line has been discontinued by the Government of India. Thus, the last poverty line is available only for the year 2011–2012. Therefore, it is inconvenient to use the same poverty line after almost a decade (even with upgradation through the Consumer Price Index (CPI)). As the field survey for the current study has been carried out in 2022, we use the International Poverty Line announced by the World Bank which is given as $2.15 per person per day (at 2017 prices). 3 The International Poverty Line has been converted into Indian Rupee (₹) by using the exchange rate at Purchasing Power Parity (PPP) for 2017. The figure so obtained was then updated for the year 2022 using the CPI of agricultural workers (GOI, 2023). Thus, the final poverty line is obtained as ₹53.30 per person per day. 4 The poverty line so obtained serves as the threshold for per-capita consumption expenditure of households to identify the consumption poor households for computing the FGT indices of poverty measures, namely the Head Count Ratio, Poverty Gap Index and Squared Poverty Gap Index (Foster et al., 1984). The general formula for obtaining FGT indices is as follows.
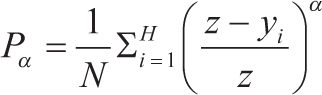
where N is the population size, H is the number of poor people, z is the poverty line, and yi is the consumption expenditure or income per capita of ith individual. Here, α takes 0, 1 or 2. If α is 0 then the index becomes the Head Count Ratio (FGT-1), if it is 1, the Poverty Gap Index (FGT-2), and if it is 2, the Squared Poverty Gap (FGT-3). The CWI uses FGT-1 as the monetary measure of poverty.
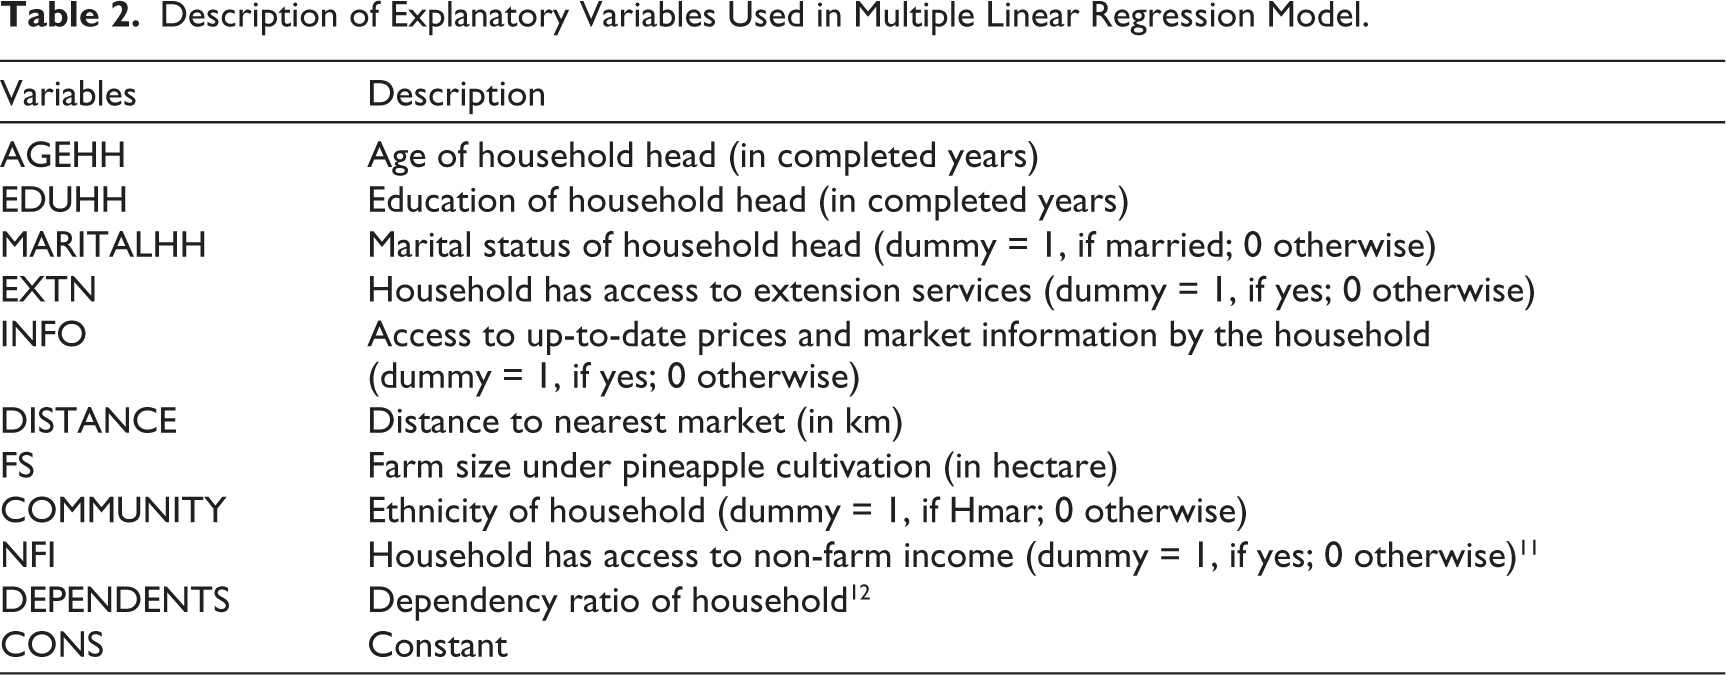
Lastly, to determine the factors that influence the multidimensional poverty of pineapple farming households in the study region, a multiple linear regression model has been fitted to the observed data. The dependent variable for the regression analysis is the CWI scores of households. The details of the explanatory variables used in the estimation of the regression model are given in Table 2.
Description of Explanatory Variables Used in Multiple Linear Regression Model.
Results and Discussion
Socio-economic Profile of the Sample Households
The socio-economic characteristics of the sample households are shown in Table 3. The results reveal that the mean age of the household heads (AGEHH) in the sample is 50.53 years. 5 Furthermore, 83.58% of the sample households are headed by males, highlighting the dominance of men in the pineapple farming families within the study region. Additionally, the average years of education attained by the heads of the sample households is 6.36 years. It has been observed that 80.30% of these household heads are married, and consist of an average of six members in the family, reflecting the strong presence of social institutions like marriage alongside a preference for smaller families. Moreover, almost 80% of the surveyed households comprised of marginal and small farmers, while the remaining households are semi-medium farmers. There are no medium or large farmers present in the study area. 6 Table 3 also exhibits that the heads of the sample households have an average of 22.55 years of experience in pineapple farming, and 50.15% of the sample households are able to access extension services, indicating that nearly half of them lack access to such services from either producer organisations or government sources. The distribution of workers (aged 18–59 years) from the sample households across various occupations indicates that 26.74% are self-employed in the cultivation of pineapples, while 63.54% work as unpaid family members. Additionally, 8.95% hold salaried jobs, primarily in teaching, nursing and defence, and merely 0.77% own their own businesses. Finally, 92.24% of the sample households are part of the Hmar community, indicating that Hmar pineapple-growing families are the most predominant in the region, while the remaining 7.76% belong to other tribal groups, including Kuki and Chiru.
Additionally, for the purpose of analysis, the research categorises the sample households into PGH and mixed-income households (MIH) based on their sources of income. Here, it may be mentioned that all the 335 households in the sample were involved in pineapple cultivation. However, the proportion of income derived from pineapple cultivation varied across households. Besides, almost all households were found to be cultivating other horticultural crops in addition to pineapples. 7 For the purpose of analysis, households that depended entirely on the cultivation of pineapples and other crops were treated as PGH. Conversely, households having additional sources of income from other activities such as daily labour, salaried jobs, self-employment or businesses, along with crop cultivation, are classified as MIH. 8 Based on this classification, it is seen that 45.50% are PGH while the remaining 54.50% are MIH in the sample (Table 3). Before assessing the poverty situations across different household types, it is essential to have an insight into the income distribution from the various sources contributing to the overall income of the sample households.
Socio-economic Profile of Sample Households.
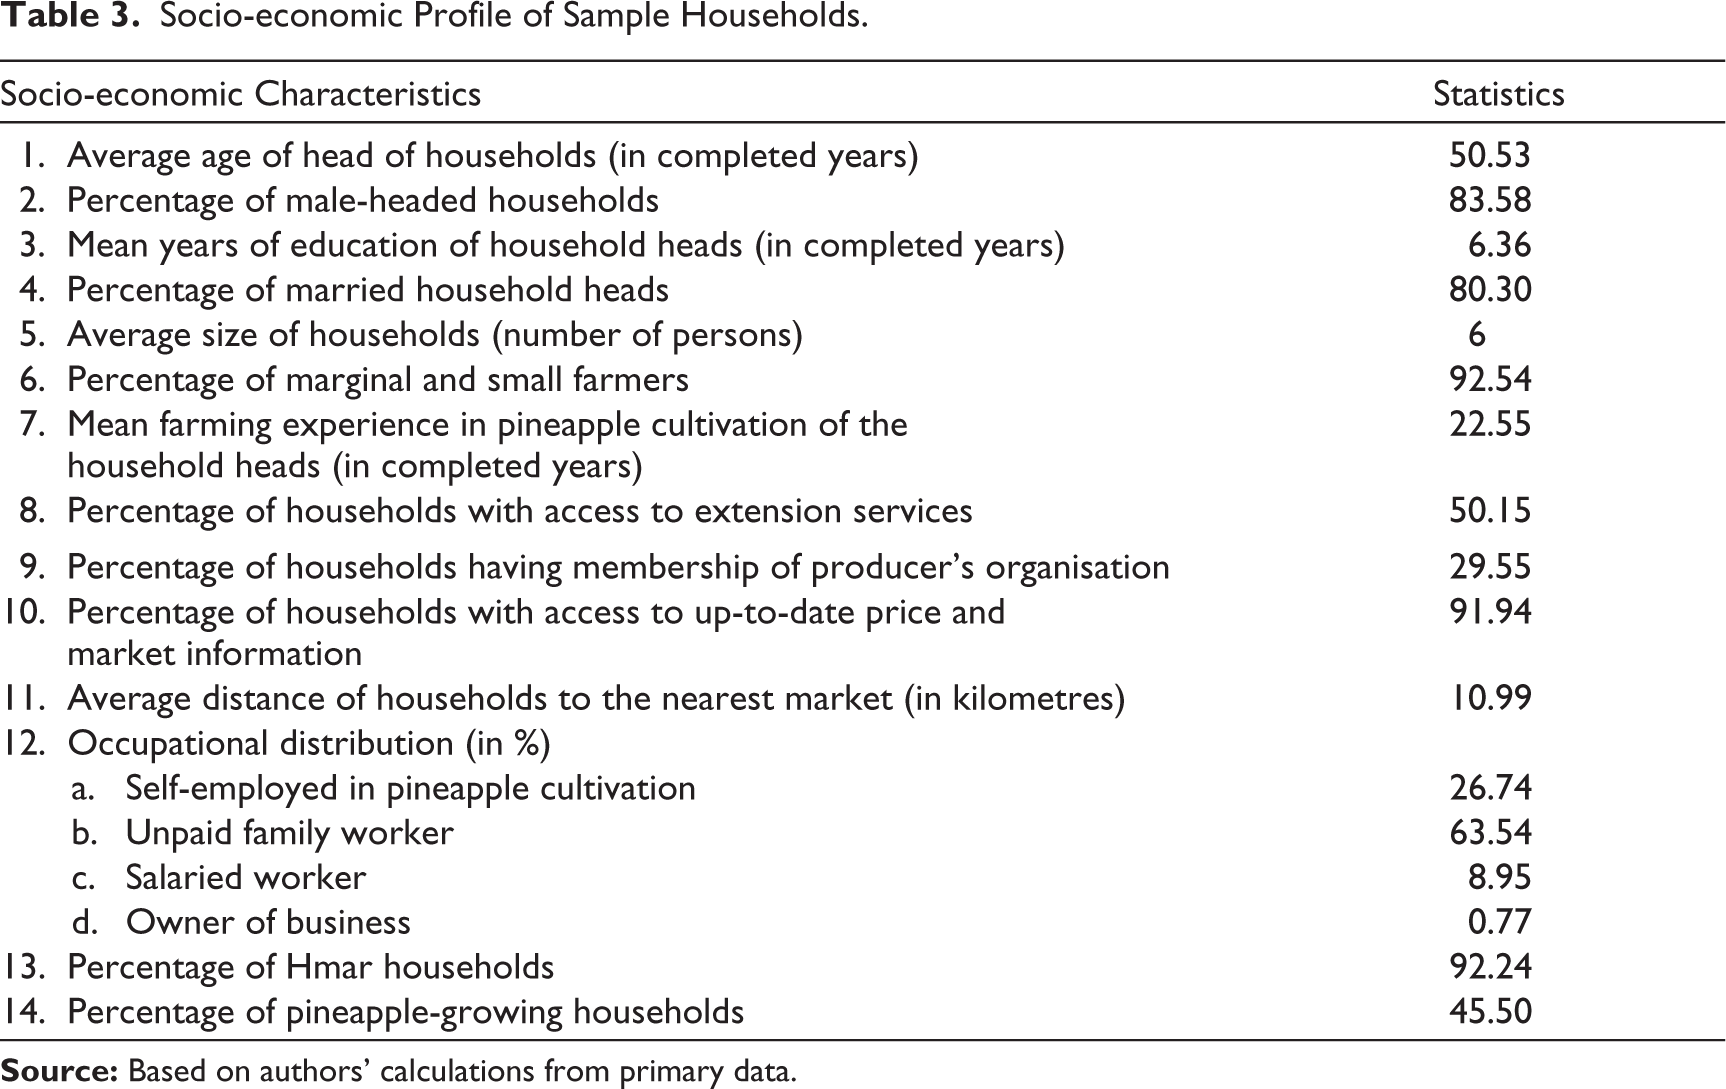
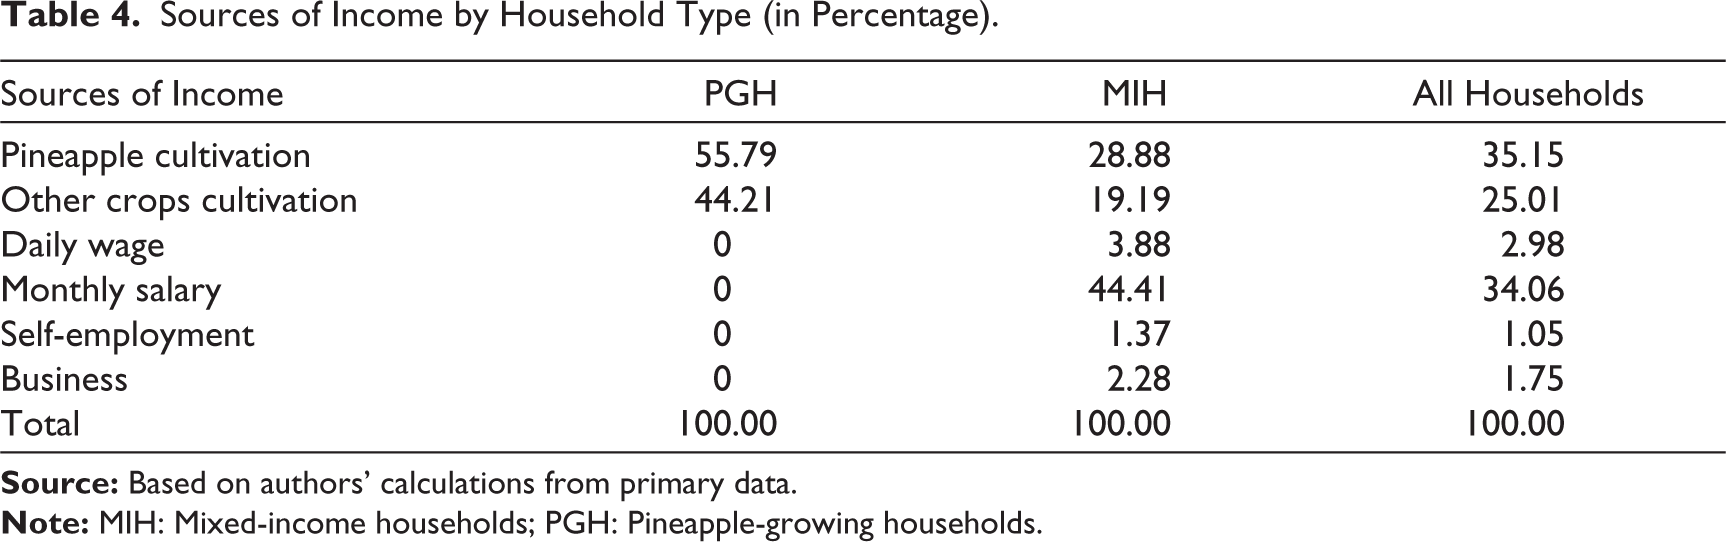
Table 4 presents the percentage distribution of different income sources for the sample households in relation to their total income. It is observed that pineapple cultivation accounts for the largest portion (35.15%) of the total income of these households, followed by the earnings from salaried jobs (34.06%) of household members. Furthermore, income derived from the cultivation of other crops makes up 25.01%, while daily labour contributes 2.98%, and self-employment and business activities contribute nearly 3% as well. Additionally, PGH generate 55.79% of their income from pineapple cultivation, whereas 44.21% of their income comes from other crop cultivation. In non-PGH, about 48% of their income is derived from crop cultivation, including pineapple, while the remaining 52% of their income is obtained from non-farm sources such as daily labour, salaried jobs, self-employment activities and businesses.
Sources of Income by Household Type (in Percentage).
Multidimensional and Monetary Poverty in the Study Area
The distribution of sample households based on FGT-1 and CWI poverty lines gives an insight into the prevalence of poverty among the pineapple growers in the study area. However, before reporting the findings related to poverty status of households, it is worthwhile to report the descriptive statistics relating to the CWI. The mean value of the CWI index is 0.1236, while its median value is −0.0295629. The range of the CWI is from −2.436207 to 1.471102 (Table 5). Hence, households with index scores of less than 60% of the median score are identified as multidimensional poor. The basis for computing the FGT-1 for the identification of consumption-poor households has already been outlined in the methodology section. Although the CWI includes FGT-1 as the indicator of monetary poverty, statistics related to FGT-1 are depicted separately in Figure 2 in order to get an idea of monetary poverty in the study area. It is seen that about 20% of the sample households in the study area are afflicted by consumption poverty. Thus, about one-fifth of the sample households suffer from monetary poverty. Further, segregation of the sample households by household type reveals that monetary poverty is higher among PGH as compared to MIH. Analysis of the poverty figures based on agricultural characteristics reveals that 25% of PGH fall below the poverty line, whereas around 15% of the MIH fall below the poverty threshold. This observation can be attributed to the fact that non-PGH rely not only on agricultural production but also augment their income through various non-farm activities, such as salaried jobs (e.g., defence, nursing and teaching), self-employment opportunities (e.g., tailoring, carpentry and animal husbandry) and businesses. However, the percentage of deprived households that are deprived in terms of CWI is more than double the percentage of households suffering from monetary poverty alone. Thus, nearly 45% of the sample households are poor when analysed in terms of CWI. This is true across the two distinct household categories, though the incidence of multidimensional poverty is much higher among households relying solely on cultivation for means of livelihood. Thus, while nearly 56% of cultivating households are found to be suffering from multidimensional poverty, the corresponding figure from MIH is much lower at 36%. It thus follows that deprivations in multiple dimensions of welfare are much higher than what is revealed by monetary measures alone.
Summary Statistics of Composite Welfare Indicator (CWI) Scores Based on Multiple Correspondence Analysis (MCA).
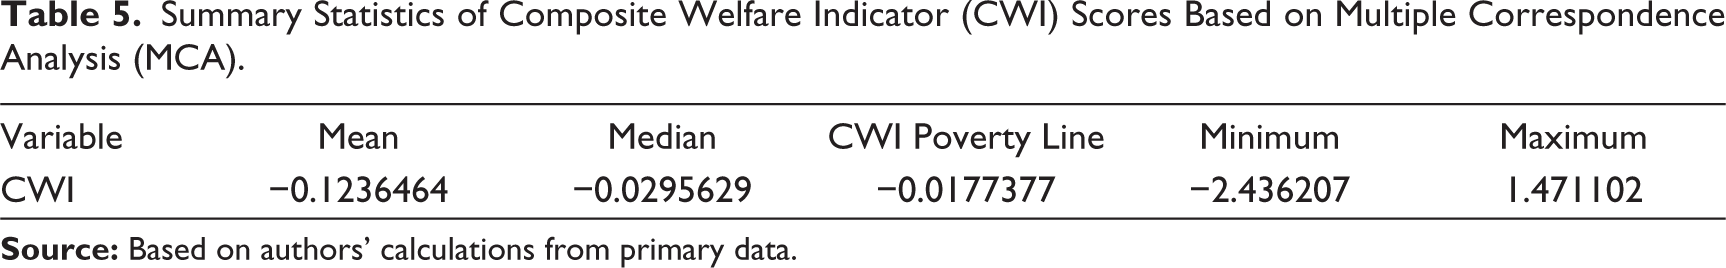
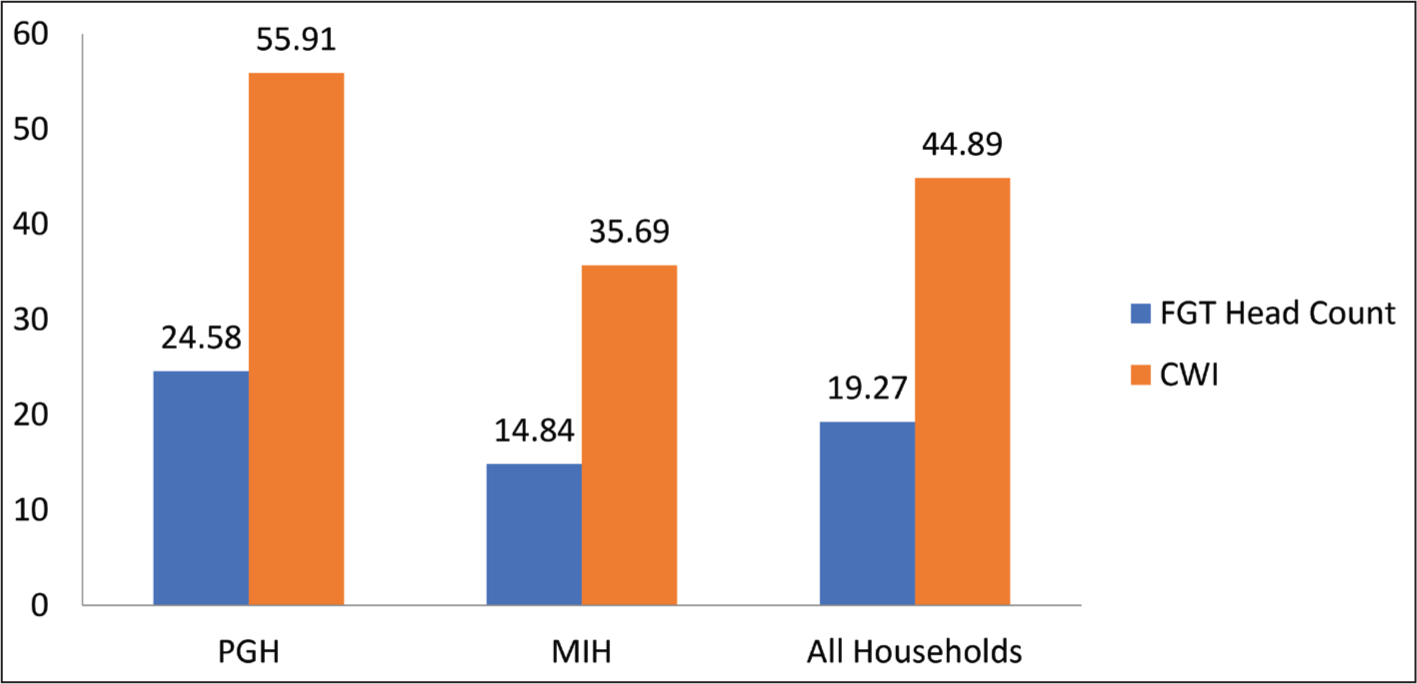
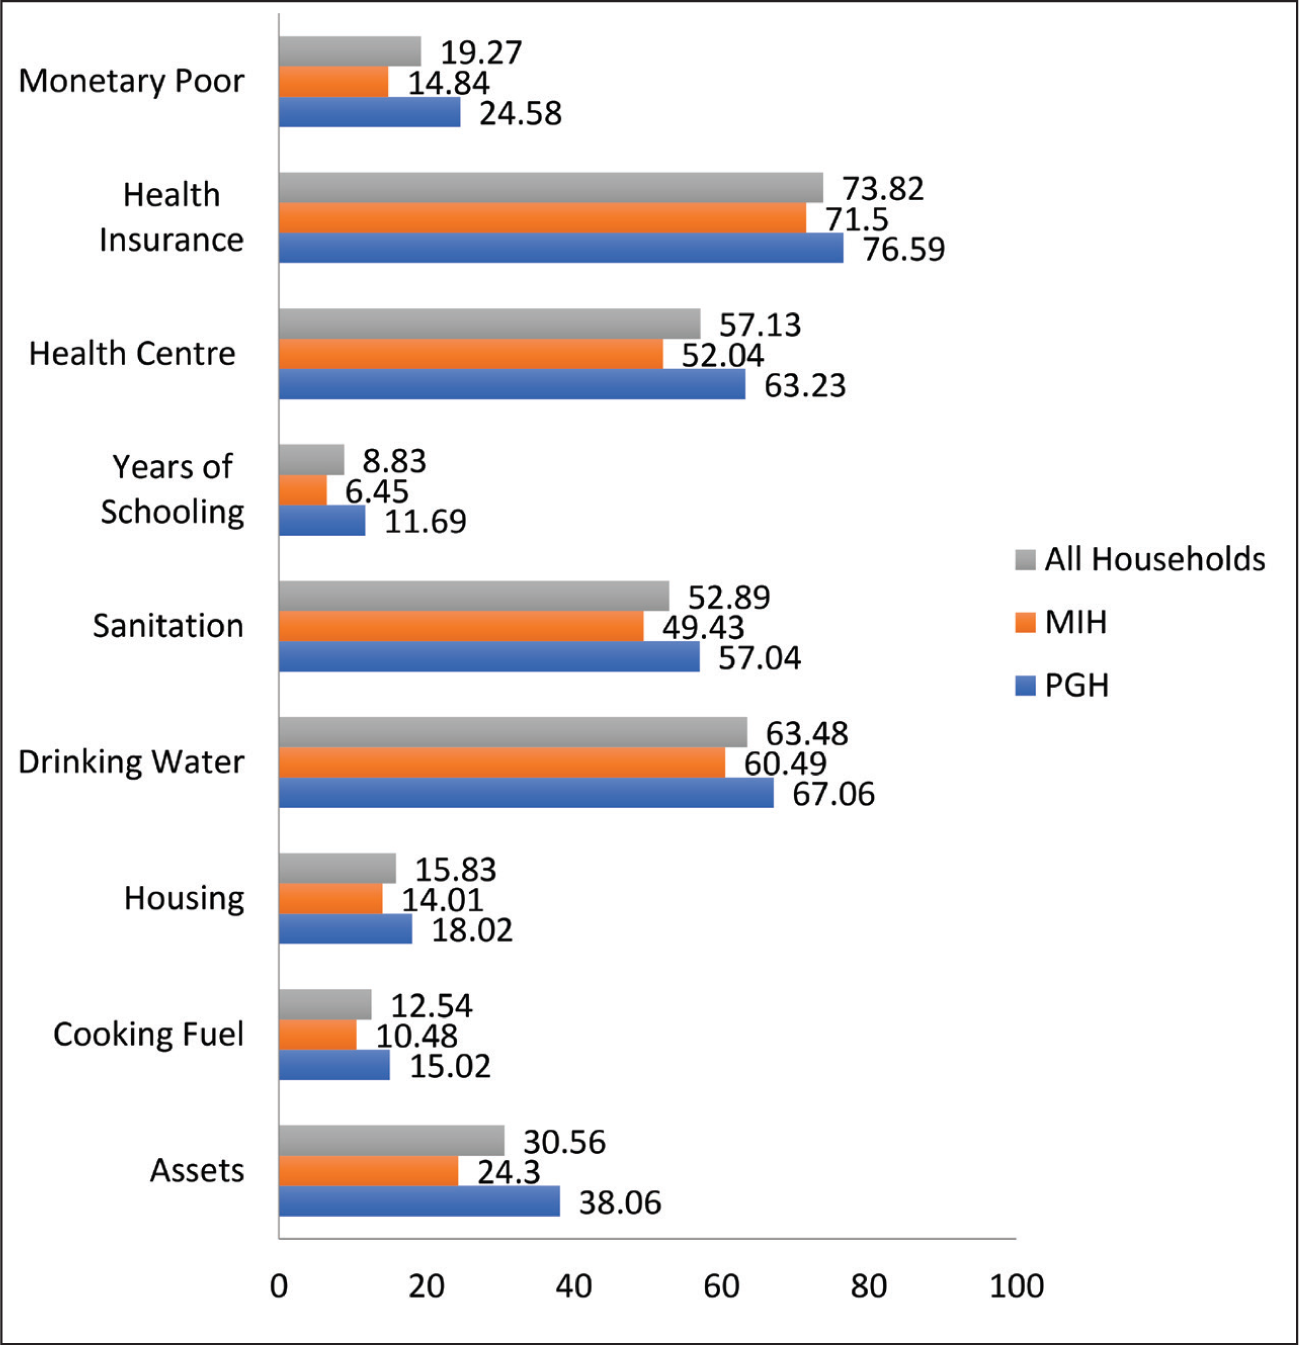
Figure 3 shows the deprivation rates across individual indicators for the entire sample as well as household type. Taking all households together, it is found that deprivation in sanitation and drinking water is very high in the study area. More than half of the sample households did not have access to improved sanitation within the household premises. Similarly, more than 60% of the sample households did not have access to safe drinking water within the household premises. Similarly, health care support in terms of having access to a health centre within 2 km radius or having any form of health insurance is severely lacking. It is therefore quite obvious that government support schemes such as Ayushman card have not reached majority of the sample households. It is important to note that households that rely solely on cultivation fare poorly in terms of all welfare indicators compared to MIH. This lends credence to the finding that the poverty rates in terms of the CWI are higher for the former group of households.
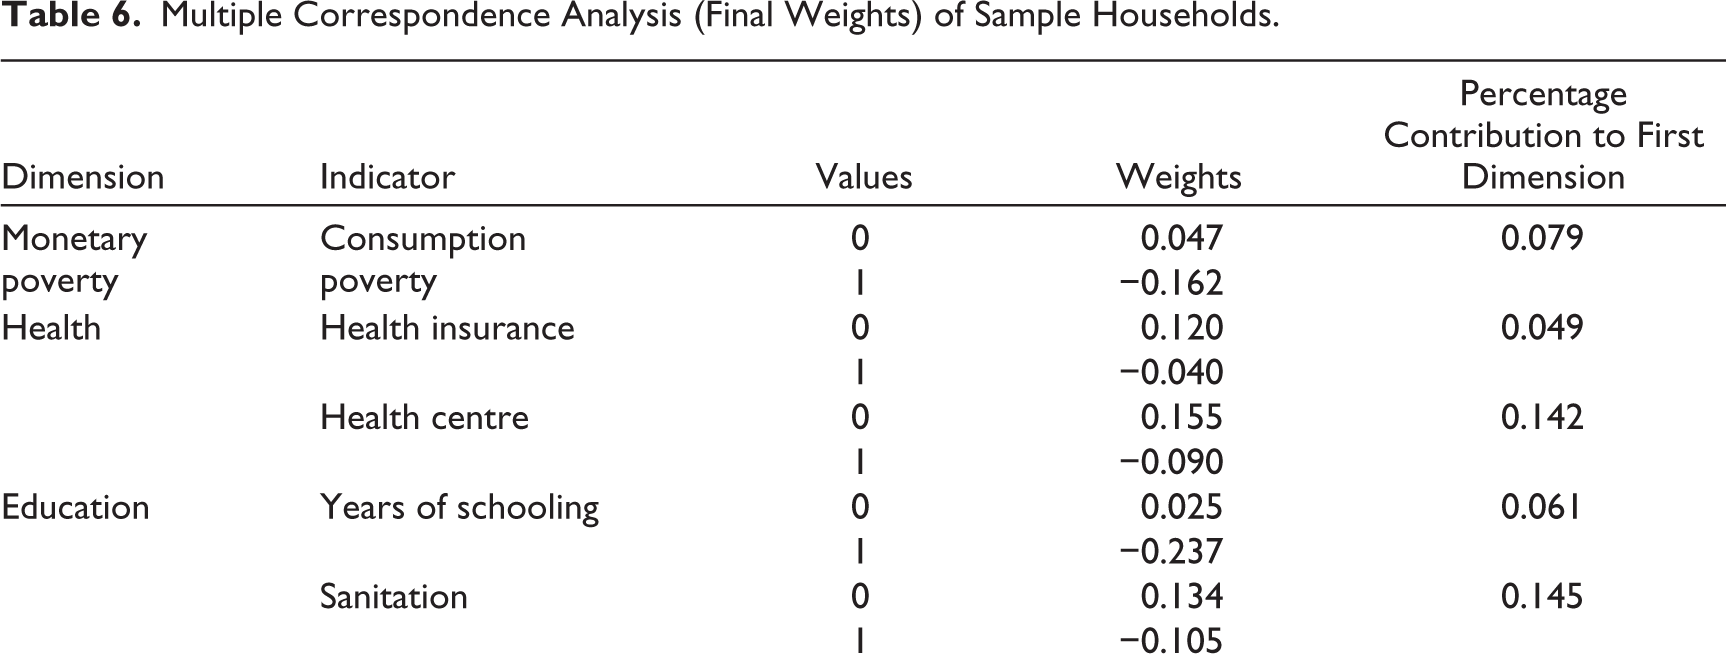
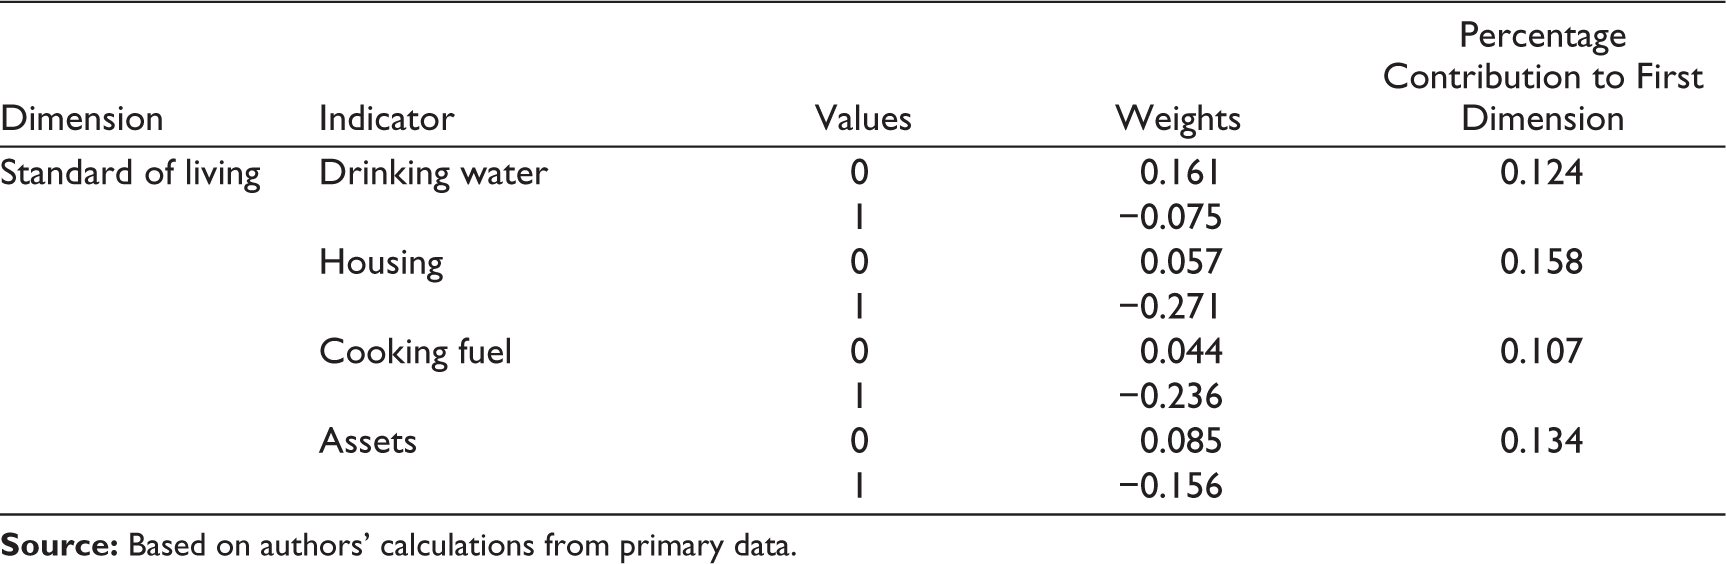
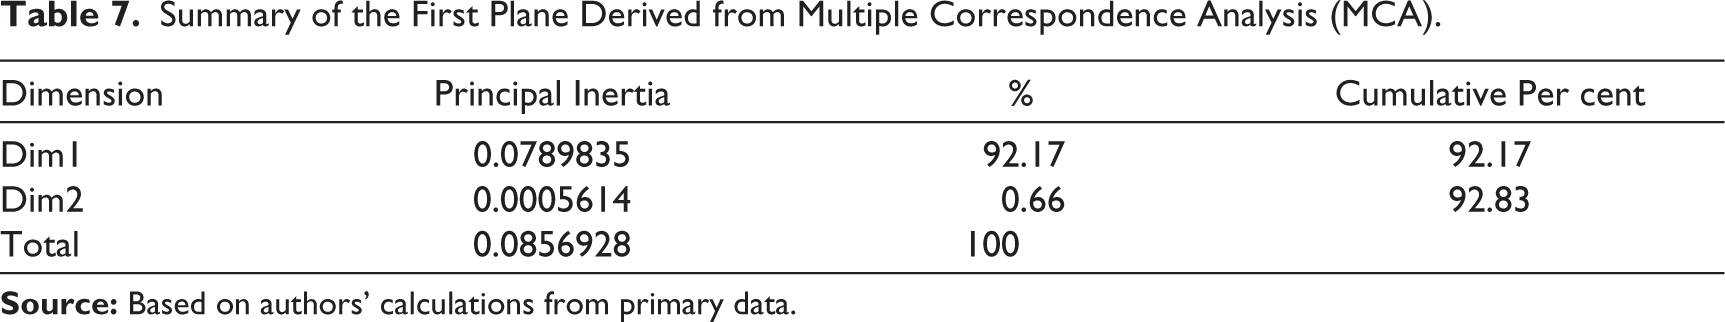
Weights of various indicators obtained by dividing the factor scores on first factorial axis (dimension) by the square root of the first principal inertia are given in Column 4 of Table 6. Given the nature of coding of the binary variables wherein 1 indicates deprivation, and 0 indicates lack of it, a positive sign of the factor scores (and hence weights) represents an increase in welfare, whereas a negative sign denotes welfare reduction. The indicators which have contributed the most to the formation of the first dimension are housing, drinking water, availability of health services and assets. On the other hand, income and years of schooling have relatively less contribution. The first dimension explained more than 92% of the total inertia, as shown in Table 7.
Multiple Correspondence Analysis (Final Weights) of Sample Households.
Summary of the First Plane Derived from Multiple Correspondence Analysis (MCA).
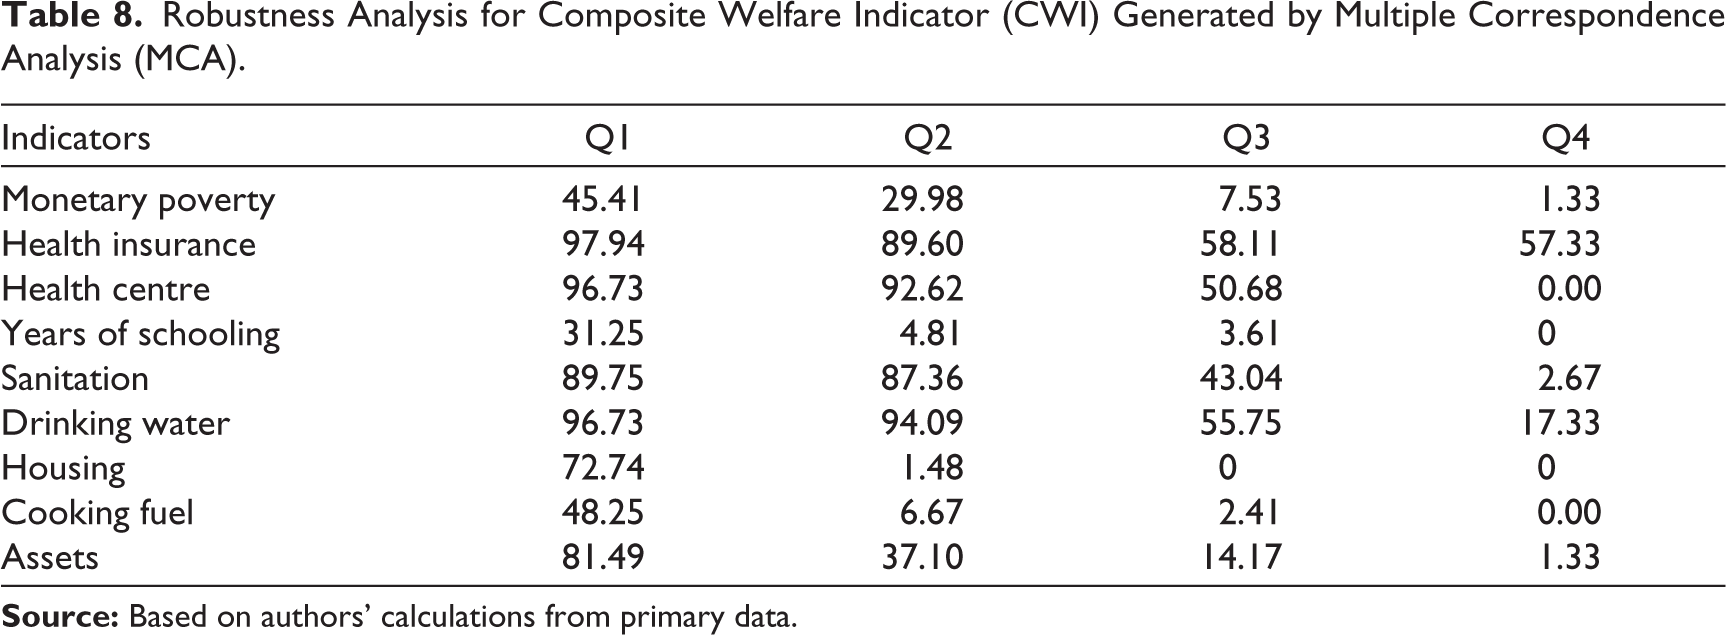
While undertaking any kind of poverty analysis based on the compilation of statistical indices, it is important to check whether such indices are capable of distinguishing between poverty situations. Table 8 represents the outcome of the robustness analysis conducted for the CWI. For this purpose, the sample households were grouped into quartiles on the basis of their CWI scores. Q1 includes 25% of the sample households with the lowest CWI scores, whereas Q4 represents the quarter with the highest CWI scores. It is quite obvious that deprivation rates across all dimensions and indicators of the CWI are highest for the households in the bottom quartile. Also, the deprivation rates for all indicators decline monotonically as we move towards the higher quartiles of CWI scores. Further, there were six households in the data set with the lowest CWI score of −2.436207 and fifteen households with the maximum CWI score of 1.471102. Interestingly, all six households at the bottom of the spectrum were found to be deprived in all the indicators, while all 15 households with the maximum value of CWI reported zero deprivation in all indicators. These results depict that the CWI constructed through the application of MCA is robust and is able to capture the lack of access to basic goods and services, as represented by the various indicators.
Robustness Analysis for Composite Welfare Indicator (CWI) Generated by Multiple Correspondence Analysis (MCA).
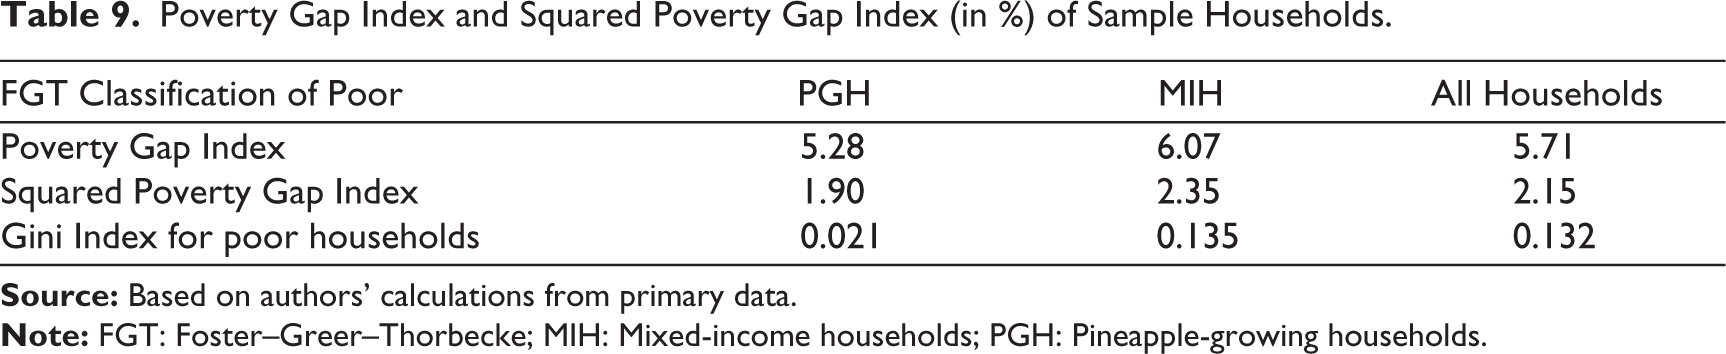
The FGT class of poverty measures help to measure the Poverty Gap and Squared Poverty Gap in addition to the poverty head count. The findings for these two additional indices are given in Table 9. The Poverty Gap Index represents the average consumption shortfall from the poverty line among the poor households in the study area. It provides an insight into the average depth of poverty among the sample households. The results suggest that, on average, the consumption of poor families falls short by 5.71% below the poverty line. Further, the Squared Poverty Gap Index shows the squared average consumption shortfall from the poverty line with a higher severity to extreme poverty among the sample households. It is observed that the Squared Poverty Gap Index for all sample households is 2.15%. It is important to note that while the Head Count Ratio is greater for PGH, both the Poverty Gap Index and the Squared Poverty Gap Index are significantly higher among MIH. The findings indicate that while there are fewer poor households among MIH, those that are poor experience greater depth and severity of poverty compared to PGH. Such an outcome highlights that although many MIHs are above the poverty line, those who are consumption poor experience extreme poverty. This suggests an unequal distribution of non-farm income (NFI). Table 9 also shows that the Gini index based on monthly per capita consumption expenditure among poor households is 0.021 for PGH, whereas for MIH it is 0.135. This indicates that consumption inequality is more pronounced among MIH compared to PGH. This disparity particularly affects marginal and small farmers who depend on daily labour, engage in less productive agricultural activities, and have irregular income sources, all of which lead to unequal per capita consumption.
Poverty Gap Index and Squared Poverty Gap Index (in %) of Sample Households.
Socio-economic Determinants of Deprivation: Multiple Linear Regression Analysis
As mentioned earlier, the Multiple Linear Regression Model is estimated to determine the factors that influence multidimensional poverty of the sample households. The results of the regression analysis are shown in Table 10.
Results of Multiple Linear Regression Model.
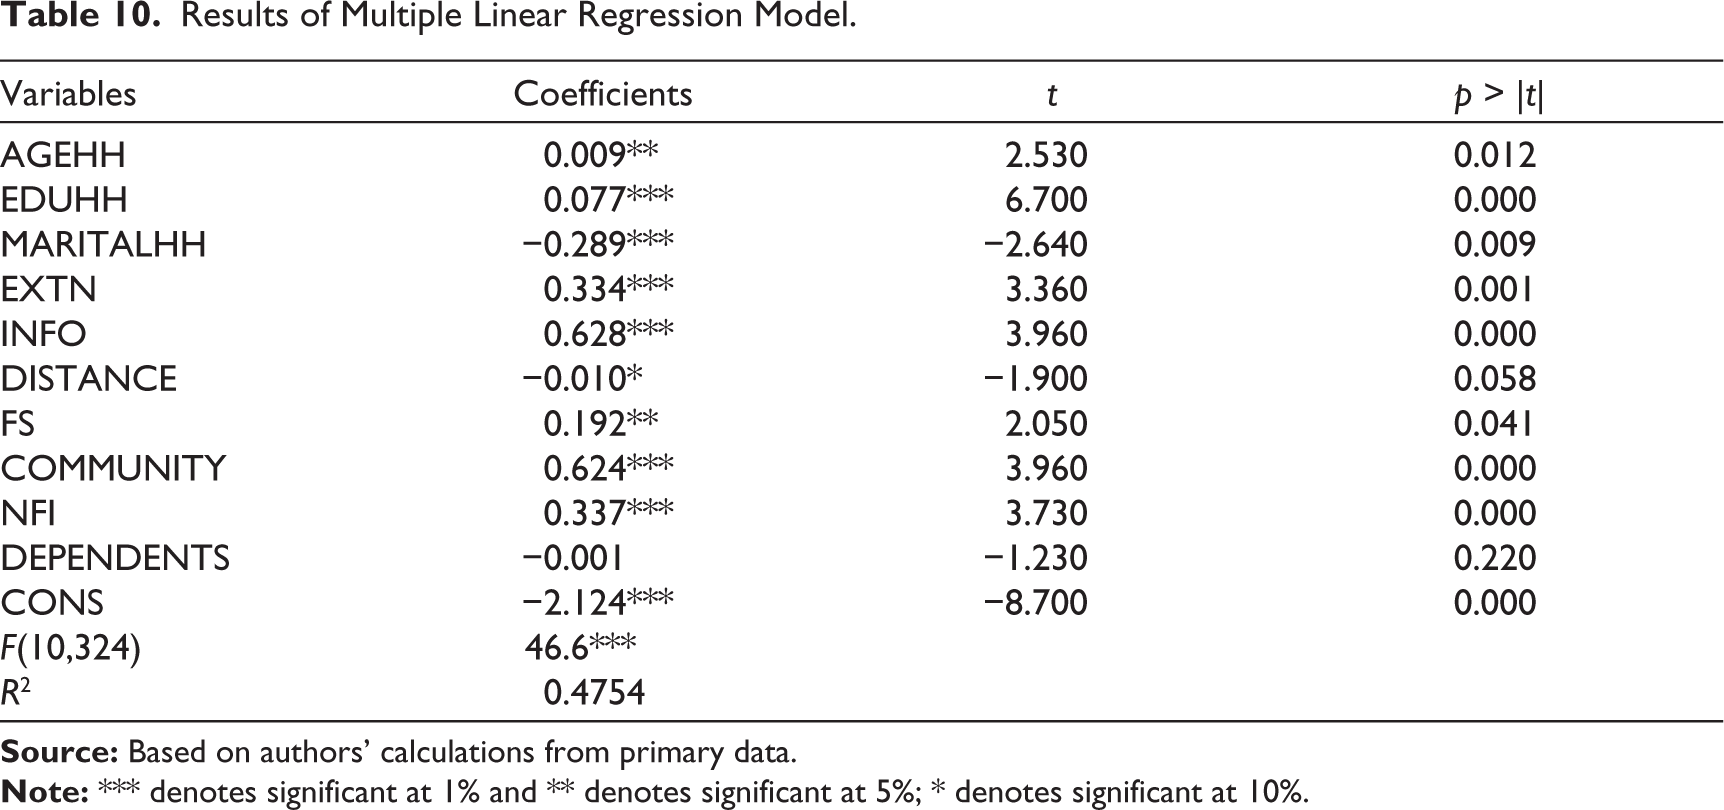
It is seen that the AGEHH has a positive and significant impact on CWI scores at 5% level of significance. This implies that the older the head of the household, the less the households suffer from multidimensional poverty in the study area. The probable explanation for such a finding is that over the years, elder growers can accumulate assets, and they also have family support from their adult children, who can contribute to the joint income of the family. The completed years of education by the household heads (EDUHH) have a positive and significant coefficient at 1% level of significance. This indicates that the higher the years of education of the head of the household in the study area, the households are less susceptible to multidimensional poverty. This finding suggests that education is a part of human development and improves human capital. Educated heads of farming families can make more efficient decisions regarding resource use and show better financial management, which helps to increase productivity and generate income. Furthermore, the marital status of the household heads (MARITALHH) has a negative and significant coefficient at 1% level of significance. This result indicates that households with married heads are experiencing higher levels of multidimensional poverty in the study region. One possible explanation for this is that married heads are more likely to have children and a family to provide for, meaning they are supporting more individuals with a limited income. Consequently, this leads to a decrease in per-capita consumption, access to healthcare, education, food, clothing and shelter for the entire family, thereby causing multidimensional poverty. Access to extension services (EXTN) by farming households has a positive and significant impact on CWI scores at 1% level of significance. Such a finding signifies that households receiving extension services in the study area, which include input supply, training, technological assistance, information on off-farm income sources and logistical support, tend to experience lower levels of multidimensional poverty. As a result, the services offered by government and producer organisations help farmers enhance their production and productivity, optimise cropping patterns and improve resource management, leading to higher incomes. Additionally, access to up-to-date price and market information (INFO) by farming households has a positive and significant coefficient at 1% level of significance. This suggests that households with access to regular prices and market information are less likely to experience multidimensional poverty in the study region. This is due to the fact that households with updated prices and market information can help farmers identify better market channels, allowing farmers to increase their income. As a result, these higher earnings can be invested in education, healthcare and housing facilities, thus contributing to a decrease in multidimensional poverty. Moreover, the farm size of the households (FS) has a positive and significant coefficient at 5% level of significance. This implies that farming households in the study area having larger farm sizes are likely to suffer less from multidimensional poverty. This is because larger farm sizes allow farmers to produce more output and generate greater revenue. Cultivators with larger farms often have better access to markets since they can produce in larger quantities and meet market standards more efficiently. This leads to more sales opportunities and better prices for their produce. Since the cultivators in the study area use a mixed cropping system, which means they grow multiple horticultural crops in addition to pineapple, larger farm sizes aid in crop diversification, which helps to earn income throughout the year, boosts financial stability and can manage risks related to crop failure. The ethnicity of the farming households (COMMUNITY) has a positive and significant impact on CWI scores at 1% level of significance. This suggests that households within the Hmar community are likely to experience lower levels of multidimensional poverty. This is due to the fact that previously, only Hmar growers have been cultivating pineapple in the region for over five decades, while growers from other tribal communities have only recently begun farming. Consequently, the Hmar growers have developed skills and experience over time, enabling them to accumulate assets and diversify their production. As a result, Hmar households face lower multidimensional poverty compared to other tribal households in the study area. Lastly, access to NFI has a positive and significant coefficient at 1% level of significance. This indicates that farming families in the study region who have access to non-farm activities are less vulnerable to multidimensional poverty. The reason behind such findings is that the members of farming households who are also engaged in non-farm activities in addition to farming, namely daily labour, salaried jobs and businesses, are able to generate income from several sources and maximise family income.
Conclusion and Policy Recommendations
Lakhipur sub-division in Cachar district, located in the southern part of North-East India, is a treasure house for organically grown horticultural crops. Among these horticultural products, the pineapple cultivated in this region stands out for its unique sweetness and juiciness. Nonetheless, mere cultivation of horticultural crops does not guarantee a favourable economic outcome for farmers. The study finds that the economic condition of the local pineapple producers is far from satisfactory. Thus, while one-fifth of the sample households are afflicted by monetary poverty, a much higher number suffer from multidimensional poverty. More than half of the indigenous tribal households lack access to sanitation, while two-thirds do not have an improved source of drinking water within household premises. Health services, such as the availability of a health centre in close proximity, are also lacking. Access to public and private health insurance is found to be extremely limited, reflecting the limited capacity of households to cope with health shocks. Although deprivation in terms of cooking gas and housing is relatively less, many households do not have access to these fundamental requirements of well-being. Asset poverty in terms of ownership of durable consumer goods is also high, indicating poor living standards. Consequently, from an economic policy standpoint, it is essential to implement effective targeted measures that address both monetary poverty and multidimensional poverty. The situation requires government intervention to enhance not only the production of horticultural crops and the income of farming families but also to invest in healthcare services, education and the overall quality of life of the indigenous tribal communities in the study area. The results indicate that households that depend solely on farming experience greater poverty than households with diversified sources of income. Thus, attempts should be made to provide livelihood support to the farming households through minimum support prices and crop insurance. At the same time, opportunities to realise higher incomes through the strengthening of market networks, improving village connectivity and the dissemination of better information regarding marketing opportunities and prices need to be promoted. Better access to training and extension services may result in better economic outcomes through greater efficiency in resource use and higher returns from farming. This becomes important in view of the fact that nearly half of the sample households do not have access to such services. Establishment of a processing unit along with cold storage facilities could help farmers in the area to diversify their agribusiness and to raise their incomes. This would also create additional job opportunities for local youth, thus lifting farming families out of poverty and reducing the income disparities that exist among them.
Footnotes
Declaration of Conflicting Interests
The authors declared no potential conflicts of interest with respect to the research, authorship and/or publication of this article.
Funding
The authors received no financial support for the research, authorship and/or publication of this article.