
Abstract
This research analyses the interplay of caste and gender concerning multidimensional poverty among agricultural labourers in India’s 15 agro-climatic zones. It analyses data of the National Family Health Survey rounds 4 (2015–2016) and 5 (2019–2021), focusing on 51,426 and 50,895 agricultural workers, respectively. The Alkire–Foster method, in accordance with the global Multidimensional Poverty Index, evaluates the levels of vulnerable multidimensionally poor, multidimensionally poor and severely multidimensionally poor across the dimensions of education, health and standard of living. Intersectionality analysis examines the connections between multidimensional poverty and variables related to gender and caste. Findings indicate the widespread existence of disparities in multidimensional poverty related to gender and caste. Women exhibit a higher likelihood of experiencing poverty compared to men, although the disparity has slightly decreased during 2015–2016 to 2019–2021. Scheduled Tribes exhibit markedly higher poverty probabilities in comparison to Scheduled Castes, whereas Other Backward Classes and General categories demonstrate reduced poverty likelihood. The models demonstrate strong statistical significance (p < .05) and account for a small yet meaningful proportion of the variance in poverty. This study enhances the comprehension of the intricate relationships between gender, caste and regional influences in determining multidimensional poverty among agricultural workers in India, underscoring the necessity for focused interventions to tackle these enduring disparities.
Introduction
According to Census 2011, the total number of agricultural workers in the country has increased from 234.1 million (127.3 million cultivators and 106.8 million agricultural labourers) in 2001 to 263.1 million (118.8 million cultivators and 144.3 million agricultural labourers). However, the share of the workforce engaged in the agriculture sector (comprising cultivators and agricultural labourers) has come down from 58.2% in 2001 to 54.6% in 2011. According to the Census 2011, 65% of the total female workers are engaged in agriculture alone, and 30.3% of the total cultivators are female in India. India’s labour market shows significant gender disparities in favour of males, where the labour force participation rate (LFPR) has increased from 75.5% to 78.8% during 2018–2023, while female LFPR rose dramatically from 24.5% to 41.7% during the same period (Ministry of Statistics and Programme Implementation, 2024). In agriculture, gender distribution reveals stark differences, with 38.1% of male workers engaged in the sector compared to 62.9% of female workers (National Statistical Office, 2023). This concentration of women in agriculture highlights the sector’s critical importance for female livelihoods despite overall employment diversification trends. Caste-based discrimination and poor infrastructure make agriculture subject to socio-economic challenges, prolonging multidimensional poverty.
According to the 77th round of the National Sample Survey Office (NSSO), pronounced caste-based disparities exist in agricultural land ownership in India. Scheduled Caste (SC) households possess only 9.5% of total agricultural land, while Scheduled Tribes (ST) account for 14%. In contrast, Other Backward Classes (OBC) and socially dominant ‘Other’ castes control 48% and 29% of agricultural land, respectively. These figures illustrate the persistent marginalisation of SC in both landholding and agricultural income and underscore the enduring influence of caste in shaping agrarian inequality and access to productive resources (D’Souza & Arora, 2022; National Statistical Office, 2021). Lastrapes and Rajaram (2016) demonstrate that caste significantly influences poverty outcomes in India, with stronger effects than gender, though their intersection creates compounded disadvantages for lower-caste women in agriculture (Roy, 2024). Agricultural workers in India experience multidimensional vulnerabilities extending beyond income poverty, such as seasonal employment instability and exposure to climate risks (Murthy et al., 2008). Additionally, landlessness and insecure tenancy arrangements intensify these socio-economic challenges, especially for marginalised caste groups (Rawal, 2008). The conceptual distinction between vulnerability and poverty requires clarification, as vulnerability represents a dynamic, forward-looking measure of susceptibility to future welfare losses, while poverty constitutes a static assessment of current deprivation status (Alwang et al., 2001; Chambers, 1989; Fujii, 2016). Vulnerability encompasses the probability and magnitude of potential future harm due to external shocks, reflecting households’ capacity to cope with and recover from adverse events, whereas multidimensional poverty measures existing deficits across health, education and living standards dimensions at a specific point in time (Alkire & Foster, 2011; Dercon, 2006). Moreover, vulnerability analysis examines households’ differential exposure, sensitivity and adaptive capacity to poverty-inducing shocks rather than merely documenting current poverty status (Füssel, 2007; Ligon & Schechter, 2003; Zhou et al., 2022).
Current literature lacks comprehensive studies examining how these intersections manifest across India’s diverse agro-climatic zones, where regional variations in agricultural systems and institutional arrangements create different patterns of exclusion (Borooah et al., 2014). Future research should develop context-specific multidimensional poverty indices incorporating caste and gender dimensions to inform targeted interventions that address the unique vulnerabilities of marginalised agricultural workers across India’s varied ecological and sociocultural landscapes (Sheth, 2023). Agricultural development and income potential depend on rural infrastructure, including irrigation, roads and electricity. Despite its importance for food security, agriculture has low wages, seasonal work and no social protection. These reasons lower agricultural labourers’ education, health and living standards (Mehta & Shah, 2003). FAO (2020) states that 30% of the rural population in developing nations is poor and lacks education and living standards. Substantial rural multidimensional poverty exists in the Yellow River Basin (Wu et al., 2023) and Barak Valley, Assam (Ghosh, 2013). Low productivity, water scarcity and diversification hinder India’s agricultural poverty reduction (World Bank, 2012). Improving watershed management, irrigation and livestock production can boost rural livelihoods. Research shows that 1% increase in agricultural output per capita reduces rural poverty by 0.97% (Kumar & Arya, 2019). To increase agricultural productivity and reduce poverty, irrigation, rural infrastructure, education, change in land use pattern and rural funding are needed. Caste and gender marginalise agricultural labourers, making them more vulnerable to multidimensional poverty. By reducing agricultural output, climate change and environmental deterioration threaten these people’s livelihoods. This study investigates Indian agricultural labourers’ struggles and poverty across agro-climatic zones. This study uses Rai et al.’s (2008) Livelihood Status Index (LSI) to assess agro-climatic zone development disparities in agricultural, nutritional, economic, health, sanitation, infrastructure and food availability. Moreover, it addresses multidimensional poverty—education, health and living standards—to inform policy and help Indian agricultural workers succeed.
Literature Review
The conceptualisation of poverty has evolved from a narrow income-based perspective to a multidimensional framework that captures diverse deprivations affecting well-being. Sen’s (1999) capabilities approach was pivotal in this shift, emphasising the importance of fundamental capabilities over mere income. This perspective underpins the Multidimensional Poverty Index (MPI), which offers a more nuanced understanding of poverty (Alkire & Santos, 2014; Alkire & Seth, 2015). In India, multidimensional measures have revealed a significant decline in poverty—from 62.2% in 2005–2006 to 38.4% in 2015–2016 (Alkire et al., 2021b)—but progress remains uneven, especially among agricultural workers.
Regional disparities are pronounced, with the Eastern and Central regions, characterised by rain-fed agriculture, experiencing slower poverty reduction compared to the North (Das et al., 2021; Tripathi & Yenneti, 2020). These differences are shaped by agro-climatic conditions, agricultural productivity and infrastructure. Agricultural workers’ vulnerability is further heightened by limited access to education, healthcare and productive assets, as well as the absence of robust social protection and the seasonality of employment (Sharma et al., 2021; FAO, 2020). Climate change and extreme weather events, such as droughts and floods, exacerbate these risks, particularly for rain-fed farming households (Das, 2023; Ogutu & Qaim, 2019). Inadequate financial resources and reliance on informal credit perpetuate cycles of poverty.
Social identity, especially gender and caste, plays a critical role in shaping poverty outcomes. Women face compounded disadvantages due to wage discrimination, limited land rights and exclusion from decision-making (Agarwal, 1994; Jerumeh, 2024). Caste-based discrimination restricts access to resources and opportunities for marginalised groups, sustaining their deprivation (Nayak & Jatav, 2023a; Septa et al., 2022; Thorat & Newman, 2007). These intersecting inequalities intensify the vulnerability of women from marginalised castes (Deshpande, 2007).
Policy interventions such as MGNREGA have provided some relief through employment generation, but have not fully addressed the multidimensional deprivations in education, health and essential services (Gualtieri, 2016). The literature underscores the need for integrated strategies that combine rural infrastructure, irrigation, crop diversification, access to credit and climate-smart agriculture to enhance resilience (Ali et al., 2022; Das, 2023). Effective poverty reduction requires linking economic development with education, healthcare, social protection and climate adaptation (Adepoju & Oyewole, 2020; Bhattarai, 2014; Shimeles, 2019).
Recent studies highlight the necessity of agro-climatic zone-specific analyses, as poverty varies significantly across regions and is influenced by local conditions (Ali et al., 2015; Khan & Shah, 2019; Wang et al., 2021). Such targeted approaches enable efficient resource allocation and support the achievement of the Sustainable Development Goals (Fiore et al., 2024). Jatav and Singh (2025) demonstrated substantial spatial variation in MPI across India’s agro-climatic zones, with persistent rural–urban disparities despite overall progress.
Despite a general decline in multidimensional poverty in India, agricultural workers continue to experience disproportionately high levels of deprivation, especially in environmentally vulnerable and infrastructure-deficient regions. This underscores the necessity for agro-climatic zone-specific analyses to understand the complex interplay of socio-economic and environmental factors shaping poverty among this group. Notably, there is a significant gap in research examining how caste and gender intersect to influence multidimensional poverty among agricultural labourers across different agro-climatic zones.
To address this gap, the present study provides the first comprehensive assessment of caste and gender disparities in multidimensional poverty among agricultural workers across India’s agro-climatic zones, utilising NFHS-4 and NFHS-5 data. By foregrounding intersectional vulnerabilities, this research advances understanding of the spatial and social heterogeneity of rural poverty and offers critical policy insights for designing targeted interventions to support the most marginalised agricultural communities.
Methodology
Conceptual Framework
The complex interrelationships between agriculture, climatic regions and multidimensional poverty of agricultural workers can be conceptualised through several complementary theoretical frameworks.
The capabilities approach, initially developed by Sen (1999) and later expanded by Nussbaum (2011), marked a significant shift from income-based poverty measures to a multidimensional understanding of well-being, emphasising the freedoms and capabilities of individuals, including agricultural workers, to achieve valued functions. Building on this theoretical foundation, Morton (2007) applied the capabilities perspective to smallholder agricultural systems, illustrating its relevance for understanding the complex linkages between climate, agriculture and poverty. Subsequently, Adger et al. (2007) and the Intergovernmental Panel on Climate Change (IPCC, 2014) advanced the climate vulnerability framework, conceptualising vulnerability as a function of exposure, sensitivity and adaptive capacity, thereby providing a structured approach to analysing how climatic and socio-economic factors interact to produce differential vulnerabilities among agricultural populations. Further operationalising multidimensional analysis, Alkire and Foster (2011) developed methodological tools for measuring multidimensional poverty, enabling the assessment of deprivations across multiple dimensions pertinent to agricultural workers.
Recent research continues to elucidate the complex and dynamic interactions among climatic regions, agricultural systems and multidimensional poverty. Contemporary research highlights that climatic variables—including temperature fluctuations, shifting precipitation patterns and the intensification of extreme weather events—exert profound and regionally differentiated effects on agricultural productivity. Empirical studies demonstrate that rising temperatures and erratic rainfall increasingly disrupt crop yields, water availability and the duration of growing seasons, with the magnitude and direction of these impacts varying by both geographical context and crop type (Abebaw, 2025; Habib-ur-Rahman et al., 2022; Hultgren et al., 2025). Notably, the spatial heterogeneity of climate impacts is evident, as some regions experience severe crop losses while others may benefit from offsetting factors such as increased rainfall (Hultgren et al., 2025; Yuan et al., 2024).
In parallel, access to agricultural resources and the security of land tenure have emerged as critical determinants of livelihood outcomes for agricultural workers. Recent empirical evidence underscores the importance of inclusive and secure land rights in promoting long-term investment, enhancing productivity and reducing vulnerability to poverty. These institutional arrangements also have significant implications for gender equity and the dynamics of urban–rural development (Mbudzya et al., 2022; Nchanji et al., 2023; Pierri et al., 2025).
Theoretically, these findings are situated within frameworks that conceptualise the dynamic interplay between climatic factors and agricultural systems as central to shaping multidimensional poverty. Climatic influences—such as temperature regimes, precipitation variability and extreme weather—directly affect agricultural productivity through their impacts on crop yields, water resources and growing periods. Agricultural systems, in turn, are defined by their crop productivity potential, farming practices, mechanisms of resource access and land tenure structures, all of which mediate the effects of climate on livelihood security and vulnerability (Kerr et al., 2019).
The conceptual framework thus posits that agricultural workers’ vulnerability is shaped by the dynamic interaction between climatic conditions, agricultural systems and multidimensional poverty (Agrawal & Carmen Lemos, 2015; Ribot, 2017). These interactions produce various outcomes, including food insecurity, migration, livelihood diversification and debt cycles (Barrett et al., 2001; Nayak & Jatav, 2023b), which can reinforce intergenerational poverty traps (Carter & Barrett, 2006). Understanding these complex relationships requires an integrated approach that acknowledges both the structural determinants of vulnerability and the agency of agricultural workers in navigating and responding to climate-related challenges within their specific contexts (Eriksen et al., 2015; Tschakert et al., 2013).
Data, Sample Design and Size
This study employs data from the National Family Health Survey 2015–2016 (NFHS-4) and 2019–2021 (NFHS-5), which are comprehensive, nationally representative household surveys that collect information on diverse aspects of population, health and nutrition in India. These surveys utilise a cluster sampling method 1 to select households and individuals for interviews. The selection of the 15 zones is based on the Indian Council of Agricultural Research (ICAR) classification, which provides a comprehensive framework for analysing agricultural and socio-economic diversity across India. As spatial characteristics are a concern, the Himalayan region has been distributed into two agro-climatic regions, namely Western Himalayan Region (WHR) and Eastern Himalayan Region (EHR), and covers about 18.44% of the geographical area. The Gangetic Plain Region has been distributed into four agro-climatic zones, namely Lower Gangetic Plain Region (LGPR), Middle Gangetic Plain Region (MGPR), Upper Gangetic Plain Region (UGPR) and Trans Gangetic Plain Region (TGPR), and covers about 15.89% of the geographical area. The Plateau and Hills region has been distributed into four agro-climatic regions, namely Eastern Plateau and Hills Region (EPHR), Central Plateau and Hills Region (CPHR), Western Plateau and Hills Region (WPHR) and Southern Plateau and Hills Region (SPHR), and covers 44.19% of the geographical area. The Coastal Plains and Hill region has been distributed into two regions, namely East Coast Plains and Hills Region (ECPHR) and West Coast Plains and Hills Region (WCPHR), and covers 9.69% of the geographical area. While Gujarat Plains and Hills Region (GPHR) and Western Dry Region (WDR) jointly cover about 11.53% of the geographical area, and the Island Region (IR) covers 0.26%. This study aims to evaluate the vulnerable multidimensionally poor agricultural workers to severe multidimensionally poor agricultural workers. This study examines data from 51,426 agricultural workers in NFHS-4 and 50,895 agricultural workers in NFHS-5, all located across agro-climatic zones.
Indicators and Weights
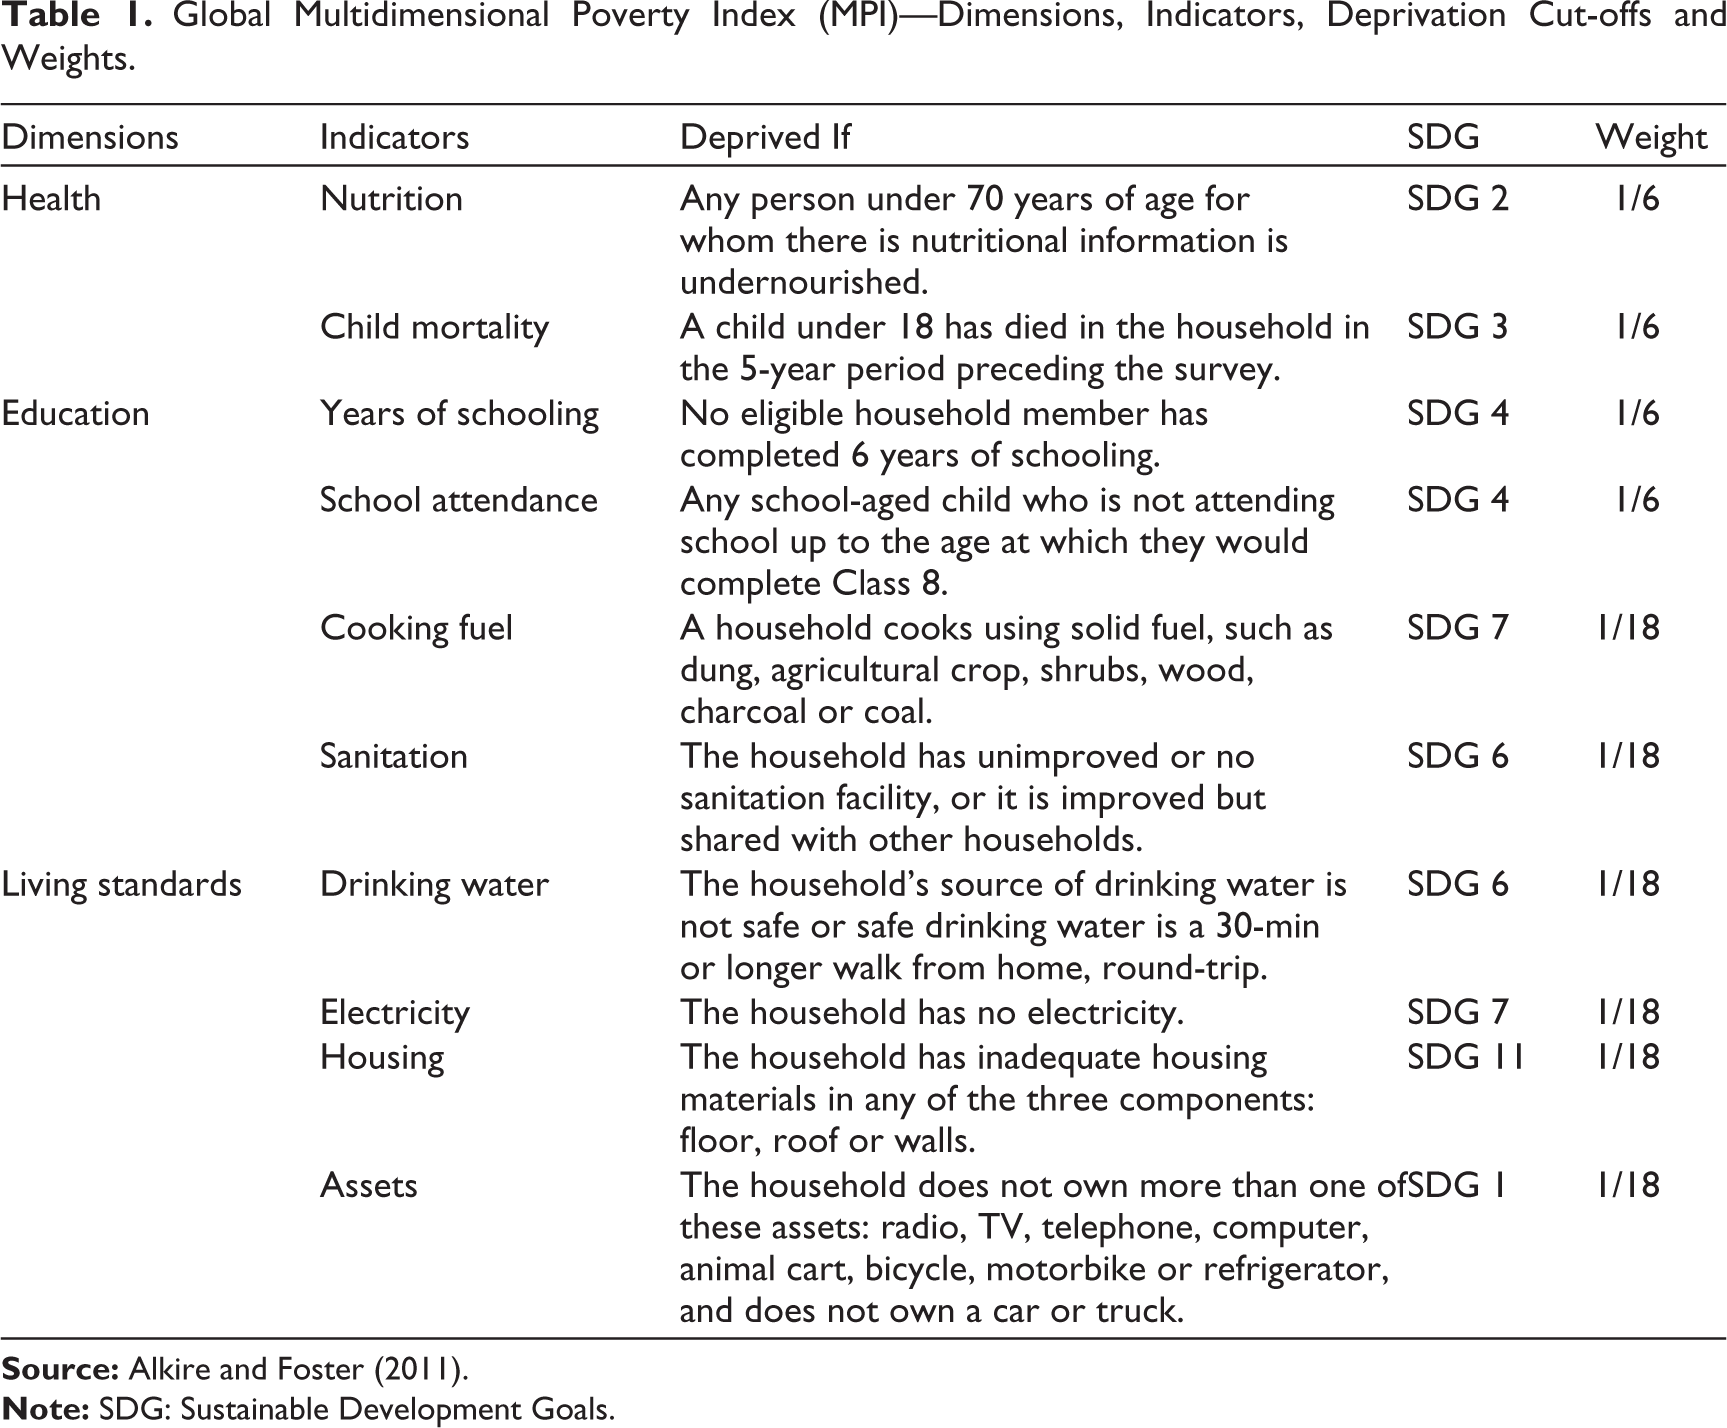
The Alkire–Foster method (2011), aligned with the global MPI, is utilised to assess vulnerable multidimensionally poor, multidimensionally poor and severely multidimensionally poor among agricultural workers. Table 1 in the study presents the indicators and weights utilised to assess the MPI, a composite index that allocates equal weights (1/3) to three dimensions: education, health and standard of living. The MPI allocates equal weights of 1/6 to both years of schooling and school attendance within education. The health dimension is evaluated through two indicators: child mortality and nutrition, both assigned a weight of 1/6. The standard of living dimension includes six indicators: electricity, sanitation, water, housing, cooking fuel and assets, each assigned a weight of 1/18. The MPI is determined by the geometric mean of the normalised scores across three dimensions.
Global Multidimensional Poverty Index (MPI)—Dimensions, Indicators, Deprivation Cut-offs and Weights.
Justification for Additional Indicators
The selection of the 10-indicator under the Oxford Poverty and Human Development Initiative (OPHI) framework over NITI Aayog’s 12-indicator approach for estimating MPI among agricultural workers across agro-climatic zones requires methodological justification grounded in both theoretical and practical considerations. The OPHI framework, developed by Alkire and Foster (2011), provides international comparability and has been extensively validated across diverse contexts, ensuring robust cross-regional analysis essential for agro-climatic zone comparisons (Alkire & Santos, 2014). While NITI Aayog’s framework includes additional indicators, such as bank account access and maternal health, the OPHI’s parsimonious approach reduces indicator redundancy and multicollinearity issues that can distort MPI calculations, particularly relevant when examining heterogeneous agricultural populations across varied ecological zones (Alkire et al., 2015). However, the standard OPHI framework’s limitation lies in its insufficient attention to agriculture-specific deprivations that critically affect rural livelihoods. To enhance analytical relevance for agricultural workers, future research should consider incorporating agriculture-specific indicators such as access to irrigation facilities, agricultural credit availability, crop insurance coverage and climate-resilient farming practices, as these factors directly influence agricultural households’ multidimensional well-being and vulnerability to poverty (Birthal et al., 2015; Food and Agriculture Organization [FAO], 2018). The inclusion of such indicators would address Sabates-Wheeler and Devereux’s (2007) critique that generic poverty measures often fail to capture sector-specific vulnerabilities, while maintaining the methodological rigour necessary for cross-zone comparative analysis essential for spatially differentiated policy interventions.
Estimation Process of MPI
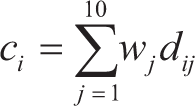
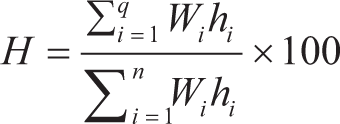
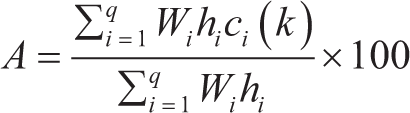
The weighted total of each person’s deprivation score across 10 indicators is used in this study. A score of 0 indicates no deprivation, while 1 indicates deprivation across all variables. Multidimensional poverty is defined as a 0.33 deprivation score or above. According to the global MPI, vulnerable multidimensionally poor, multidimensionally poor and severely multidimensionally poor are classified at 0.50, 0.33 and 0.20. Individual data are aggregated to gain household insights (Alkire & Foster, 2011). Multidimensional poverty in agro-climatic zones is measured by the MPI, headcount ratio (H) and intensity of poverty (A). The MPI measures poverty incidence and intensity by multiplying H with A. Headcount ratio (H) shows the percentage of multidimensionally poor people, signifying poverty. The average proportion of deprivations suffered by the poor indicates poverty intensity (A).
The aggregate deprivation score of the ith household (ci) is given by (Das et al., 2022):
Multidimensional headcount ratio (H) is the ratio of multidimensionally poor people to the total population. In percentage form, it is expressed as:
Intensity of multidimensional poverty (A) reflects the average deprivation score of the multidimensionally poor people. In percentage form, it is expressed as:
MPI is the ratio of the aggregate deprivation score of multidimensionally poor people to the total population.
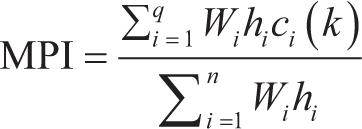
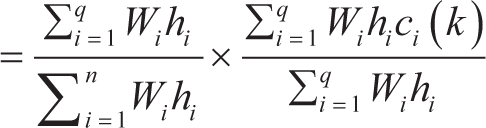

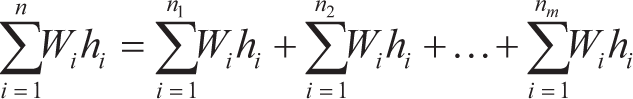
Total population constituted with hi and Wi can be decomposed as:
Intersectionality Analysis
Intersectionality analysis was chosen to examine caste and gender differences in multidimensional poverty among agricultural workers because of Crenshaw (1989), who conceptualised intersectionality as a framework for understanding how multiple systems of oppression interact to create unique marginalisation experiences. This method is especially significant in India, where caste and gender are the most common social stratifications (Deshpande, 2011). Traditional single-axis studies fail to convey the lived experiences of people who confront multiple, overlapping discriminations (Collins & Bilge, 2016). Dalit women who work as agricultural labourers are marginalised differently from Dalit men and upper-caste women (Rege, 2006). Intersectionality analysis examines compound disadvantages that additive oppression theories cannot. Traditional poverty assessments use ‘anticategorical’ or ‘intracategorical’ methods that reject social categories or focus on single categories (McCall, 2005). Intersectionality analysis examines linkages between numerous social groups and altering inequality using an intercategorical method (Hancock, 2007).
Indian caste is a distinct social stratification that connects with gender in various ways (Chakravarti, 2003). Thorat and Newman (2012) found that caste-based discrimination in India encompasses different mechanisms and gender-based exclusions. An intersectionality framework is needed to explain how these systems affect multidimensional poverty outcomes. Klasen and Wink’s (2003) study on gender and poverty in India and Borooah’s (2005) study on caste and poverty highlighted gaps that require intersectional research. Swaminathan (2007) claims that caste and gender hierarchies must be considered while studying women’s agricultural activities. In 2011, Alkire and Foster developed a credible paradigm for quantifying multidimensional poverty that may be used for intersectional research. This method allows researchers to examine how diverse social identities affect health, education and living standards in ways that single-axis analyses cannot (Alkire & Jahan, 2018). Caste and gender mediate sector-specific vulnerabilities for Indian agricultural labourers (Harriss-White, 2003). Pattenden (2016) found that caste and gender cause different patterns of exploitation and exclusion across agro-climatic zones in agricultural labour interactions. Intersectionality analysis shows patterns in caste–gender poverty outcomes that aggregated studies would hide (Yuval-Davis, 2006). The diversity of experiences within large social groups makes this crucial. The paradigm acknowledges that identity categories may vary spatially and allows intersectional effects to be examined across India’s distinct agro-climatic zones (Valentine, 2007). This spatial dimension is essential for understanding regional poverty patterns. NFHS-4 and NFHS-5 data (2015–2019) can be used in an intersectionality framework to examine how intersectional effects vary over time and determine whether development initiatives are diminishing or exacerbating intersectional inequities (Cho et al., 2013). Intersectionality analysis helps create policy responses for multiply marginalised populations (Hankivsky, 2012). In India’s agricultural industry, policies routinely ignore Dalit women agricultural workers’ compound disadvantages (Rao, 2017).
This study investigates the intersectionality of caste and gender in shaping multidimensional poverty among agricultural workers across India’s agro-climatic zones. The analysis utilises data from the NFHS-4 and NFHS-5 rounds, covering the period 2015–2019. To account for the complex interplay of various factors, the study incorporates control variables such as age, landholding size, household size, agro-climatic region and year of survey. The intersectionality equation is formulated to capture the interaction effects of caste and gender, alongside these control variables (Gujarati & Porter, 2009; Kumar & Sahoo, 2024; Sarkar et al., 2020).
The equation for multidimensional poverty is specified as follows:
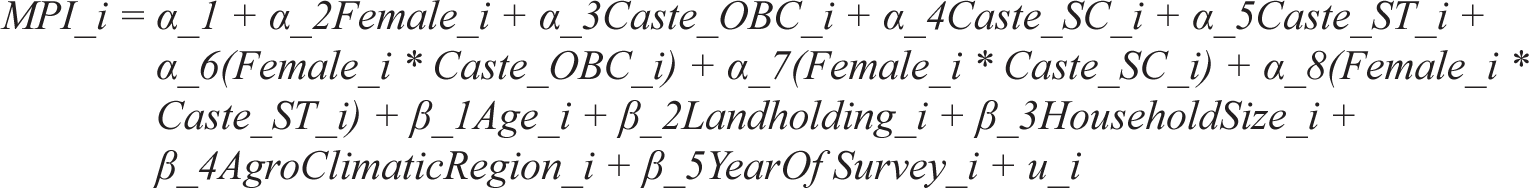
Variable definitions:
Interpretation of coefficients:
This methodological framework allows for a nuanced understanding of how caste and gender intersect to influence multidimensional poverty, while also accounting for the role of demographic, economic and regional factors. The inclusion of interaction terms ensures that the unique disadvantages faced by women from marginalised castes are explicitly captured, providing a comprehensive analysis of intersectionality in the context of multidimensional poverty.
Analysis of Results
Results of Multidimensional Indicators
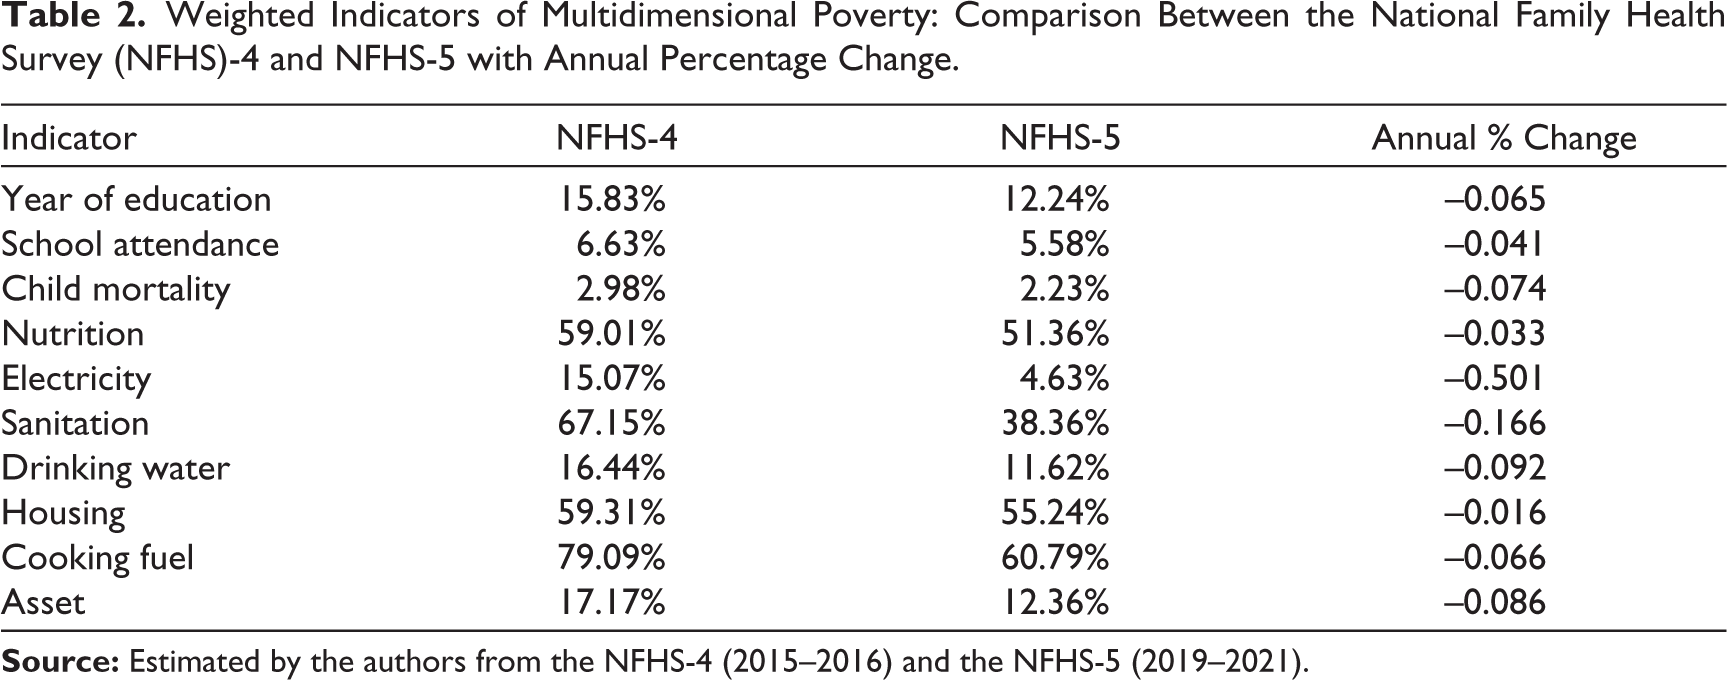
Table 2 presents a comparative overview of the weighted indicators of multidimensional poverty in India, drawing on data from the NFHS-4 (2015–2016) and NFHS-5 (2019–2021). The table details the percentage of deprivation for each indicator in both survey rounds, alongside the annual percentage change, thereby offering insights into the progress and persistent challenges in poverty reduction.
Weighted Indicators of Multidimensional Poverty: Comparison Between the National Family Health Survey (NFHS)-4 and NFHS-5 with Annual Percentage Change.
Educational Dimension
The proportion of households deprived in terms of years of education declined from 15.83% in NFHS-4 to 12.24% in NFHS-5, reflecting an annual percentage decrease of –0.065. Similarly, deprivation in school attendance dropped from 6.63% to 5.58%, with an annual reduction rate of –0.041. These trends suggest modest but consistent improvements in educational attainment and participation over the period.
Health Dimension
Child mortality, a critical health indicator, showed a reduction from 2.98% in NFHS-4 to 2.23% in NFHS-5, corresponding to an annual percentage decrease of –0.074. Nutritional deprivation, while still high, declined from 59.01% to 51.36%, with an annual change of –0.033. These improvements indicate progress in child survival and nutrition, though the persistently high rates of nutritional deprivation highlight ongoing challenges.
Living Standards Dimension
Significant progress is evident in several living standards indicators. The proportion of households lacking access to electricity fell sharply from 15.07% to 4.63%, representing the largest annual percentage decrease among all indicators at –0.501. Sanitation deprivation also saw a substantial decline, from 67.15% in NFHS-4 to 38.36% in NFHS-5, with an annual reduction of –0.166. Access to improved drinking water improved, as deprivation decreased from 16.44% to 11.62% (annual change: –0.092).
Housing deprivation experienced a more modest decline, from 59.31% to 55.24%, with an annual percentage change of –0.016. The use of clean cooking fuel improved, as deprivation fell from 79.09% to 60.79%, corresponding to an annual reduction of –0.066. Asset deprivation also decreased, from 17.17% to 12.36%, with an annual change of –0.086.
Overall, the data indicate notable improvements across most dimensions of multidimensional poverty between NFHS-4 and NFHS-5. The most pronounced gains are observed in access to electricity and sanitation, while progress in nutrition and housing remains comparatively slower. The annual percentage changes underscore the varying pace of improvement across indicators, with some dimensions—such as nutrition and housing.
Results of Headcount Ratio
Figure 1 displays heatmaps that depict the regional and gender-specific distribution of the Vulnerable Headcount Ratio (VHR), Poor Headcount Ratio (PHR) and Severe Headcount Ratio (SHR) derived from NFHS-4 and NFHS-5 data. The research indicates significant differences by gender and area, with a marked persistence and, in certain instances, exacerbation of vulnerability, poverty and severity among females relative to males. The VHR is highest among females in the MGPR during NFHS-4 (91.3%) and in the UGPR (85.2%), whereas the lowest ratios are recorded among males in the TGPR during NFHS-5 (30.1%). This pattern highlights the gendered aspect of vulnerability, with females consistently demonstrating higher vulnerability ratios than males across most areas and survey rounds.
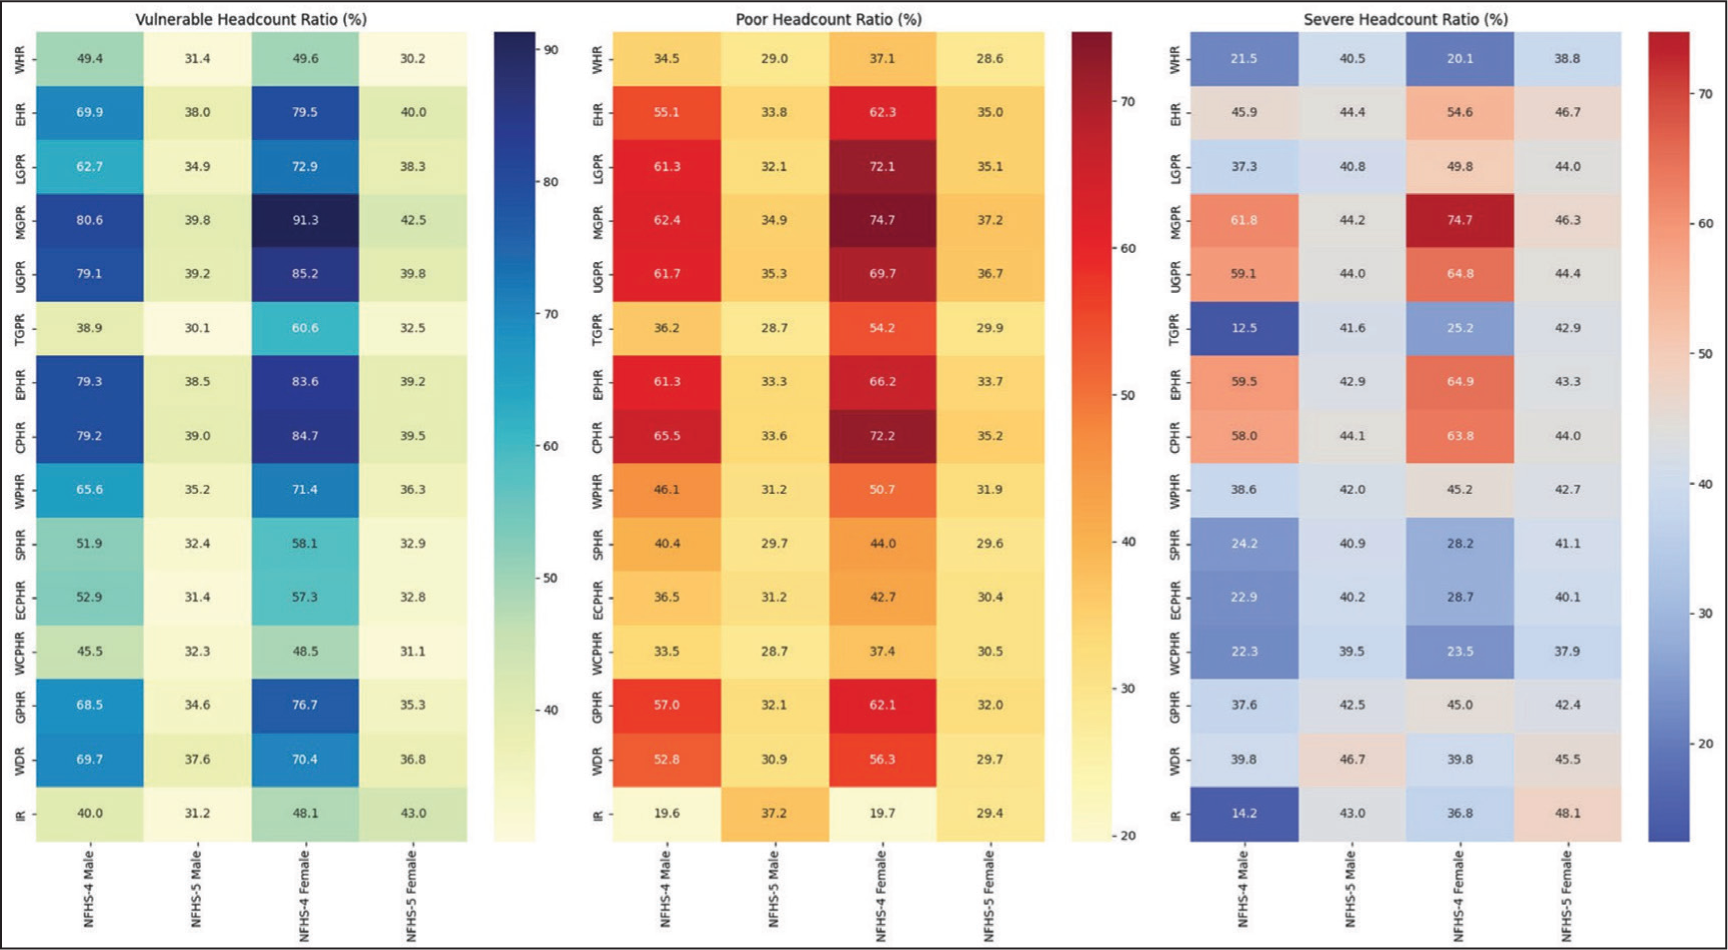
The PHR further highlights these discrepancies. The highest PHR for females is documented in the MGPR during NFHS-4 (74.7%), followed closely by the LGPR (72.1%) and the CPHR (72.2%). The lowest PHR is recorded among males in the IR during NFHS-5, at 19.6%. These findings indicate that, although there are general advancements in certain areas, the incidence of poverty continues to be disproportionately elevated among females, especially in particular places.
The SHR exhibits a comparable pattern, with the highest SHR recorded among females in the MGPR during NFHS-4 (74.7%) and the UGPR (64.8%). The lowest SHR is observed among males in the TGPR during NFHS-4 (12.5%).
Results of Intensity of Poverty
Figure 2 presents heatmaps that illustrate the intensity of vulnerability, poverty and severity across gender and regional dimensions, as quantified by the Vulnerable Intensity, Poor Intensity and Severe Intensity indices from the NFHS-4 and NFHS-5 survey rounds. The data indicate ongoing and, in certain instances, increasing gender and regional disparities in the extent of deprivation. The highest value for Vulnerable Intensity is recorded among females in the MGPR during NFHS-4 at 42.5%, followed by females in the CPHR at 39.5% and those in the LGPR at 38.3%. The lowest intensity among males in the TGPR is recorded at 28.7% during NFHS-5.
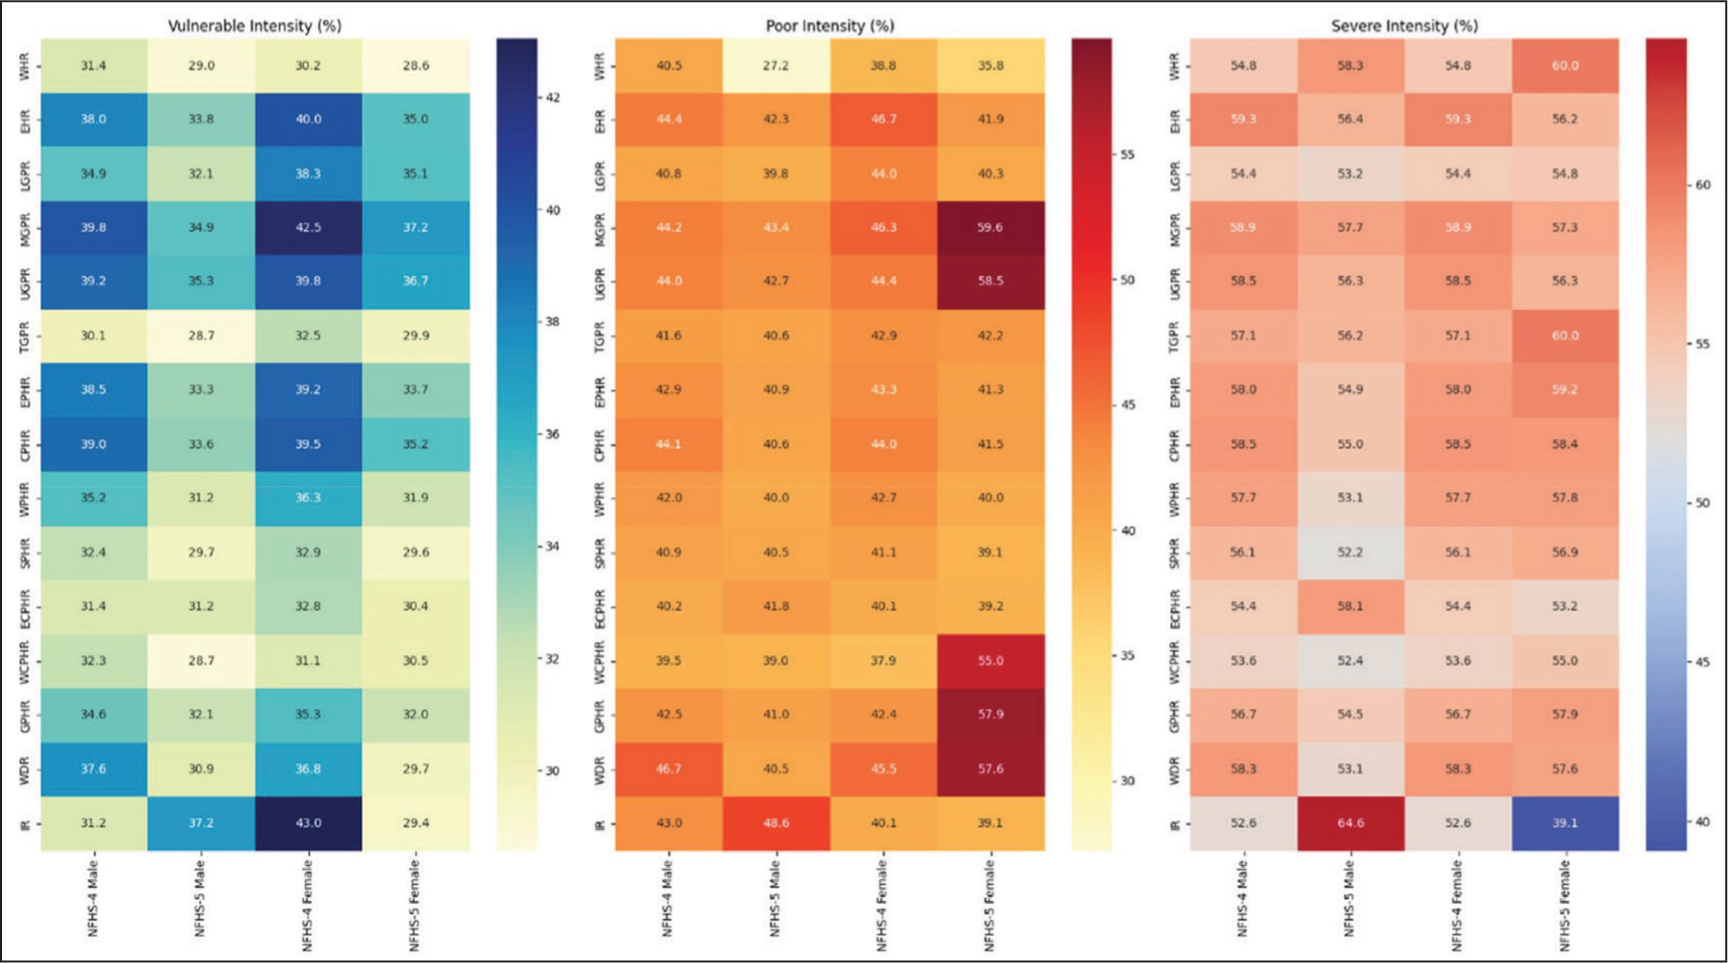
The Poor Intensity further highlights these disparities. The highest intensity is observed among females in the MGPR during NFHS-5 (59.6%), with comparable values in the UGPR (58.5%) and GPHR (57.9%). The lowest Poor Intensity is observed among males in the WHR during NFHS-5, recorded at 27.2%. This indicates that, although the number of individuals in poverty may decrease, the severity of poverty for those who continue to experience it—particularly among females in certain regions—remains significantly high.
The Severe Intensity underscores the extent of deprivation experienced by the severely poor. The highest percentage is observed among females in the IR during NFHS-4 (64.6%), followed by males in the same region (52.6%) and females in the MGPR (58.9%). The lowest level of Severe Intensity is recorded among females in the IR during NFHS-5, at 39.1%.
Results of MPI
Figure 3 displays heatmaps that provide an overview of the MPI across three categories: Vulnerable MPI, Poor MPI and Severe MPI. These are disaggregated by gender and region for the NFHS-4 and NFHS-5 survey rounds. The data indicate ongoing gender and regional disparities in multidimensional poverty, with females consistently showing higher MPI values than males across the majority of regions and survey periods.
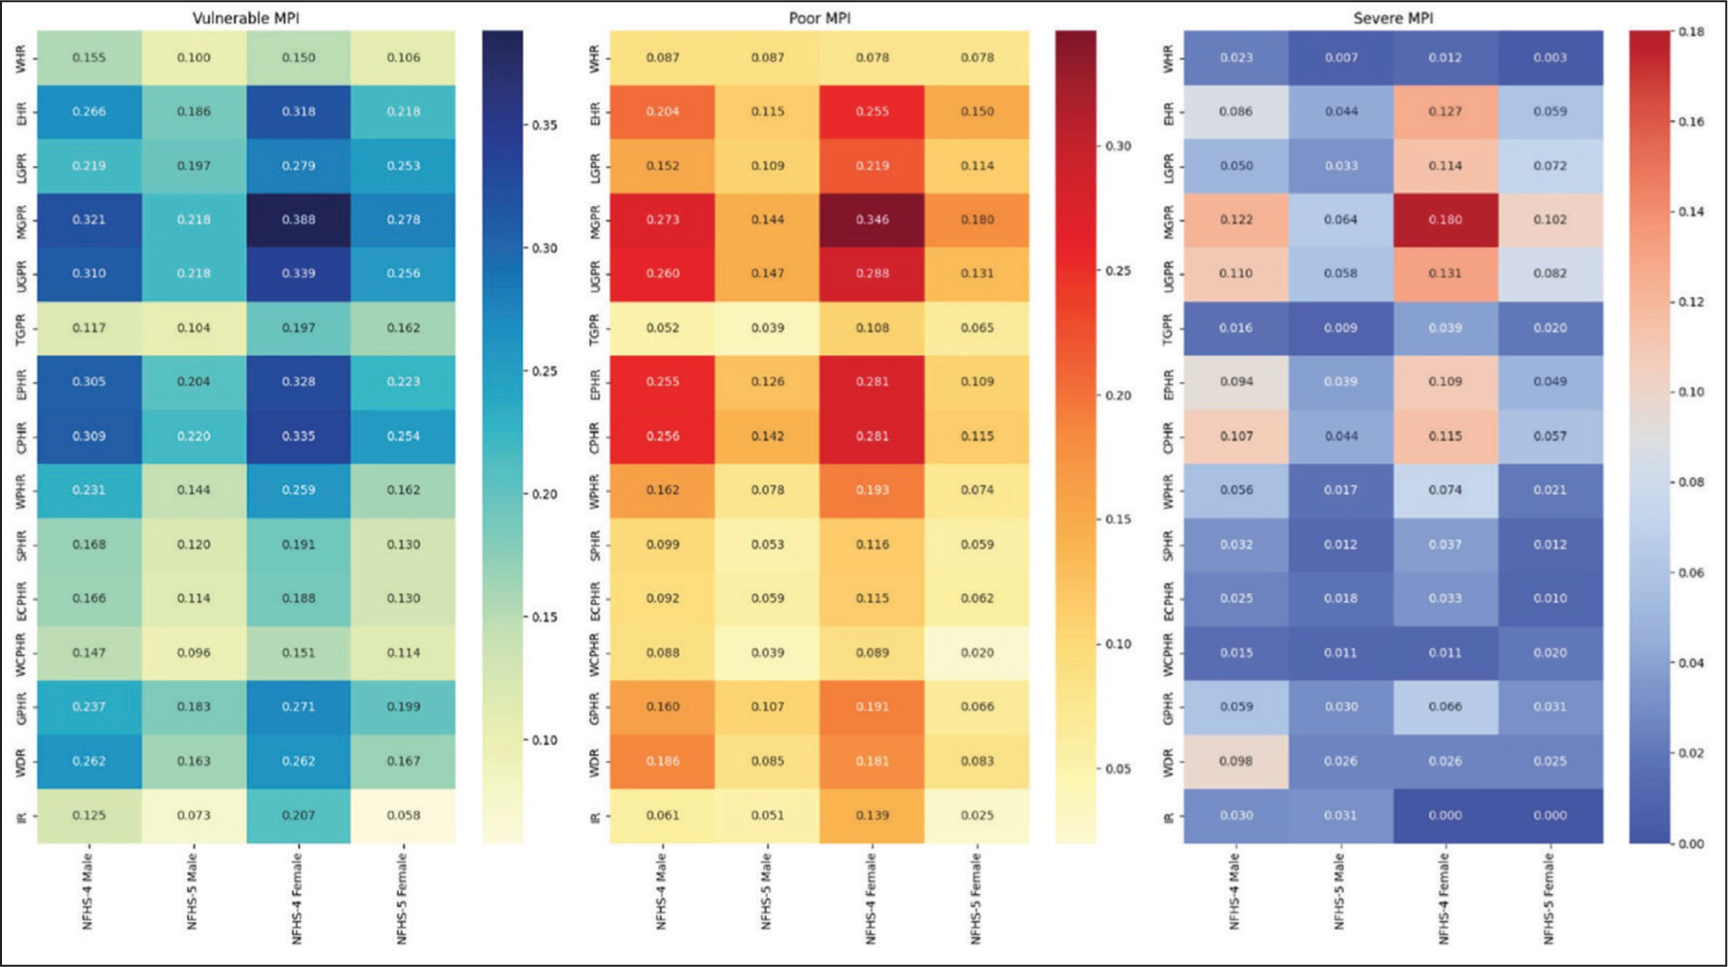
The highest value for Vulnerable MPI is recorded among females in the MGPR during NFHS-4 (0.388), followed by females in the UGPR (0.339) and the CPHR (0.335). The lowest Vulnerable MPI among males in the IR is recorded during NFHS-5 at 0.073. The findings suggest that, even within vulnerable populations, females in specific regions face a heightened level of multidimensional deprivation.
The highest value for Poor MPI is observed among females in the MGPR during NFHS-4 (0.346), with notable values in the CPHR (0.281) and UGPR (0.288). The lowest Poor MPI is recorded among males in the TGPR during NFHS-5, at 0.039. This indicates that, although the number of individuals in poverty may decrease, the severity and extent of poverty among those who continue to be poor— particularly women in certain areas—remains significant.
The Severe MPI heatmap underscores the extent of deprivation experienced by the severely poor. The highest value is observed among females in the MGPR during NFHS-4 (0.180), followed by those in the UGPR (0.131) and the CPHR (0.115). The lowest Severe MPI is recorded among females in the IR during NFHS-4 and NFHS-5, with a value of 0.000.
Figure 4 presents heatmaps that illustrate the VHR, PHR and SHR across various caste groups, regions and survey rounds (NFHS-4 and NFHS-5). The data indicate ongoing and significant disparities in multidimensional poverty and vulnerability, with SC, ST and OBC consistently showing higher headcount ratios than the General category across various regions and survey periods.
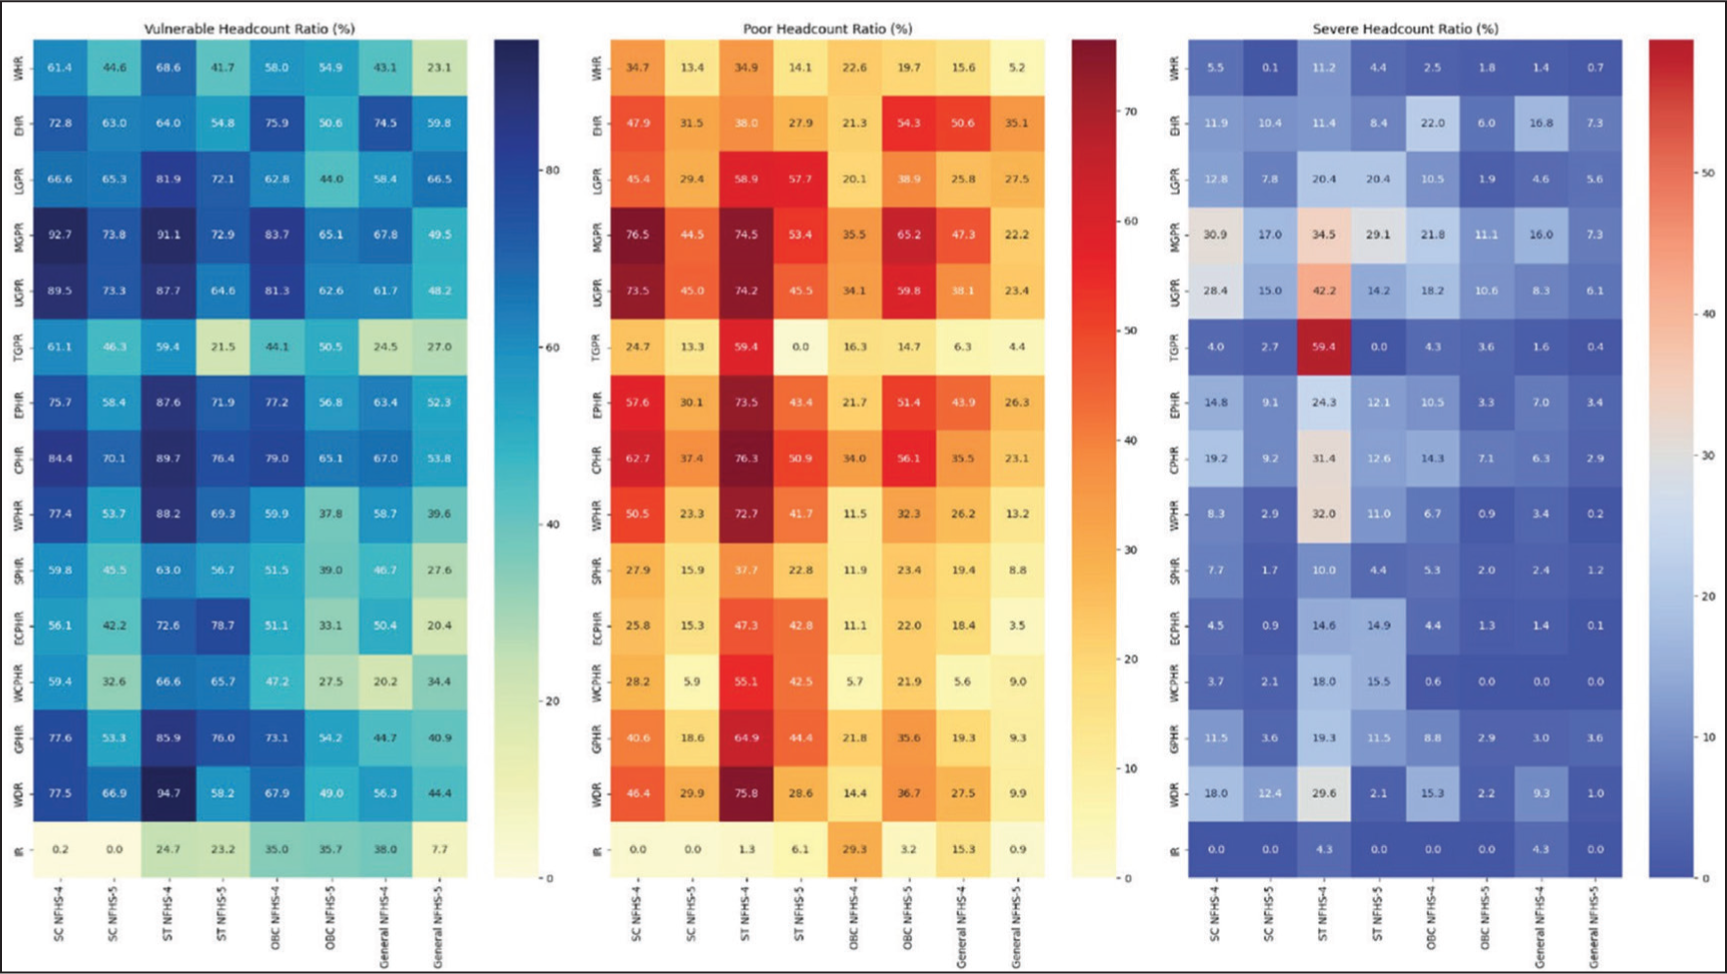
The VHR is highest among SC in the MGPR during NFHS-4, recorded at 92.7%, followed closely by ST in the same region at 91.1%. The General category in the R region exhibits the lowest VHR during NFHS-5, recorded at 7.7%.
The PHR highlights these disparities. The highest PHR is observed among SC in the MGPR during NFHS-4 (76.5%), followed by ST in the same region (74.5%) and OBC in the CPHR (76.3%). The General category in the IR exhibits the lowest PHR at 3.5% during NFHS-5. The findings indicate that, although there have been some advancements over time, the prevalence of poverty continues to be disproportionately elevated among SC, ST, and OBC, especially in specific regions.
The SHR exhibits a comparable trend, with the highest SHR recorded among ST in the TGPR during NFHS-4 (59.4%) and among SC in the UGPR (42.2%). The General category in the R region exhibits the lowest SHR during NFHS-5, recorded at 0.1%. The data suggest that, despite some improvements in headcount ratios over time, notable disparities related to caste and region remain evident.
Figure 5 presents heatmaps that visualise the intensity of vulnerability, poverty and severity across various caste groups, regions and survey rounds (NFHS-4 and NFHS-5). The data indicate that SC, ST and OBC consistently face greater levels of deprivation than the General category, with significant regional disparities observed.
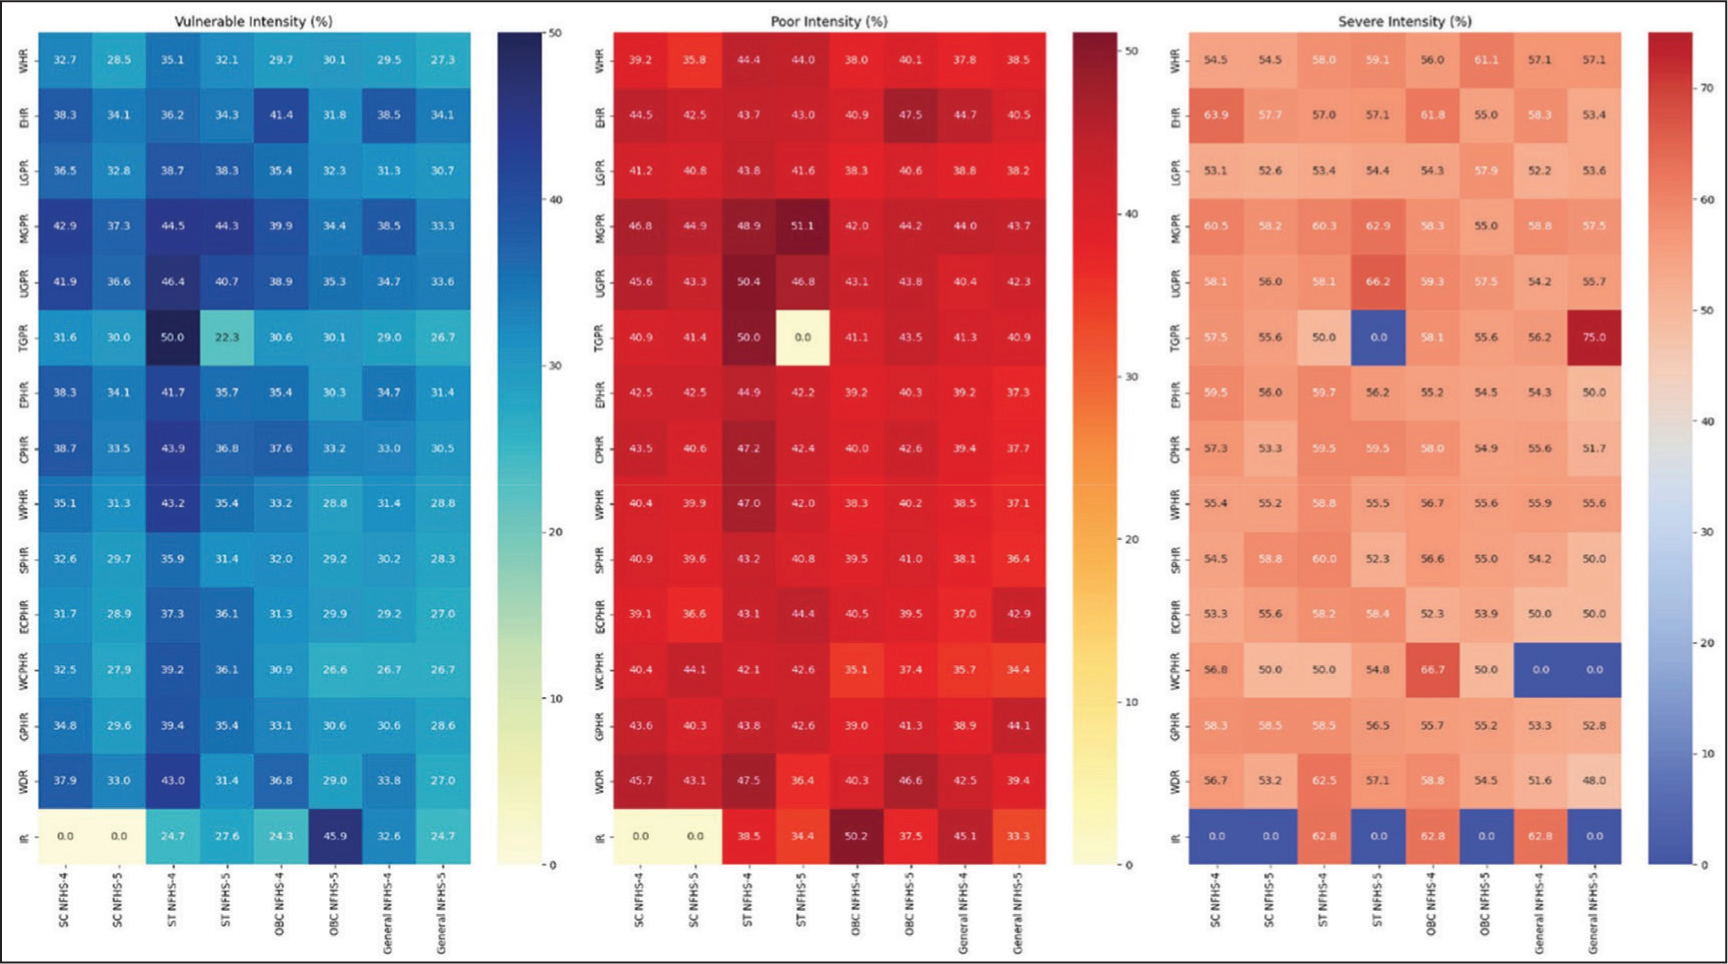
The highest value for Vulnerable Intensity is recorded among SC in the TGPR during NFHS-4 at 50.0%, followed by SC in the UGPR at 44.5% and OBC in the MGPR at 44.3%. The General category in the IR exhibits the lowest Vulnerable Intensity at 24.7% during NFHS-5.
The Poor Intensity further highlights these disparities. The highest intensity is observed among SC in the TGPR during NFHS-4 (50.0%), followed closely by SC in the UGPR (46.8%) and OBC in the MGPR (45.9%) regions. The General category in the IR exhibits the lowest Poor Intensity at 33.3% during NFHS-5. The findings indicate that although the percentage of individuals living in poverty may decrease, the severity of poverty for those who continue to be impoverished—particularly among SC, ST and OBC in specific areas—persists at a significant level.
The Severe Intensity indicates the extent of deprivation experienced by the severely poor. The highest value is observed among SC in the TGPR during NFHS-5 (75.0%), followed by OBC in the UGPR during NFHS-4 (66.2%) and SC in the UGPR (66.2%). The General category in the R region exhibits the lowest Severe Intensity during both NFHS-4 and NFHS-5, recorded at 0.0%. The data suggest that, although there have been some improvements in intensity measures over time, notable caste and regional disparities remain.
Figure 6 displays heatmaps that analyse the MPI across various caste groups, regions and survey rounds (NFHS-4 and NFHS-5), categorised into Vulnerable MPI, Poor MPI and Severe MPI. The data indicate ongoing and significant disparities in multidimensional poverty, with SC, ST and OBC consistently showing higher MPI values than the General category, alongside marked regional variations.
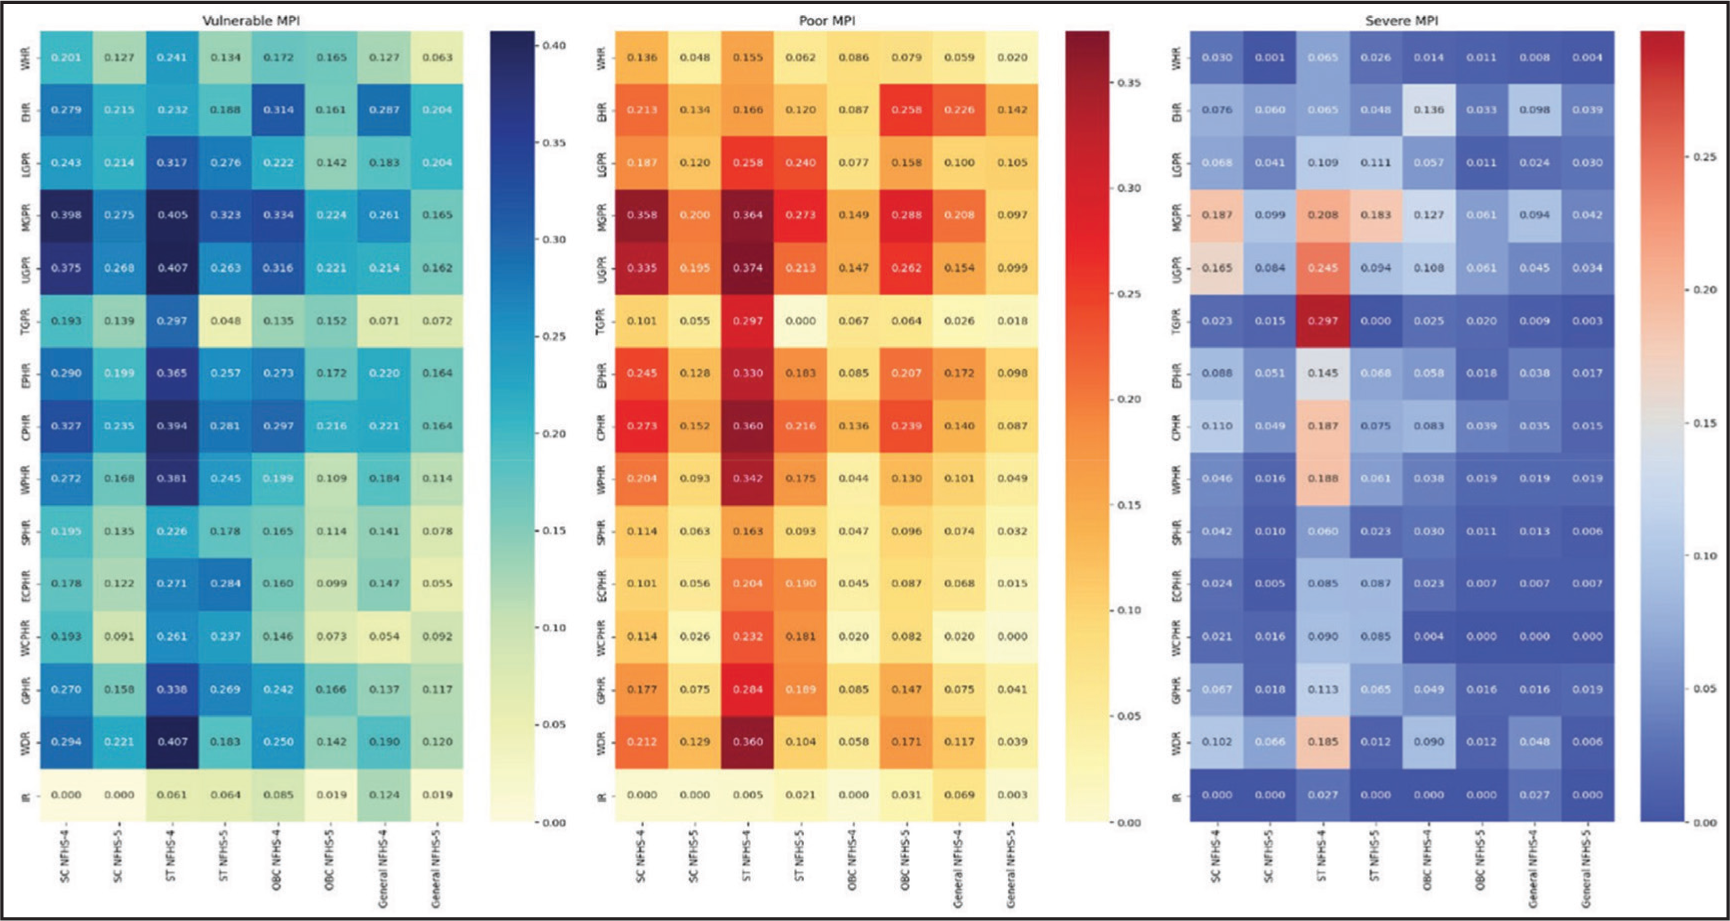
The highest value for Vulnerable MPI is recorded among SC in the MGPR during NFHS-4 (0.398), followed by OBC in the same region (0.335) and SC in the UGPR (0.375). The General category in the R region exhibits the lowest Vulnerable MPI during NFHS-5, recorded at 0.019.
The Poor MPI further highlights these disparities. The highest Poor MPI is observed among SC in the MGPR during NFHS-4 (0.358), followed by OBC in the same region (0.273) and SC in the UGPR (0.335). The General category in the IR exhibits the lowest Poor MPI during NFHS-5, recorded at 0.003. The findings indicate that, although there have been some advancements, the extent and severity of poverty continue to be disproportionately elevated among SC, ST and OBC, especially in specific areas.
The Severe MPI exhibits a comparable pattern, with the peak value recorded for ST in the TGPR during NFHS-4 (0.297), succeeded by SC in the MGPR (0.187) and OBC in that same region (0.183). The General category in the R region exhibits the lowest Severe MPI during both NFHS-4 and NFHS-5, recorded at 0.000 and 0.004, respectively.
The data suggest that, although there have been improvements in MPI values over time, notable caste and regional disparities remain evident.
Figure 7 provides an analysis of multidimensional poverty by gender and caste categories in India, comparing data from the NFHS rounds 4 and 5. This analysis identifies substantial patterns of inequality at the intersection of caste and gender identities, highlighting notable improvements across survey periods. The headcount ratio data reveal significant disparities, with ST exhibiting the highest poverty rates (80.9% for males and 65.2% for females in NFHS-4), followed by SC (74.8% for males and 47.1% for females in NFHS-4). NFHS-5 indicates reductions across all categories; however, the hierarchical pattern remains evident, with ST populations (68.7% males, 40.8% females) facing significantly higher poverty rates compared to the General population (41.7% males, 15.2% females). The intensity of poverty metrics indicates a distinct gender disparity, as females exhibit greater poverty intensity than males across all caste categories in both survey rounds.
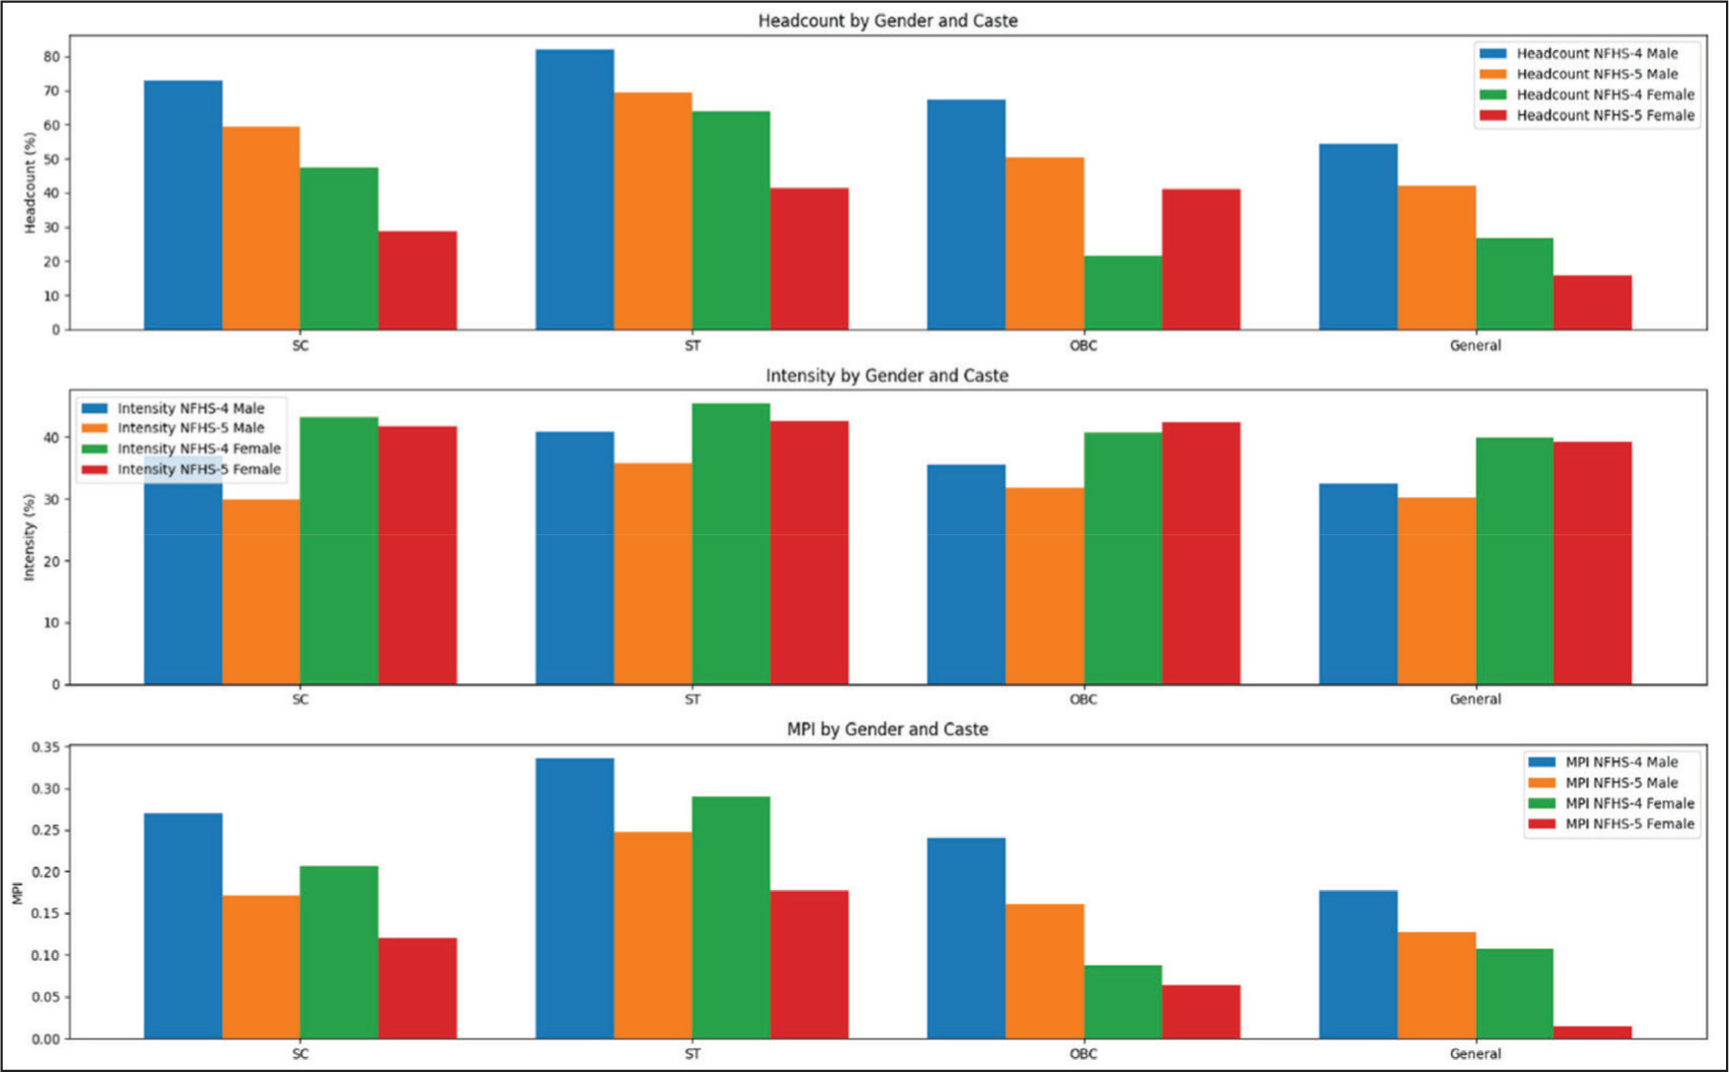
For example, SC females exhibit intensity values of 42.8% in NFHS-4, whereas SC males demonstrate 32.1% during the same timeframe. The gender disparity in poverty intensity continues to exist, even with the overall advancements noted in NFHS-5. The MPI values, integrating headcount and intensity measures, demonstrate significant disparities. ST males in NFHS-4 exhibited the highest MPI value of 0.334, whereas General category females in NFHS-5 demonstrated the lowest value of 0.011, indicating a 30-fold disparity. This significant disparity highlights the critical influence of overlapping social identities on poverty results.
Results of Intersectionality
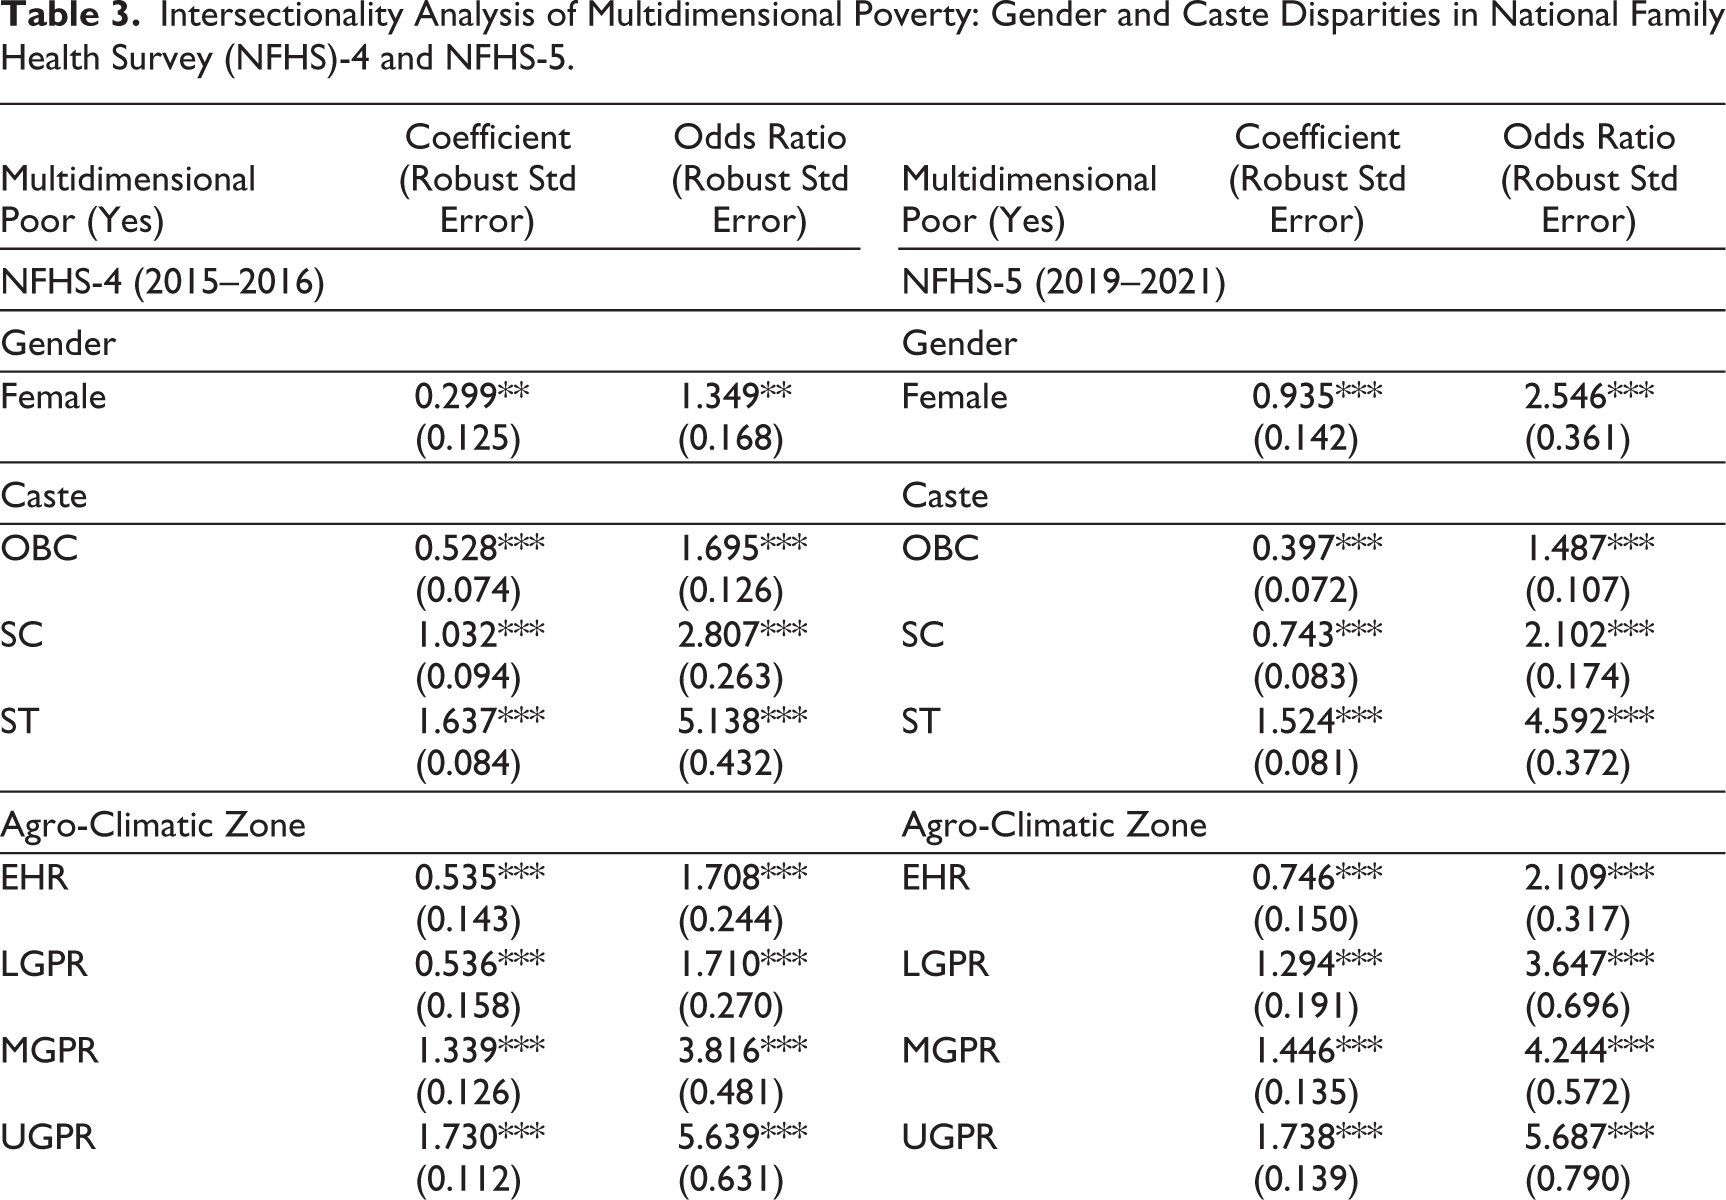
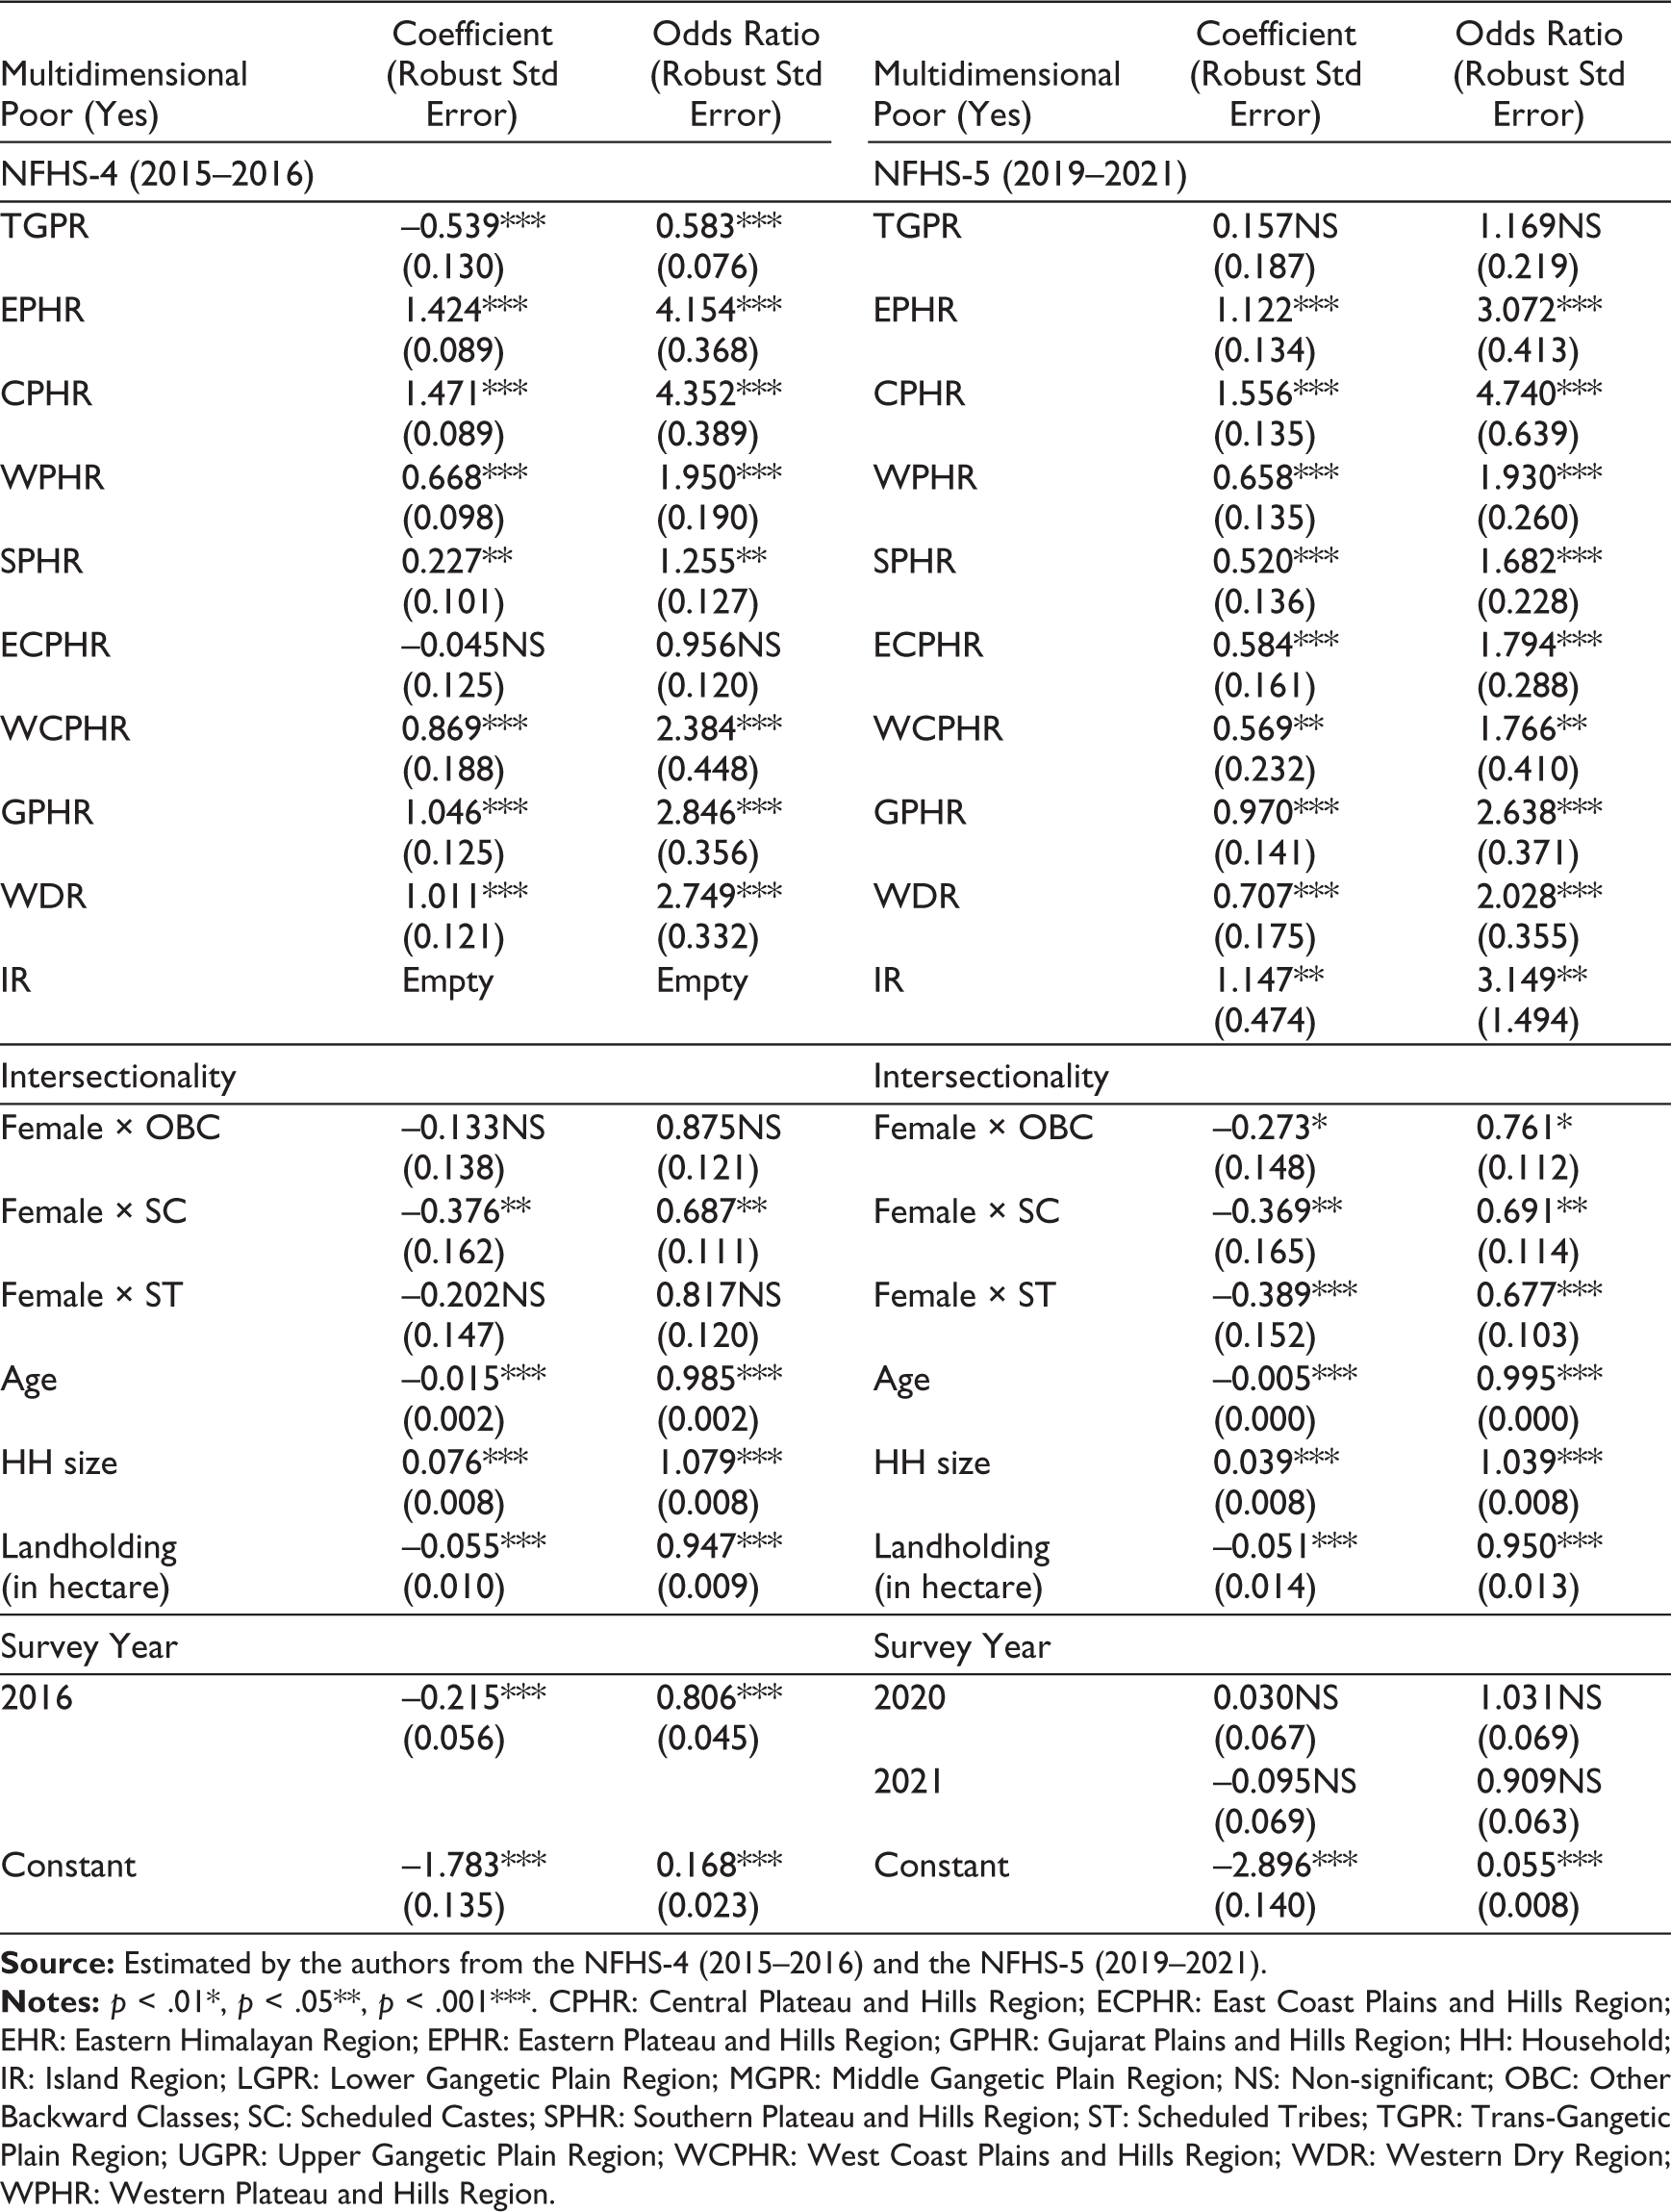
Table 3 provides a detailed intersectional analysis of multidimensional poverty in India, using logistic regression results from NFHS-4 (2015–2016) and NFHS-5 (2019–2021). The table reports coefficients and odds ratios (with robust standard errors) for the likelihood of being multidimensionally poor, considering gender, caste, agro-climatic zones and their intersections, while controlling for age, household size, landholding and survey year.
Intersectionality Analysis of Multidimensional Poverty: Gender and Caste Disparities in National Family Health Survey (NFHS)-4 and NFHS-5.
Gender Disparities
The analysis reveals a significant and increasing gender disparity in multidimensional poverty. In NFHS-4, females had an odds ratio of 1.349 (robust SE: 0.168, p < .01), indicating that women were about 35% more likely to be multidimensionally poor compared to men. In NFHS-5, this disparity widened, with the odds ratio rising to 2.546 (robust SE: 0.361, p < .001), meaning women were more than two and a half times as likely as men to experience multidimensional poverty.
Caste Disparities
Caste-based differences are pronounced and persistent across both survey rounds. In NFHS-4, the odds ratios for multidimensional poverty were 1.695 (robust SE: 0.126, p < .001) for OBC, 2.807 (robust SE: 0.263, p < .001) for SC, and 5.138 (robust SE: 0.432, p < .001) for ST. In NFHS-5, these odds ratios were 1.487 (robust SE: 0.107, p < .001) for OBC, 2.102 (robust SE: 0.174, p < .001) for SC, and 4.592 (robust SE: 0.372, p < .001) for ST. This indicates that, while the relative disadvantage for OBC and SC has slightly decreased, ST continue to face the highest risk of multidimensional poverty.
Regional (Agro-Climatic Zone) Variation
There is substantial variation across agro-climatic zones. In NFHS-4, the highest odds ratios were observed in the UGPR (5.639), CPHR (4.352), EPHR (4.154) and MGPR (3.816). In NFHS-5, these regions continued to show high odds: UGPR (5.687), CPHR (4.740), MGPR (4.244) and EPHR (3.072). Some regions, such as the TGPR, had significantly lower odds in NFHS-4 (0.583), but this effect was not significant in NFHS-5 (1.169, NS).
Intersectionality: Gender and Caste
The intersectional terms show that the combined disadvantage of being female and belonging to a marginalised caste is less than additive. For example, in NFHS-4, the odds ratio for Female × SC was 0.687 (robust SE: 0.111, p < .01), and for Female × ST, it was 0.817 (robust SE: 0.120, NS). In NFHS-5, these odds ratios were 0.691 (robust SE: 0.114, p < .01) for Female × SC and 0.677 (robust SE: 0.103, p < .001) for Female × ST. This suggests that the excess risk associated with being a woman is somewhat attenuated among SC and ST groups.
Other Covariates
Age is negatively associated with multidimensional poverty, with odds ratios of 0.985 (NFHS-4) and 0.995 (NFHS-5), both highly significant. Larger household size increases the odds (1.079 in NFHS-4, 1.039 in NFHS-5), while greater landholding is protective (0.947 in NFHS-4, 0.950 in NFHS-5). Survey year effects are generally non-significant in NFHS-5.
Table 3 demonstrates that multidimensional poverty in India is deeply stratified by gender, caste and region, with intersectional identities further shaping the risk profile. Odds ratios clearly show persistent and, in some cases, widening disparities, especially for women and marginalised castes, and significant regional heterogeneity. These findings underscore the need for targeted, intersectional policy interventions to address the complex landscape of poverty in India.
Discussions
This study advances understanding of the intersectional and spatial dimensions of multidimensional poverty among Indian agricultural labourers, with a focus on gender, caste and regional disparities. The findings reveal that women, particularly those from marginalised castes and specific agro-climatic zones, face disproportionately high deprivation—extending the insights of Alkire and Foster (2011) and Kabeer (2016) on the interplay of gender, caste and geography in poverty.
While national trends indicate a decline in multidimensional poverty (Alkire & Seth, 2015; Alkire et al., 2021), our results highlight persistent and significant disparities. ST and SC remain substantially more likely to be poor, reflecting entrenched social stratification and ‘intersecting inequalities’ (Desai & Dubey, 2012; Kabeer, 2006; Mohanty, 2011). Women from these groups experience compounded disadvantage, consistent with Deshpande’s (2007) concept of ‘double discrimination’.
Regional analysis shows that poverty is concentrated in the Upper Gangetic Plains, Central Plateau and Hills and Eastern Plateau and Hills, where agro-climatic vulnerability, low productivity and weak infrastructure prevail (Das et al., 2021; Tripathi & Yenneti, 2020). Conversely, regions with better infrastructure, such as the Trans-Gangetic Plain, exhibit lower poverty risks, underscoring the importance of targeted investments.
Intersectionality analysis demonstrates that the combined effects of gender and caste are complex and not merely additive, reinforcing the need for poverty alleviation strategies that address overlapping identities (Alkire & Santos, 2014; Yuval-Davis, 2006). Other factors, such as age, household size and landholding, also shape poverty risk, supporting the resource dilution hypothesis and the protective role of assets (Barrett et al., 2001; Becker & Lewis, 1973).
The multidimensional nature of deprivation—spanning education, health and living standards— confirms that rural poverty is not solely an income issue but is deeply rooted in social identity and access to basic services (Abraham, 2017; FAO, 2020; Mehta, 2003; Sharma et al., 2021; Thorat & Newman, 2007). Environmental shocks, such as droughts and floods, further exacerbate vulnerability, especially for rain-fed agricultural labourers, highlighting the need for climate-resilient practices and improved rural infrastructure (Ali et al., 2022; Alkire et al., 2021a; Das, 2023).
Finally, while programmes like MGNREGA offer some relief, the persistence of deprivation points to the limitations of income-focused interventions. A holistic, context-specific approach—integrating education, healthcare, infrastructure and social protection—is essential for breaking the cycle of poverty (Adepoju & Oyewole, 2020; Bhattarai, 2014; D’Souza and Ratho, 2020; Gualtieri, 2016; Shimeles, 2019).
In sum, despite recent progress, multidimensional poverty among Indian agricultural labourers remains deeply shaped by gender, caste and regional inequalities. Addressing these entrenched structural barriers through integrated and intersectional policy responses is crucial for meaningful and sustained poverty reduction.
Conclusion and Recommendations
This study provides a nuanced analysis of caste and gender disparities in multidimensional poverty among Indian agricultural workers, drawing on NFHS-4 and NFHS-5 data. Despite a national decline in multidimensional poverty, the findings reveal persistent and substantial inequalities across agro-climatic zones, with the most acute deprivation observed among women and marginalised castes in rain-fed and infrastructure-poor regions (Jatav & Singh, 2025). These disparities are not only spatial but also intersectional, reflecting the compounded disadvantages faced by subaltern groups within the agricultural sector.
The analysis underscores that poverty among agricultural labourers is multidimensional, rooted in deficits in education, health and living standards, and exacerbated by environmental and climate risks (FAO, 2020; Sharma et al., 2021). Addressing these challenges requires moving beyond income-based approaches to embrace holistic, intersectionality-sensitive strategies.
Targeted policies should prioritise the most deprived agro-climatic zones, particularly the Eastern and Central regions, where rain-fed agriculture and weak infrastructure intensify vulnerability. Interventions should focus on improving access to quality education, healthcare and basic utilities, with special attention to the needs of women and marginalised castes.
Policy frameworks must explicitly address the intersection of caste, gender and geography. This includes ensuring equitable land rights for women, combating caste-based discrimination in resource allocation, and integrating social protection schemes that are sensitive to overlapping vulnerabilities.
Strengthening climate resilience through investment in irrigation, crop diversification and climate-smart agriculture is essential. Expanding access to crop insurance and financial services can buffer agricultural households against environmental shocks.
Policy formulation should incorporate participatory mechanisms, engaging agricultural workers—especially women and marginalised groups—in the design and monitoring of interventions. Regular, disaggregated data collection at the regional and sub-group level is vital for tracking progress and refining strategies.
This study is subject to several limitations. First, the analysis relies on cross-sectional survey data, which constrains the ability to infer causality or capture seasonal and temporal dynamics. Second, the use of aggregate indicators may mask intra-household and intra-community variations in deprivation. Third, while the study identifies spatial and intersectional disparities, it does not evaluate the effectiveness of specific policy interventions or simulate their potential impacts. These limitations highlight the need for future research employing longitudinal data, mixed-methods approaches and policy evaluation frameworks tailored to the lived realities of subaltern agricultural workers. In summary, this research contributes to a deeper understanding of the structural and intersectional roots of poverty among India’s agricultural labourers. By centring the experiences of the most marginalised, it provides a foundation for more equitable and context-sensitive policy responses.
Footnotes
Authors’ Contribution
Pushpendra Kumar Singh: Conceptualisation/formulation of ideas, literature review, development/design of methodology, data collection/curation and formal analysis/techniques.
Sanatan Nayak: Conceptualisation/formulation of ideas and writing—final draft.
Data Availability Statement
International Institute for Population Sciences (IIPS) and ICF. 2017. NFHS-4, 2015–2016: India. Mumbai: IIPS.
Declaration of Conflicting Interests
The authors declared no potential conflicts of interest with respect to the research, authorship and/or publication of this article.
Funding
The authors received no financial support for the research, authorship and/or publication of this article.