Abstract
This article measures the overall inclusive growth of a city by considering changing trends in key economic variables (that is, poverty, inequality, economic growth, education, employment, unemployment and the standard of living index) based on the ‘Borda ranking’ and establishes a relationship between city economic growth and overall city inclusive growth. Based on data for 52 large cities in India, this article finds that higher urban economic growth is associated with an increase in the growth rate of urban inequality, a reduction in the growth rate of urban poverty and a lower level of overall inclusive growth of a city, that is, urban economic growth is not inclusive.
1. INTRODUCTION
Urban India has been experiencing increasing economic growth and rising income inequality with higher rates of poverty. For instance, the share of urban net domestic product (NDP) in total NDP increased from 41.09 per cent in 1980–81 to 52.02 per cent in 2004–05, and accounted for about 6.2 per cent of the growth in urban NDP from 1970–71 to 2004–05 at constant prices (1999–2000). On the other hand, urban consumption inequality measured by the Gini coefficient is about 0.39 and the urban poverty head count ratio is 20.9 per cent. 1 These inequality and poverty figures suggest that, in spite of higher urban economic growth, a large proportion of urban dwellers still experience inadequate improvements in their standard of living. Thus, a reduction in consumption inequality and poverty, between rural and urban India as well as within urban India, by focusing on vulnerable social groups is an important strategy of the planning process.
The definition of inclusive growth has been recently debated within the context of development economics. 2 Ali and Zhuang (2007) argued that inclusive growth is growth that not only creates new economic opportunities but also ensures equal access to the opportunities created for all segments of society, including the disadvantaged and marginalised. This definition of inclusive growth is very close to the concept of pro-poor growth advocated by the OECD-Development Assistance Committee (DAC). 3
Ali and Son (2007) defined that inclusive growth depends on average opportunities available to the population and how these are shared among the population. On the other hand, for Ali (2007), an inclusive growth strategy rests on three anchors: expanding opportunity, broadening access to opportunity and social protection that acts as a safety net and a springboard. The Asian Development Bank (ADB) (2007) defined an inclusive growth strategy as one that creates opportunities and expands access to it, while Rauniyar and Kanbur (2010) suggest that an inclusive growth strategy is associated with a reduction in inequality.
In the context of measuring inclusive growth, Ali and Son (2007) applied their new inclusive growth framework to the Philippines by using micro-unit-level data on annual poverty indicators survey data for 1998 and 2004. In the measurement of inclusive growth they used two indicators: access to primary and secondary education and access to health services. The main conclusion is that access to health and education becomes more inequitable from 1998 to 2004. In finding a relationship between economic growth and poverty alleviation, using province-level data for Kazakhistan, Agrawal (2007) found that higher growth rates are likely to associate with more rapid reduction in poverty. Son (2007) examined the relationship between economic growth, income distribution and poverty for ADB developing member countries and the results indicated greater effectiveness of pro-poor policies in countries with higher incomes than in countries with lower incomes, suggesting that inequality-reducing pro-poor policies would be more effective in countries with high inequality. In measuring income inequality in the People’s Republic of China at the national, regional and provincial levels, Lin et al. (2008) found that income inequality increased significantly during the last two decades and that the main cause of the increase was the rise in urban inequality and between urban and rural inequality.
In the context of India, there is a large body of literature on various dimensions of inclusive growth, such as Rakshit (2010) from the fiscal consolidation angle, Birthal and Negi (2012) who talk of livestock in agricultural growth and Mody (2005) from a political decentralization point of view. Nagaraj (2012) argues that a high growth rate (as distinct from agriculture growth), which is mainly responsible for poverty reduction and social development, may not be advantageous for inclusivity, as has been argued by Vanaik (2012). Hirway (2012) emphasises the macroeconomic framework (such as fiscal and monetary policies) for an inclusive growth strategy.
Several of these studies found that the recent growth process had not been inclusive. Kundu and Varghese (2010) constructed a composite index of economic development (based on a selected set of indicators) and found that problems related to health, education and access to other amenities cannot be addressed by focusing only on economic development. In the area of employment, Unni and Raveendran (2007) find that employment growth slowed slightly in 1993–2004 compared to 1983–1993, especially in rural India. They also show that employment has grown in the urban areas over the past decade mainly in self-employment, but there has been a decline in the real wage rates of regular salaried workers and urban casual workers. Tilak (2007) critically looks at the approach to educational development outlined in the Approach to the Eleventh Five-Year Plan and highlights the weaknesses, especially the continuation of a large policy vacuum. Most importantly, Suryanarayana (2008) estimates of inclusion, based on mean-based income averages and absolute-norm-based measures of deprivation, indicate that the growth process between 1993–94 and 2004–05 has bypassed the majority. Thorat and Dubey (2012) examine the changes in poverty incidence and monthly per capita expenditure (in 1993–94, 2004–05 and 2009–10) and find that some groups benefited more than the others from poverty reduction strategies. In addition, inequality has also begun to adversely affect poverty reduction process, particularly in urban areas. Jayaraj and Subramanian (2012) find little evidence of interpersonal inclusiveness in India’s consumption growth experience over the last four decades or so. In the context of urban inclusive growth, Kundu and Samanta’s (2011) analysis of current urban development policies (such as, the Jawaharlal Nehru National Urban Renewal Mission [JNNURM]) shows that only 58 per cent of the urban population is covered by the JNNURM, with a high coverage in developed states and metropolitan cities.
OECD (2012) has several recommendations to overcome the social and economic challenges to sustain high and inclusive growth. Sankhe et al. (2010) proposes recommendations for building inclusive cities and sustaining economic growth.
In essence, most Indian studies conclude that the country’s higher economic growth has bypassed the majority, especially the marginalised groups, in terms of poverty reduction and employment creation and led to a lower inclusive growth process. However, an important gap exists in the measurement of urban inclusive growth: this article attempts to fill the gap by measuring urban inclusive growth by constructing a composite index based on the ‘Borda ranking’ to measure overall inclusive growth of a city, with a focus on changing trends in the key economic variables. Moreover, this article finds a relationship between city economic growth and overall city inclusive growth, which offers empirical evidence of an increase in urban inequality, reduction in urban poverty and lower levels of overall inclusive growth of cities over time.
The rest of the article is organised as follows. Section 2 presents the methodological issues related to measuring overall inclusive growth of a city and finding a relationship between city economic growth and overall city inclusive growth. Section 3 outlines measurement of the variables, data sources and a brief description of the variables used for the analysis. Section 4 highlights the details of the estimated results and Section 5 concludes with a summary of the major conclusions and implications.
2. METHODOLOGY
2.1 A Composite Index of Overall Inclusive Growth of a City: Proposed Approach for the Measurement of Inclusive Urban Growth
The existing definitions of inclusive growth (discussed in Section 1) clearly indicate that there is no clear-cut definition for measuring inclusive growth. For that reason, we consider the following 20 economic variables, belonging to seven major economic indicators, as capturing the multidimensionality of inclusive growth: (a) economic growth as reflected in city-wise per capita income growth; (b) reduction in poverty (measured by the poverty head-count ratio, poverty gap index and squared poverty gap index) as reflected by the city-wise poverty ratio; (c) reduction in inequality (measured by the Gini coefficient) as reflected in the city-wise inequality level; (d) access to (or creation of) opportunities as reflected in city-wise employment (measured by usually self-employed, regular/salaried employed and casual labour) and the unemployment situation (measured by the unemployed and persons not in the labour force); and (e) degree of equitable distribution of income, city-wise standard of living index divided into low, medium and high and the educational situation (measured by primary and upper-primary gross enrollment ratios) are proxied. 4
To measure the overall inclusive growth of a city, a composite inclusive index (CII) is estimated based on the ‘Borda ranking’ method. The ‘Borda rank’ follows the methodology of the ‘Borda Rule.’ This rule provides a method of rank-order scoring, which gives each alternative a point equal to its rank in each criterion of ranking, then adds each alternative’s scores to obtain its aggregate score and finally ranks alternatives on the basis of their aggregate scores. 5 The Borda score focuses only on ordinal information. 6 In addition, the CII for the ‘marginalised’ group and ‘others’ group are also computed separately, as strategies for inclusive growth mainly focus on improvements in the wellbeing of the ‘marginalised’ group. 7 Our measure of the CII could be considered an overall (or multidimensional) measure of well-being, as it measures different dimensions of living standards. 8
We selected 52 large cities for the analysis for the following reasons: we have used World Urbanization Prospects as a data source as it provides updated data for cities with 750,000 or more inhabitants from 1950 to 2025, at five-year intervals, while the Indian census only provides data up to 2001 (as the 2011 data are yet to be published) at ten-year intervals. 9 Second, due to the unavailability of city-specific data for several variables used in this study (for example, city incomes), the city district (where the sample city is located) is used as a proxy for the city. 10 Bigger cities are a good proxy for a city district as they cover a larger portion of a district than smaller cities. And, finally, India’s urbanisation data (that is, share of urban population) has been based mainly on population in Class I cities (with populations of 100,000 or more), which are the large cities included in the analysis. 11
To ensure bias-free measurement, equal weights are given to all the variables. We use equal weights for simplicity and assume that all indicators are equally important. The choice of weights is based on the normative judgment that all seven (that is, ‘poverty, inequality, economic growth, education, employment, unemployment, and the standard of living index’) dimensions are equally important. 12 Finally, as all the cities used in the analysis are classified as Class I cities we do not need different weights for the different cities.
The CII is based on the following calculation:

where r stands for the rank of the ith variable for the jth city; i = 1, 2,…………., 20; and j = 1, 2,…………., 52.
Table 1 explains the definitions of the 20 variables which are used in equation(1) to construct the city-wise CII. Based on the definition of the variables, a higher (or lower) value of CII indicates a lower (or higher) level of inclusive growth. The most inclusive city is one which has the lowest values of
The cities are ranked in the following descending order of the CII value:
Definitions and Measures of Variables in the Construction of the CII
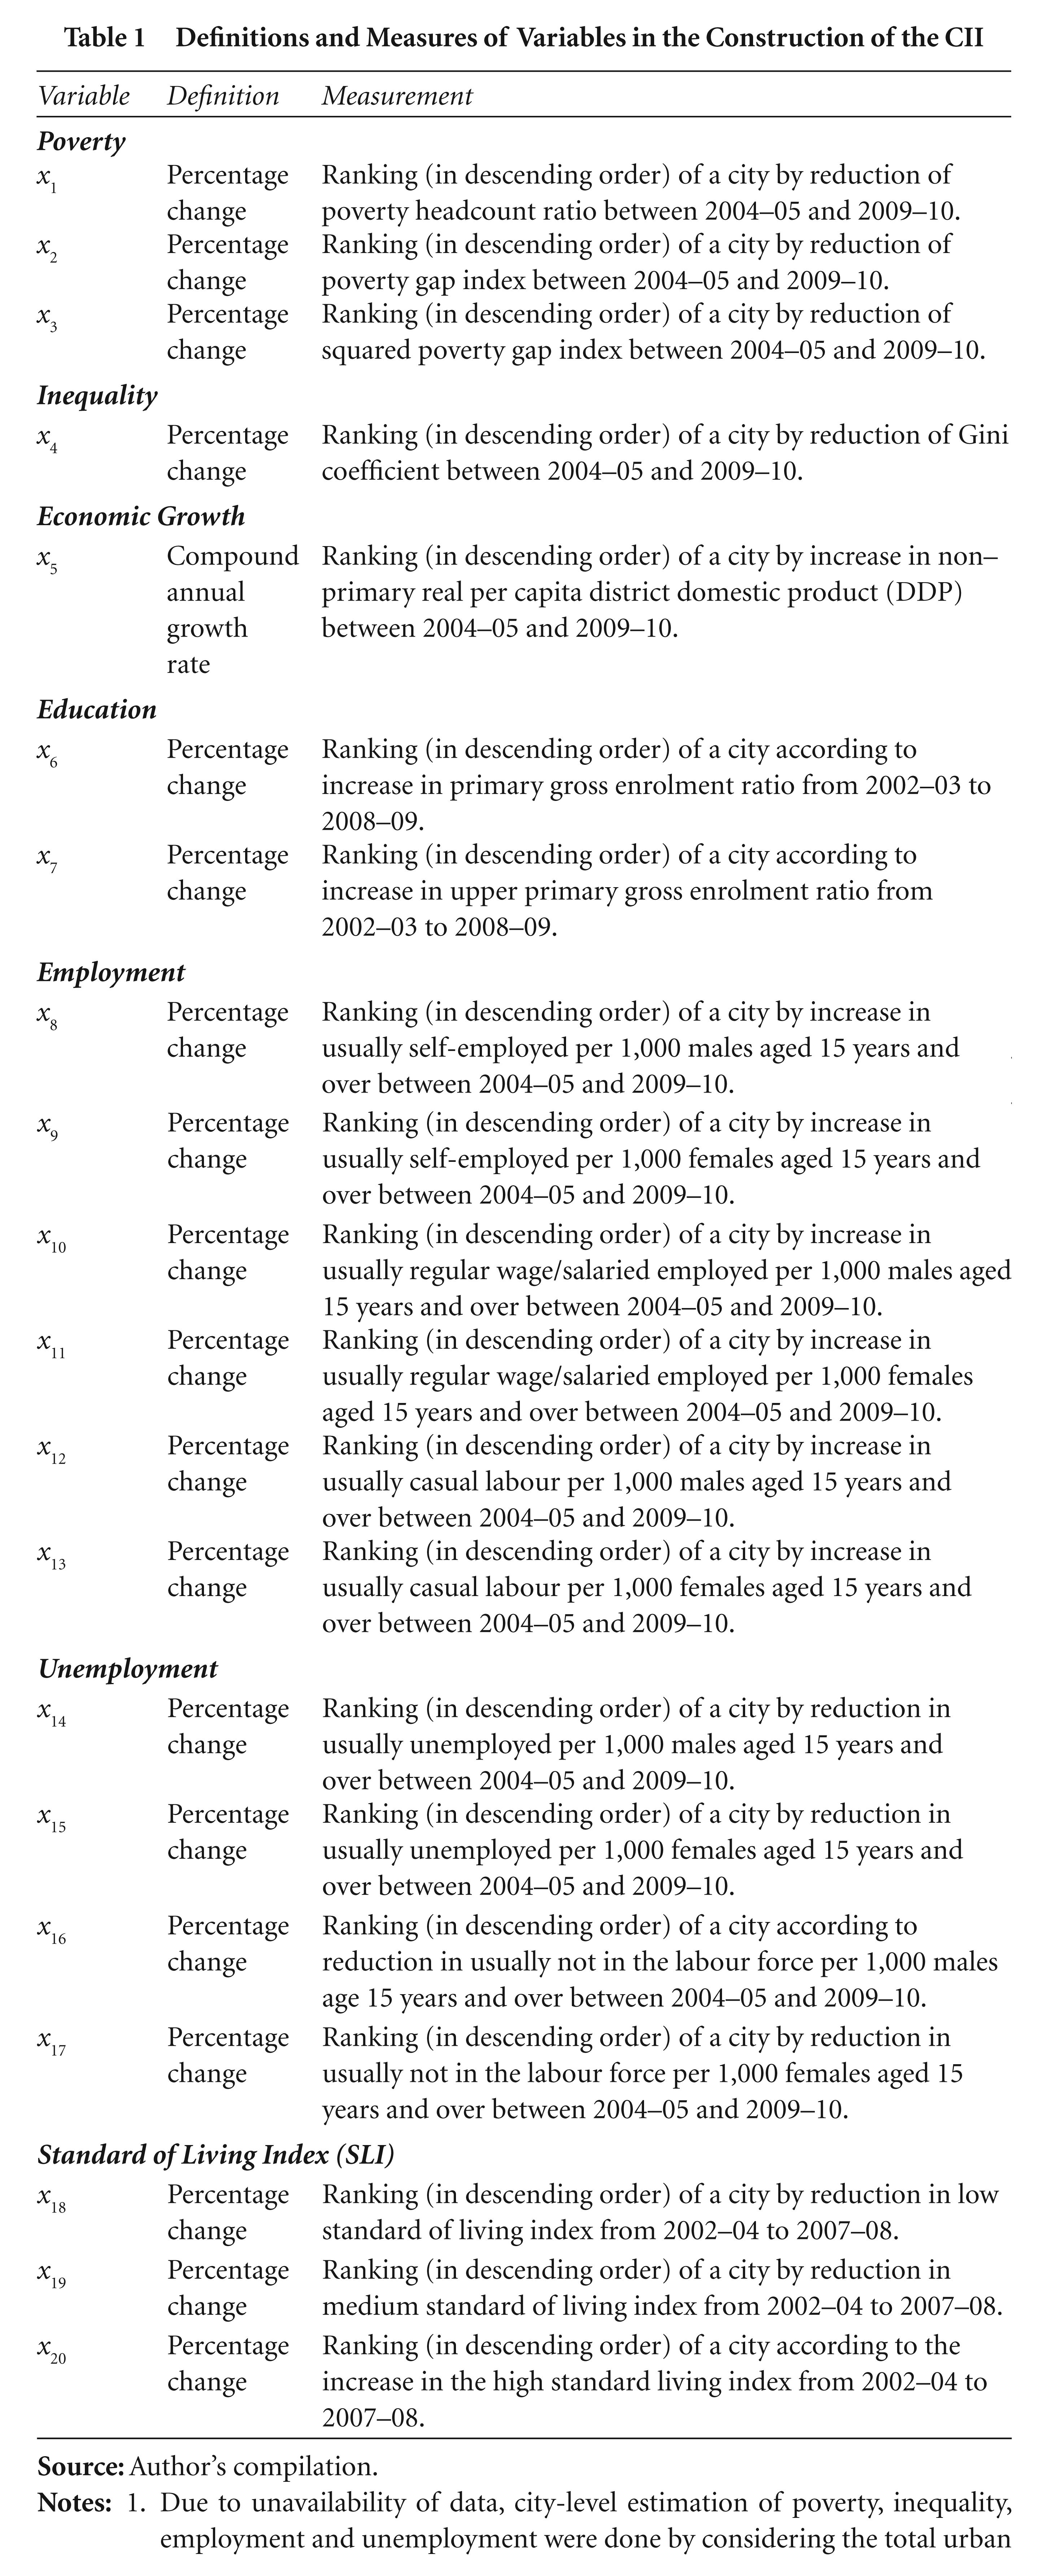
Due to unavailability of data, city-level estimation of poverty, inequality, employment and unemployment were done by considering the total urban sample of a city district (i.e., the district in which the sample city is located). However, education level and standard of living index are considered for the whole city district of which the city is a part. Non-primary DDP is used as a proxy for city-level output. For inequality estimation we use the uniform recall period (or MPCE 30) and for poverty estimation we use the mixed recall period (or MPCE 365). City-level poverty estimation is done by considering the state-level (cities located in the corresponding state) urban poverty line for 2004–05 and 2009–10 as worked out by the expert group [set up by the Planning Commission (GOI, 2009) headed by Dr Tendulkar]. The definitions of usual activity status, self–employed, regular wage/salaried employee, casual wage labour, unemployed and not in labour force, uniform recall period and mixed recall period are derived from definitions from the National Sample Survey Organisation. The District-Level Household and Facility Survey (DLHFS) calculates the standard of living index by adding the following scores: source of drinking water: 3 for own tap, 2 for shared tap, 1 for handpump and well and 0 for other; type of house: 4 for pucca, 2 for semi-pucca and 0 for kachcha; source of lighting: 2 for electricity, 1 for kerosene and 0 for other; fuel for cooking: 2 for LPG gas/electricity, 1 for kerosene and 0 for other; toilet facility: 4 for own flush toilet, 2 for own pit toilet, 2 for shared toilet and 0 for no toilet; ownership of assets: 4 each for car and tractor, 3 each for television, telephone and motorcycle/scooter and 2 each for fan, radio/transistor, sewing machine and bicycle.
The total score may vary from a low of 0 to a maximum of 40. On the basis of total scores, households are divided into three categories as low (if total score is less than or equal to 9), medium (if total score is between 10 and 19) and high (a total score over 19).
2.2 The Relationship between City Inclusive Growth and City Economic Growth
To establish the relationship between city inclusive growth and city economic growth rate we define city inclusive growth in the following three ways: first, as per the score of the constructed CII index; second, a reduction in inequality as suggested by Rauniyar and Kanbur (2010); and third, a reduction in poverty (or pro-poor growth rate) as in Ravallion and Chen (2003). Ravallion and Chen (2003) proposed a measure of pro-poor growth based on the Watts index and derived from a ‘growth incidence curve’ giving rates of growth by quintiles of the distribution of income. The relationship between growth, inequality and poverty are non-linear, complex and path-dependent in their dynamics. The relationship between inequality and growth has been established by Kuznets (1955). 13 However, most of the recent studies attempt to find the relationship among inequality, poverty and growth. For instance, Bourguignon (2004) argued that poverty, growth and inequality form a ‘poverty–growth–inequality triangle’, which suggests that poverty reduction is fully determined by the rate of growth of the mean income of the population and the distribution of income. Ravallion (1997) suggested that countries with high levels of inequality cannot rely on growth to reduce poverty.
The context of an empirical framework to estimate the interaction between growth and inequality and the affect of these two factors in turn on poverty reduction in the course of economic development, is widely studied by Deininger and Squire (1998). Following past literatures (for instance, Heshmati, 2004; Janvry and Sadoulet, 2000; Le, 2010) to establish relationships among poverty, inequality and economic growth, we use the following specifications:


where
ΔP0 is the growth rate in the incidence of district urban poverty;
ΔY is the growth rate of per capita district income;
P0 is the initial incidence of urban poverty;
I is initial inequality;
ΔYP0 is initial poverty multiplied by the growth rate of per capita district income;
ΔYI is initial urban inequality multiplied by the growth rate of per capita district income;
CII0 is the initial value of the CII of a city;
Δ CII is the growth of the CII of a city; and
ΔI is the growth rate of district urban inequality.
3. DEFINITION, SPECIFICATION, DATA SOURCES AND DESCRIPTION OF DATA BY VARIABLES
Appendix Table 2 summarises the descriptions, measurements and data sources of all the variables used in the OLS estimation of equations(2) to(4).
Appendix Table 3 gives the means, standard deviations, minimum and maximum values for the variable. Dispersion about the mean is higher for the initial level of poverty, initial poverty multiplied by growth rate of DDP and initial city inclusive index. On the other hand, dispersion about the mean is lower for the growth rate of the city inclusive index, initial Gini coefficient and growth rate of the Gini coefficient.
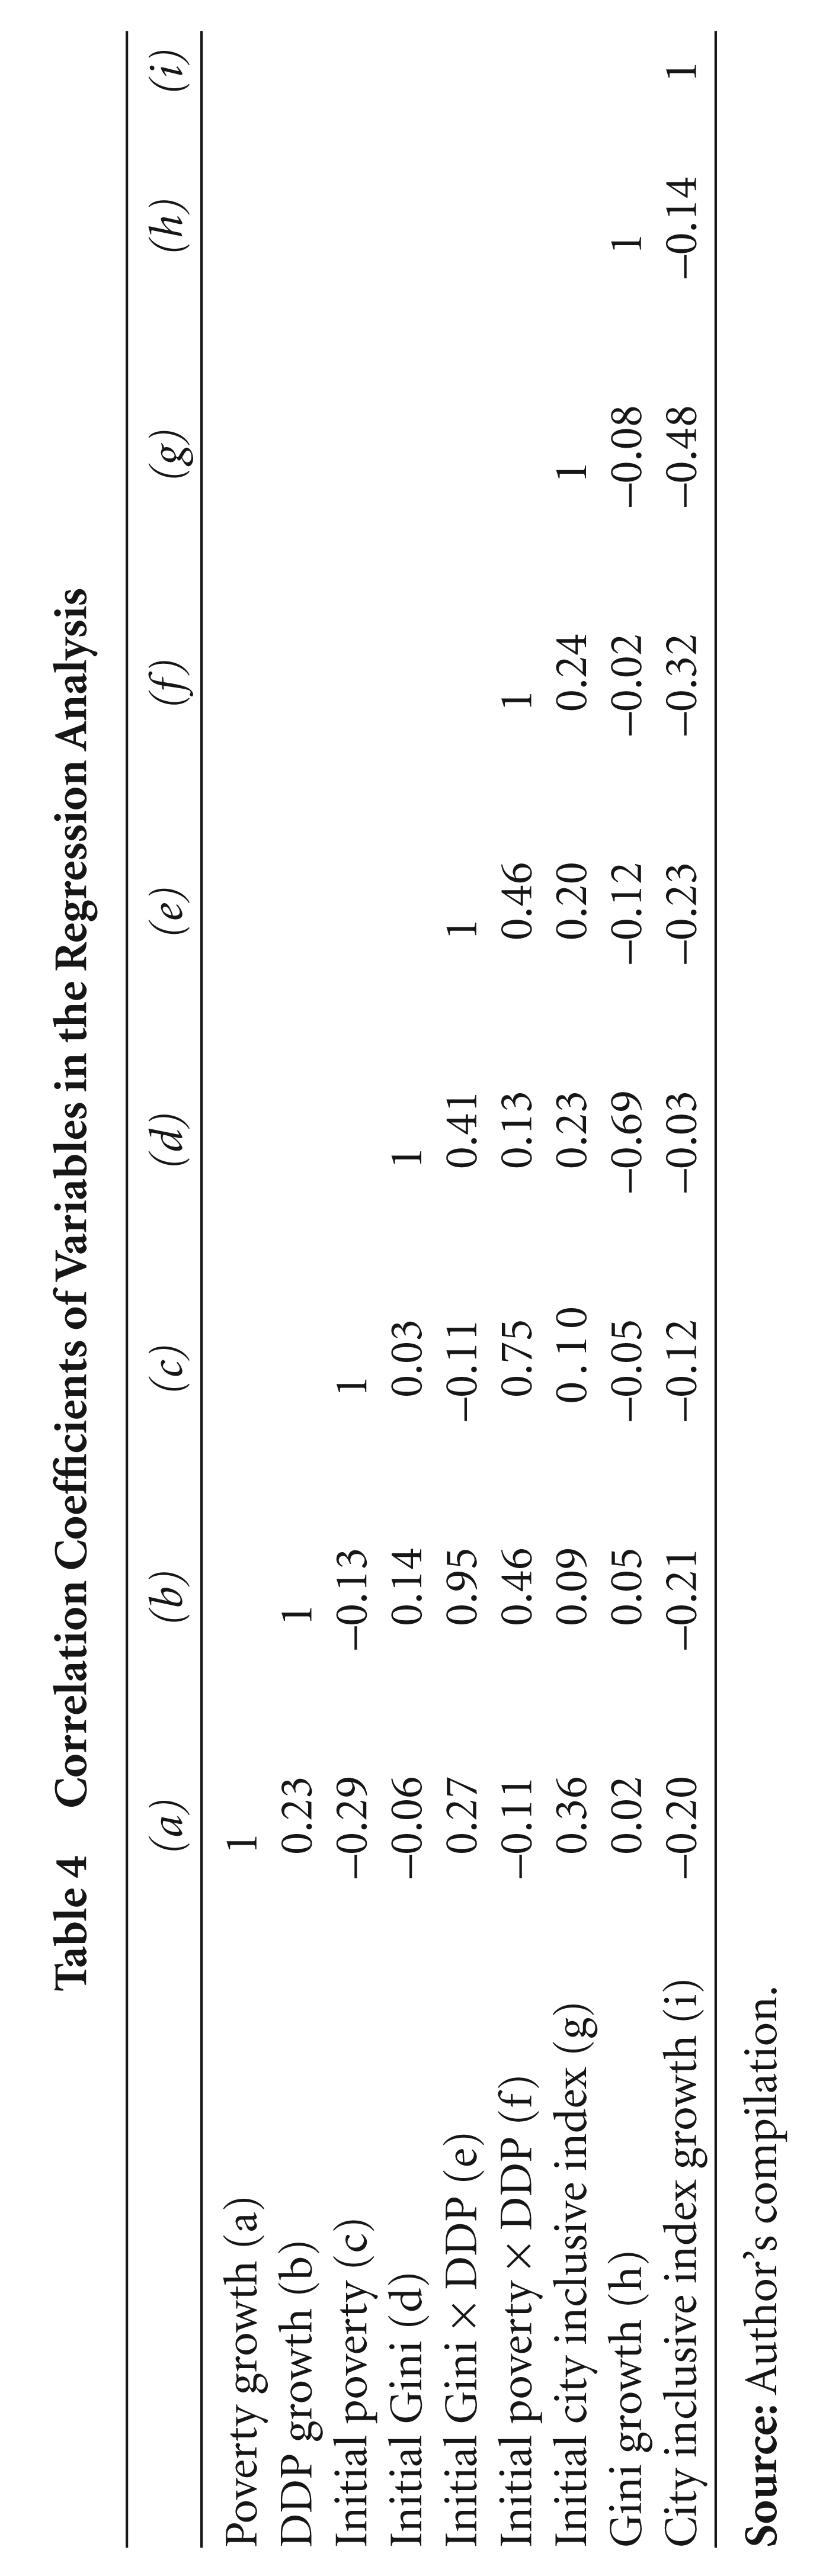
Appendix Table 4 shows the raw correlation among the variables. The values of the correlation coefficients show that the following groups of variables have higher positive associations: the DDP growth rate and initial inequality multiplied by the DDP growth rate; initial poverty and DDP growth rate multiplied by the initial poverty; poverty growth and the initial city inclusive index. On the other hand, variable groups with higher negative association are: initial poverty and poverty growth rate; initial inequality and growth rate of inequality; initial city inclusive index and growth rate of the city inclusive index.
4. RESULTS
4.1 Measurement of Poverty and Inequality for Urban India
Table 2 shows that all-India urban inequality measured by the Gini index has marginally increased from 0.38 in 2004–05 to 0.39 in 2009–10. During this same period, the inequality level for mega-city districts slightly decreased from 0.38 to 0.37. The inequality level for the 52 large cities among the ‘others’ group has increased from 0.40 to 0.43 during this period. The ‘marginalised’ group has the lowest level of inequality when compared to the other two groups (that is, the ‘others’ and the ‘overall’ group) across all cities.
Poverty and Inequality for Urban India, 2004–05 to 2009–10
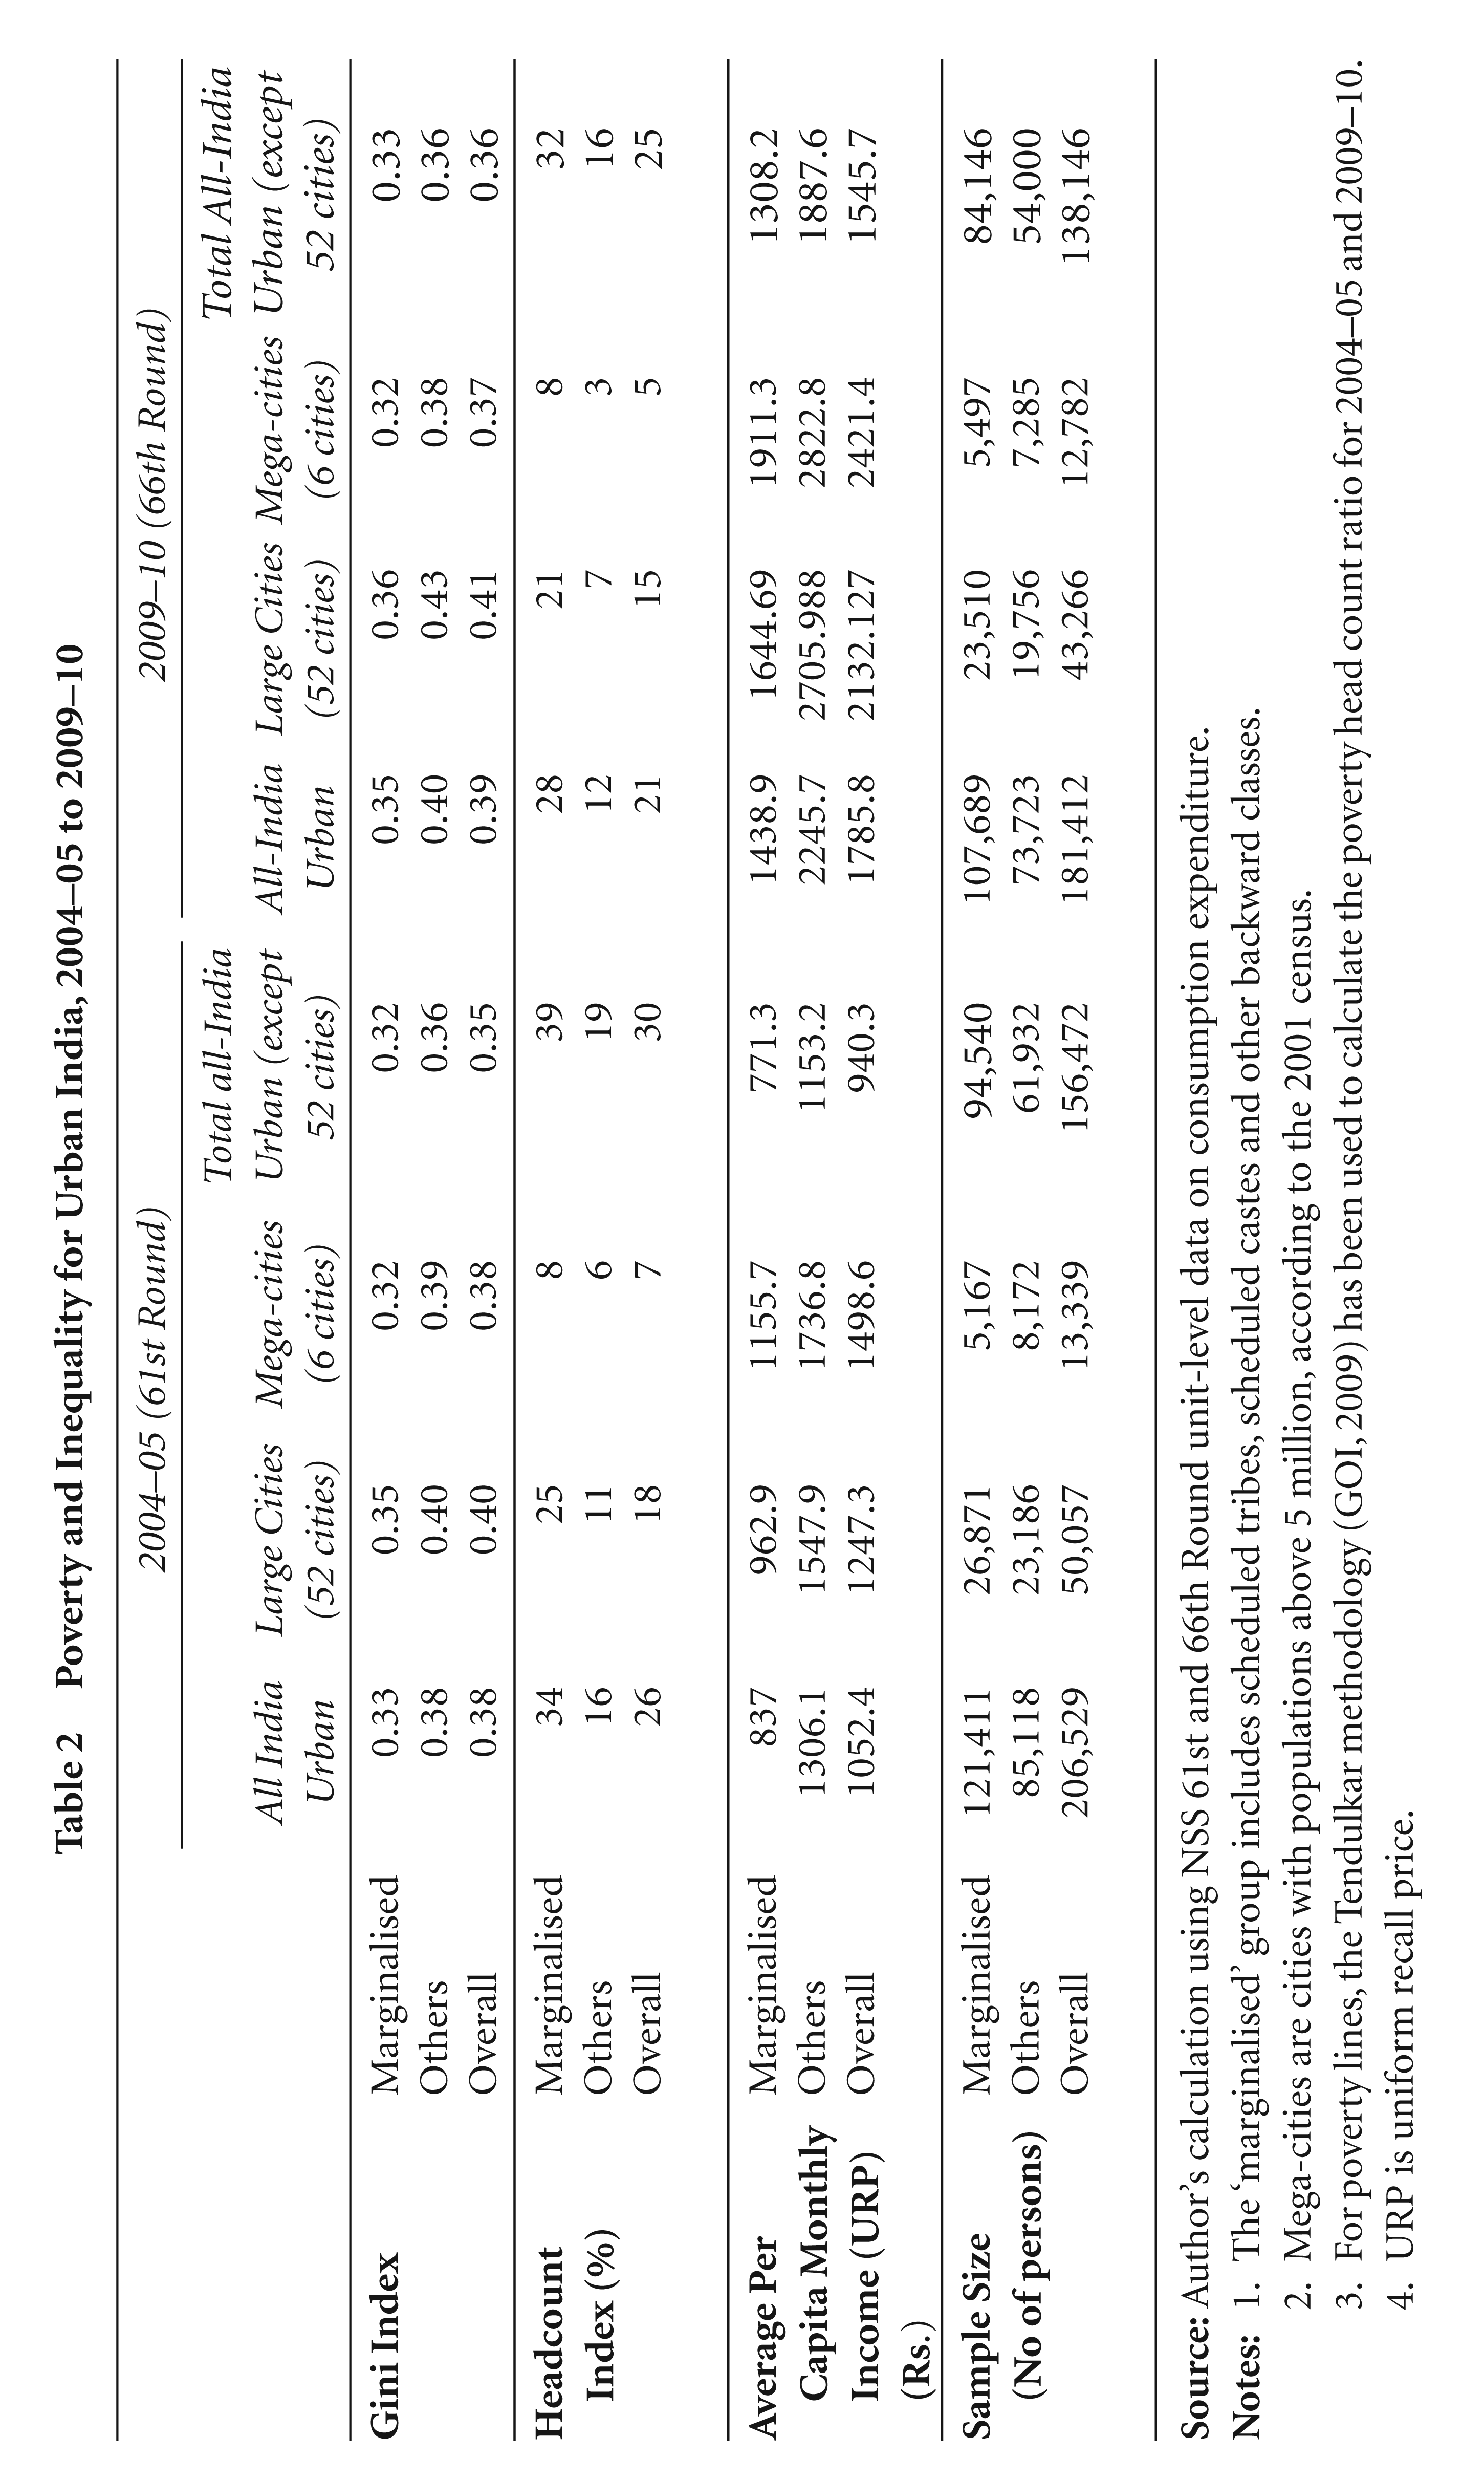
The ‘marginalised’ group includes scheduled tribes, scheduled castes and other backward classes. Mega-cities are cities with populations above 5 million, according to the 2001 census. For poverty lines, the Tendulkar methodology (GOI, 2009) has been used to calculate the poverty head count ratio for 2004–05 and 2009–10. URP is uniform recall price.
On the other hand, all-India urban poverty measured by the head count ratio has fallen from 26 per cent in 2004–05 to 21 per cent in 2009–10. Most noticeably, mega-city districts show the lowest level of urban poverty, which decreased from 7 per cent to 5 per cent during this period. In particular, poverty among the ‘others’ group in the mega-city districts has fallen sharply from 6 per cent to 3 per cent during this period. However, the poverty rate for the ‘marginalised’ group is higher than for ‘others’ group in comparison to sizes of cities. Table 2 also shows that the mean monthly per capita consumption expenditure (MPCE) measured by URP is lower among the ‘marginalised’ group than among the ‘others’ group; this indicates that the group (for example, the ‘marginalised’ group) with the lower mean MPCE has higher poverty levels.
4.2 Composite Index for Measuring City Inclusive Growth
Table 3 presents the taxonomy of cities by their calculated value of the CII based on our definition of inclusive growth by ‘marginalised’, ‘others’, and ‘overall’ (i.e., the sum of the ‘marginalised’ and ‘others’) group. The results show that in the ‘overall’ group the value of the CII is lowest for Bhubaneswar city, which indicates it has the highest inclusive growth among all 52 large cities (see the Appendix Table 1 for the names of the cities). On the other hand, Bareilly in the ‘overall’ group shows the lowest inclusive growth among the 52 large cities. Among the marginalised (or others) groups, Chandigarh (or Nashik) city has the highest inclusive growth, whereas Visakhapatnam (or Maduri) shows lowest inclusive growth among the 52 large city districts. Most interestingly, Nasik experiences the highest inclusive growth in all the three groups among 30 metro cities in India. Mumbai has the lowest inclusive growth (i.e., the highest CII value) in the ‘overall’ and ‘marginalised’ groups, while Madurai in the others group, has the lowest inclusive growth among 30 metro cities. Among the 6 mega-cities, Kolkata (or Chennai or Bangalore) has the lowest CII which means it has had the highest inclusive growth in the ‘overall’ (or ‘marginalised’ or ‘others’) group. Mumbai, again, shows lowest inclusive growth in all three groups among the 6 mega-cities in India. In addition, the results also show that Lucknow (or Durg or Vijayawada) is ranked 26th in the ‘overall’ (or ‘marginalised’ or ‘others’) group (in ascending order) of cities as per the value of CII among 52 large cities. On the other hand, Dhanbad (or Coimbatore or Bhopal) ranks 15th in the ‘overall’ (or ‘marginalised’ or ‘others’) group, (in ascending order) of cities as per the value of CII among 30 metro cities.
Classification of Cities by Levels of Inclusive Growth
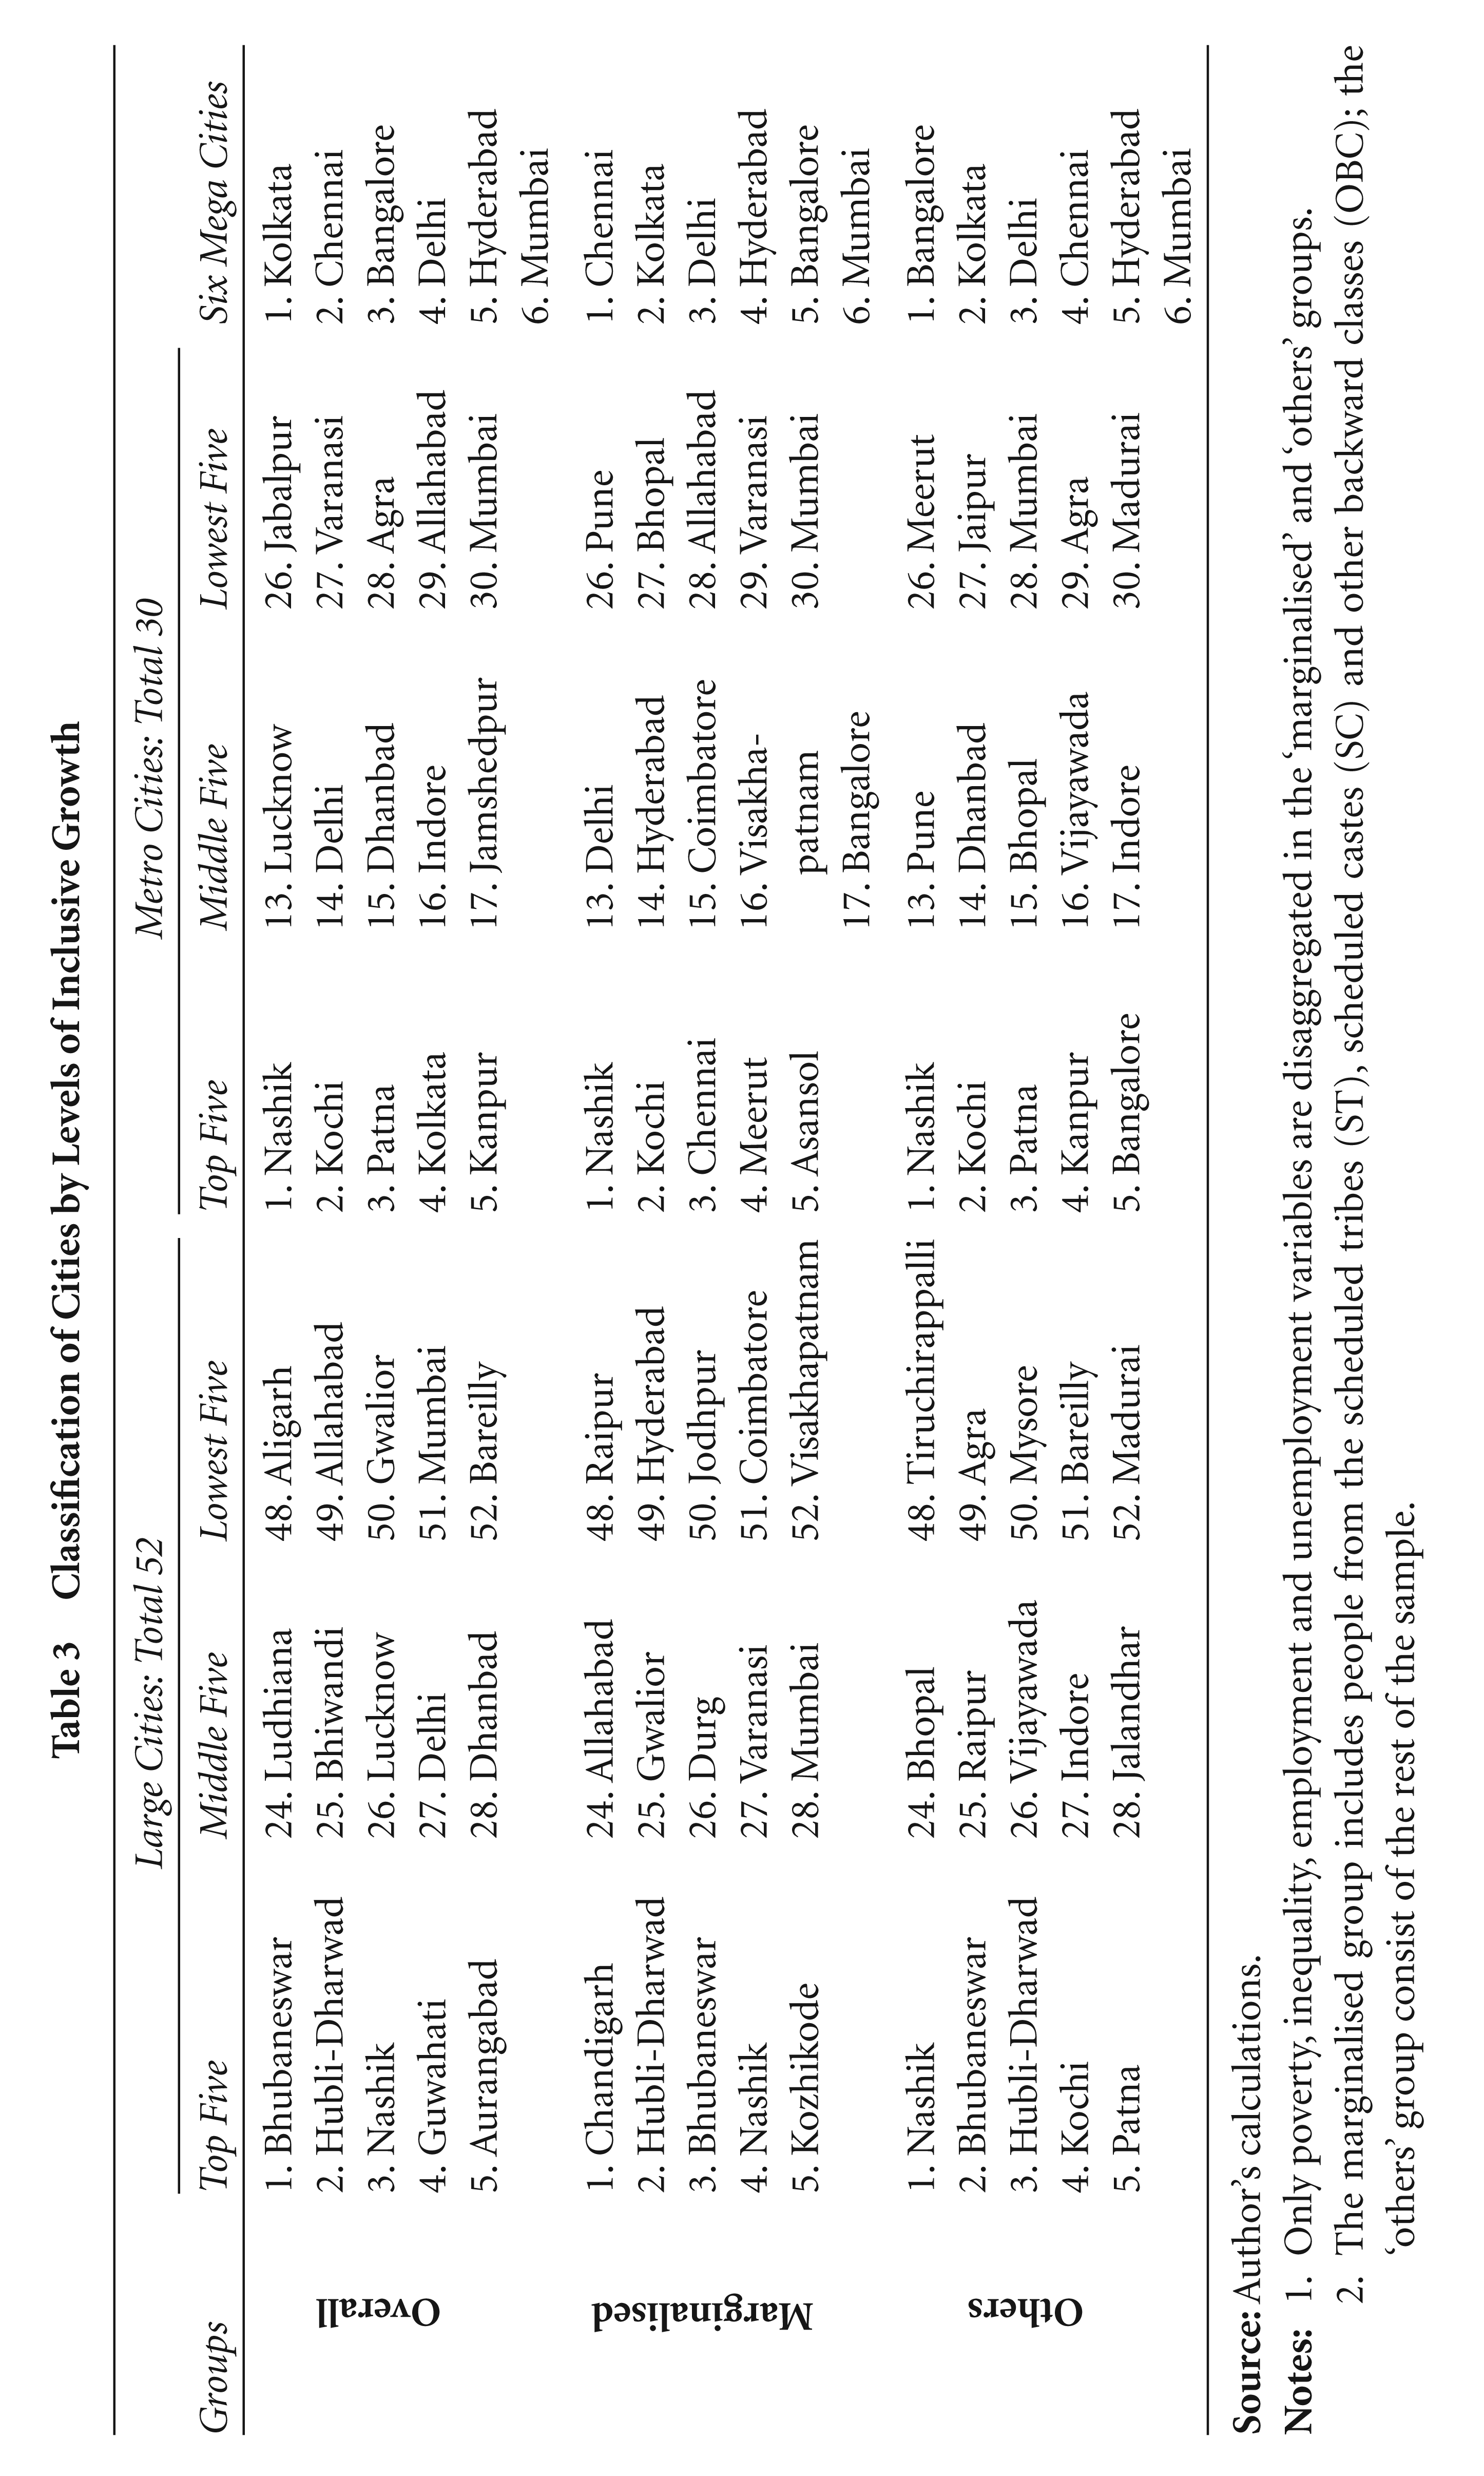
Only poverty, inequality, employment and unemployment variables are disaggregated in the ‘marginalised’ and ‘others’ groups. The marginalised group includes people from the scheduled tribes (ST), scheduled castes (SC) and other backward classes (OBC); the ‘others’ group consist of the rest of the sample.
Table 4 presents the name of the first three major economic variables which have the highest average contribution (in terms of percentage) to the value of CII for top five cities in terms of highest inclusive growth rate for ‘overall’ group. The ranking of the cities for the major economic variables are done by adding the ranking of cities by their respective components, if they have any sub variables. For instance, the ranking of cities for poverty are based on the sum of ranks of the cities as per poverty head count ratio, poverty gap index and squared poverty gap index. However, as inequality and economic growth have no components, they alone stand as the major variables. In case of Bhubaneswar (ranked first as per the highest inclusive growth) city the highest contribution to CII comes from the rank of poverty followed by rank of standard of living index and rank of economic growth. On the other hand, in case of Aurangabad (ranked fifth as per the highest inclusive growth) city the highest contribution to CII comes from the rank of poverty followed by rank of unemployment and employment. In addition, Table 4 shows among the seven economic major variables the rank of poverty plays an important role to the value of CII as it contributed most for the three cities those are ranked in top five as per the highest inclusive growth.
Most Average Contribution to CII: Overall
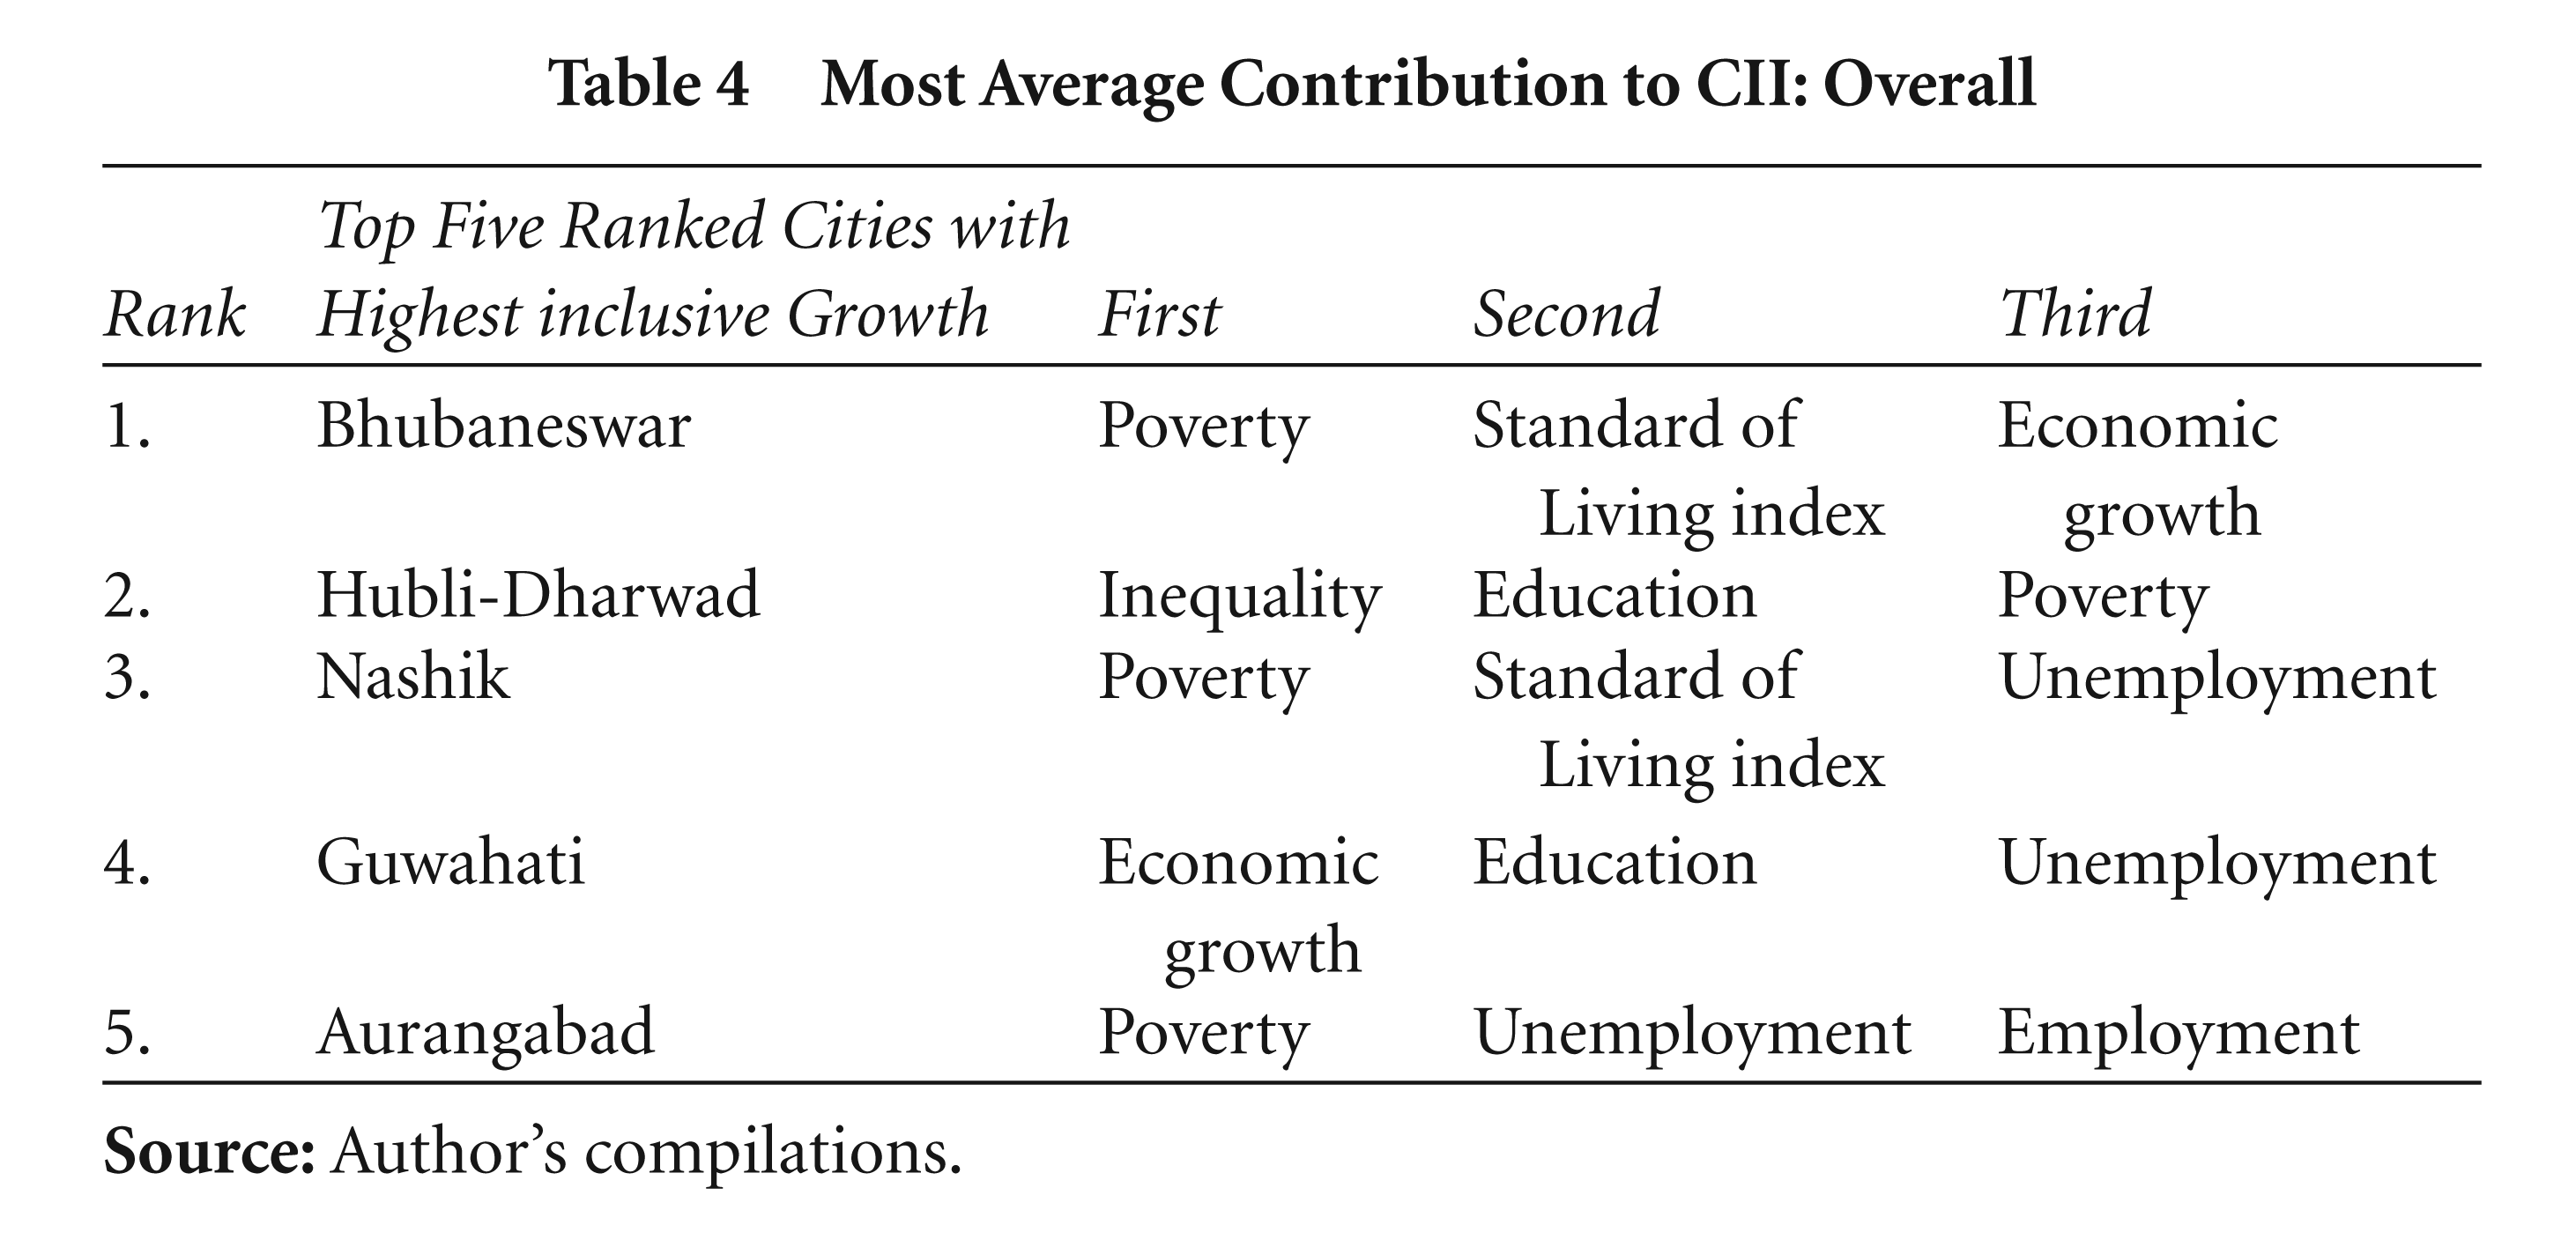
One important finding is that larger cities (by population size) show lower levels of inclusive growth. For instance, none of the mega-cities are among the top five, according to the ranking based on parameters of higher inclusive growth across the three groups.
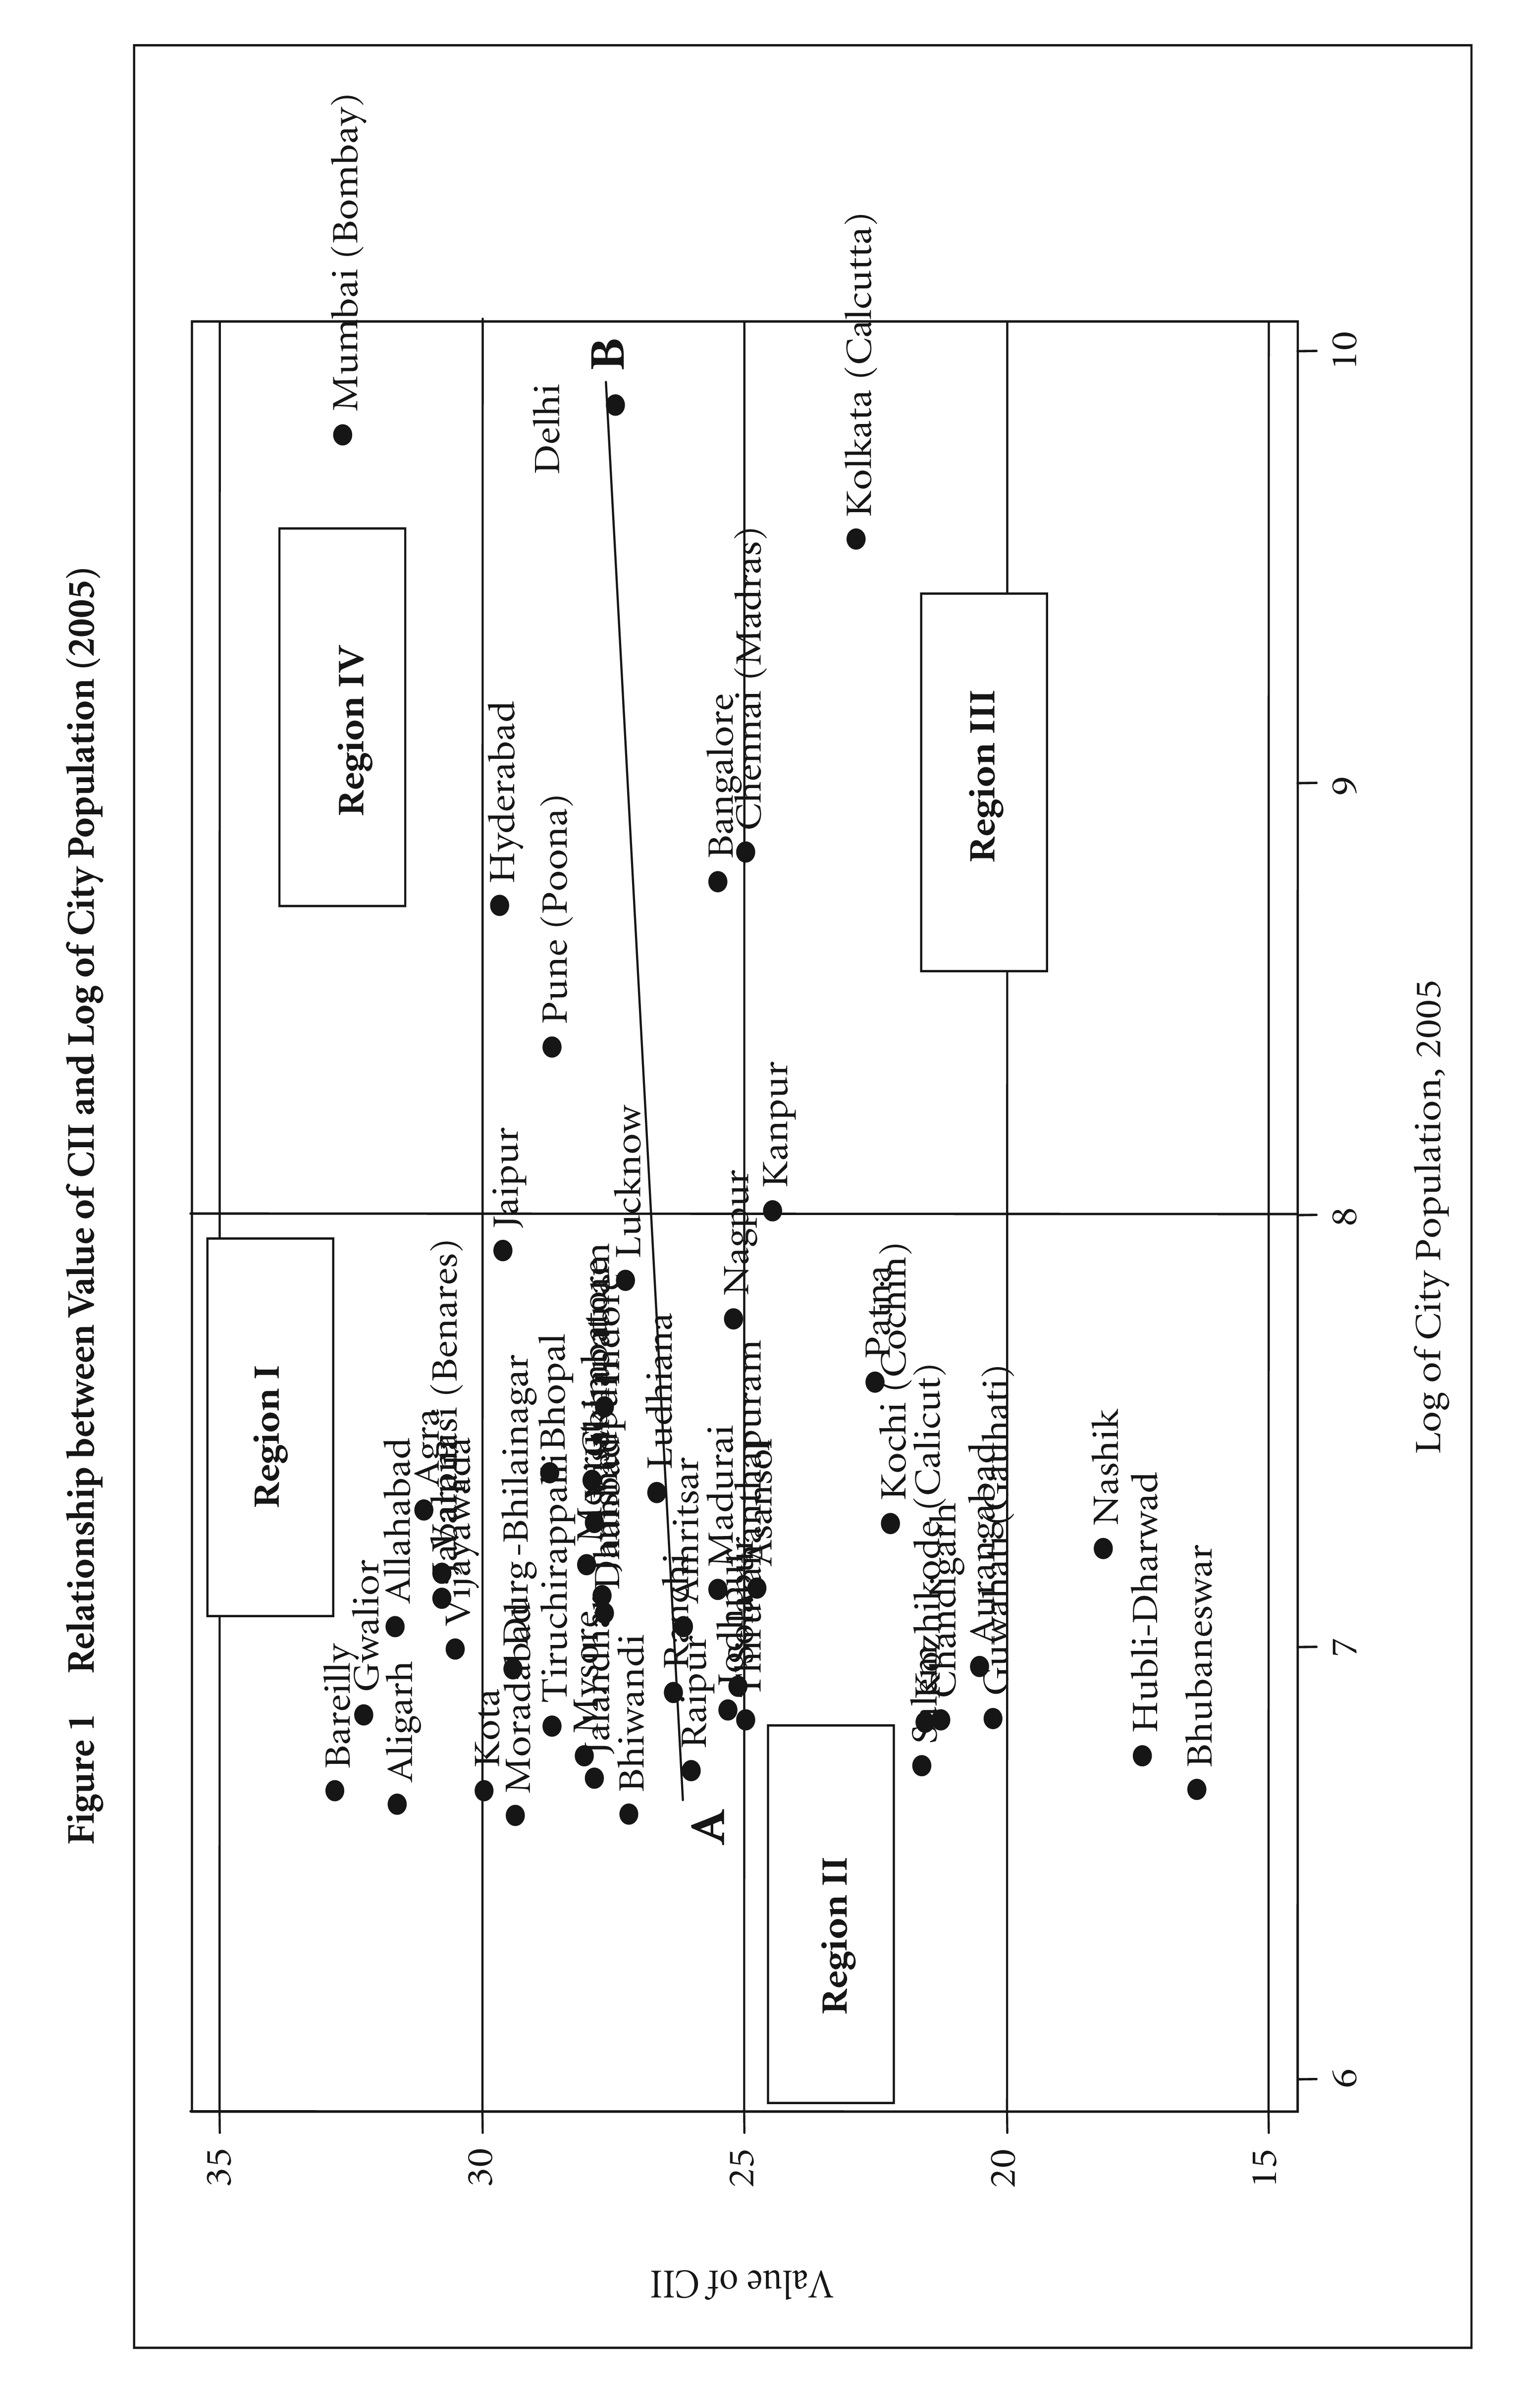
Figure 1 plots the cities in a scatter diagram and array into four basic quadrants for analytical purposes. The association between city inclusive growth and city population size is positive for cities in the lower left (region II) and upper right quadrants (region IV) of the scatter diagram. The correlation coefficients between city inclusive growth and city population size are 0.56 and 0.35 for this group of cities, respectively. This relationship is negative for cities in the other two quadrants—the upper left (region I) and lower right (region III) quadrants, which have correlation coefficients of –0.06 and –0.7, respectively. Overall, the straight line AB in the figure indicates an 11 per cent positive correlation between the value of the CII and the logarithm of city population as of 2005, indicating that the level of inclusiveness of a city decreases with city population size.
Relationship between Value of CII and Log of City Population (2005)
4.2.1 Per Capita Economic Growth and Level of CII
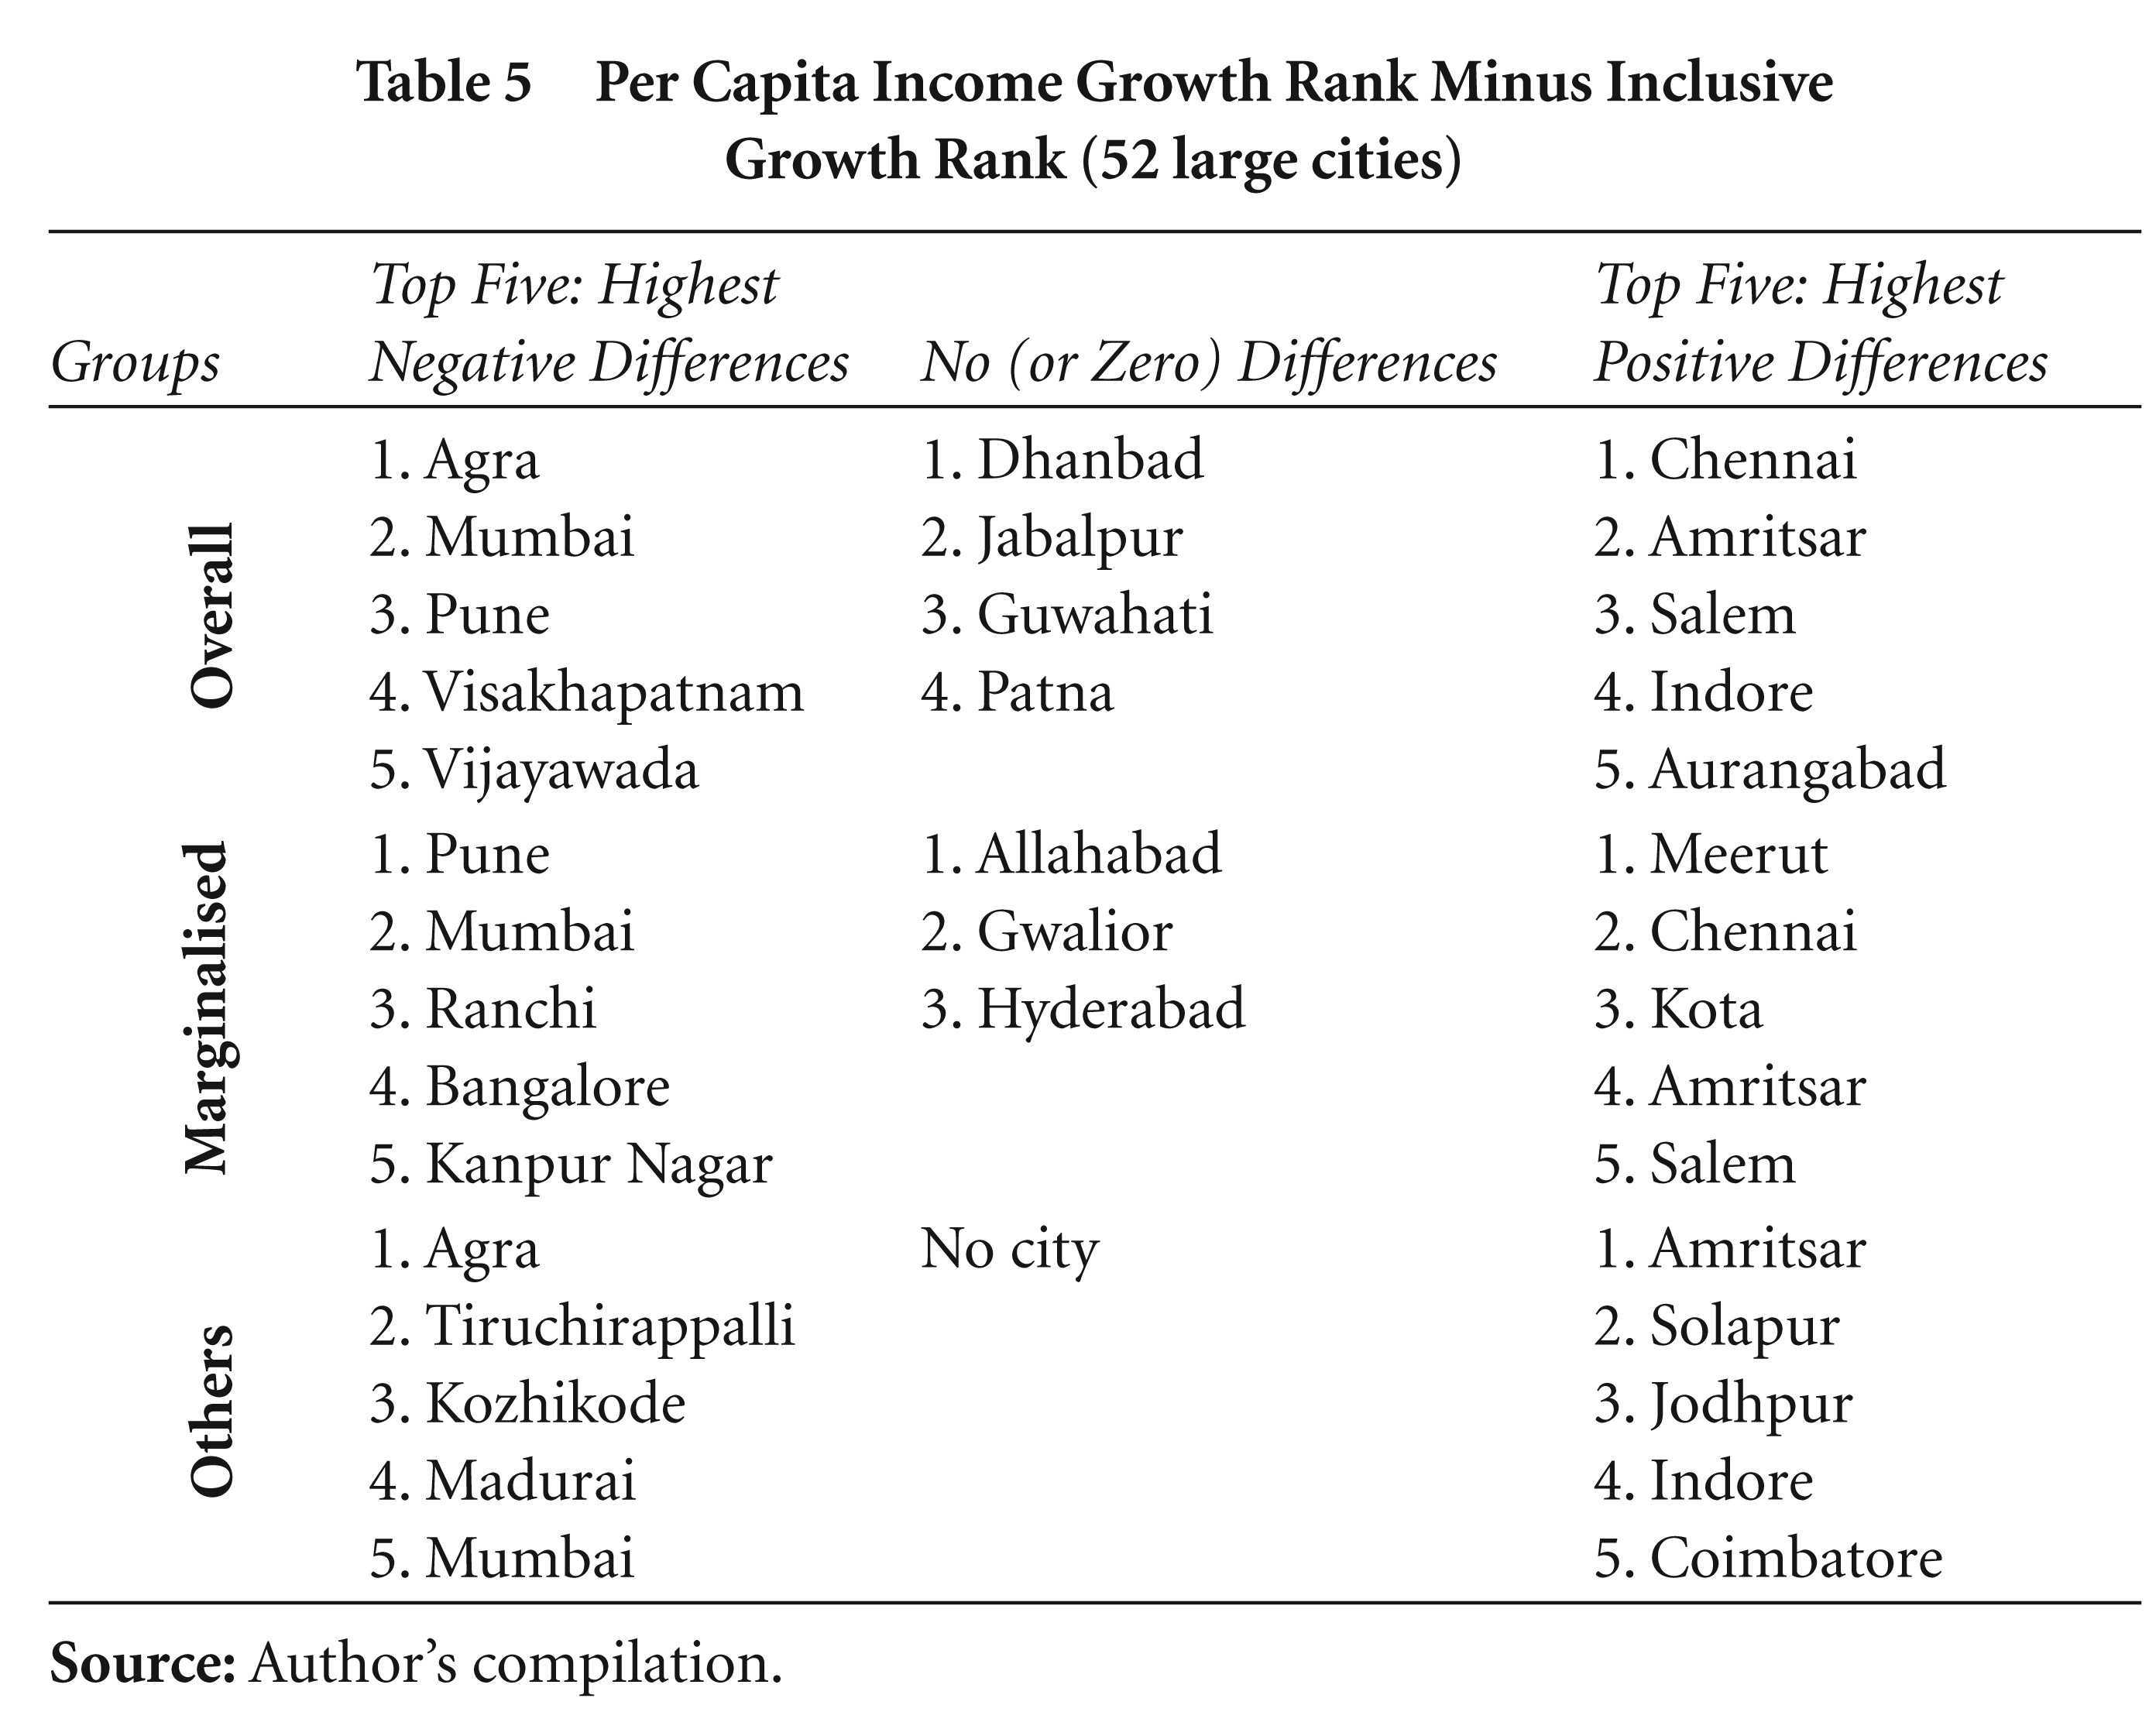
Table 5 presents the difference in rankings by per capita city economic growth and the CII. A negative value means that a city is higher ranked by city economic growth than by its CII and vice versa. Agra, Mumbai, Pune, Visakhapatnam and Vijayawada are ranked as top five cities with the highest negative differences in the ‘overall’ group. On the other hand, Chennai, Amritsar, Salem, Indore and Aurangabad are ranked top five cities with the highest positive differences, indicating that these cities are better ranked by their CII than by economic growth in the ‘overall’ group. Most interestingly, Dhanbad, Jabalpur, Guwahati and Patna show no differences in their ranking by city economic growth and CIIs for the same group. In addition, Pune (or Agra) has the highest negative difference in the ‘marginalised’ (or ‘others’) group and Meerut (or Amritsar) has the highest positive difference in the ‘marginalised’ (or ‘others’) group.
Per Capita Income Growth Rank Minus Inclusive Growth Rank (52 large cities)
Spearman’s Rank Correlation Coefficient
***, **, and * indicate statistical significance at the 1%, 5% and 10% levels, respectively. See Table 1 for variable definitions.
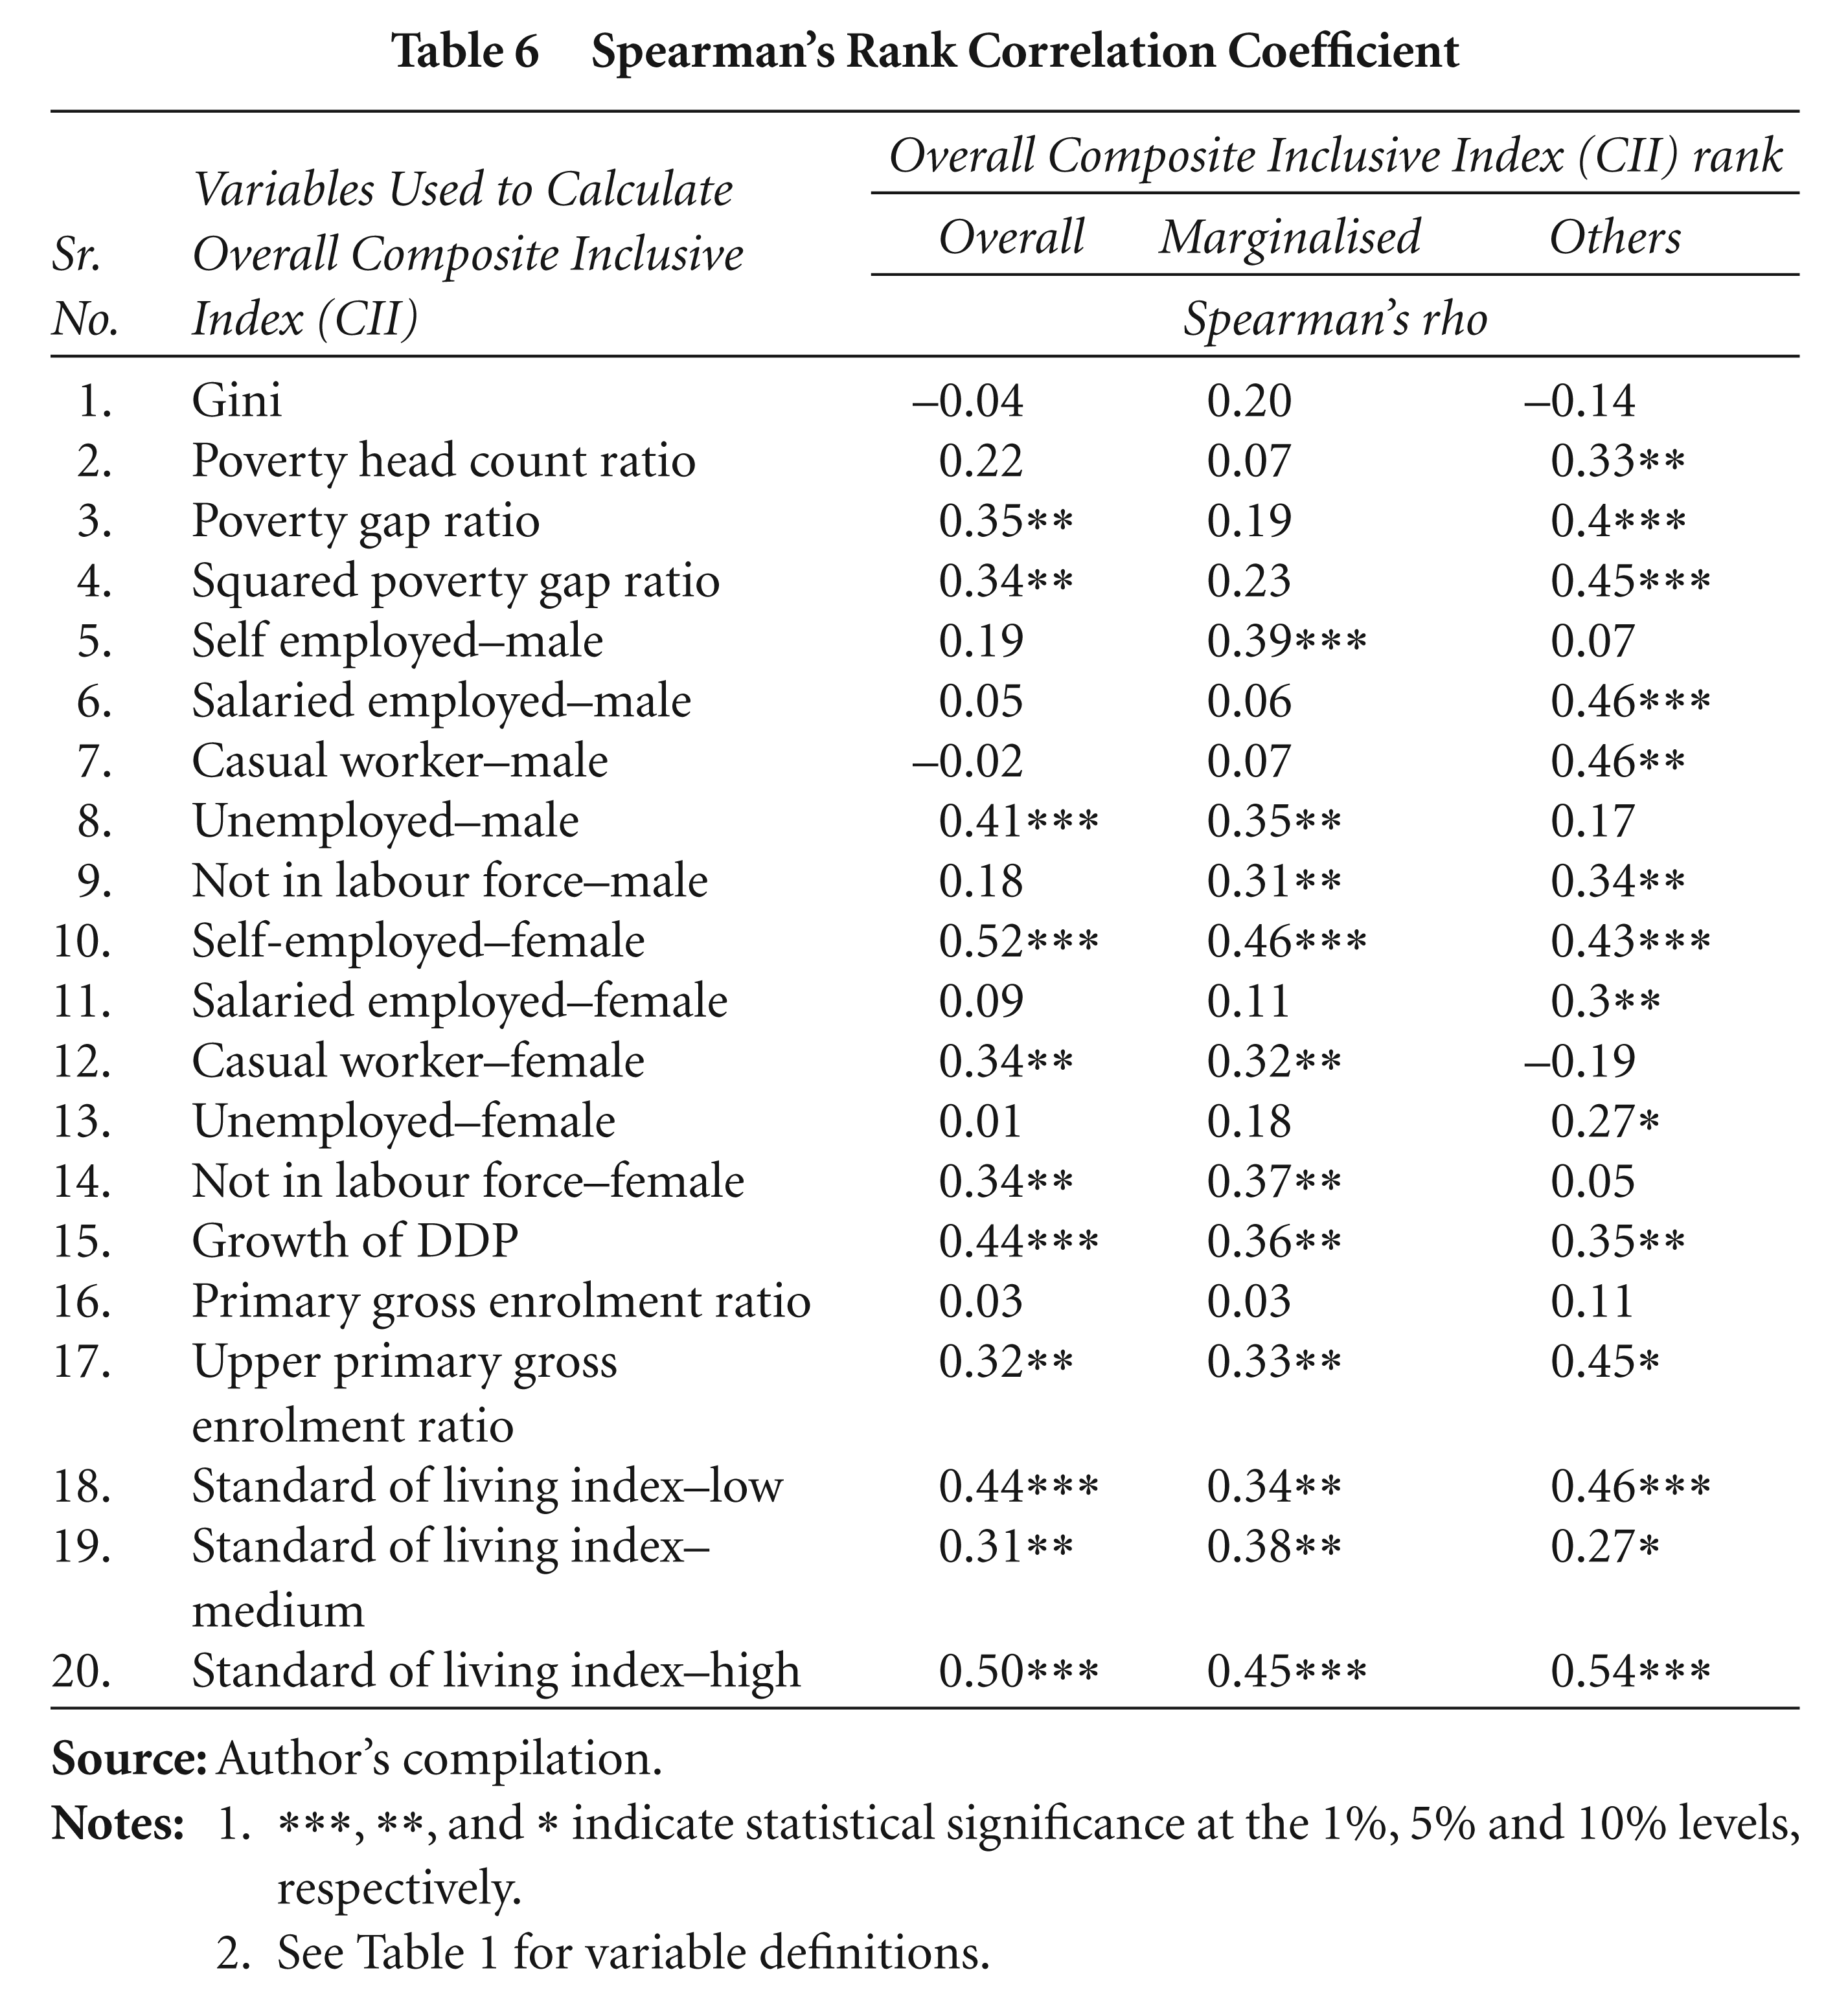
To quantify the relationship between the rank of a city according to its CII and its individual rank city based on the 20 variables of the CII, the rank correlation coefficient is obtained. Table 6 gives these correlation coefficients (Spearman) for ‘marginalised’, ‘others’ and ‘overall’ (sum of ‘marginalised’ and ‘others’) group, separately. The correlation coefficients between the ranks of the cities according to their overall composite CII (or as per the Borda ranking) with their ranks according to self-employed females, growth of DDP, upper primary gross enrollment ratio, low (or medium or high) standard of living index are higher, positive and statistically significant. This indicates that the ranking of cities by these variables is closer to the ranks according to the value of the city-wise CII. Thus, if a city shows a higher rank (or perform well) based on these variables, it also shows a higher rank (i.e., higher inclusive growth) as per its rank according to the CII. Moreover, for the ‘marginalised’ group the correlation coefficients between the rank of the cities according to the overall CII and their rank according to not in labour force female, unemployed male, not in labour force male, casual worker female and self-employed male are positive and statistically significant. On the other hand, for the ‘others’ group the correlation coefficients between the rank of the cities as per the overall CII and the ranks according to unemployed female, salaried employed male, casual worker male, not in labour force male, salaried employed female, poverty head count ratio, poverty gap ratio and squared poverty gap ratio are positive and significant. In general, the correlation coefficients are not high and do not indicate closeness of variables and rank of cities by their CII rank for all three groups.
Table 7 provides the correlation coefficient (Spearman) between the ranking of cities by CIIs and each of the ranking based on seven major economic variables. The calculated results show that the ranking of cities by economic growth, employment, unemployment and standard of living index are closer to the rank of cities by the values of the city CII for all three groups (i.e., ‘marginalised’, ‘others’ and ‘overall’). This indicates that cities which are ranked higher in terms of economic growth, employment, unemployment and standard of living index, are also ranked higher in terms of higher inclusive growth. In addition, the correlation coefficients between the ranking of cities by poverty and the value of CII are positive and statistically significant for the ‘overall’ and ‘others’ groups.
Spearman’s Rank Correlation Coefficient between Ranks of Major Variables and Overall CII Rank
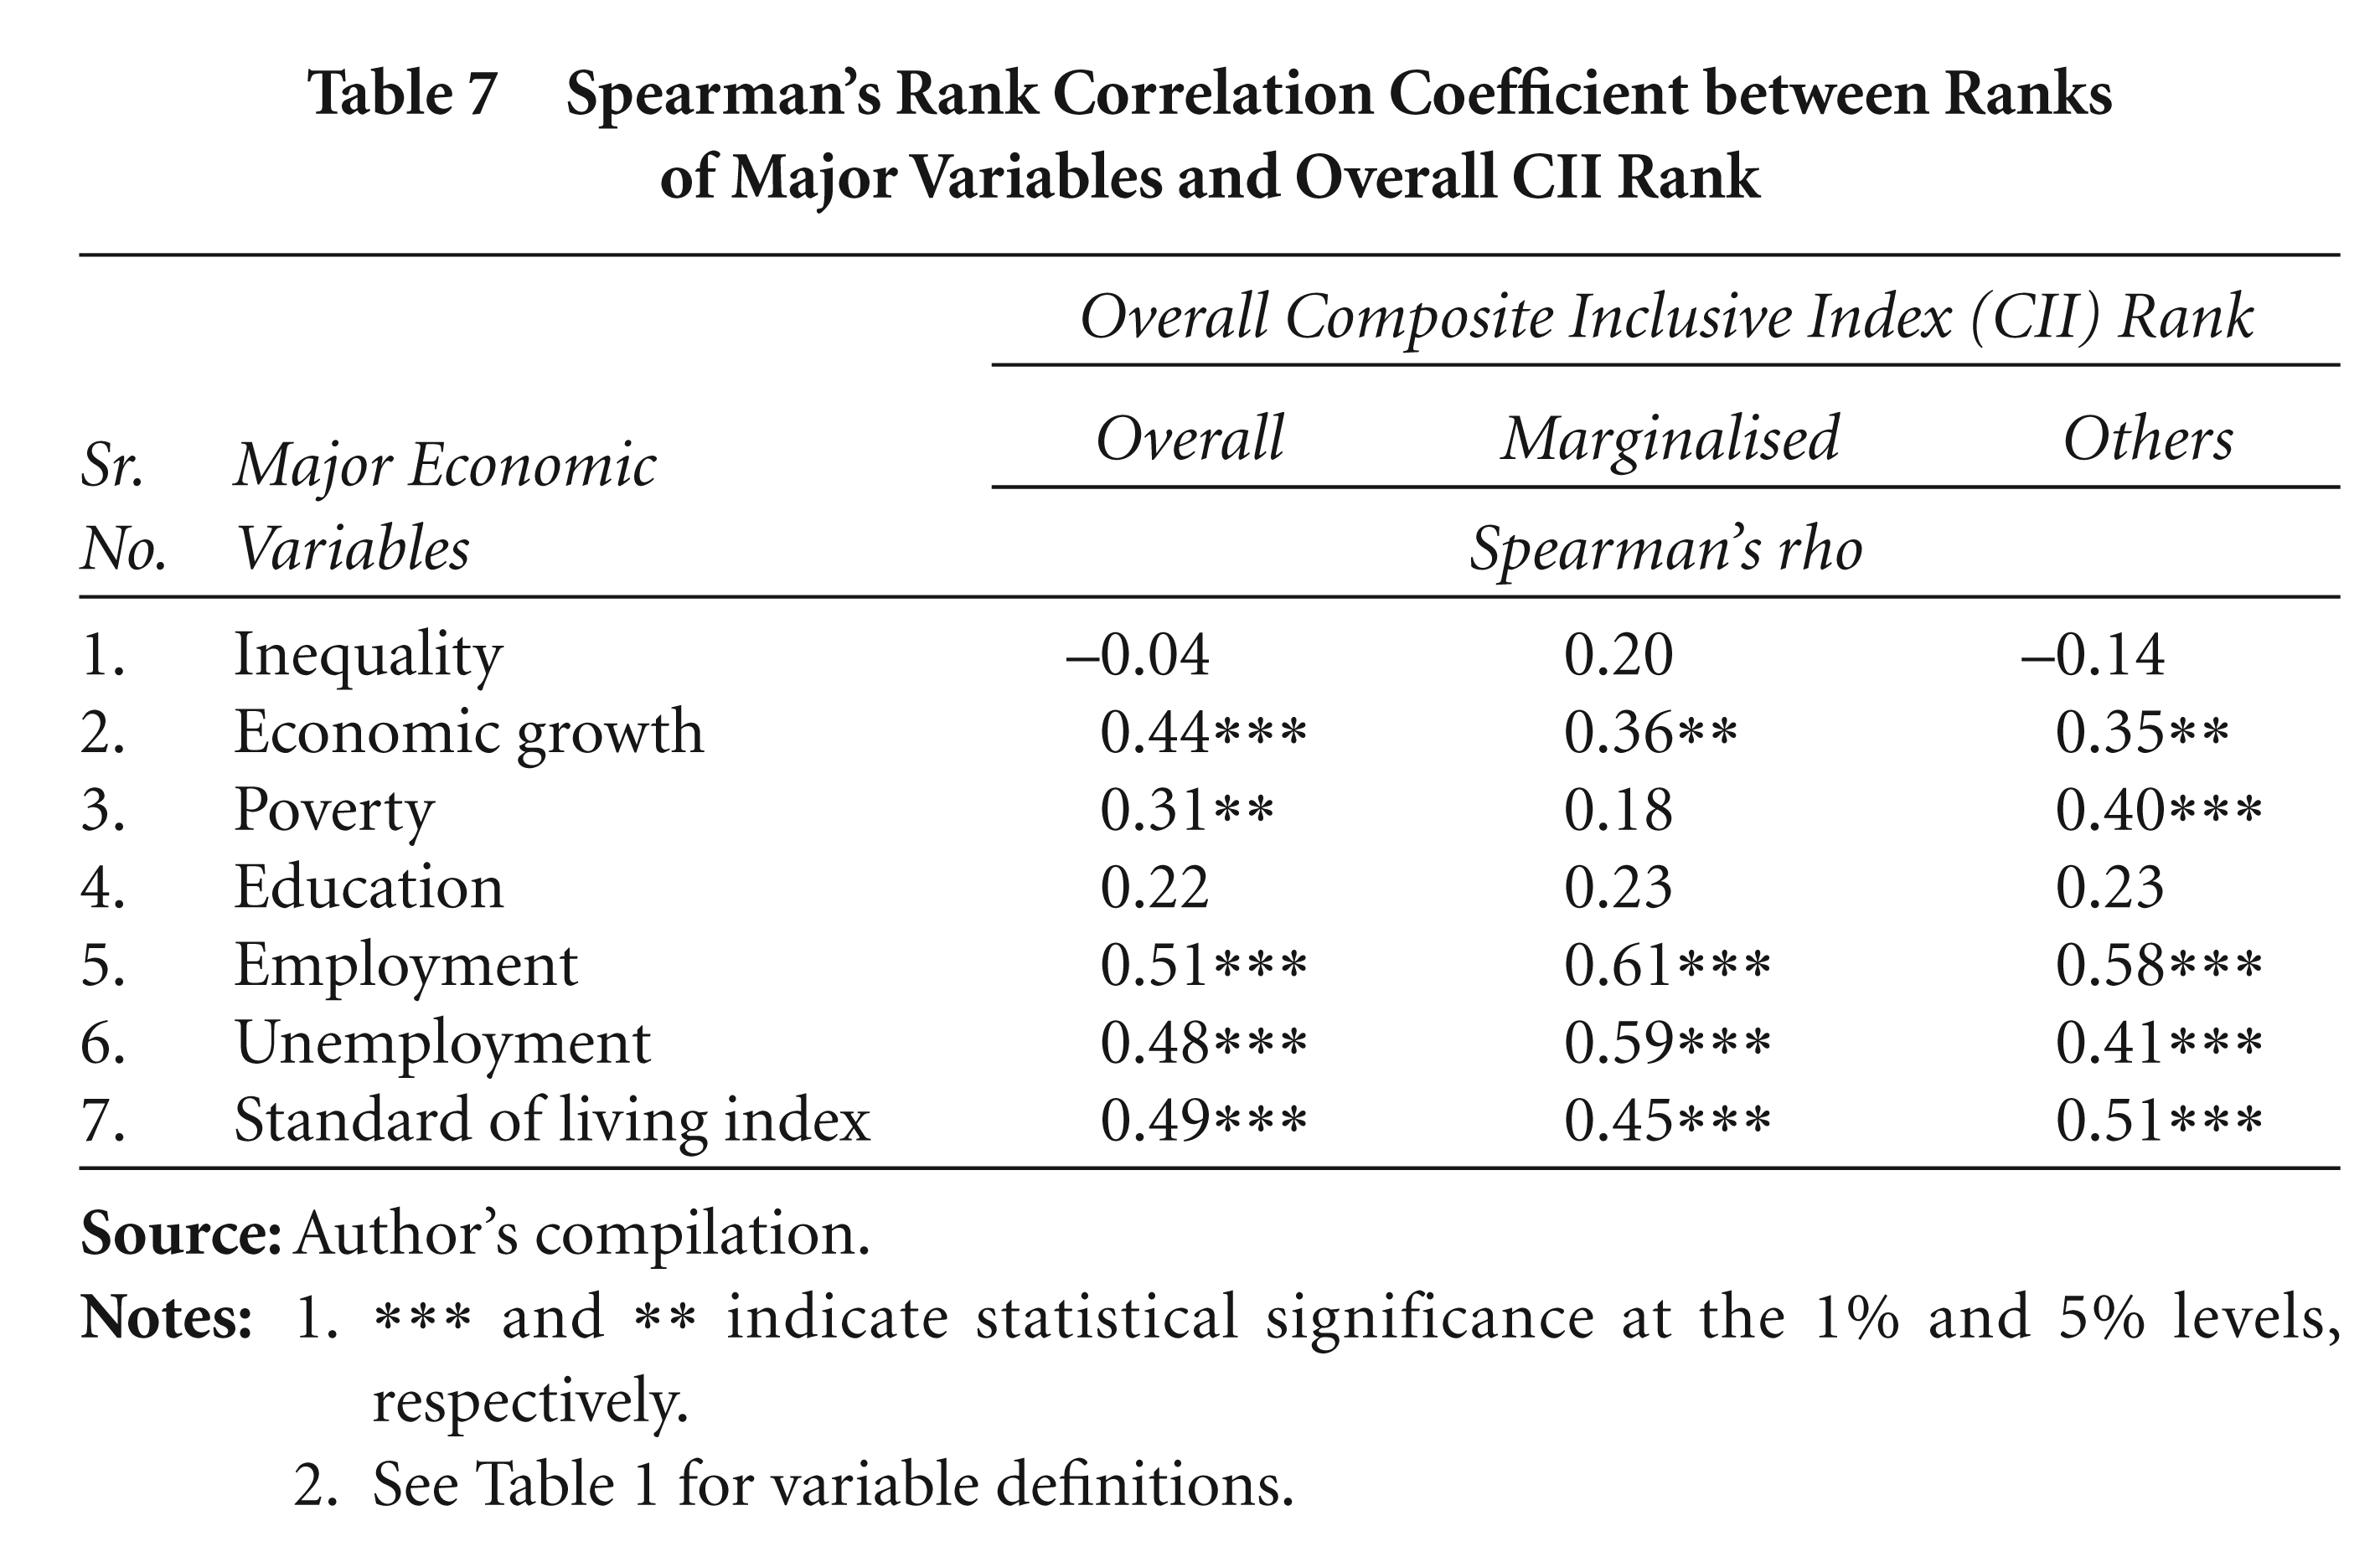
*** and ** indicate statistical significance at the 1% and 5% levels, respectively. See Table 1 for variable definitions.
Further, to quantify the relationships among the ranks of cities by major economic variables, the rank correlation (Spearman) coefficient is estimated. Table 8 provides the correlation coefficient among the ranking of cities based on these seven major variables for the three groups (i.e., ‘overall’, ‘marginalised’ and ‘others’), separately. The results show that the correlation coefficients between the ranking of cities by standard of living index and economic growth, unemployment and employment are positive and significant for all three groups (i.e., the ‘overall ’, ‘marginalised’ and ‘others’) groups. This indicates that if a city displays a higher standard of living index (or lower level of unemployment rate), it also shows higher economic growth (or higher employment rate). The correlation coefficient between employment and economic growth is positive and significant for the ‘others’ group. For the ‘overall’ and ‘others’ groups, the statistically significant negative correlation between employment and inequality indicates that if a city has a higher level of inequality, it typically has a lower level of employment. The correlation coefficient between unemployment rate and poverty is negative and statistically significant for the ‘marginalised’ group. This indicates that higher level of unemployment rate increases poverty level. In addition, for the ‘overall’ group, the correlation coefficient between the ranks of cities as per the standard of living index and inequality indicates that if a city has a higher level of inequality, it displays a lower standard of living index.
Spearman’s Rank Correlation Coefficient Between Ranks of Major Variables
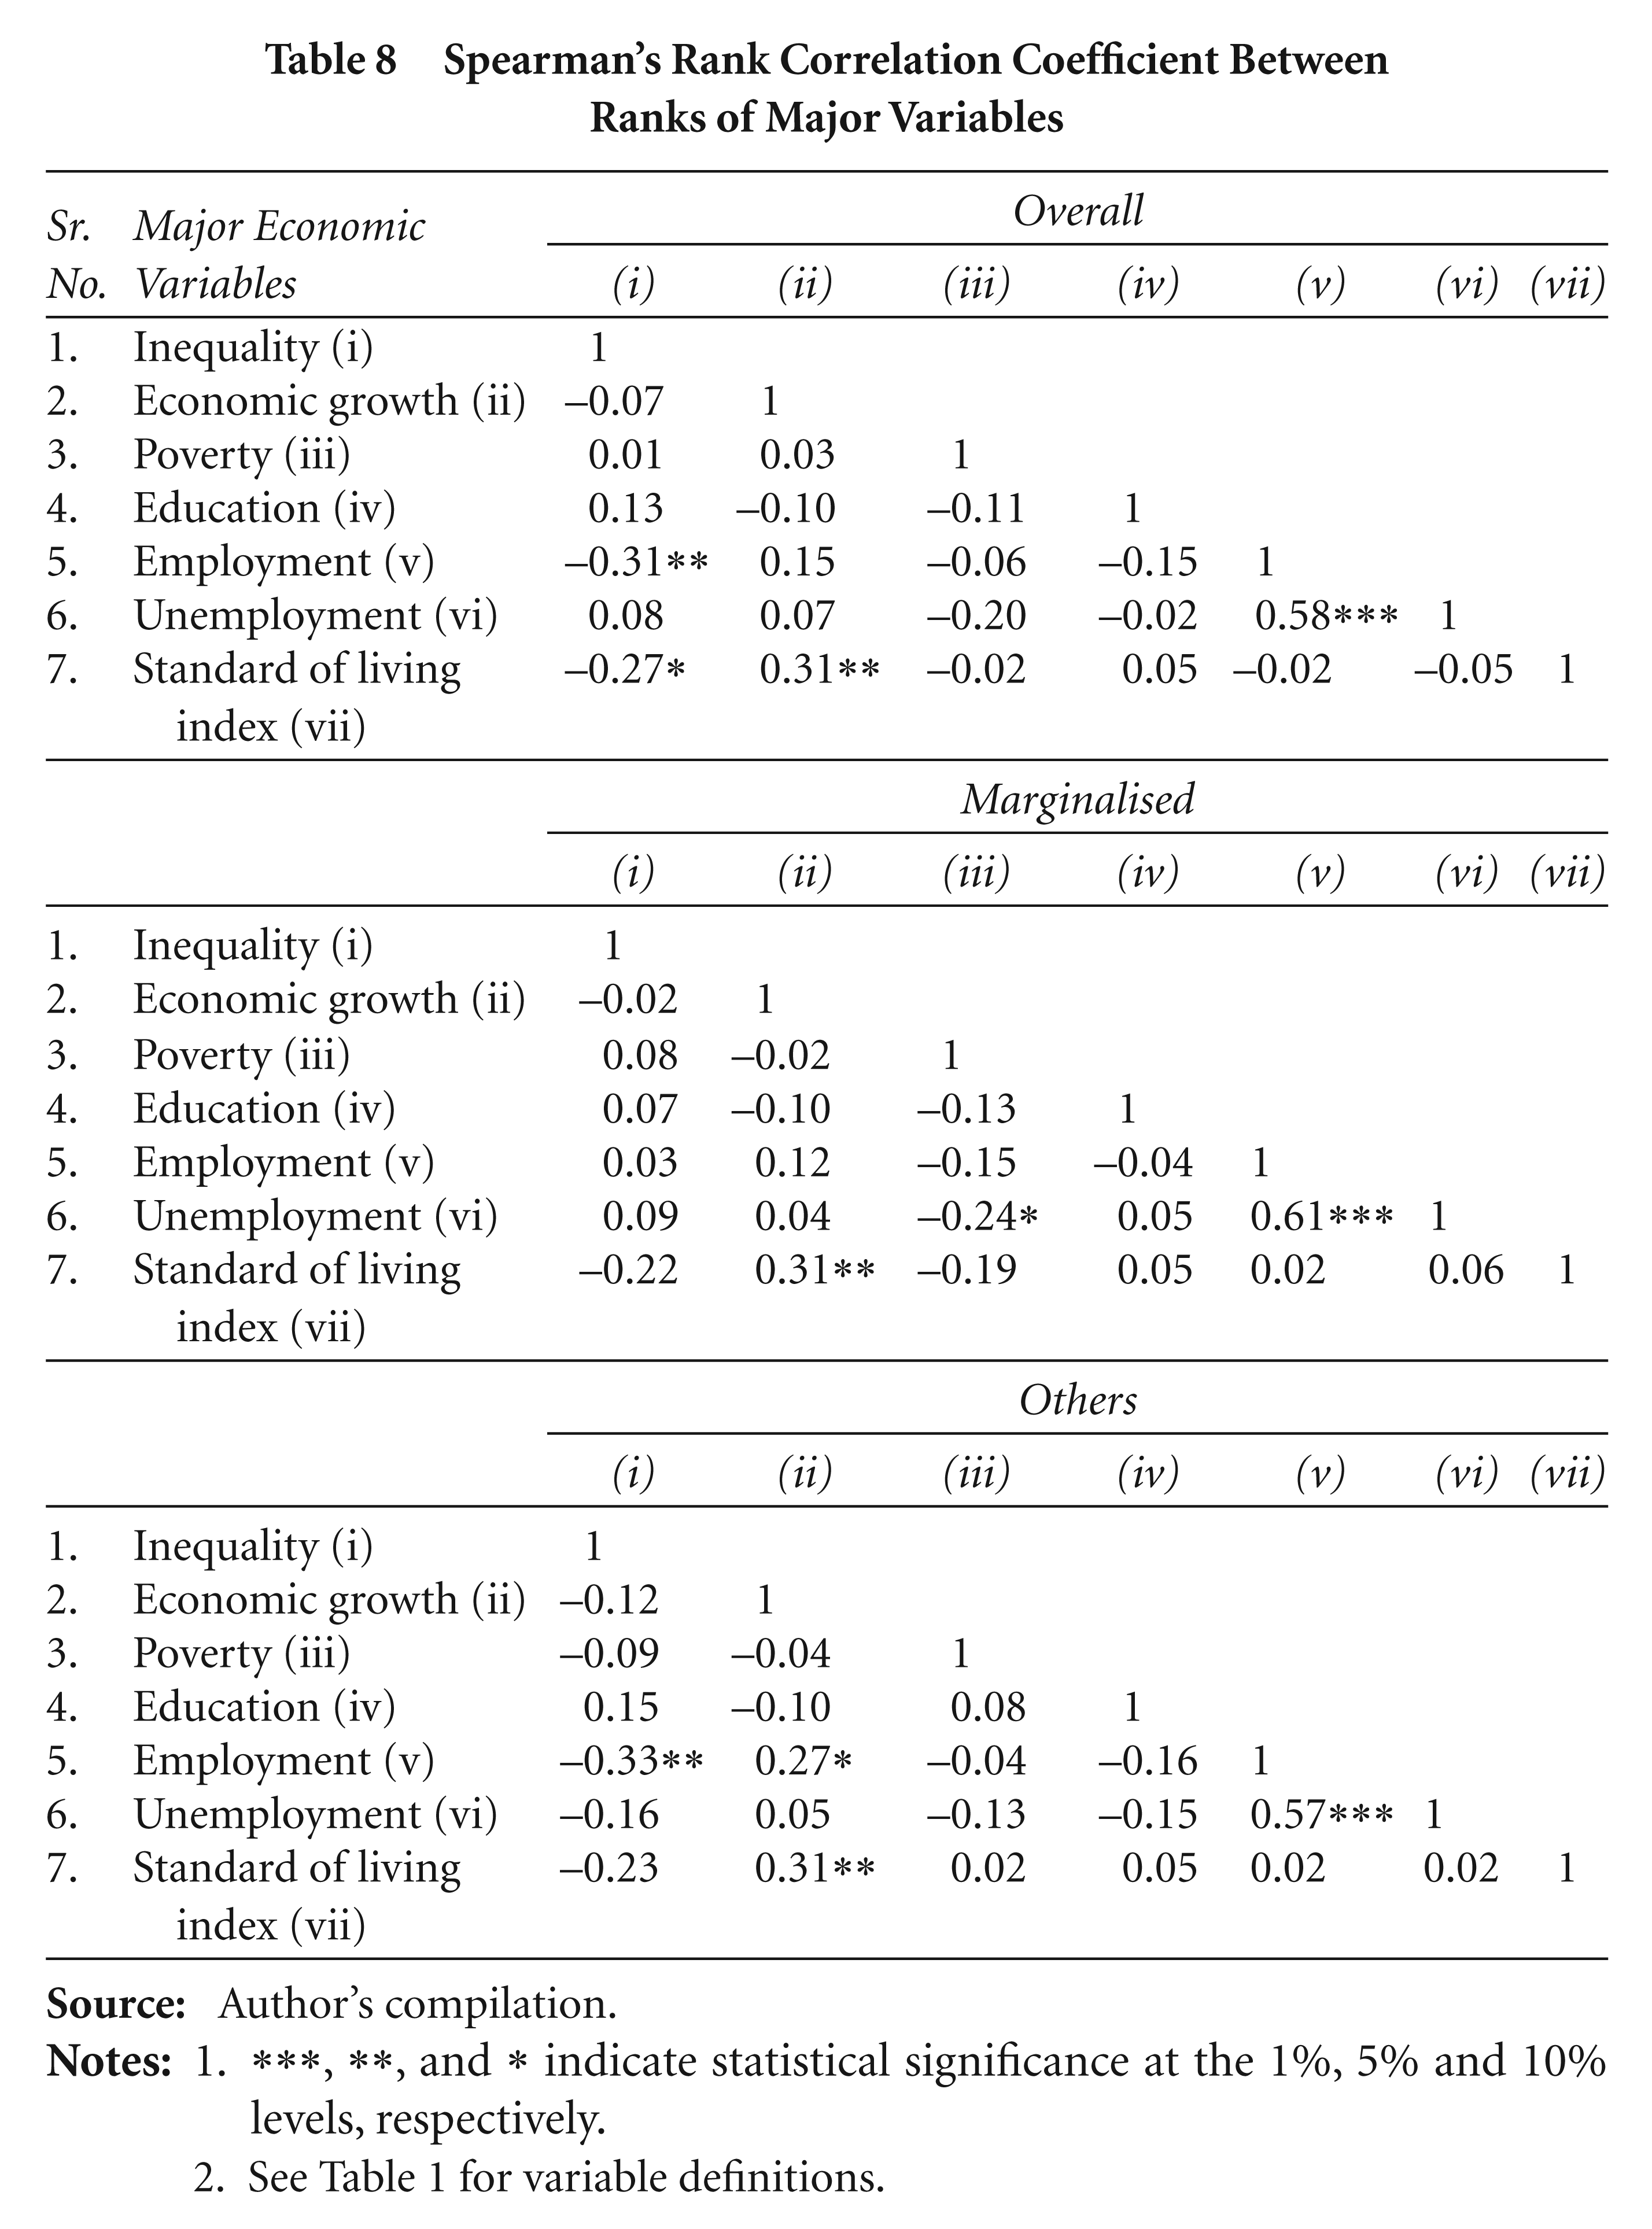
***, **, and * indicate statistical significance at the 1%, 5% and 10% levels, respectively. See Table 1 for variable definitions.
In general, the correlation coefficients (Spearman) in Tables 6 to 8 are not close to unity, indicating that there is not a perfect correlation between the ranking of cities by the different variables and their ranks by the CII. This implies that to increase the inclusiveness of a city, all the variables of inclusiveness need to be improved together, because different variables capture different dimensions of inclusiveness.
4.3 Regression Results
The following regression results measure the relationship between inclusive growth and economic growth at the aggregate level, by considering the growth rate of the constructed scores of the CII and at the disaggregated level by looking at the reduction in the growth of city poverty and in the growth of city inequality. In other words, they also measure the relationships between the growth rate of the CII, of city poverty and of city inequality.
4.3.1 Determinants of the Growth Rate of Urban Poverty
Table 9 summarises the key results from the linear regressions based on equation(2). Regression(1) shows the estimates of the full model which include all variables. The results of regressions(2) and(3) pertain to a parsimonious model and exclude controls that are not found to be statistically significant or do not go with the expected sign of the regression parameters. All the regressions provide OLS results with robust standard errors (to correct heteroskedasticity) in parentheses.
Determinants of Growth in Urban Poverty: Estimates of OLS
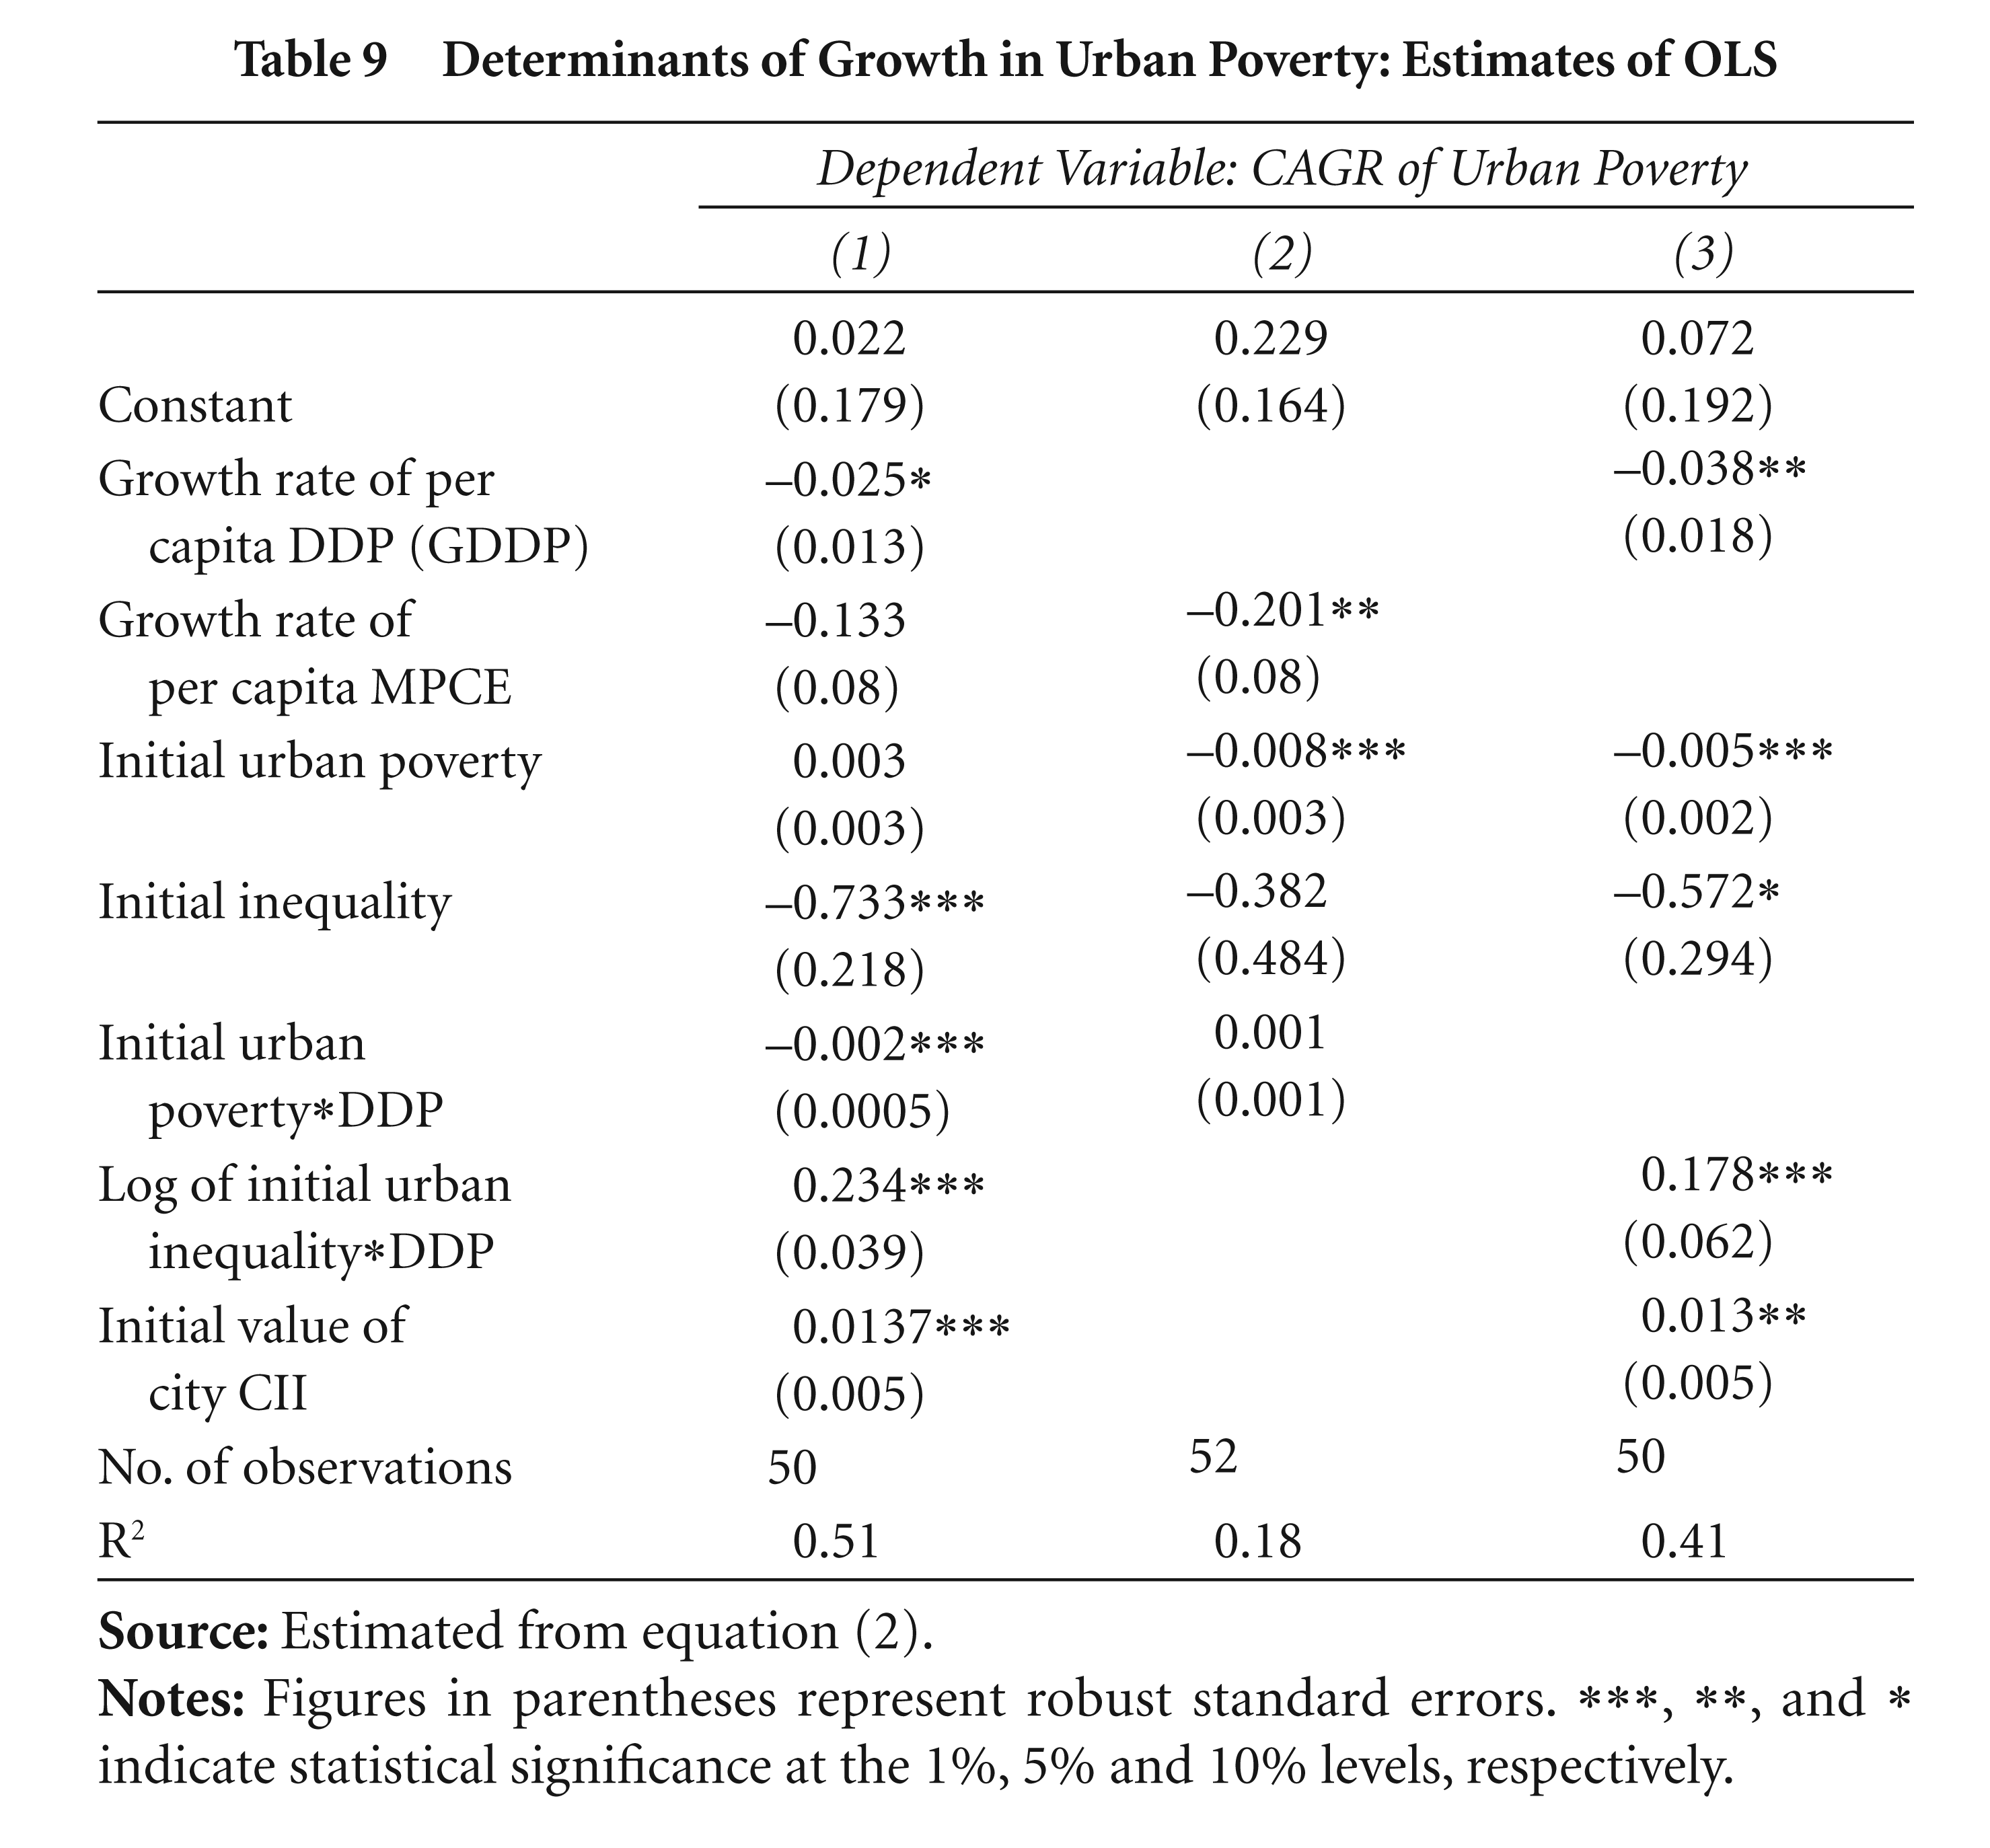
Regression(2) explains 18 per cent of the variation in growth rate of poverty across cities, whereas regression(3) explains 41 per cent. The results in regression(2) show that the growth rate of per capita MPCE (as a proxy for income growth) has a significant negative effect on the growth rate of poverty, which implies that with a 10 per cent increase in the growth of MPCE, the growth rate of poverty comes down by almost 20 per cent. Higher initial inequality (measured by the Gini coefficient) and initial poverty have negative effects on the growth of poverty, though only the coefficient of initial urban poverty is statistically significant. In addition, the interactive effect of income growth (measured by per capita DDP growth) with initial poverty has a positive effect on the growth in urban poverty, even though the coefficient does not show any significant result.
Regression(3) presents the results of the parsimonious specification. The results show that a higher growth of DDP per capita has a strong (or robust) negative effect on the growth of urban poverty. The coefficient (–0.038) indicates that with a 10 per cent increase in the growth rate of DDP, the growth rate of poverty declines by 0.4 per cent. Initial urban poverty remains at the same level of significance and sign conditions as in regression(2). However, initial inequality shows a significant (at the 10 per cent level) negative effect on the growth in urban poverty. The interactive effect of income growth (measured by per capita DDP growth) with initial inequality shows a positive effect on the growth in urban poverty. Finally, the initial higher value of the CII has a significant and positive impact on the growth in urban poverty, which indicates a lower level of city inclusive growth associated with higher growth of poverty.
4.3.2 Determinants of the Growth Rate of Urban Inequality
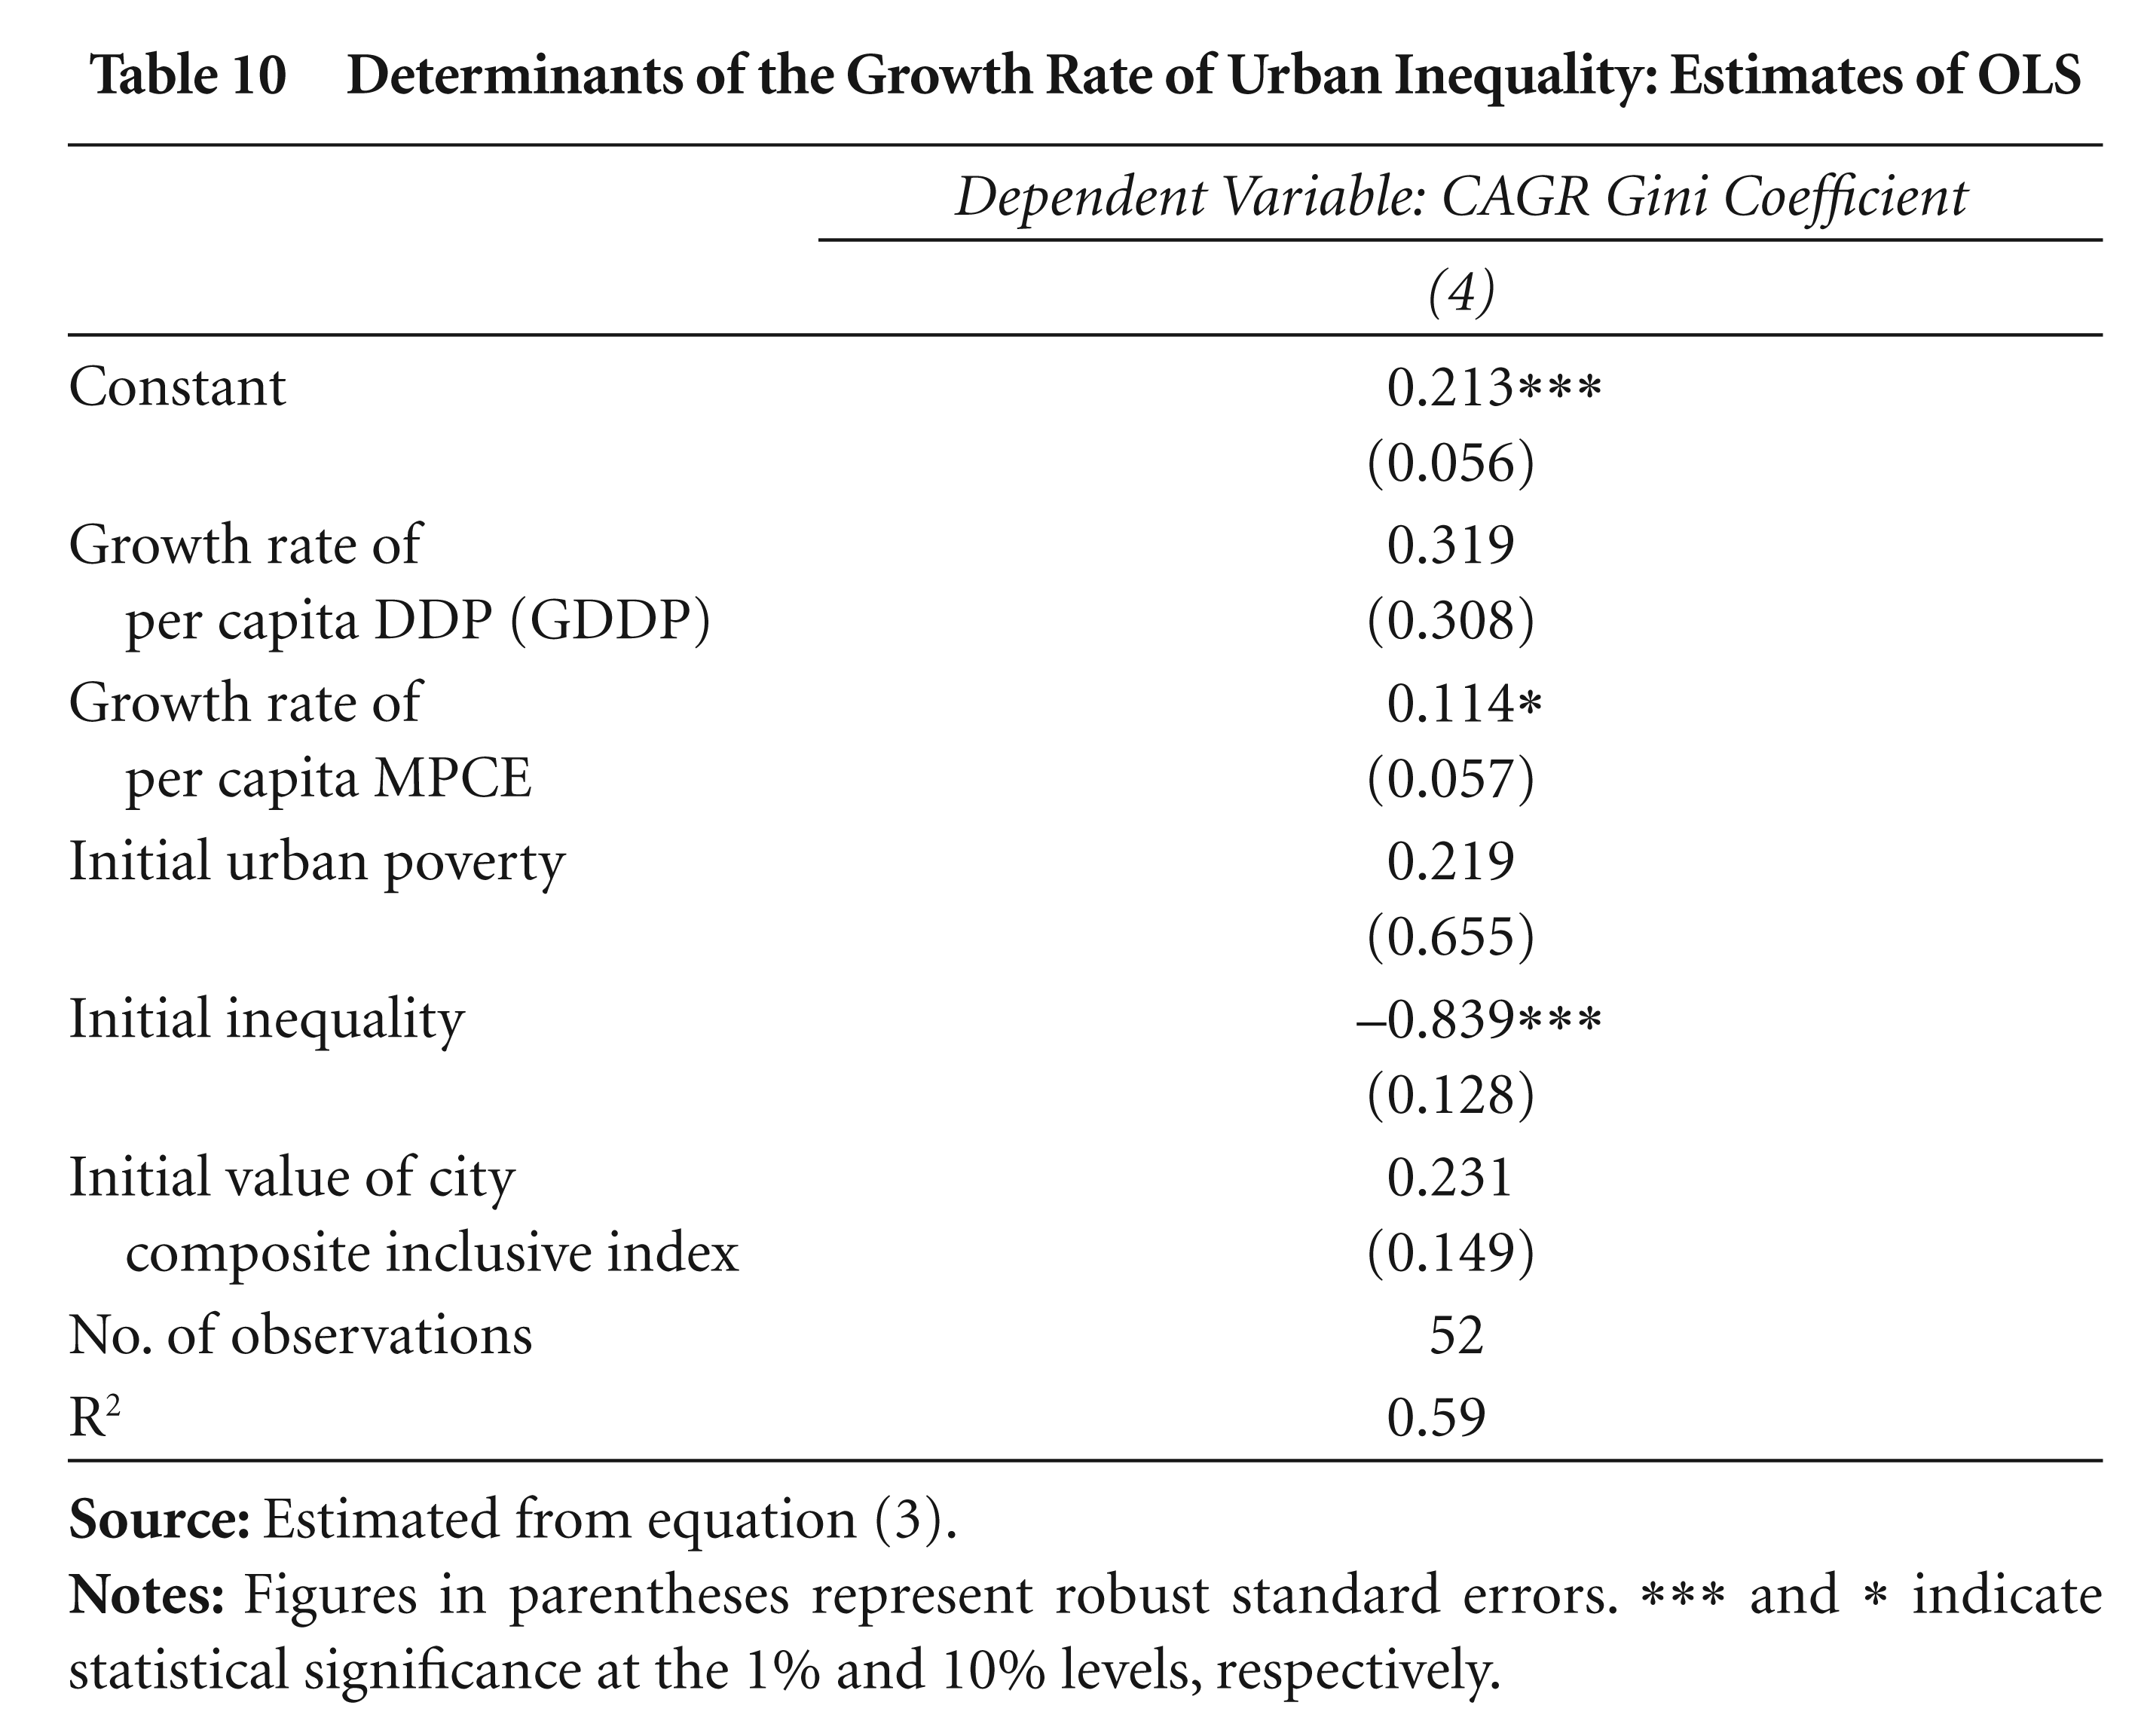
Table 10 gives the key results from the OLS regressions based on equation(3). The results in regression(4) show that higher growth of per capita MPCE significantly (at 10 per cent level) increases the growth rate of urban inequality. The coefficient (0.114) indicates that with a 10 per cent increase in the growth rate of per capita MPCE, the growth rate of urban inequality increases by 11 per cent. Although the growth rate of per capita DDP shows a positive impact on the growth rate of inequality, the coefficient is not statistically significant. On the other hand, an initial higher inequality significantly (at 1 per cent) reduces the growth rate of urban inequality. Thus, a 10 per cent increase in the initial level of inequality reduces growth rate of urban inequality by 8.4 per cent. Initial higher poverty increases the growth rate of poverty, though the coefficient is not statistically insignificant. However, the initial overall inclusive growth of a city has a positive effect on the growth of urban inequality. A 100 per cent increase in initial overall inclusive growth of a city index increases the growth rate of inequality by 0.2 per cent, however, the coefficient is not significant. Regression(4) explains 59 per cent of the variation in growth rate of inequality across cities.
Determinants of the Growth Rate of Urban Inequality: Estimates of OLS
4.3.3 Determinants of Urban Economic Growth
Table 11 summarises the key results from the OLS regressions based on equation(4). The growth rate of per capita DDP stands as a dependent variable in regression(5). The negative and significant (at 10 per cent) coefficient of the growth rate of the CII indicates that a 1 per cent increase in the growth rate of the CII (i.e., a lower level of inclusive growth) reduces the growth rate of income (i.e., per capita DDP) of a city by 5.4 per cent. The coefficient of initial urban poverty is negative and significant at the 10 per cent level. The coefficient (–0.244) indicates that a 10 per cent increase in initial urban poverty levels causes the growth rate of per capita income to fall by 24 per cent. The estimated results show that the initial CII (or growth rate of urban inequality) has a negative effect on the growth rate of per capita DDP, while initial inequality has a positive effect. However, the variables do not show any significant impact (the coefficients are statistically not significant) on the growth rate of per capita DDP. The regression explains only 15 per cent of the total variation in the dependent variable.
Determinants of the Growth Rate of Urban Economic Growth: Estimates of OLS
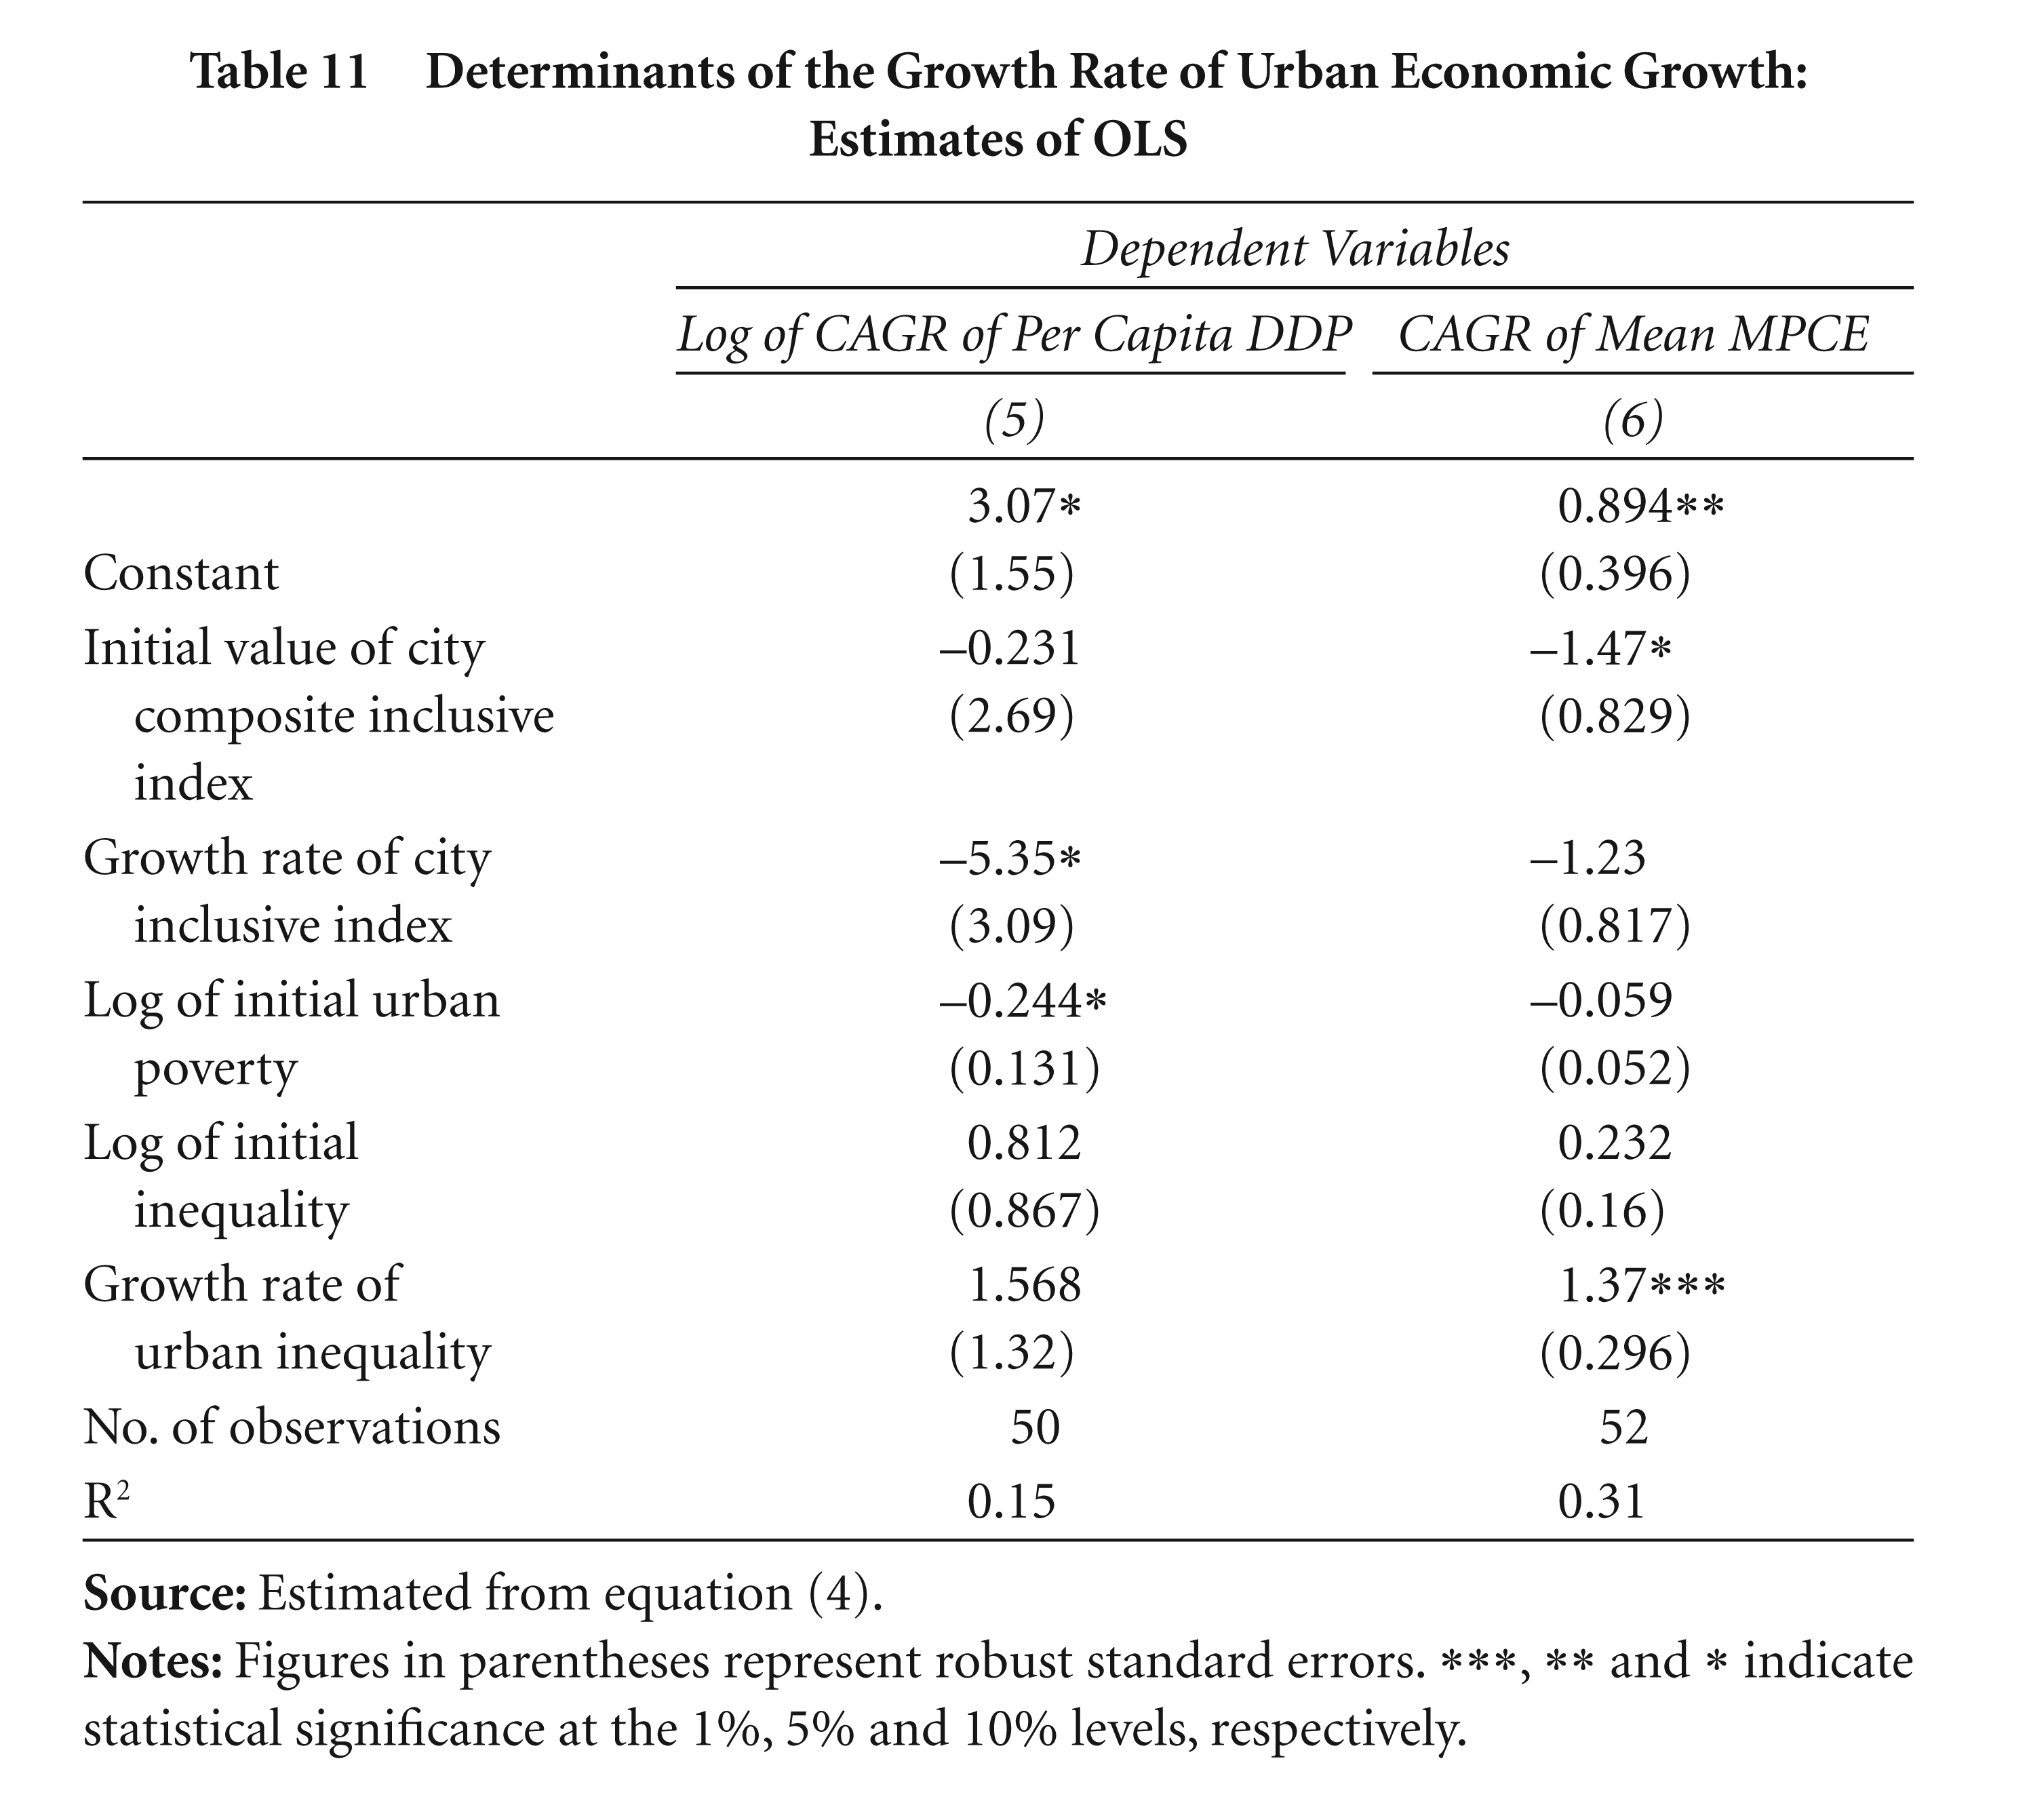
In regression(6) we consider the growth rate of per capita MPCE as a dependent variable which is proxied as income growth. The results in regression(6) show that the growth in the CII and in initial urban poverty have an insignificant negative effect on growth rate of the per capita MPCE. The growth rate of inequality (or the initial CII) has a positive (or negative) significant effect on the growth rate of the per capita MPCE. The result indicates that a 10 per cent increase in the initial value of the city CII (i.e., a lower level of city inclusive growth) reduces the growth rate of per capita MPCE of a city by 15 per cent. However, initial urban inequality has a positive impact on the growth rate of MPCE. The regression explains 31 per cent of the total variation in the dependent variable.
Our proposed measurement of inclusive growth differs from the other studies in two main ways: first, we consider multiple (or larger number of) economic variables than past studies; for instance, in the case of the Philippines, Ali and Son (2007) consider only access to primary education, secondary education and access to health services. Second, we propose a new methodology that is different from past studies (for instance, Ali and Son, 2007) based on the social opportunity function approach.
5. CONCLUSIONS AND POLICY IMPLICATIONS
This article measures overall inclusive growth of a city by focusing on changing trends in 20 economic variables, from 2004–05 to 2009–10, of 52 large cities in India based on their ‘Borda ranking,’ to find the relationship between city economic growth and overall city inclusive growth.
The Spearman’s rank correlation coefficients show that the ranks of cities according to their overall CII (or their Borda ranking) with their ranks according to the poverty gap ratio, squared poverty gap ratio, number of unemployed males, number of self-employed females, number of casual female workers, growth of DDP, upper-primary gross enrollment ratios and standard of living index, are higher, positive and statistically significant. This indicates that the rankings of cities by these variables are closer to the ranks of cities according to the value of the city-wise CII. However, the correlation coefficients (Spearman) between the rank of different variables and rank according to the CII and different groups of variables and ranks by CII are not close to unity. The results suggest scope for improvement in all the variables used in the construction of the CII. They also indicate that bigger cities (according to population size) have lower levels of inclusive growth.
The regression results, which establish the relationship between city economic growth and overall city inclusive growth (measured at the aggregate and disaggregated levels), show that a higher economic growth rate is associated with an increase in the growth of urban inequality, a reduction in the growth of urban poverty and lower levels of overall inclusive growth of a city.
There is a clear need for appropriate growth strategies (e.g., greater job creation, reduction of urban poverty and inequality, greater access to education and a more equal provision of basic services for city dwellers) for inclusive urban growth particularly by giving weightage to the size of cities, as large cities show lower levels of inclusive growth. Therefore, for an inclusive growth strategy, we need to focus on various indicators rather than only a few indicators (such as, economic growth, poverty, etc.). In addition, policies of protective discrimination are required as a greater proportion of the urban poor belong to the lower castes (SC, ST and OBC).
The results support the recent government’s strategies (or policies) for inclusive growth as economic growth are not inclusive and suggest the need for different strategies for urban inclusive growth based on the size of cities. However, the application of different methodologies and inclusion of other variables (such as, infrastructure investment, etc.) to measure urban inclusive growth are left for future research.
Footnotes
Acknowledgements
This article is a part of my doctoral dissertation at the Institute for Social and Economic Change (ISEC), Bangalore, India. I would like to thank my Ph.D. thesis supervisor Professor M.R. Narayana for his constant guidance, inspiration, valuable comments and suggestions. I would also like to thank Professor Meenakshi Rajeev, Ms. B. P. Vani, Dr. Elumalai Kanan, Dr. Krishna Raj and Dr. Veerarasekharappa for their very helpful comments and discussions. Finally, I am grateful to the anonymous referees of this journal for their detailed and constructive comments. However, the usual disclaimers apply.
APPENDIX A
Correlation Coefficients of Variables in the Regression Analysis
| (a) | (b) | (c) | (d) | (e) | (f) | (g) | (h) | (i) | |
| Poverty growth (a) | 1 | ||||||||
| DDP growth (b) | 0.23 | 1 | |||||||
| Initial poverty (c) | –0.29 | –0.13 | 1 | ||||||
| Initial Gini (d) | –0.06 | 0.14 | 0.03 | 1 | |||||
| Initial Gini × DDP (e) | 0.27 | 0.95 | –0.11 | 0.41 | 1 | ||||
| Initial poverty × DDP (f) | –0.11 | 0.46 | 0.75 | 0.13 | 0.46 | 1 | |||
| Initial city inclusive index (g) | 0.36 | 0.09 | 0.10 | 0.23 | 0.20 | 0.24 | 1 | ||
| Gini growth (h) | 0.02 | 0.05 | –0.05 | –0.69 | –0.12 | –0.02 | –0.08 | 1 | |
| City inclusive index growth (i) | –0.20 | –0.21 | –0.12 | –0.03 | –0.23 | –0.32 | –0.48 | –0.14 | 1 |