
Abstract
This article attempts to document the status of environmental fiscal instruments (EFIs) so as to explore relevant international experiences on ecotaxes in the context of India and to examine India’s specificities in these taxes within a wider perspective of other fiscal measures. Environmental levies across 15 countries were reviewed and the countries categorised are into two groups: Annex II and Non-Annex I. The revenues from levies imposed in the countries were also analysed. The most common form of taxes in Annex II countries in the form of energy taxes, followed by transport taxes. For India, energy and transport taxes could prove to be vital types of ecotaxes for addressing issues of climate change. Pollution taxes are difficult to levy for administrative reasons, but resource taxes are imperative because of severe environmental problems associated with mining and related activities. The revenue generated from environmental taxes and charges for all Annex II countries hovered between 2 and 4 per cent of their respective GDPs, except for Canada and the United States of America, whereas for Non-Annex I nations, this ranged only between 0 and 1 per cent.
Introduction
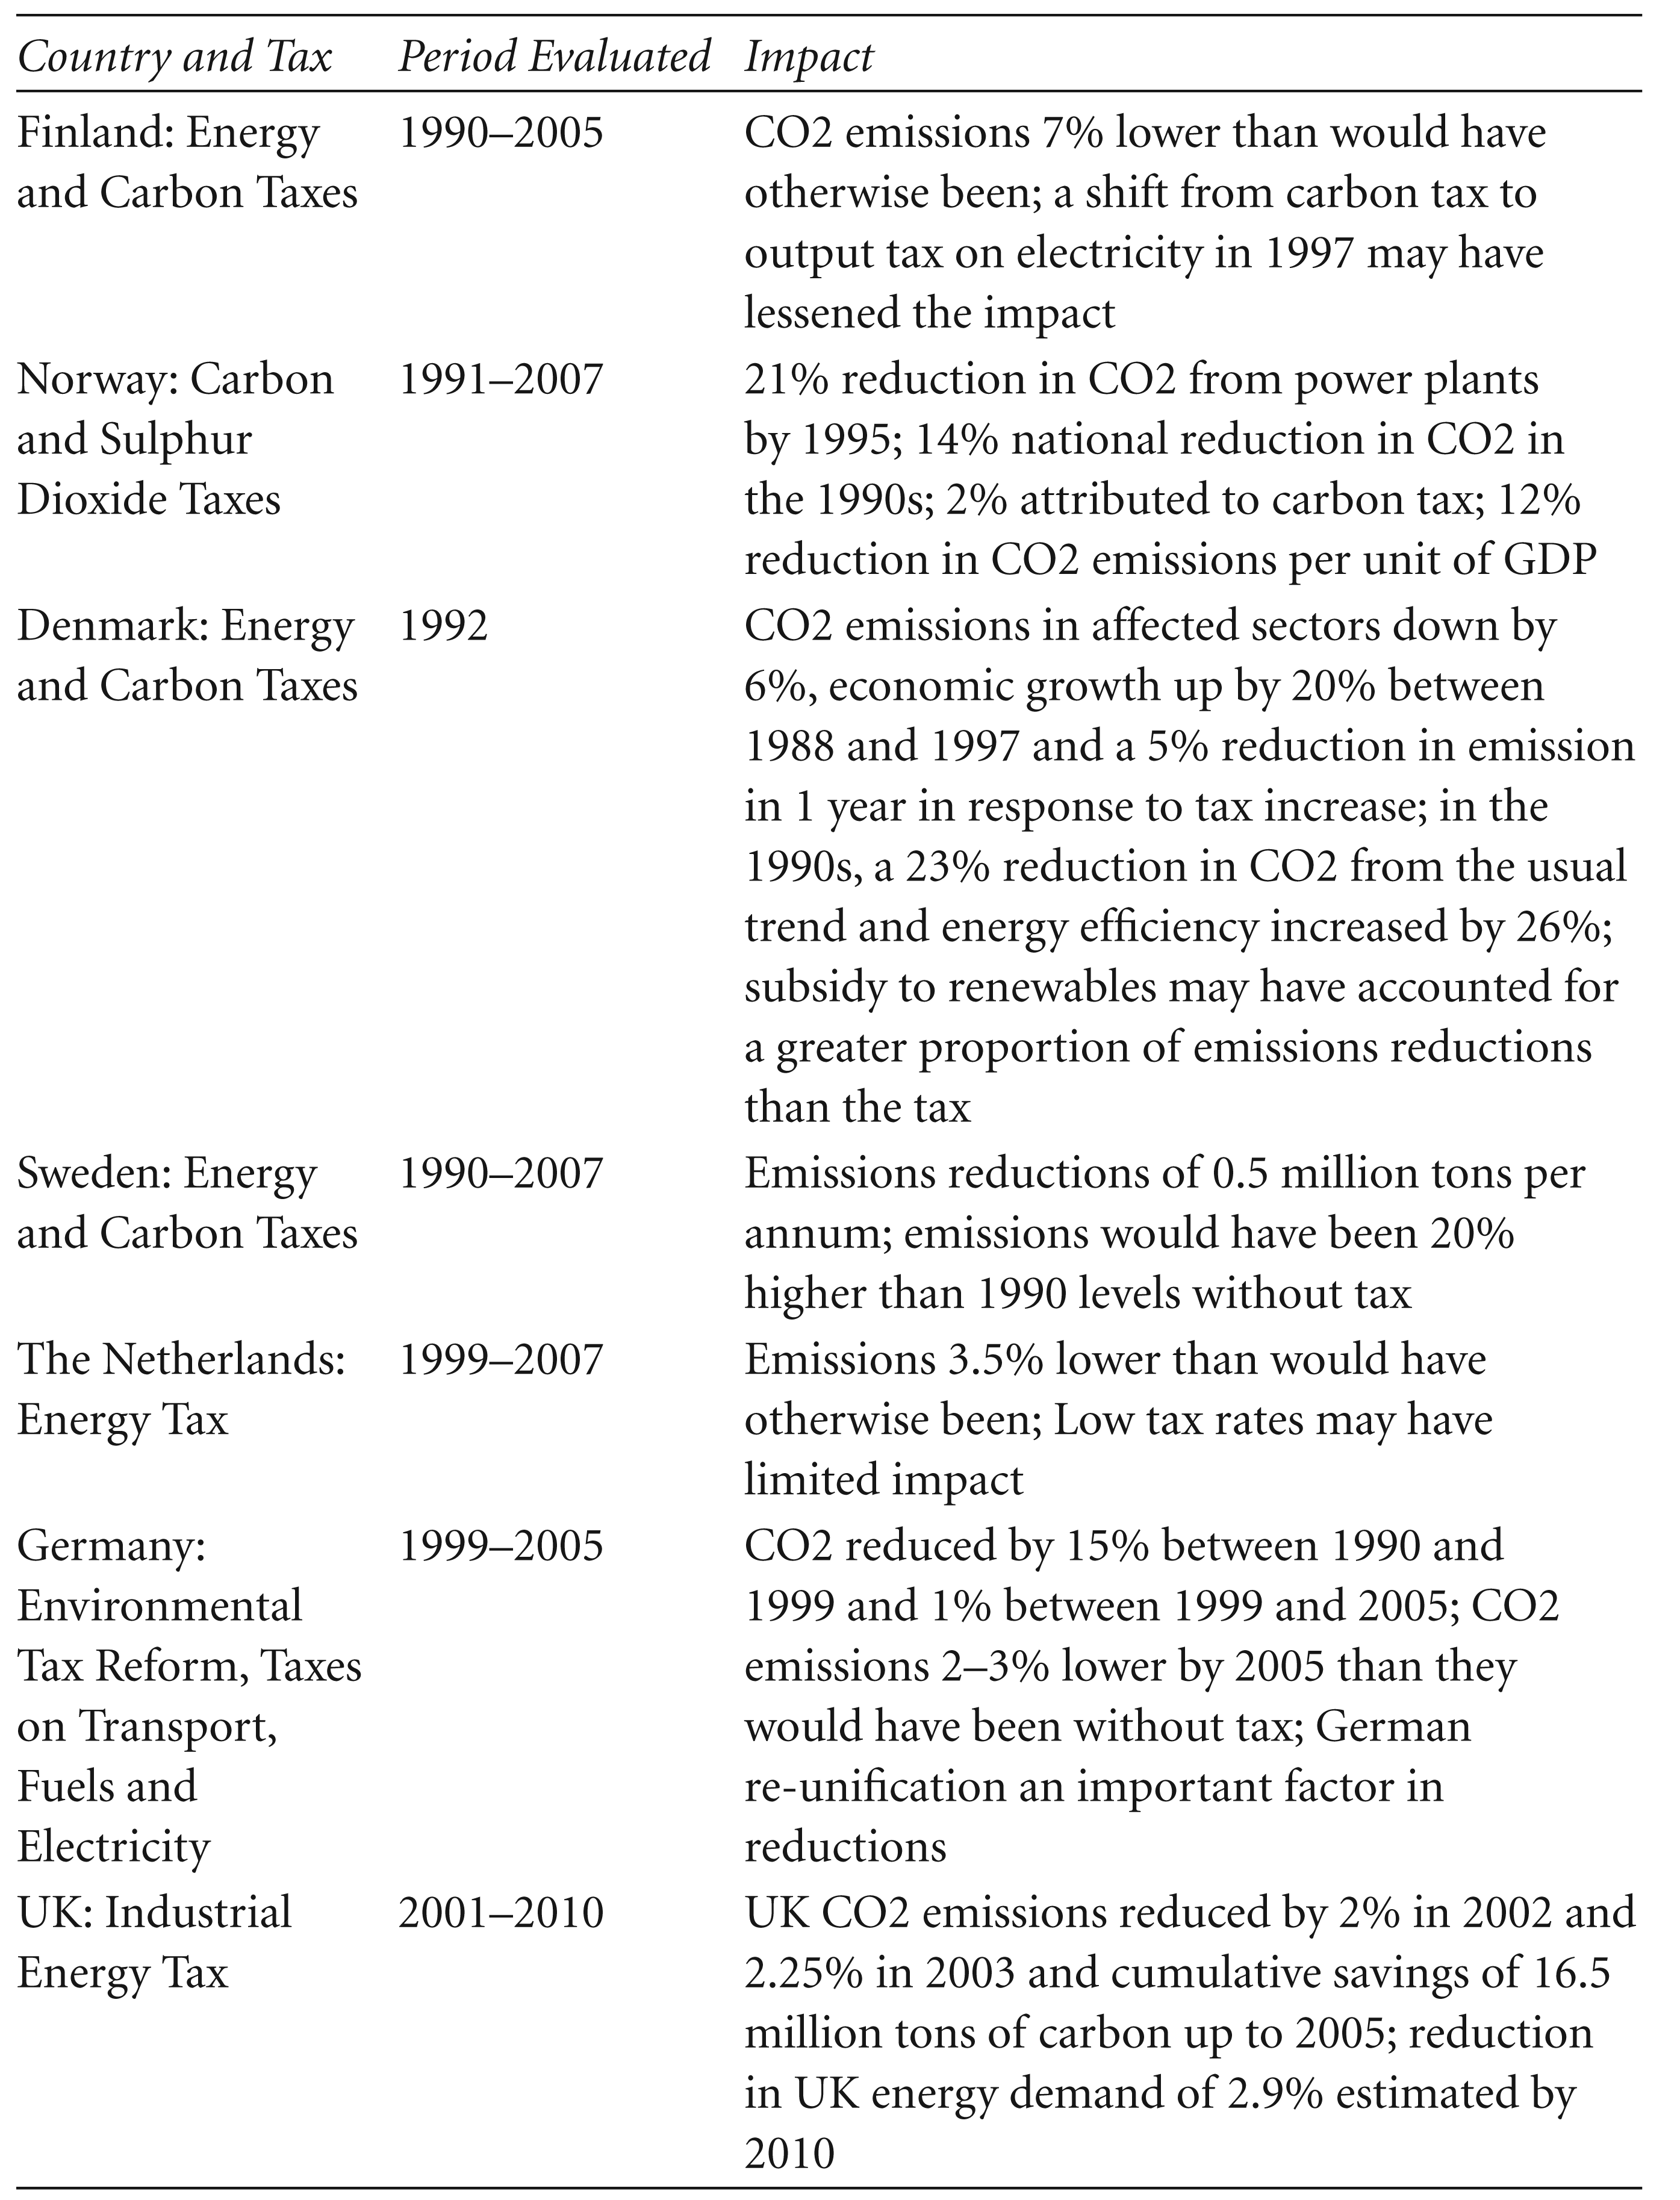
The provisioning of environmental goods suffers from market failure, 1 for which externalities are one of the prime causes. This is because environmental goods—for example, lakes, forest resources, atmosphere and so on—are considered to be public goods whose property rights are ill-defined leading to their over-exploitation (Coase, 1960). This not only affects the environmental resources but also the living and non-living bodies in and around, which are intricately linked to them, either directly or indirectly, thus, generating negative externalities, that is, a deterioration in the entire ecosystem either in quality or quantity or both. Market failure in the context of the environment also occurs where a positive externality is generated due to innovations in environmental-friendly technologies such as the production of electricity through solar, wind or tidal energy. In such cases, there is a likelihood of under-investment owing to the huge costs involved in producing such technologies, while the private benefits accruing to investors are normally less than their social benefits, thus leading to a sub-optimal level of output. Against this backdrop, an attempt is made in this article to understand the role of environmental fiscal instruments (EFIs) in addressing the issues of market failure specific to India. The article attempts to review the use of such instruments across a few environmentally active countries and other emerging countries, to help understand India’s status vis-à-vis the successful countries and to also draw useful lessons wherever possible. Such a review can be very useful given the fact that several European countries have already demonstrated their positive impact on the environment (refer Table 1).
Impact of a Green Shift in Taxation: Selected International Evidence
Impact of a Green Shift in Taxation: Selected International Evidence
The EFIs can be defined simply as those fiscal instruments that are pro-environment, which have been conceived as imparting subsidies to initiatives that tend to have environment-friendly impacts, such as solar projects, levying a tax on polluting activities and so on. These instruments are expected to lead to environmental improvements by taking into account both positive and negative externalities. They can be broadly divided into two groups: instruments that address positive externalities and those targeting negative externalities (Figure 1). The first group consists of environmental subsidies and environmental tax expenditures, 2 whereas the second group consists of environmental taxes and charges. This article categorises these instruments in a different manner when compared with the existing literature on environmental policy (such as Kosonen & Nicodeme, 2009), which normally identifies an environmental subsidy as the only component of the first group (Figure 1). Further, this study also explicitly links EFIs with market failures while categorising them, which again addresses a gap in the literature.
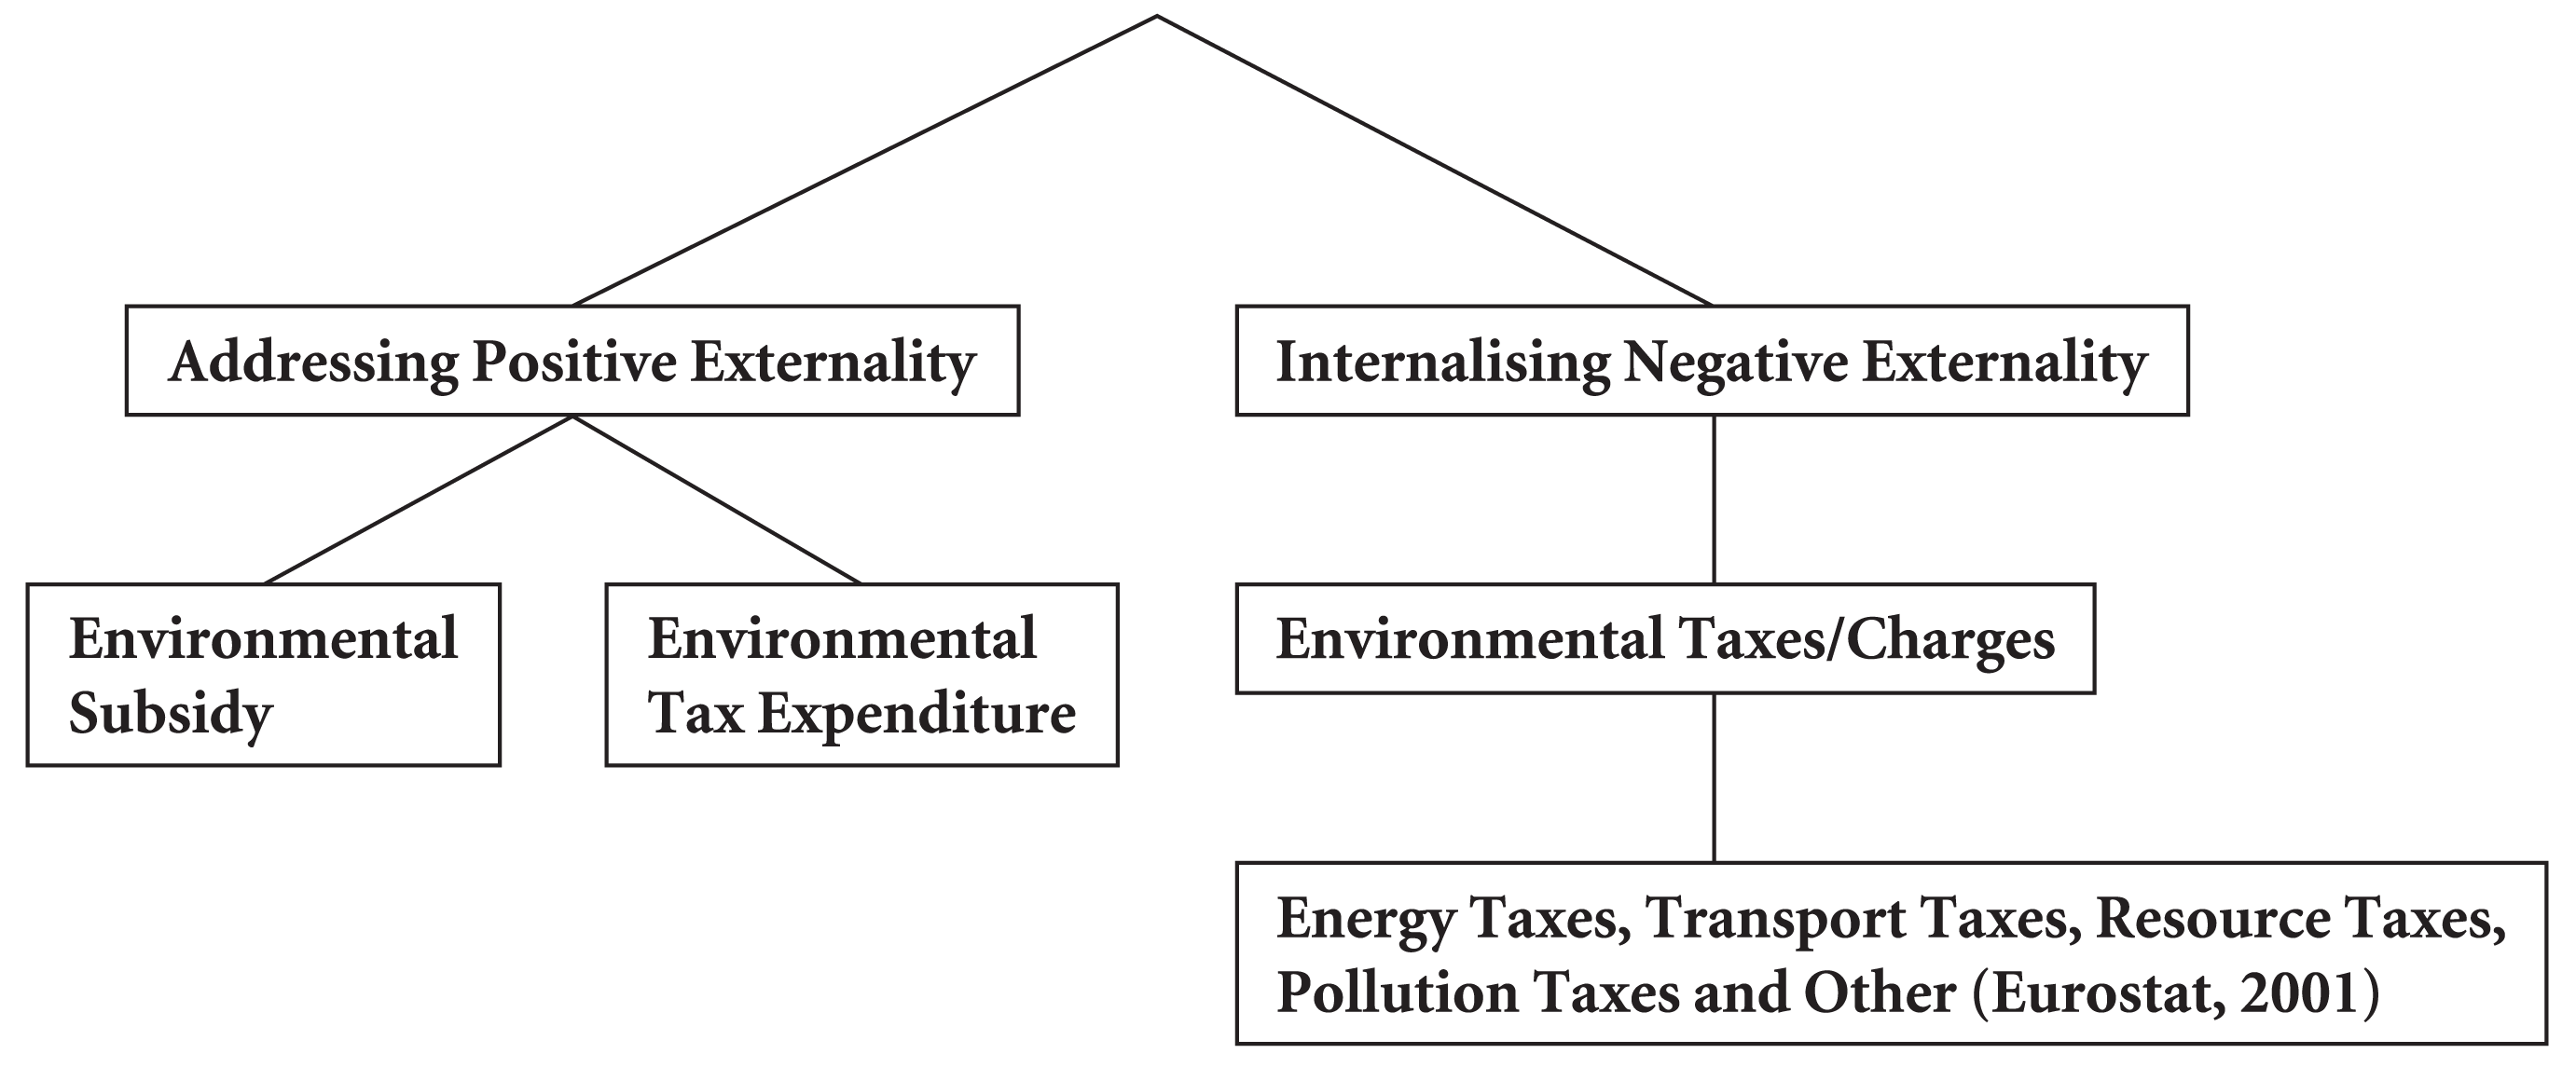
A probable reason as to why EFIs in the literature are generally classified under the first two categories, that is, taxes/charges and subsidies, is that fiscal instruments emerge from the domain of public finance which has been traditionally defined by Dalton (1922) as a subject which, ‘is concerned with the income and expenditure of public authorities …’ Defined this way, taxes/charges are treated as income for the government and thus address negative externalities through the levying of a fee, whereas subsidies account for a share of government’s direct expenditure and thus address the issues of positive externality by providing incentives. These arguments justify the general categorisation of EFIs into taxes and subsidies. However, this study considers tax expenditure to be different from subsidies for addressing positive externalities (Figure 1). This is because tax expenditures could be defined as the revenue foregone by the government on account of tax concessions. The tax expenditures could occur in the form of reduced tax rates or there could be a complete tax exemption, normally used for promoting R&D in environmentally sound projects. Thus, such concessions would relate to revenue foregone by the government, whereas subsidies are direct payments to encourage consumption or production of a commodity. Hence, this article treats tax expenditures as a separate category in contrast to the categorisation of tax concessions as a form of subsidies (Kosonen & Nicodeme, 2009) and is akin to Goulder (2005) who considers tax credits as an additional fiscal instrument for environmental protection. This framework will be utilised in the present article to attain the objective of documenting ecotaxes in the wider perspective of EFIs and in analysing the revenue from them. The article has been structured as follows: Section 2 gives details on data sources and the method followed to achieve the stated objectives. The status of EFIs in Annex-II and Non-Annex-I countries has been described in Section 3 and Section 4 analyses the revenue generated from such levies and concluding remarks are given in the final section.
The documentation of EFIs has been done using the only comprehensive database available, that is, the OECD-EEA database. 3 It not only gives extensive information about various kinds of EFIs used across several countries but also gives revenue details for these instruments. For a meaningful analysis of policy options, a set of 15 countries was chosen. These countries were chosen from the classification of UNFCCC, 4 which categorises the signatories of the convention into three broad groups: Annex I, Annex II and Non-Annex I. Since the fiscal policy options examined here relate to the preservation of the environment, the choice of countries from the UNFCCC is obvious. They have been chosen from the Annex II and Non-Annex I countries because the former group (which consists of developed countries) would not only give financial and technical assistance to the latter (developing countries) but also assist in developing and transferring environmental-friendly technologies (UNFCCC, 2014). The development of these technologies would also require the adoption of certain EFIs such as tax exemptions, reduced taxes, tax credits and so on, by both Annex II and Non-Annex I countries, thus justifying their use. Such a choice would also ensure a rich mix of developed and developing countries.
From among the Annex-II countries, 11 OECD countries have been selected of which five are Nordic countries—Denmark, Finland, Iceland, Norway and Sweden—and the rest are Australia, Canada, Netherlands, Germany, the United Kingdom (UK) and the United States of America (USA). The Nordic countries were chosen because they are considered the most environmentally conscious countries worldwide and also the pioneers in levying environmental taxes (OECD, 2002, 2006 as cited in Barde & Godard, 2012). The other European countries were included as they are also environmentally active (Szigeti, 2005); Australia, Canada and the United States of America were chosen because among the non-European OECD members, they recently have been pro-active on environmental improvement. Among the Non-Annex I countries, the BRICS nations have been selected so as to analyse the development of ecotaxes among developing countries which are comparable to India in terms of their macroeconomic structure. However, Russia had to be excluded because of the unavailability of data on EFIs and also as it is a part of the Annex I countries. Thus, we were able to make a comparison only across the remaining four countries, that is, Brazil, India, China and South Africa.
The second objective of this study is to analyse the revenue from ecotaxes in a comparative perspective of the 15 countries selected from the OECD-EEA database. Analysing the financial cost of subsidies and tax expenditures would have been the optimum measure to examine the cost to the exchequer associated with these measures, but this could not be done due to the unavailability of data. Analysing the revenue generated from these taxes is essential, because it is a by-product of such levies, and can be used for various environmental and developmental purposes including financing of environmental subsidies. Further, provided the detrimental condition of environmental goods in India, in terms of deteriorating air quality, water bodies, etc. (The World Bank, 2014), an important policy question in the Indian context would then be, how best to utilise the revenue from these instruments.
To enable comparison across the countries, absolute revenue details were converted into relative ratios of GDP and total tax revenue for the Annex II countries and GDP and total net indirect taxes (NIT) for the four Non-Annex I nations. Since the data on total tax revenue for the Non-Annex I nations was not available from a common database, data on their NITs was obtained from the World Bank database. The GDP figures for these countries were not available from the OECD/EEA database, so they were also taken from the World Bank database. The GDP figures for Annex-II countries are at current prices and current exchange rates, while GDP for Non-Annex I nations is at current prices. The data on total tax/NITs revenue are also in nominal values. This would not affect the analysis; the concern here is ratios and not absolute values; hence, if both the numerator and denominator are in nominal or real values, the ratios will not be affected. The time period for the entire analysis is from 1994 to 2010. This is because the revenue from only some taxes is available for 2011 and 2012.
Status of EFIs in Annex II and Non-Annex I Countries
The next two sub-sections review EFIs, that is, environmentally related taxes and charges, and the environmental subsidies and tax expenditures across the 11 Annex II and four Non-Annex I countries.
Environmentally Related Taxes/Charges
The levies in this section have been classified into six categories: energy taxes, transport taxes, pollution taxes, resource taxes, fees/charges and others. The first four categories are adopted from Eurostat (2001) 5 as cited in Steinbach, Palm, Cederlund, Georgescu and Hass (2009), whereas the ‘Others’ category was added to include environmentally related taxes, which could not be classified under the first four categories. Fees and charges have been kept separate to differentiate them from taxes and are categorised for Annex II and Non-Annex I countries in sub-Sections 3.1.1 and 3.1.2.
Annex II Countries
Details of a Few Environmentally Related Taxes in Annex-II Countries
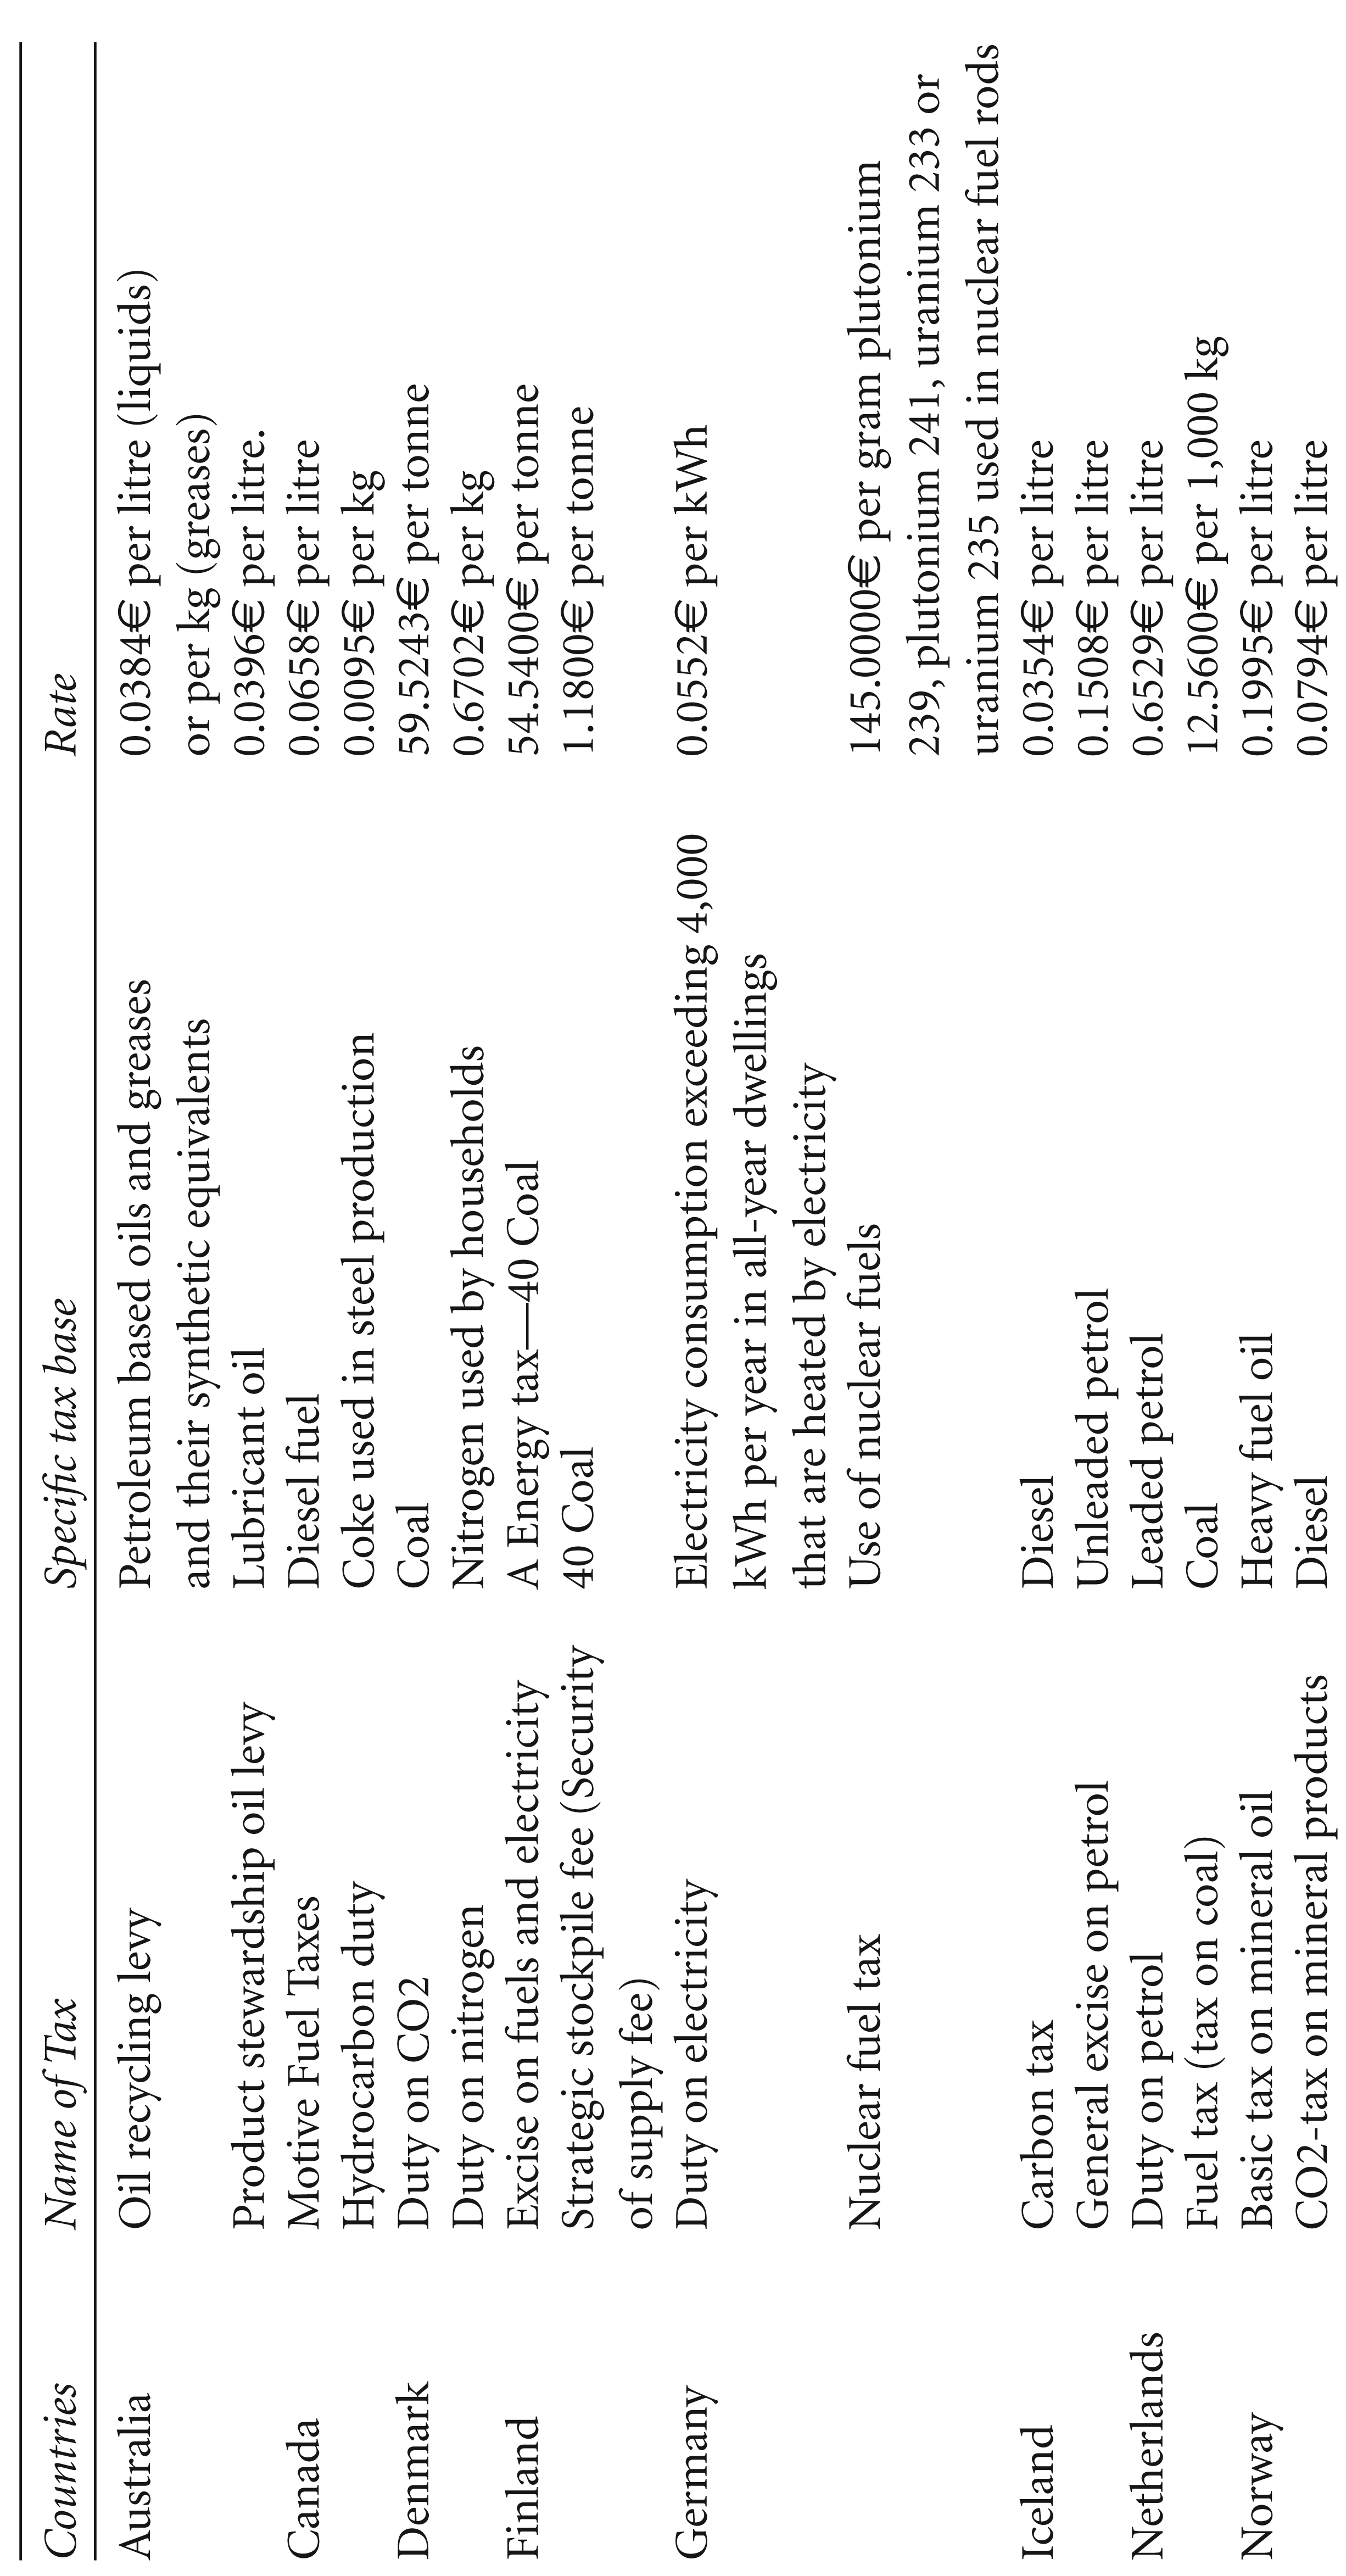
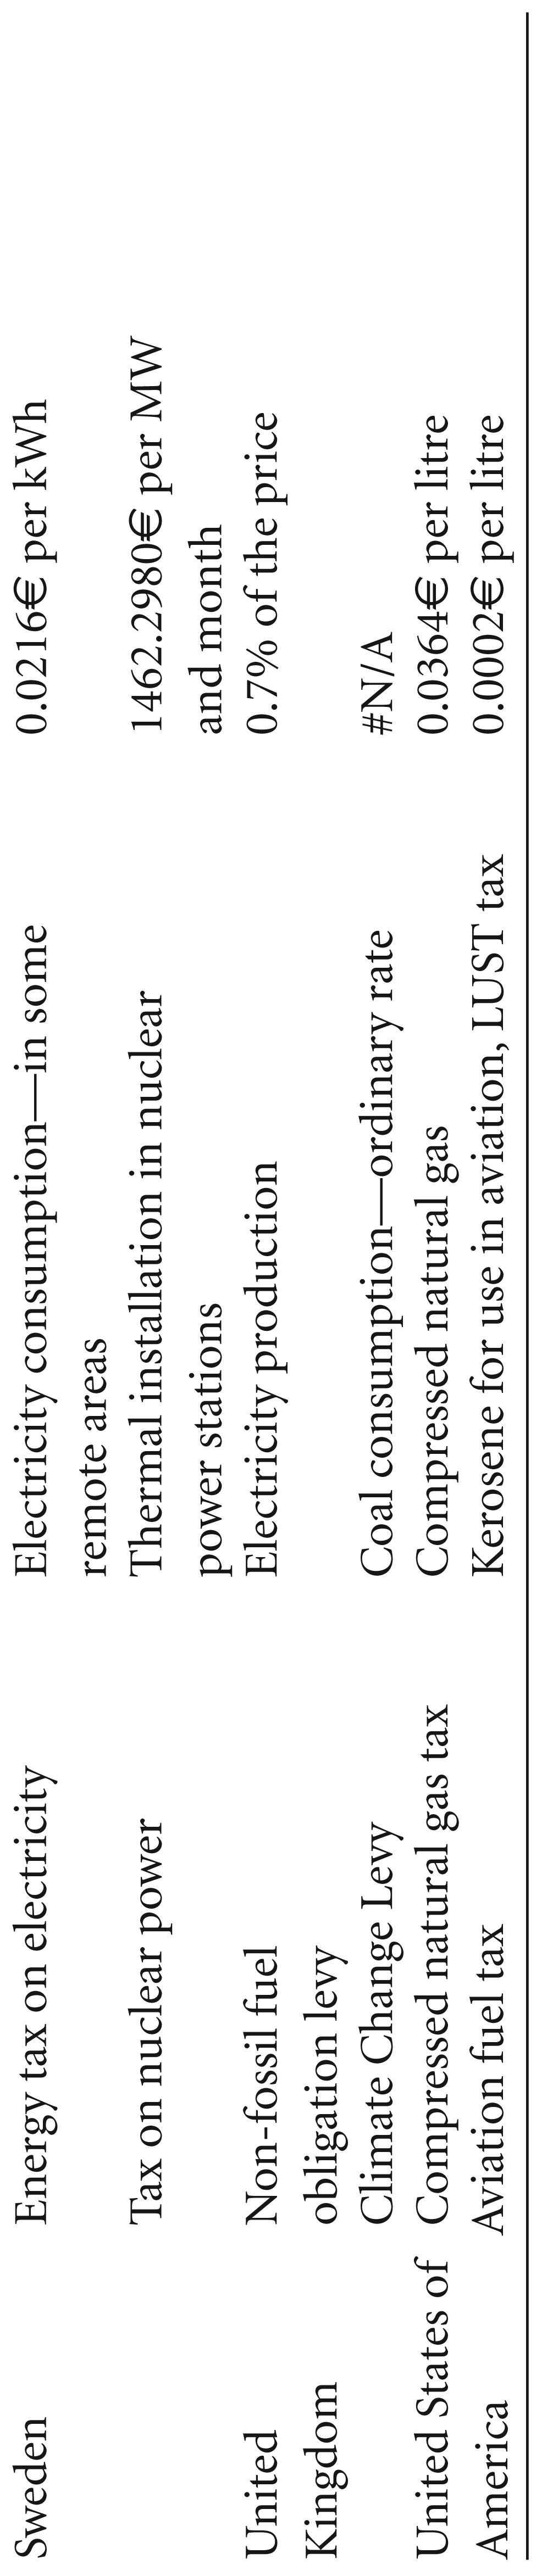
Details of a Few Environmentally Related Taxes in Annex-II Countries
While analysing the data for the Non-Annex I countries (refer Table 3), problems were faced in categorising several taxes because of insufficient information. Thus, for those levies, an additional category was created, ‘data unavailable’.
Some Environmentally Related Taxes in Non-Annex-I Countries
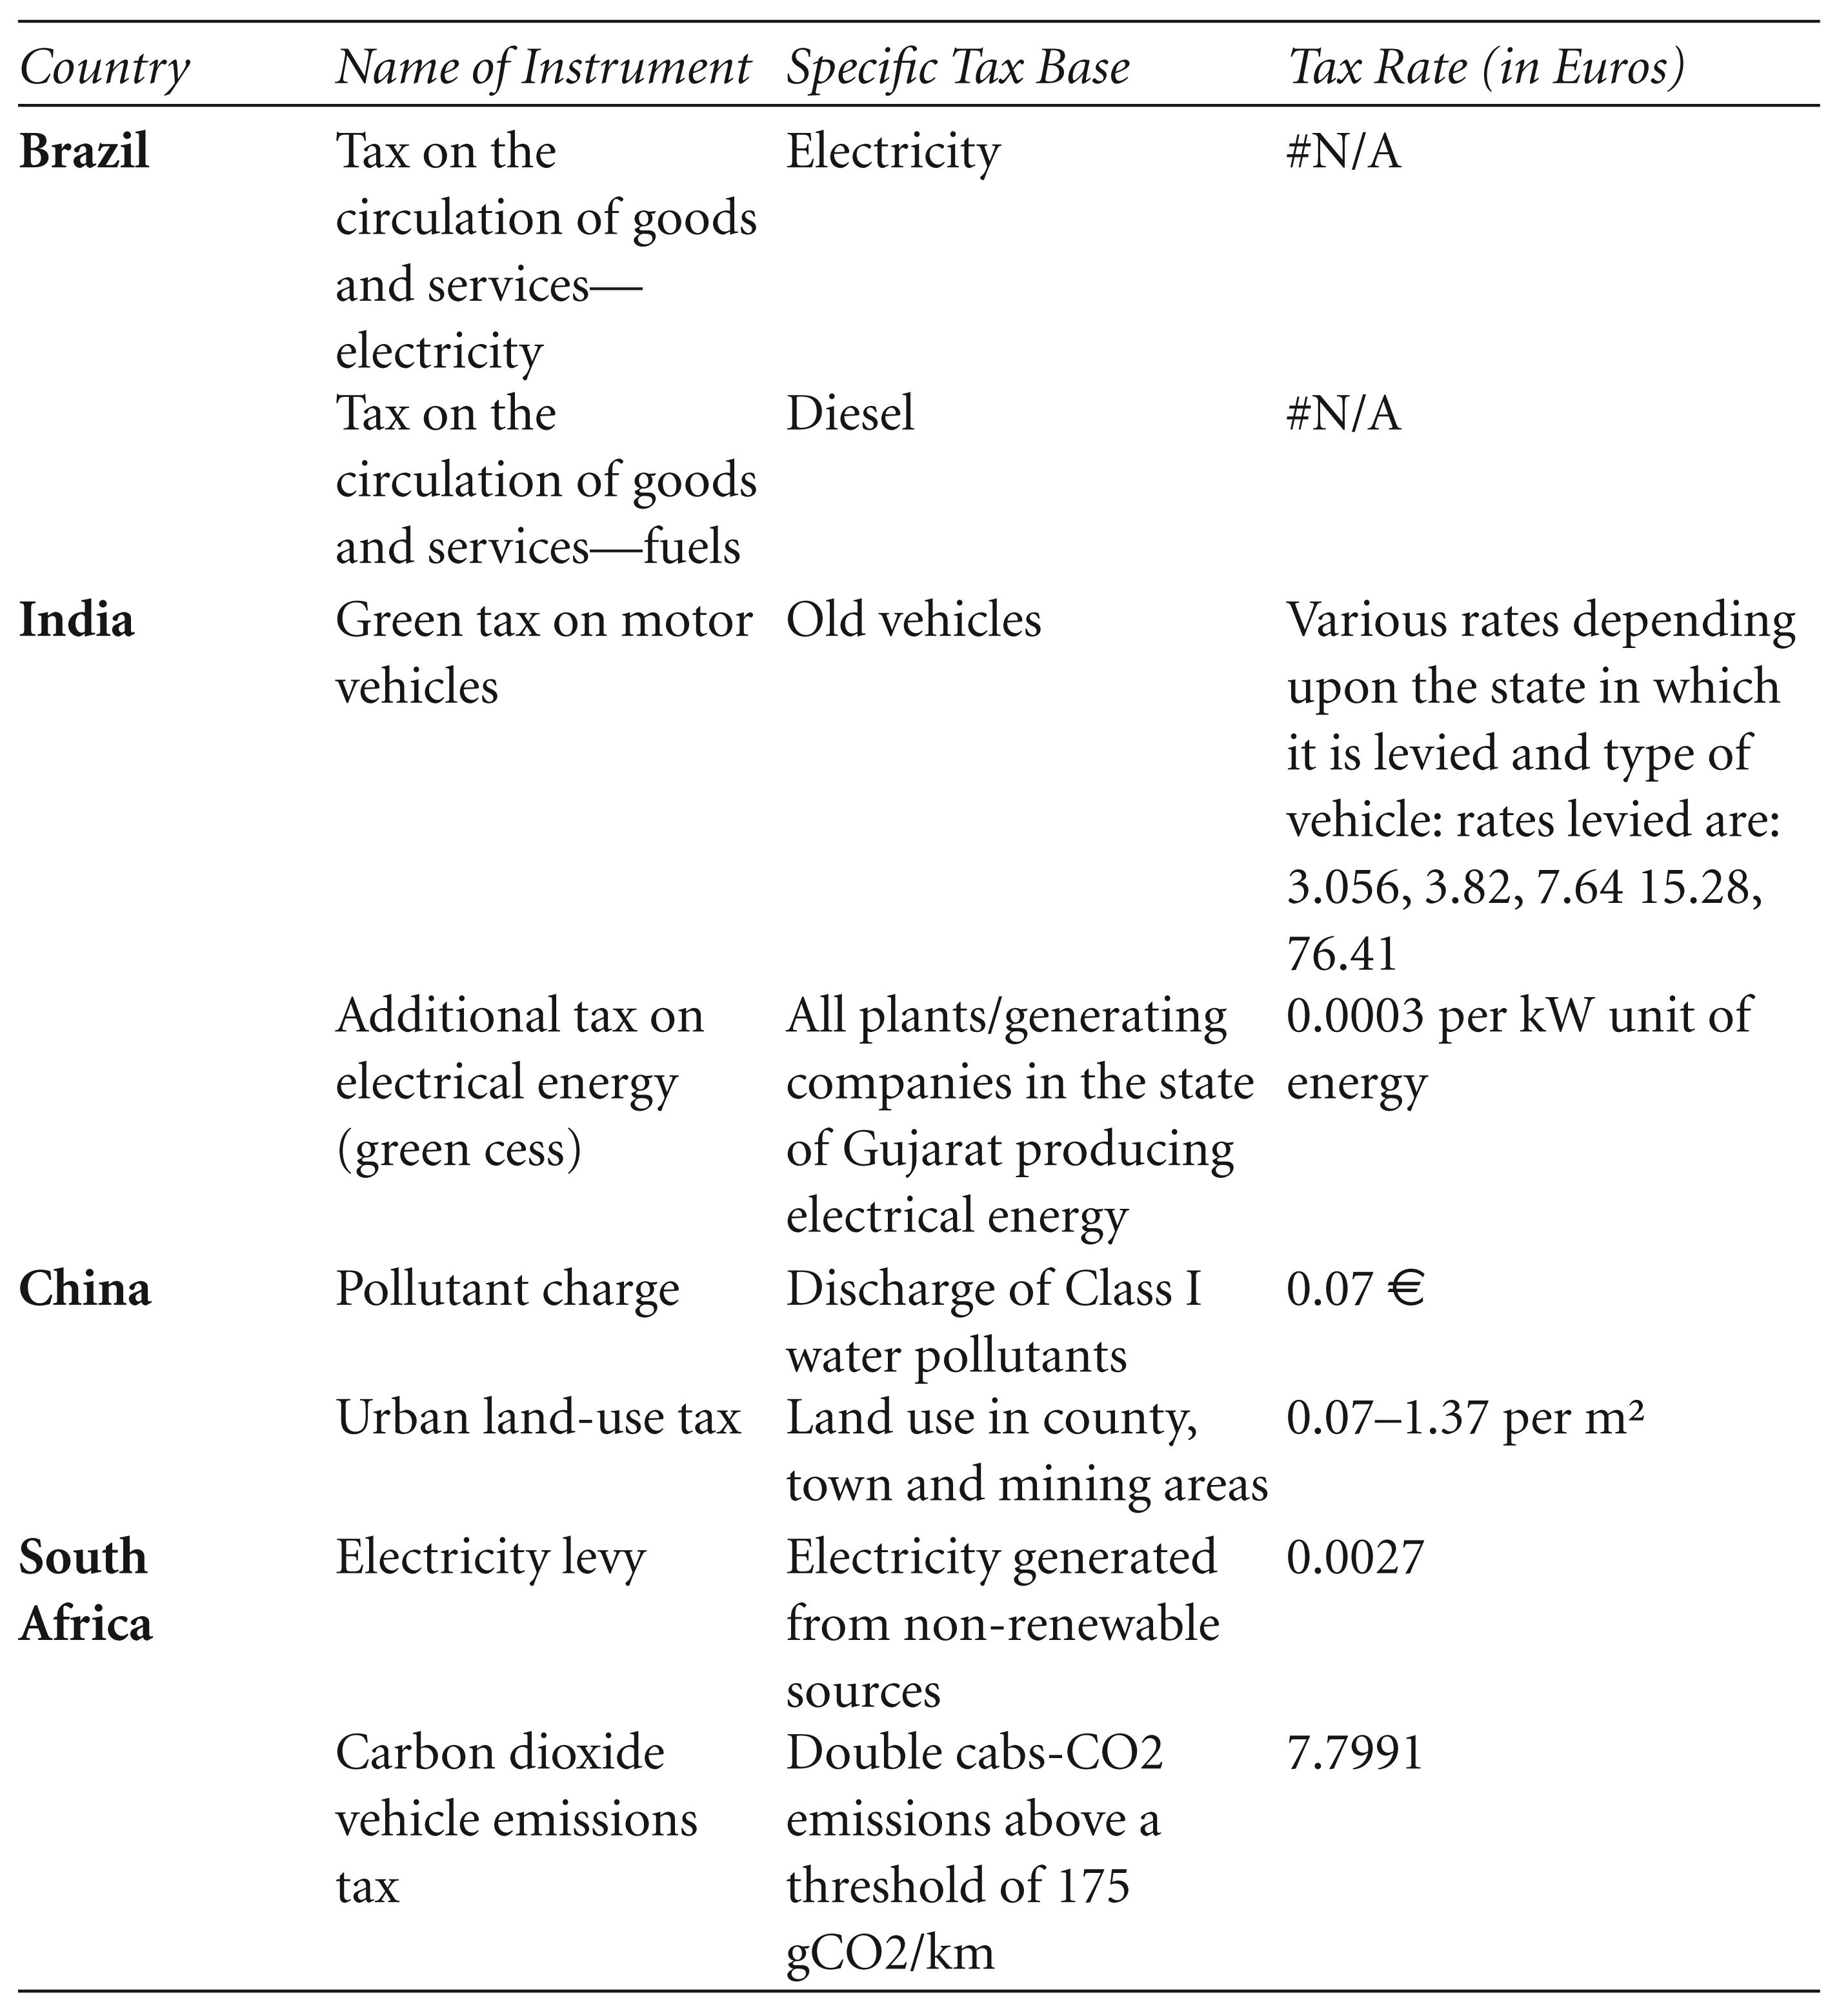
Some Environmentally Related Taxes in Non-Annex-I Countries
In this section, we will give details of the other two types of EFIs mentioned in the introduction, that is, environmentally related subsidies and tax expenditures in the selected Annex II and Non-Annex I countries (Tables 4 and 5). Even though the database classifies these fiscal instruments under the broad class of subsidies, and further into grants, soft loans, tax reductions and other, this study classifies them under subsidies and tax expenditure on the basis of the fundamentals of public finance, as argued in the introduction section. Data for the Non-Annex I countries are available only for India and China, thus we were not able to analyse these EFIs for Brazil and South Africa. The EFIs for which the classification was not clear are classified under ‘Other’, which was further divided it into three: Other (Combination), Other (Insufficient Information) and Other (None).
Details of a Few Environmentally Related Subsidies in Annex-II Countries
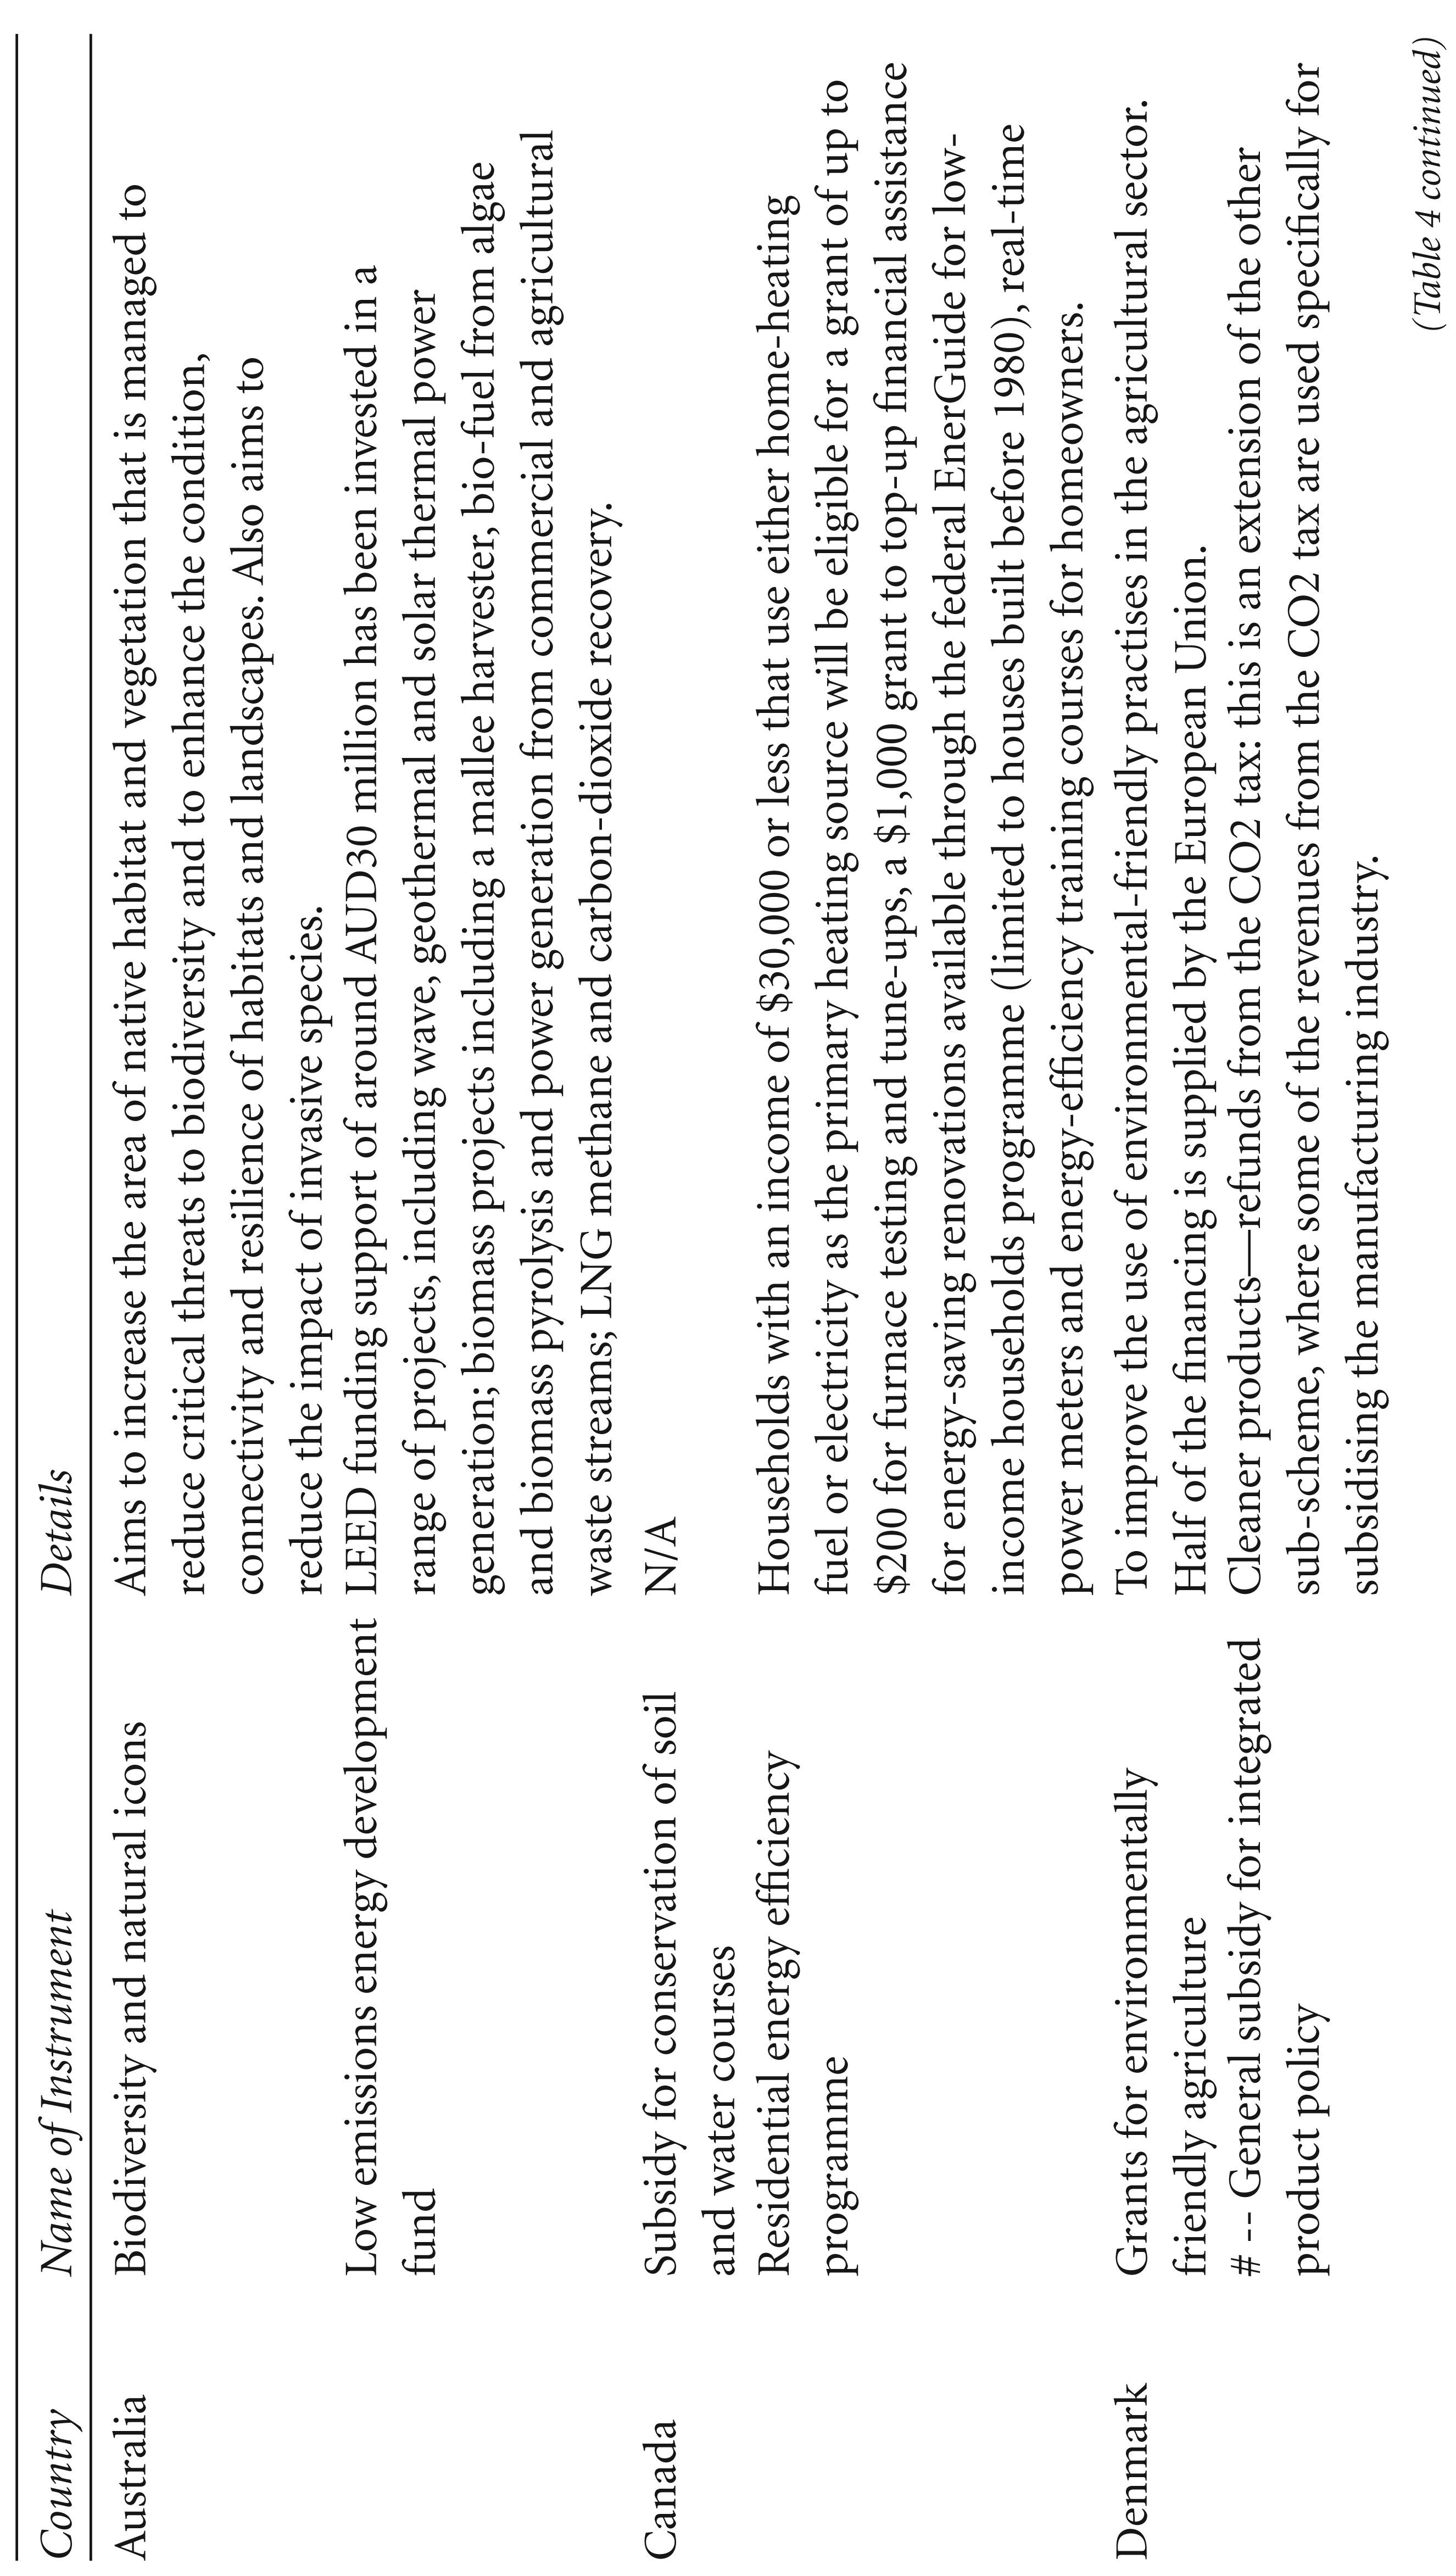
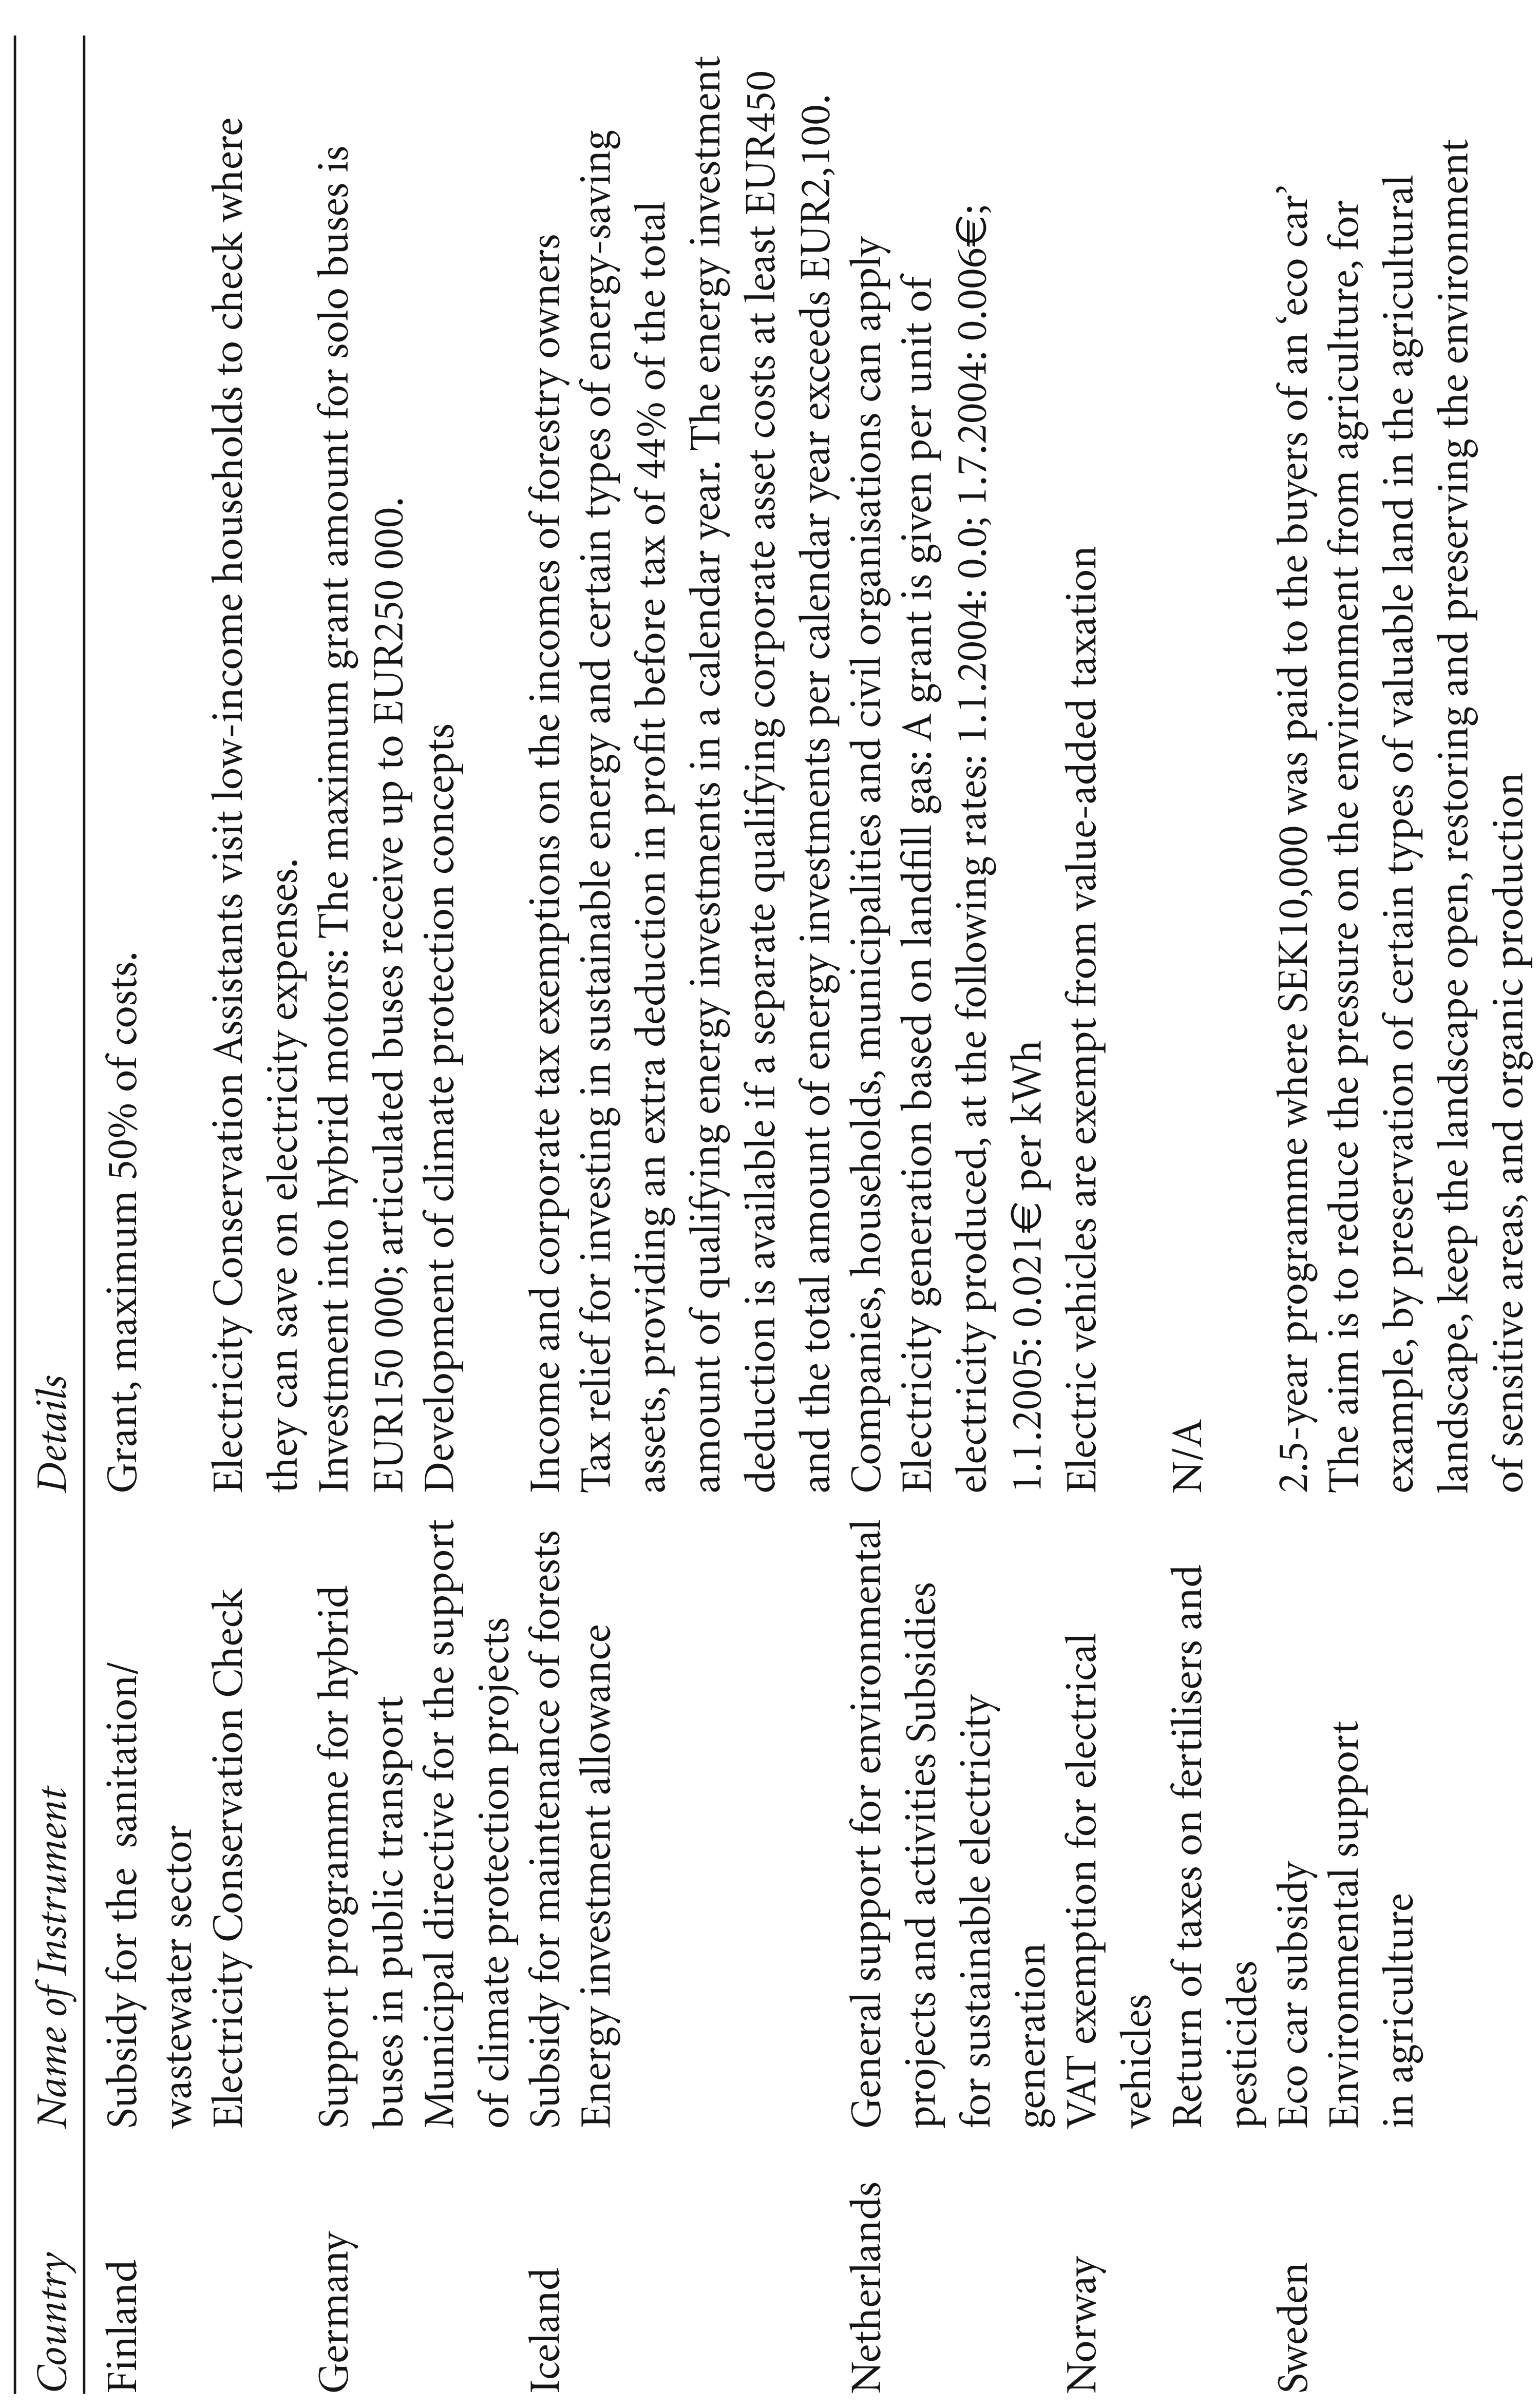
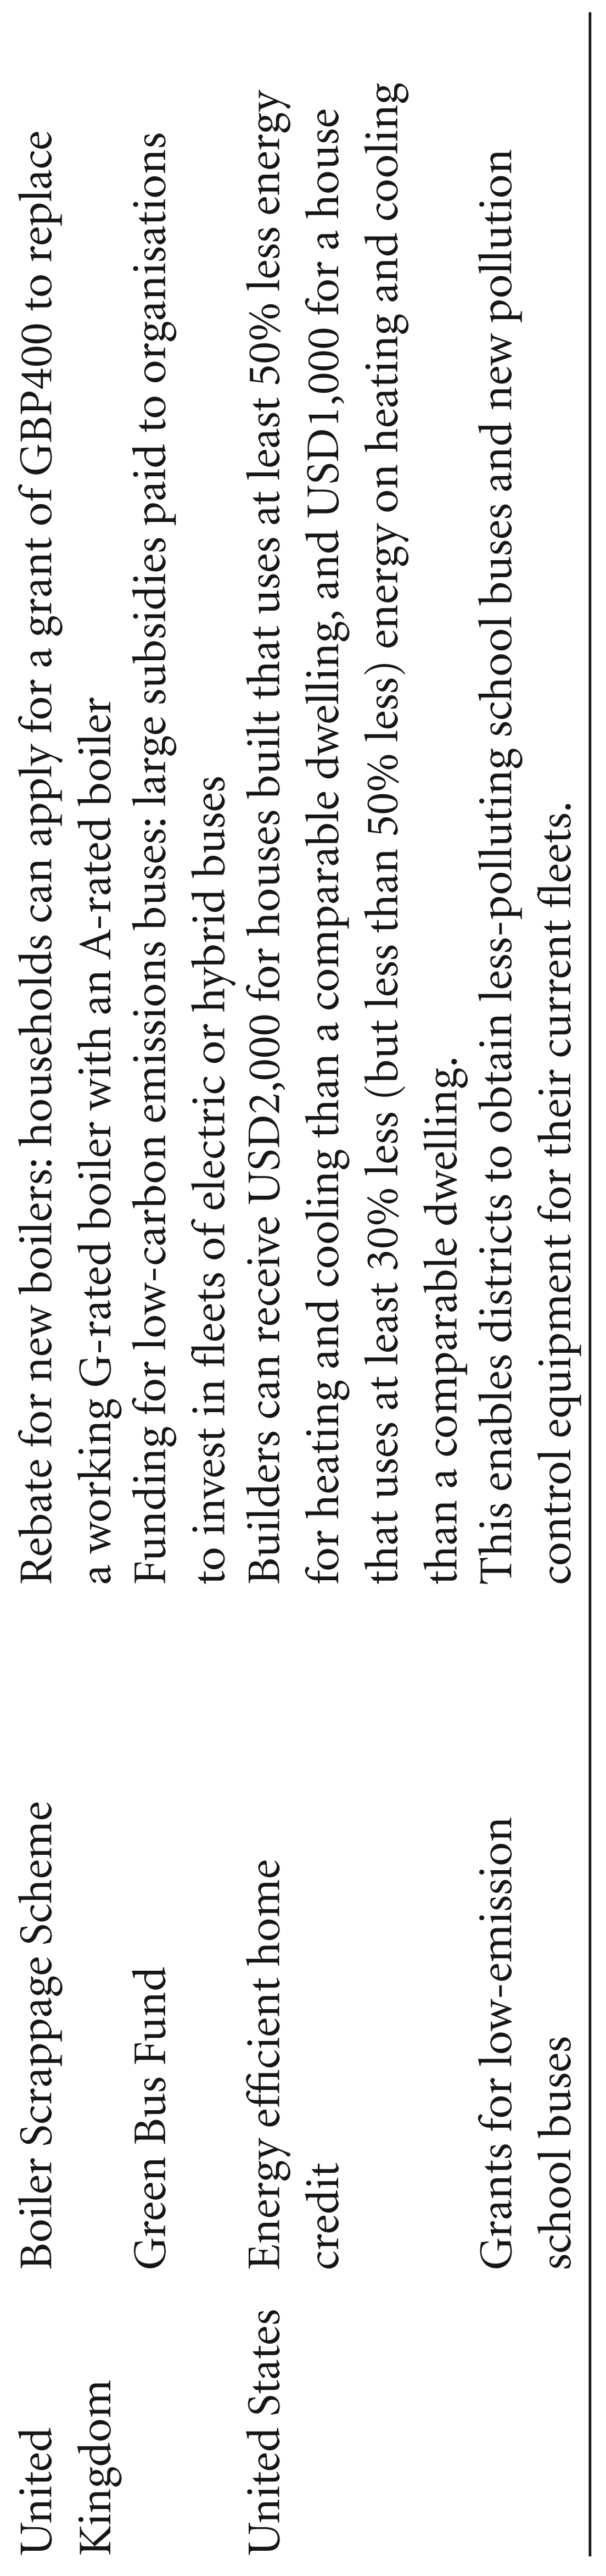
Details of a Few Environmentally Related Subsidies in Annex-II Countries
Details of Some Environment-related Subsidies/Tax Expenditures in Non-Annex-I Countries
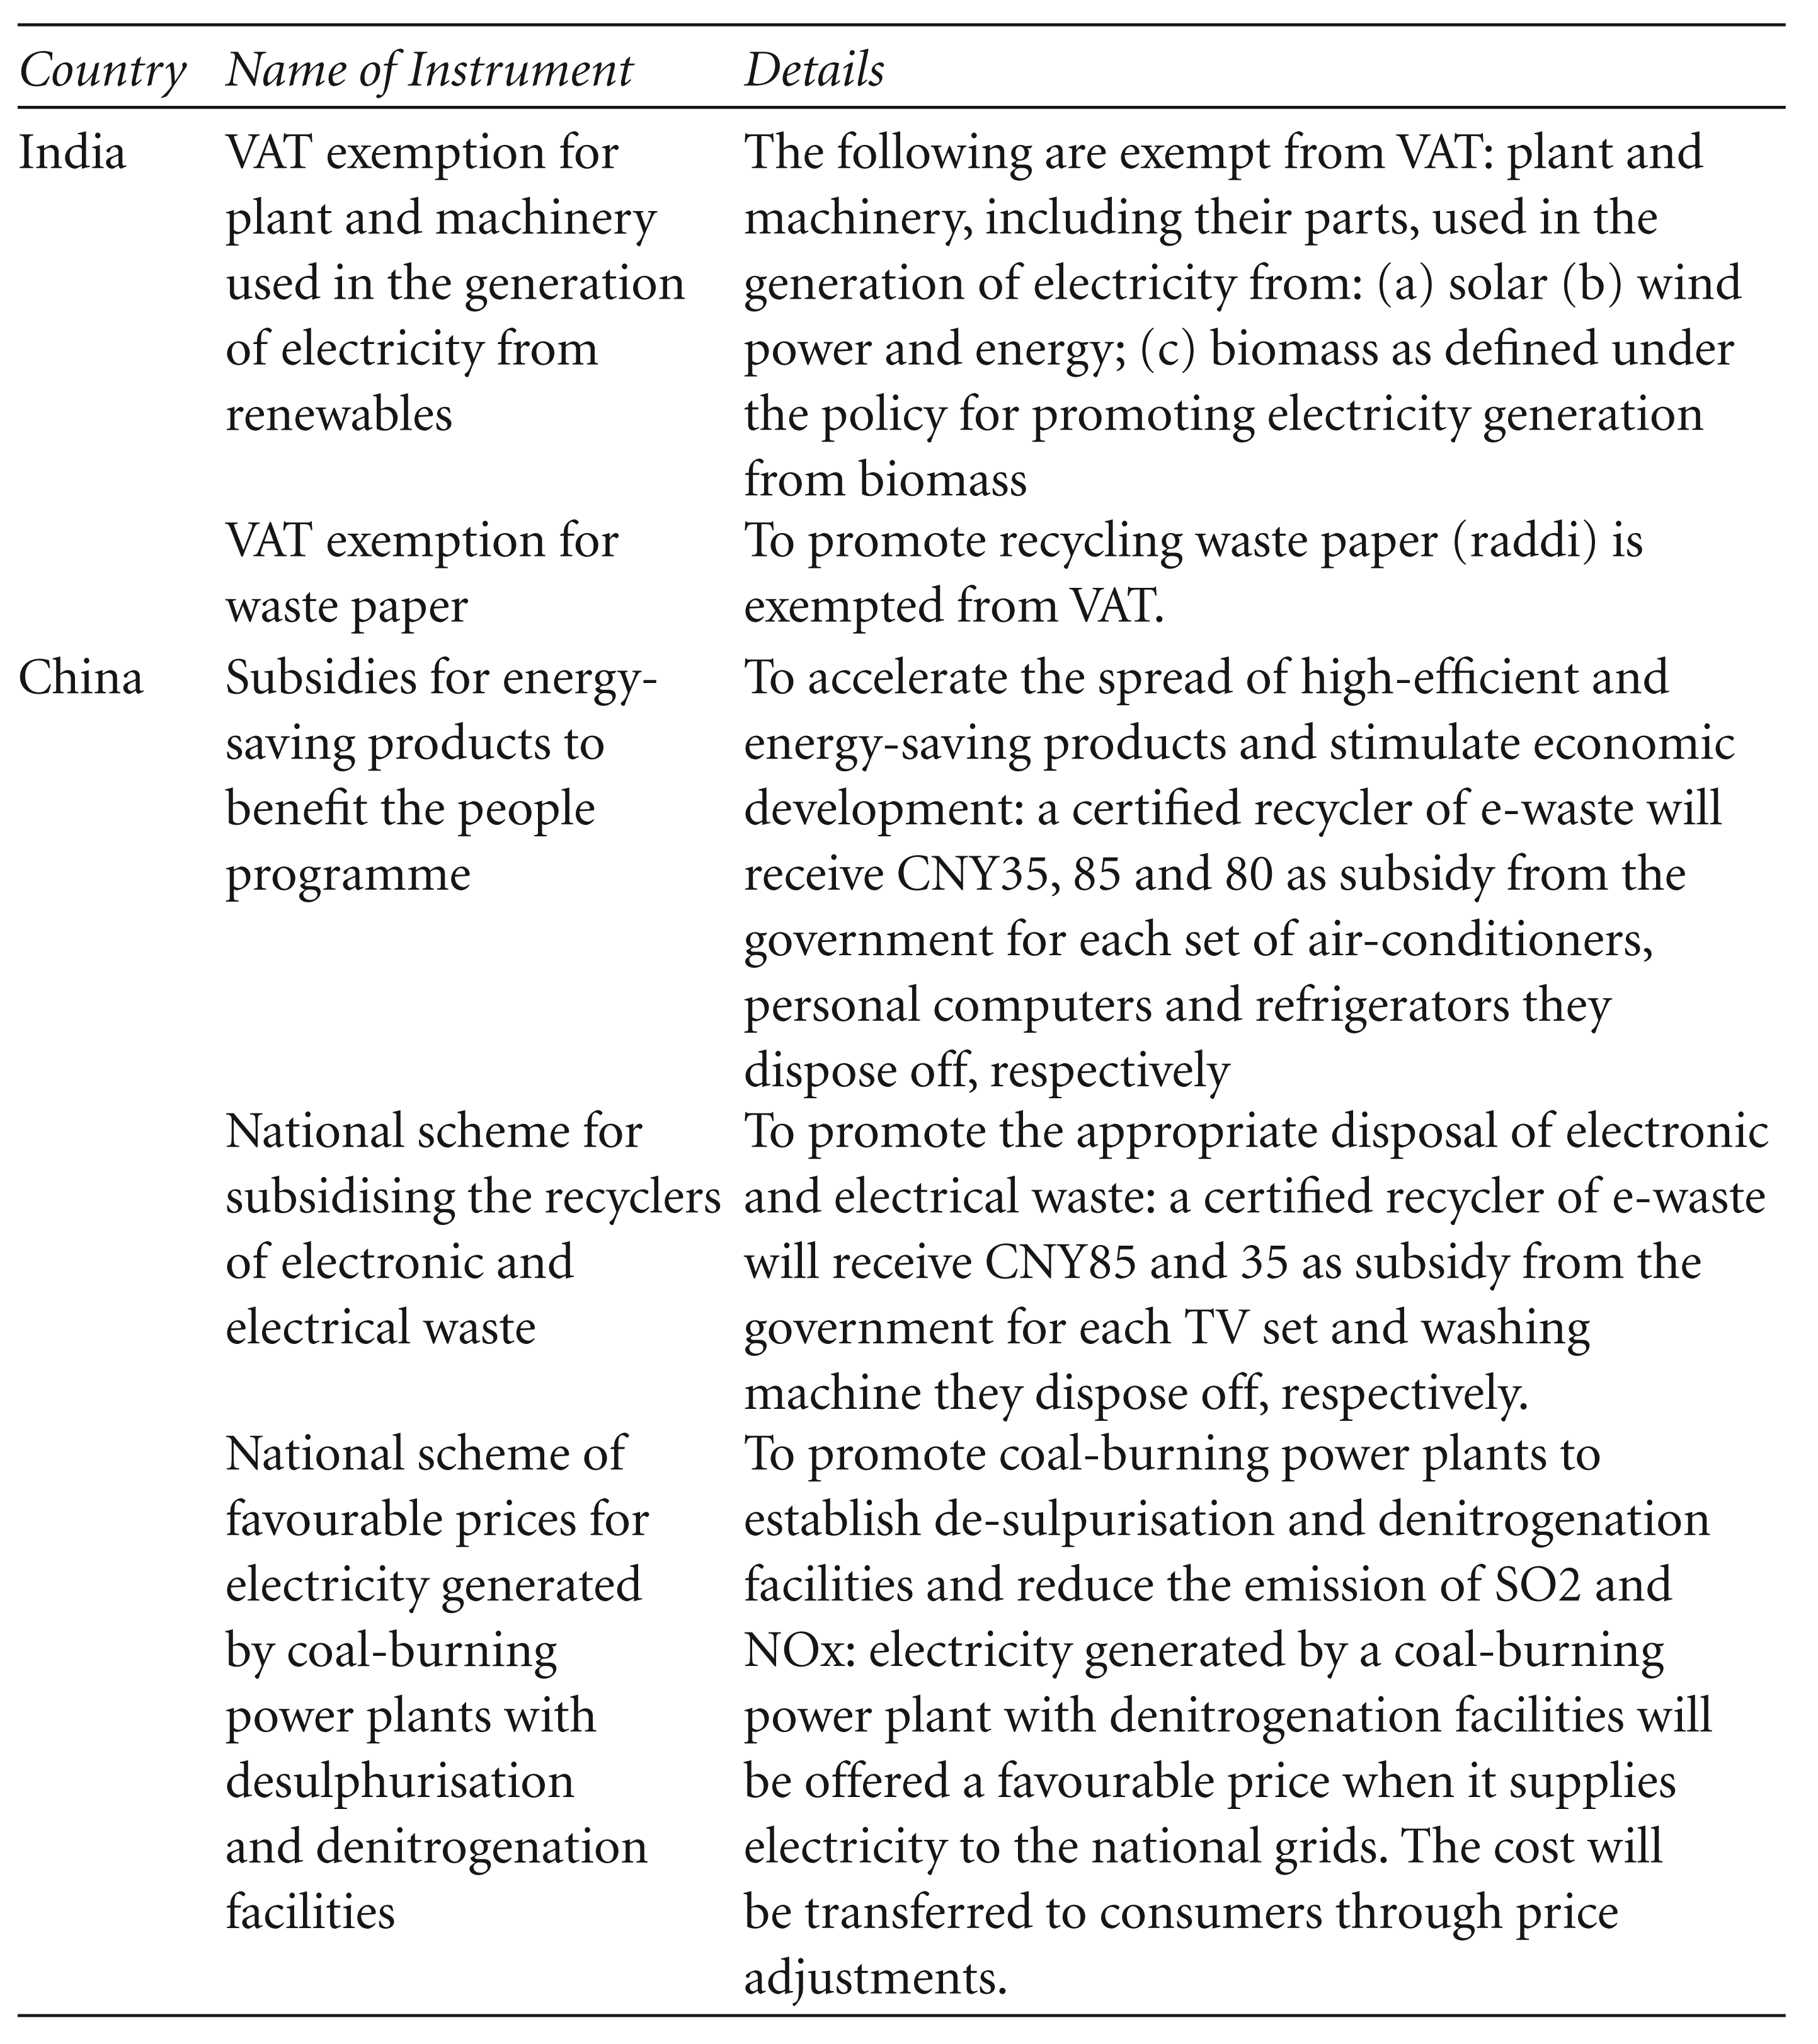
Various kinds of subsidies are provided in these countries. Most of them extend subsidies for conserving bio-diversity, forests and water; and soft loans for green initiatives, energy efficiency programmes, renewable energy, etc. Apart from these, many countries have specific subsidies such as for tyre recycling in Canada, ecological buildings in Denmark, soft loans for pollution control in Finland and the United States of America, market incentive programmes in Germany, carbon credits in Netherlands and so on.
Among the EFIs used in these countries, 3 per cent could be classified under Other (Insufficient Information), and most of these consist of soft loans for which there is not much clarity on which government bears the cost or if the banks do so. In the United Kingdom, 7 per cent of the EFIs were classified under this sub-head. The last category of Other (None) mostly consists of grants offered by public or private companies. For example, in Canada all 37 per cent or 52 EFIs in this category are implemented by public or private sector companies providing environmental-friendly products or services. Thus, in a strict sense, these cannot be considered an environmental subsidy as here we are only concerned with fiscal instruments levied by governments. In total, 14 per cent of the EFIs implemented by Annex II countries are classified as ‘Other’, indicating the lacuna in the database.
3.2.2. Non-Annex I Countries
Analysing the Revenue from EFIs
After reviewing the forms of environmental levies across Annex II and Non-Annex I countries, the revenue details for these taxes/charges are analysed in this section. Under a strict Pigouvian framework, the aim of an environmental tax would never be to maximise revenue but to design taxes so that the revenue accruing from them would decline over the years. Therefore, the revenue raised from these taxes shall be viewed as a by-product used to support other causes, such as financing environmental projects through the provision of subsidies and tax expenditure, or for reducing other distortionary taxes. This section is broadly divided into two: the first analyses revenue from environmentally related taxes/charges and the second provide details of data gaps in financial costs incurred by governments for providing subsidies and tax concessions.
Revenue From Environmentally Related Taxes/Charges
Annex II Countries
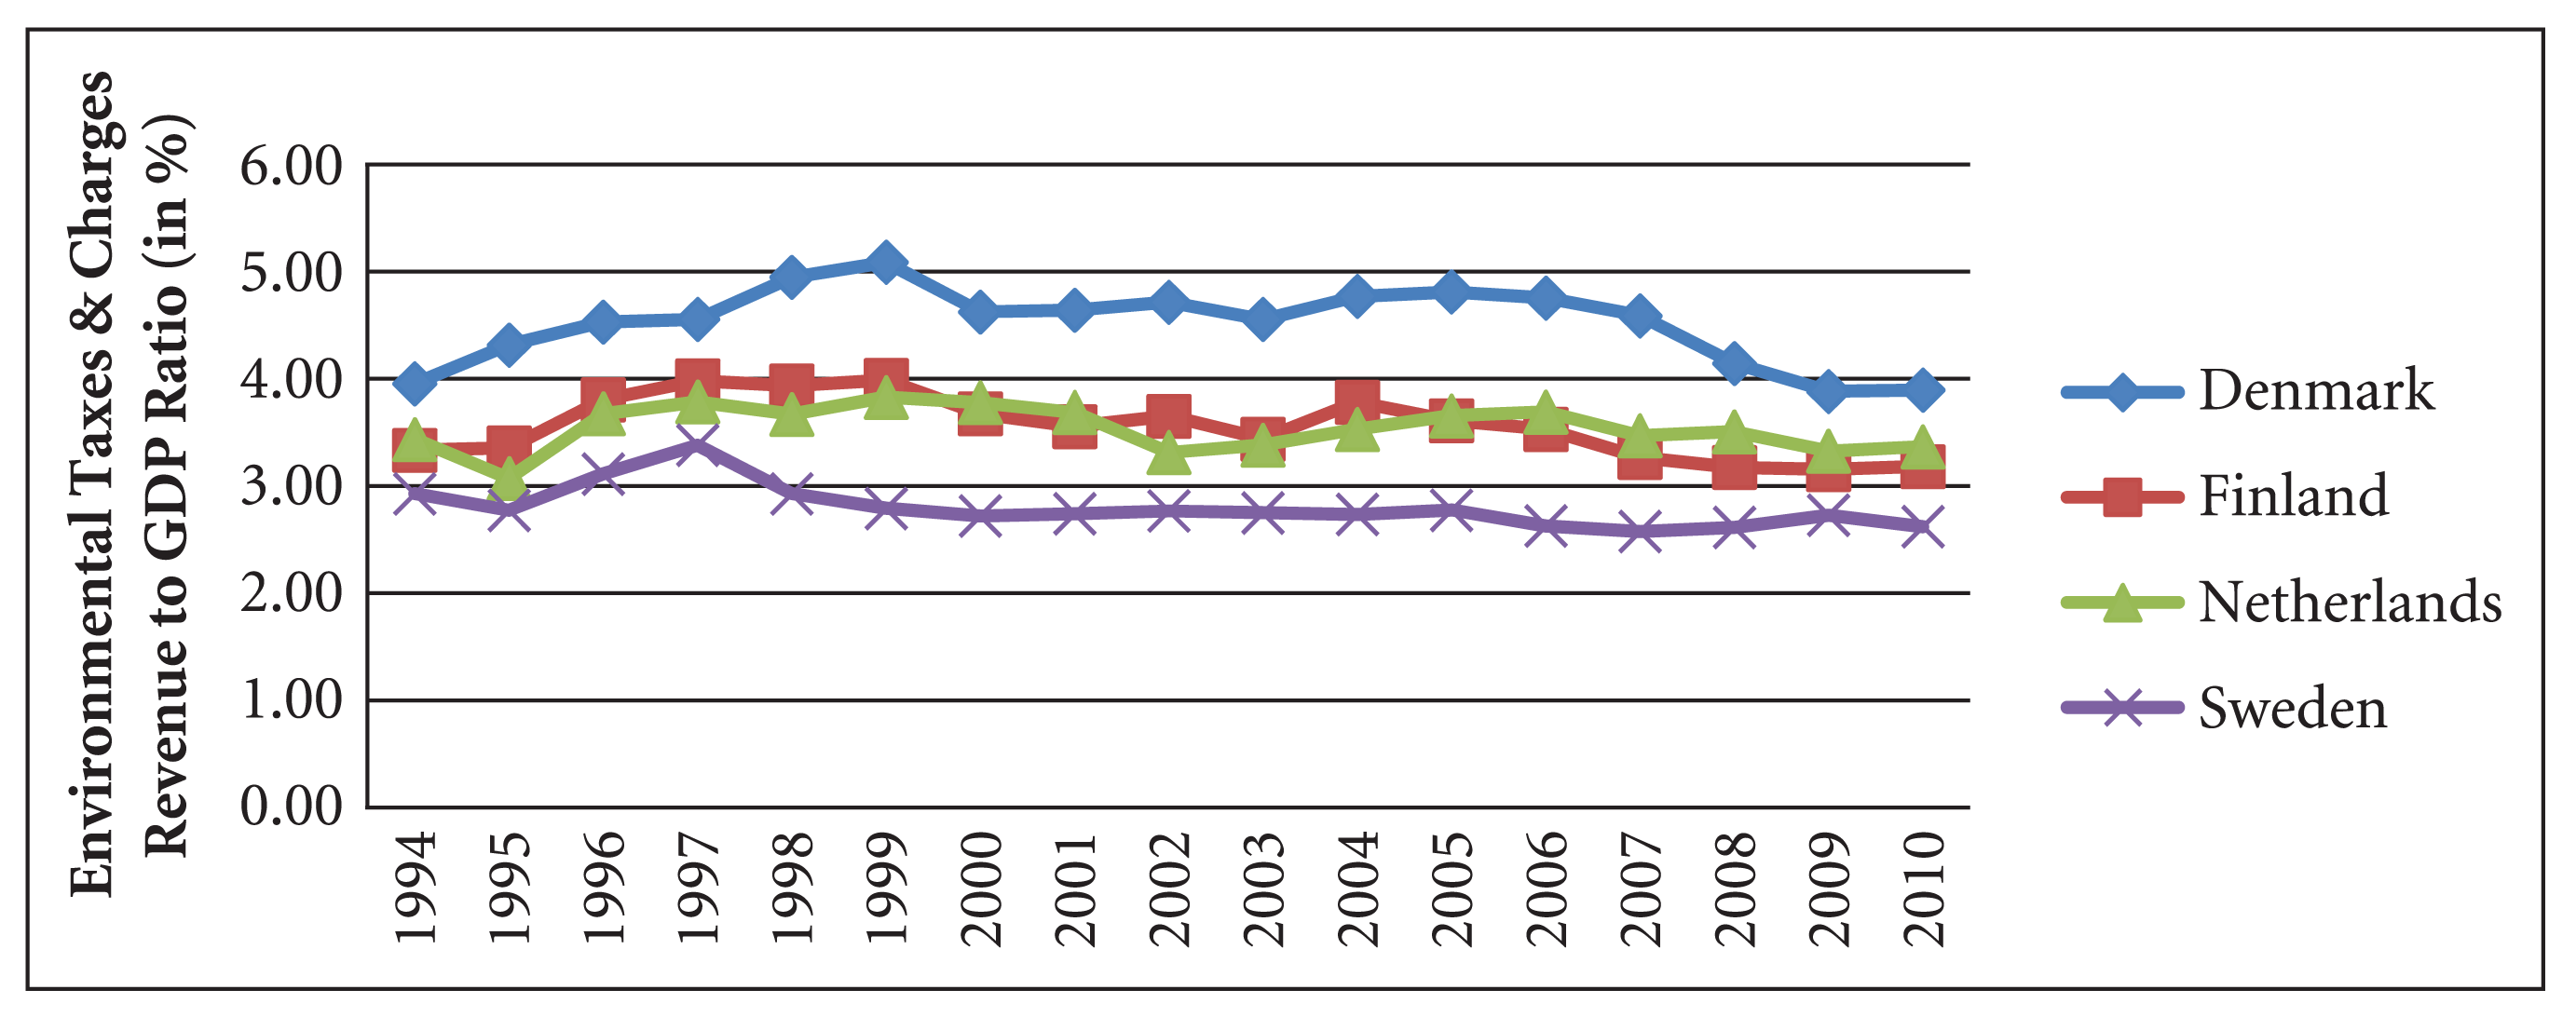
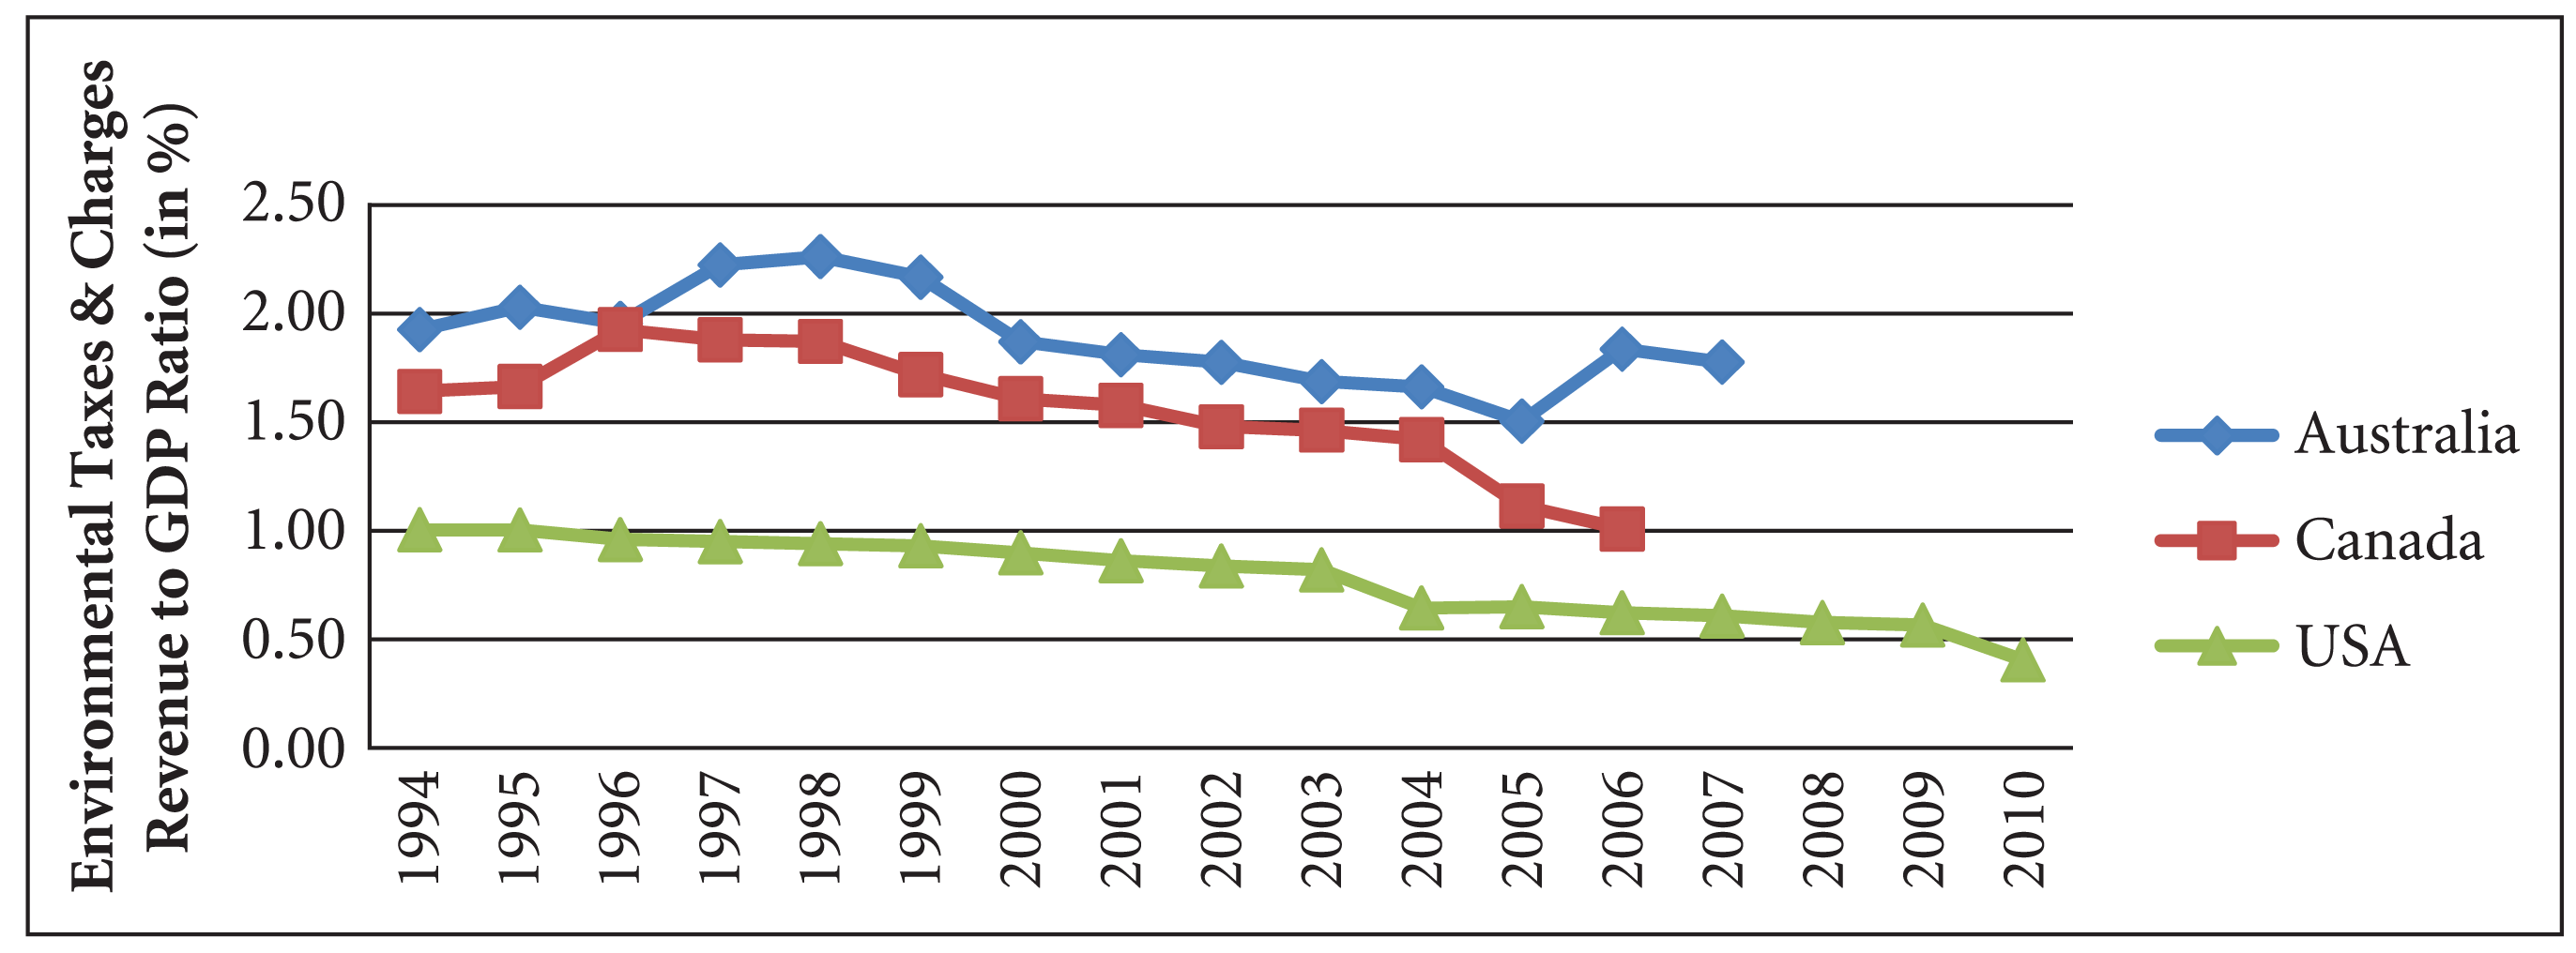
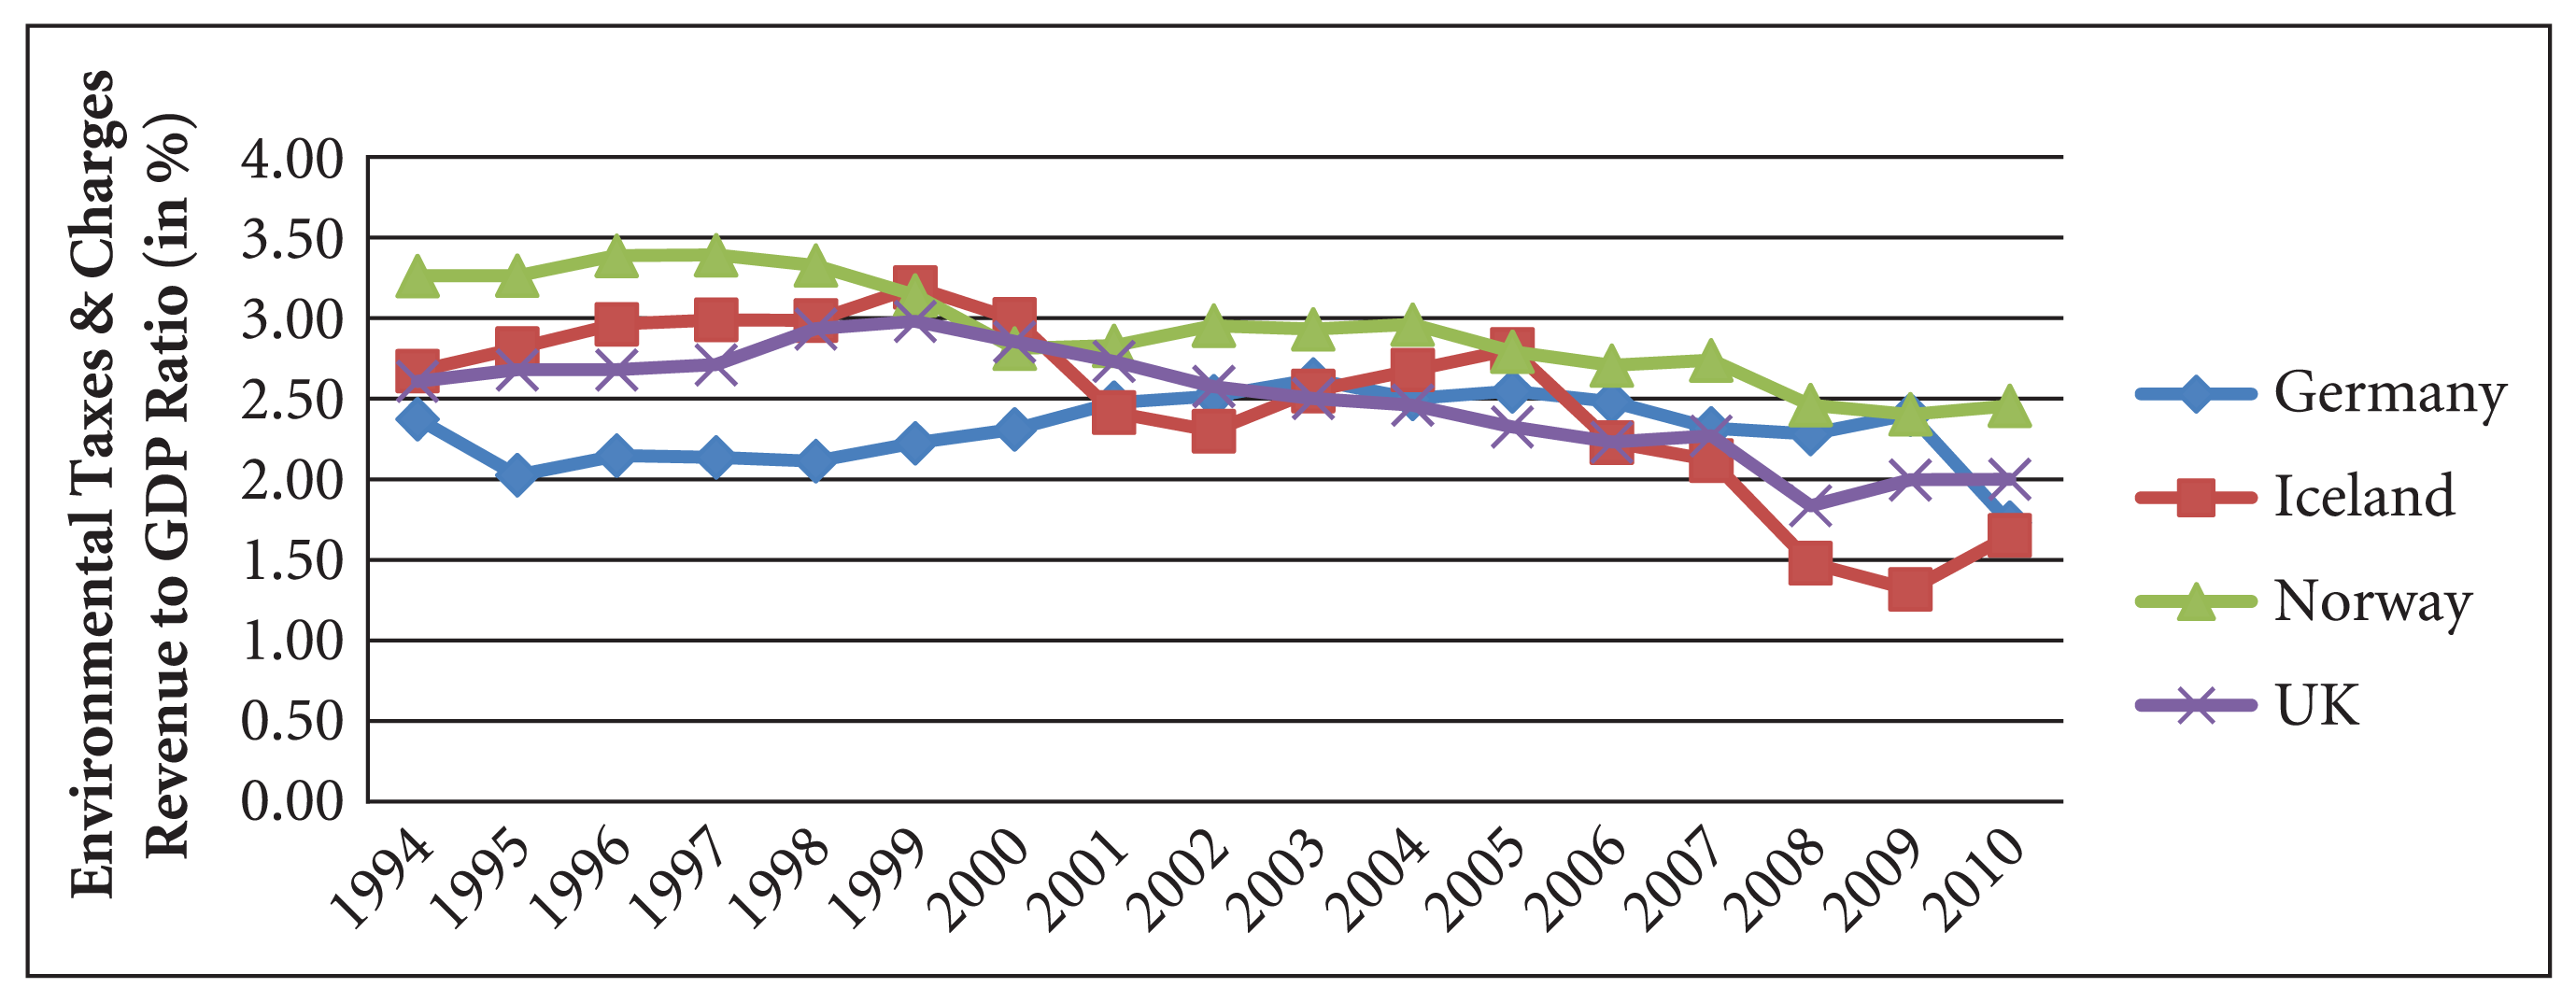
The 11 countries were grouped according to the pattern of their revenues: relatively stable, relative gradual decline and relative steep decline. The first group consists of Denmark, Finland, Netherlands and Sweden; second includes Australia, Canada and the United States of America; and the third group comprises Germany, Iceland, Norway and the United Kingdom.
Figures 2 to 4 give the ratios of the revenue from environmental levies to GDP for the Annex II countries. As is evident from Figure 2, the revenue from environmental taxes/charges 7 as a proportion of GDP is clearly highest for Denmark throughout the analysed period, from 4 per cent of GDP to a maximum of 5 per cent in 1999.The ratio remained almost stable during 2000 to 2006 at a level of 4.6 per cent before falling back to around 4 per cent in the subsequent periods. This downturn in the ratio after 2006 occurred because the rate of growth of GDP was more than the environmental tax revenue (ETR) 8 (Table 6). Further, the relative steep decline in 2008 could be attributed to the global recession, which not only affected GDP but also the ETR for Denmark. This is also the case for all the other Annex II countries, except that the decline for the United States of America and Germany is not as steep as that for Denmark. This analysis was not possible for Australia and Canada because post-2007 and 2006, respectively, the data were discontinuous.
The second category of countries (Australia, Canada and South Africa) experienced an almost a continuous decline, except for certain periods where there was an abrupt increase in revenue, such as 1997 and 2006 for Australia. This decline is relatively gradual when compared to the third category (Figures 3 and 4): Iceland and the United Kingdom show the steepest decline in the third group followed by Norway, but Germany is relatively the most stable of all. In these countries, the ratios between 2 per cent and 3 per cent on a whole, except for Iceland where the ratio dropped below 2 per cent after 2007. This sudden drop is largely because of a drastic decline in the revenue from two taxes: excise on motor vehicles and petrol and diesel. The contribution of the former tax in the decline is the largest, amounting to around USD97mn.
An analysis of the proportion of revenue from environmental levies to total tax revenue for these countries shows an almost similar trend, except that the ratios are higher. 9 The ratio in the Netherlands moves closer to Denmark and, in fact, crosses Denmark in 2008 and stabilises at 9.39 per cent while Denmark declines to 8.37 per cent. This ratio for Finland is around 8 per cent and for Sweden it stabilises at around 6 per cent. In the case of the second category, the pattern of decline is similar to that of Figure 3 but the movement in the ratio for the United States of America is more evident: it begins at around 4 per cent and ends at around 2 per cent. On the other hand, there is a much steeper decline for almost all the countries in the third category, but the pattern of decline is similar to that of Figure 3, and their ratios move along a bandwidth of 6 per cent to 9 per cent of their respective total tax revenue.
Since for most of the countries, the proportion lies between 5 per cent and 10 per cent of their total tax revenue and between 2 per cent and 4 per cent of their GDPs, this indicates that environmental levies form a substantial part of their taxes and also their economies. Among the European countries, the dominance of the Nordic countries (Denmark, Finland, Iceland, Norway and Sweden) is clearly depicted in Figures 2 and 4: their ETRs lay between 2 per cent and 5 per cent of their GDP. The only non-Nordic European country whose ETR proportion lies close to Nordic countries is the Netherlands. The findings of this study are similar to the existing literature (OECD, 2002, 2006 as cited in Barde & Godard, 2012; Srivastava & Kumar, 2014; Szigeti, 2005). Explanations for the patterns of ETR proportions for all the countries have been provided in Table 6.
Pattern of Environmental Levies’ Revenues in Annex II Country Revenues
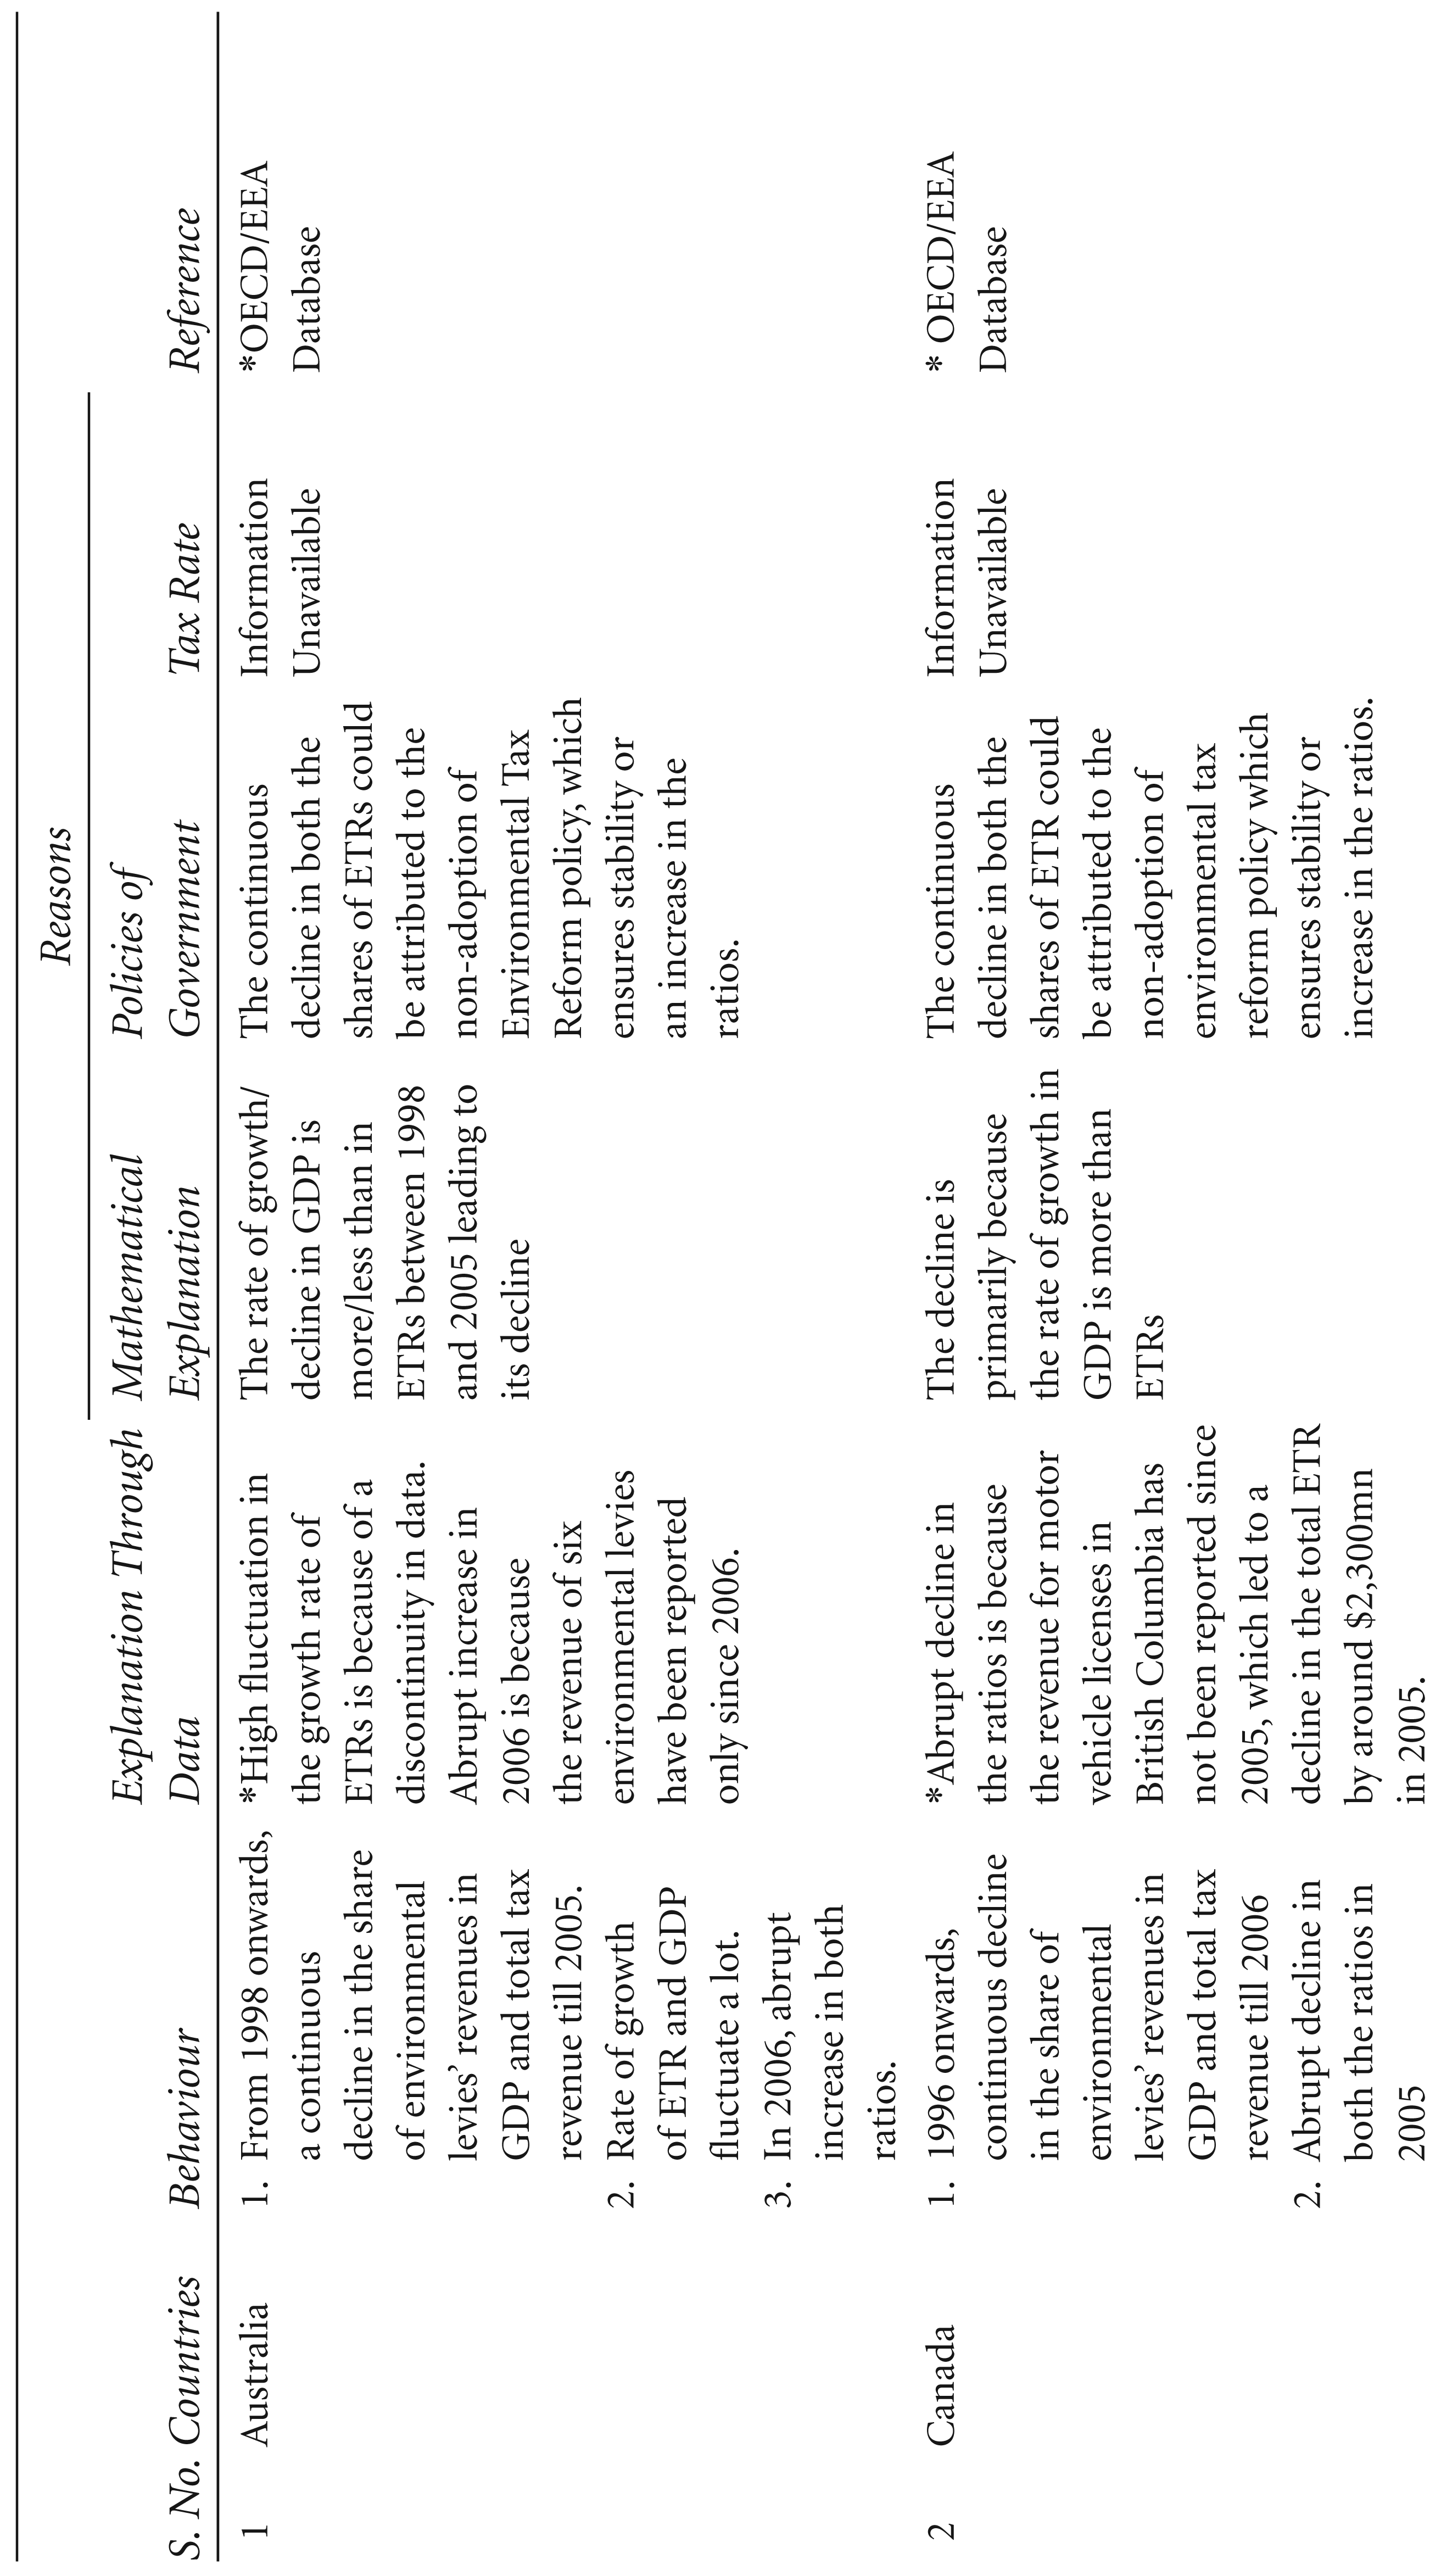
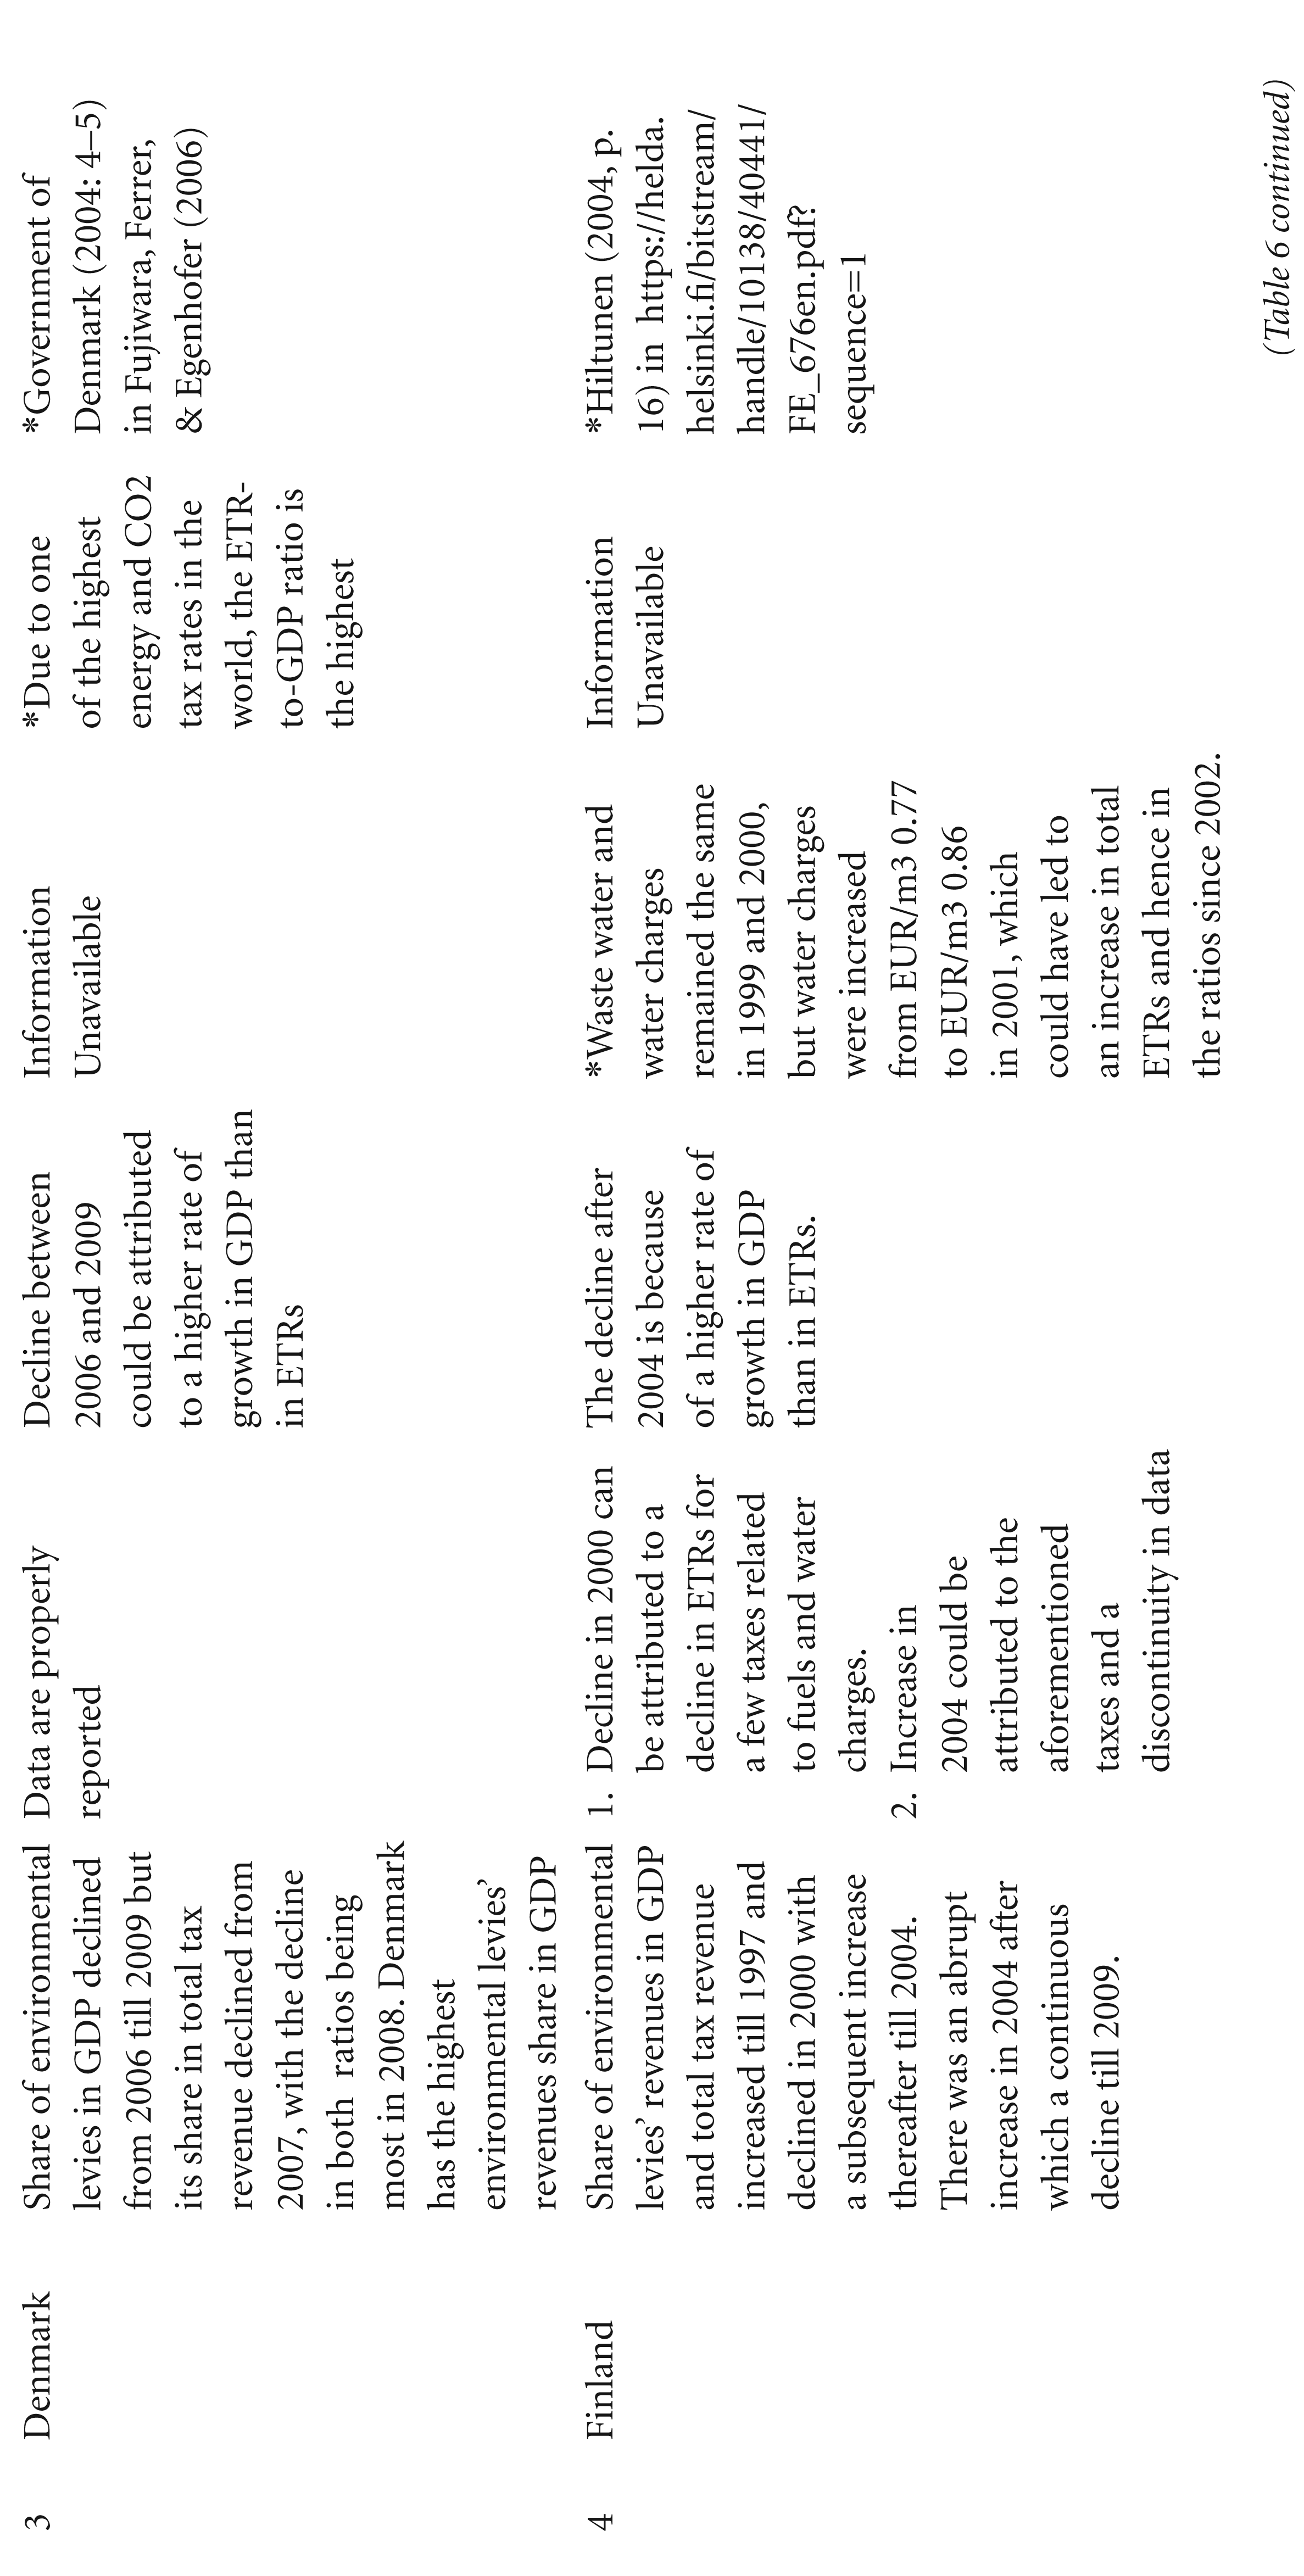
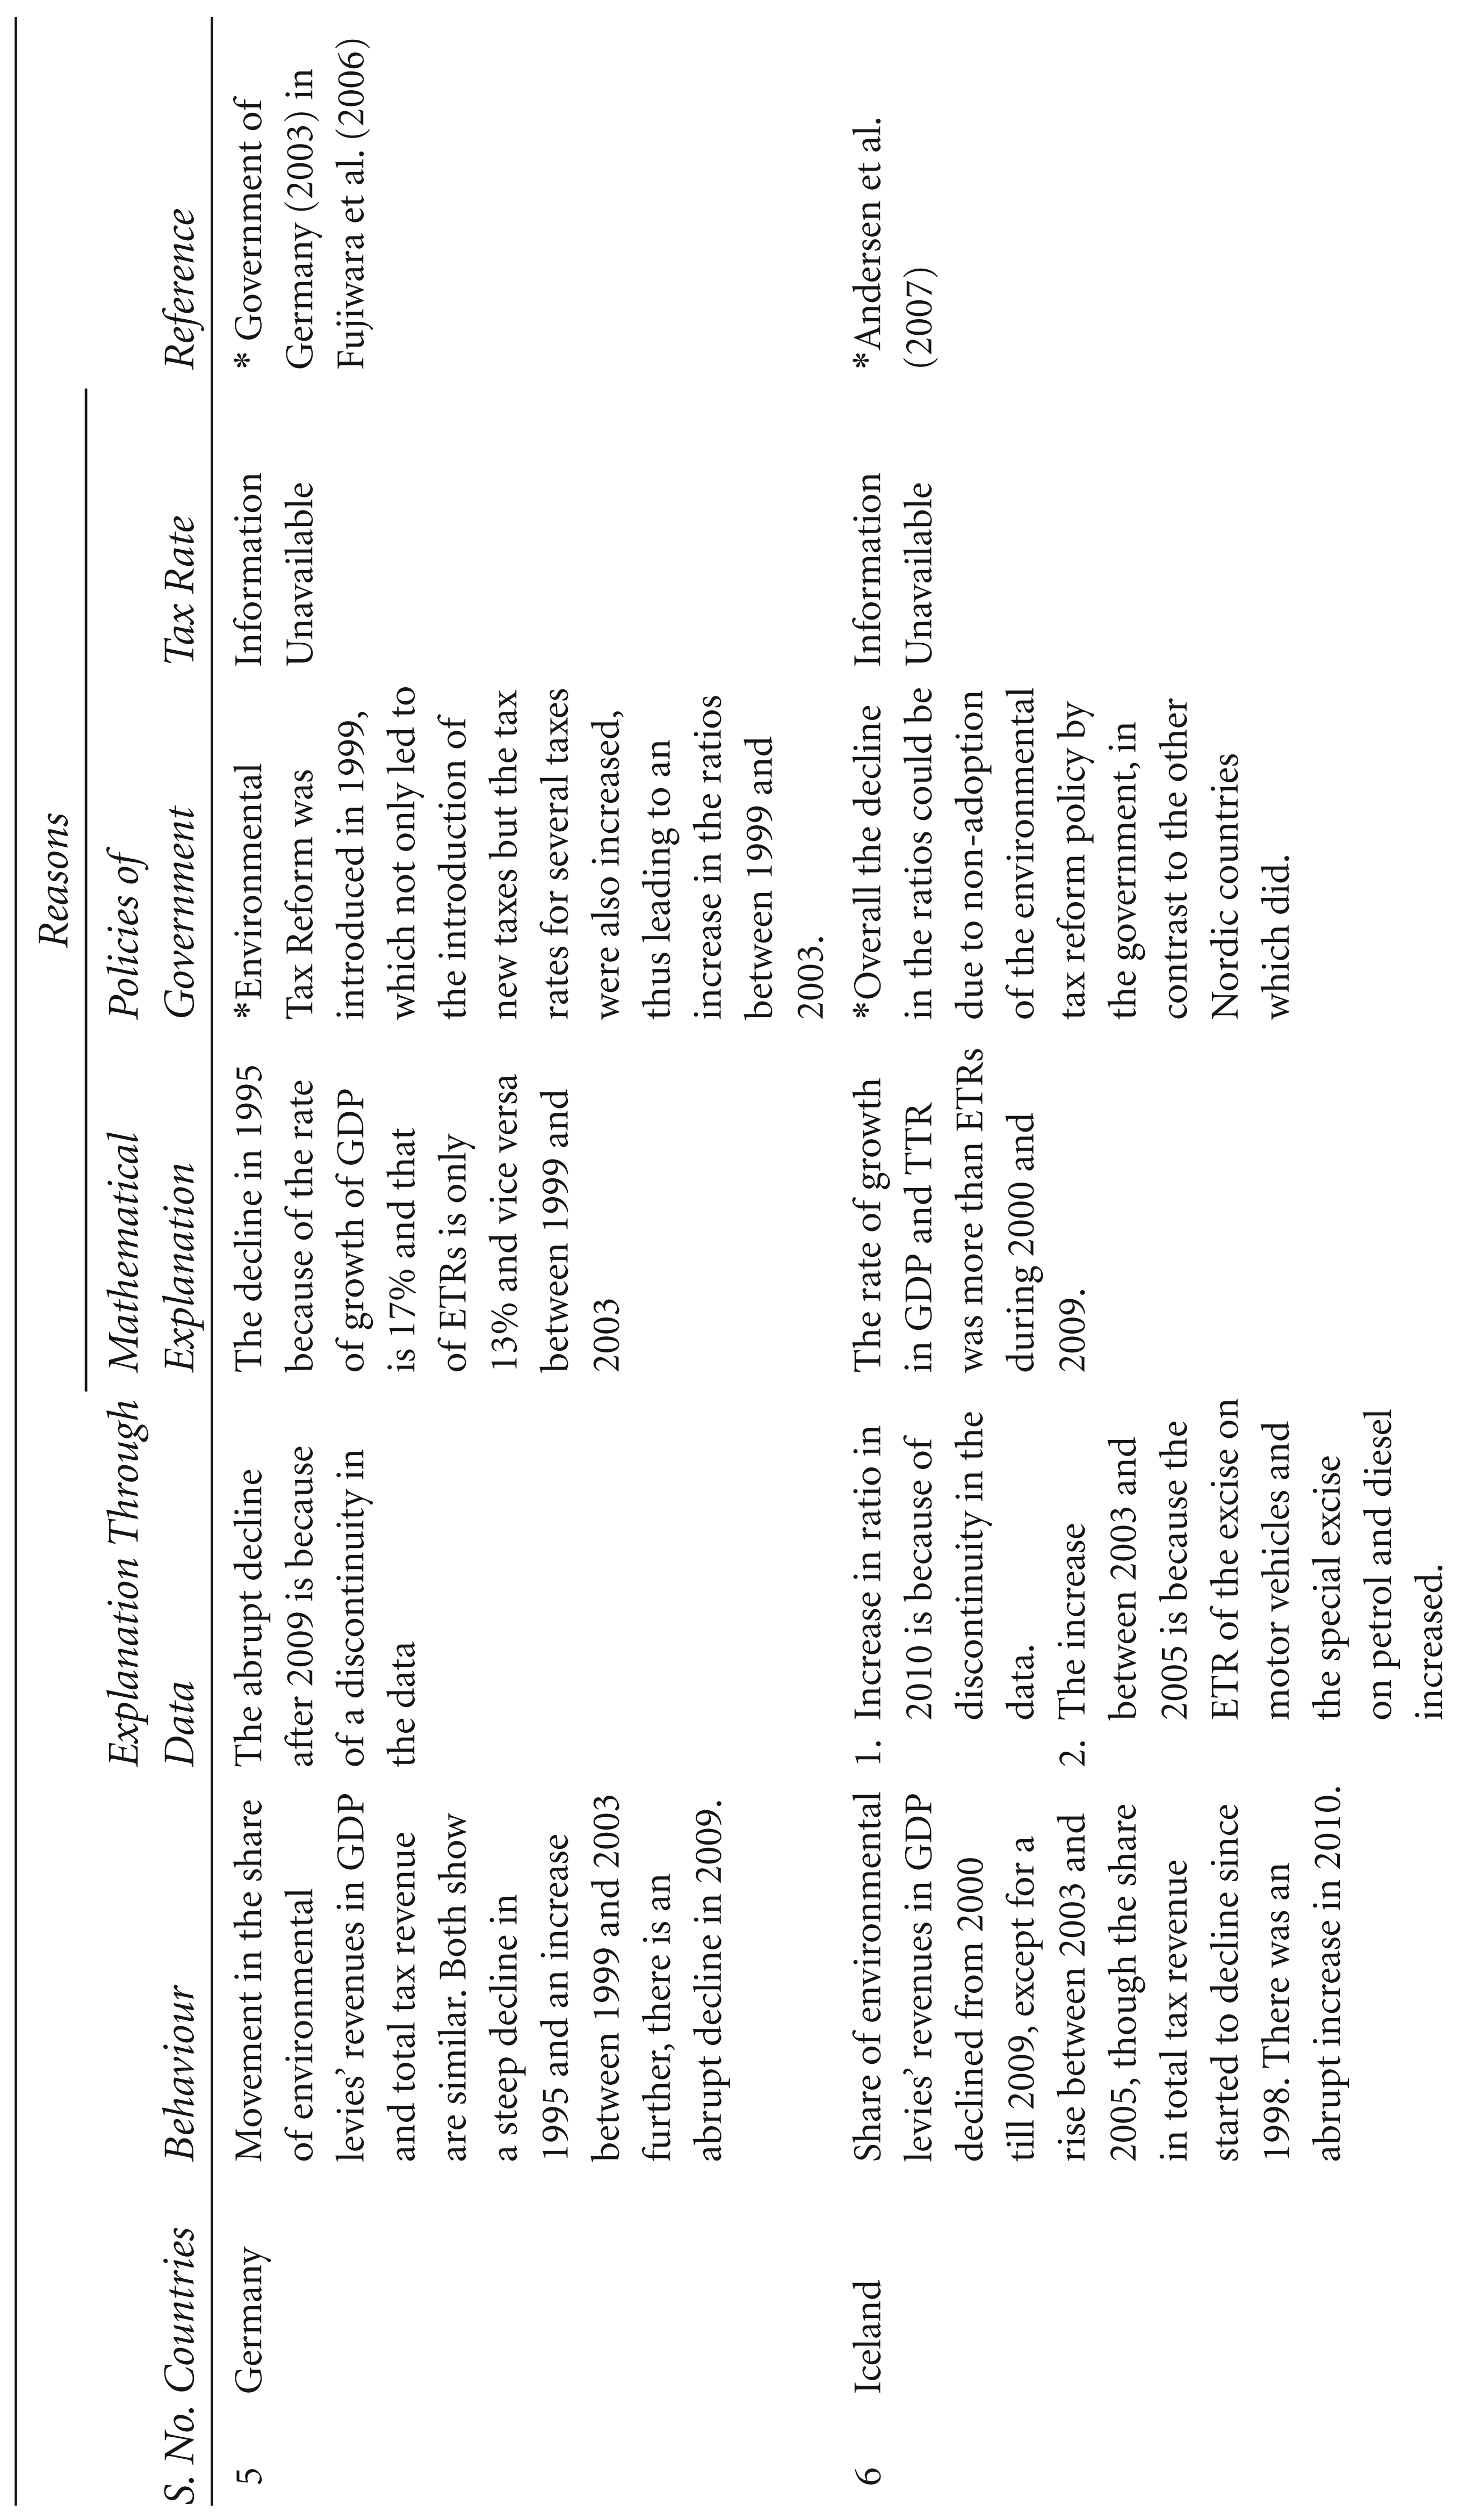
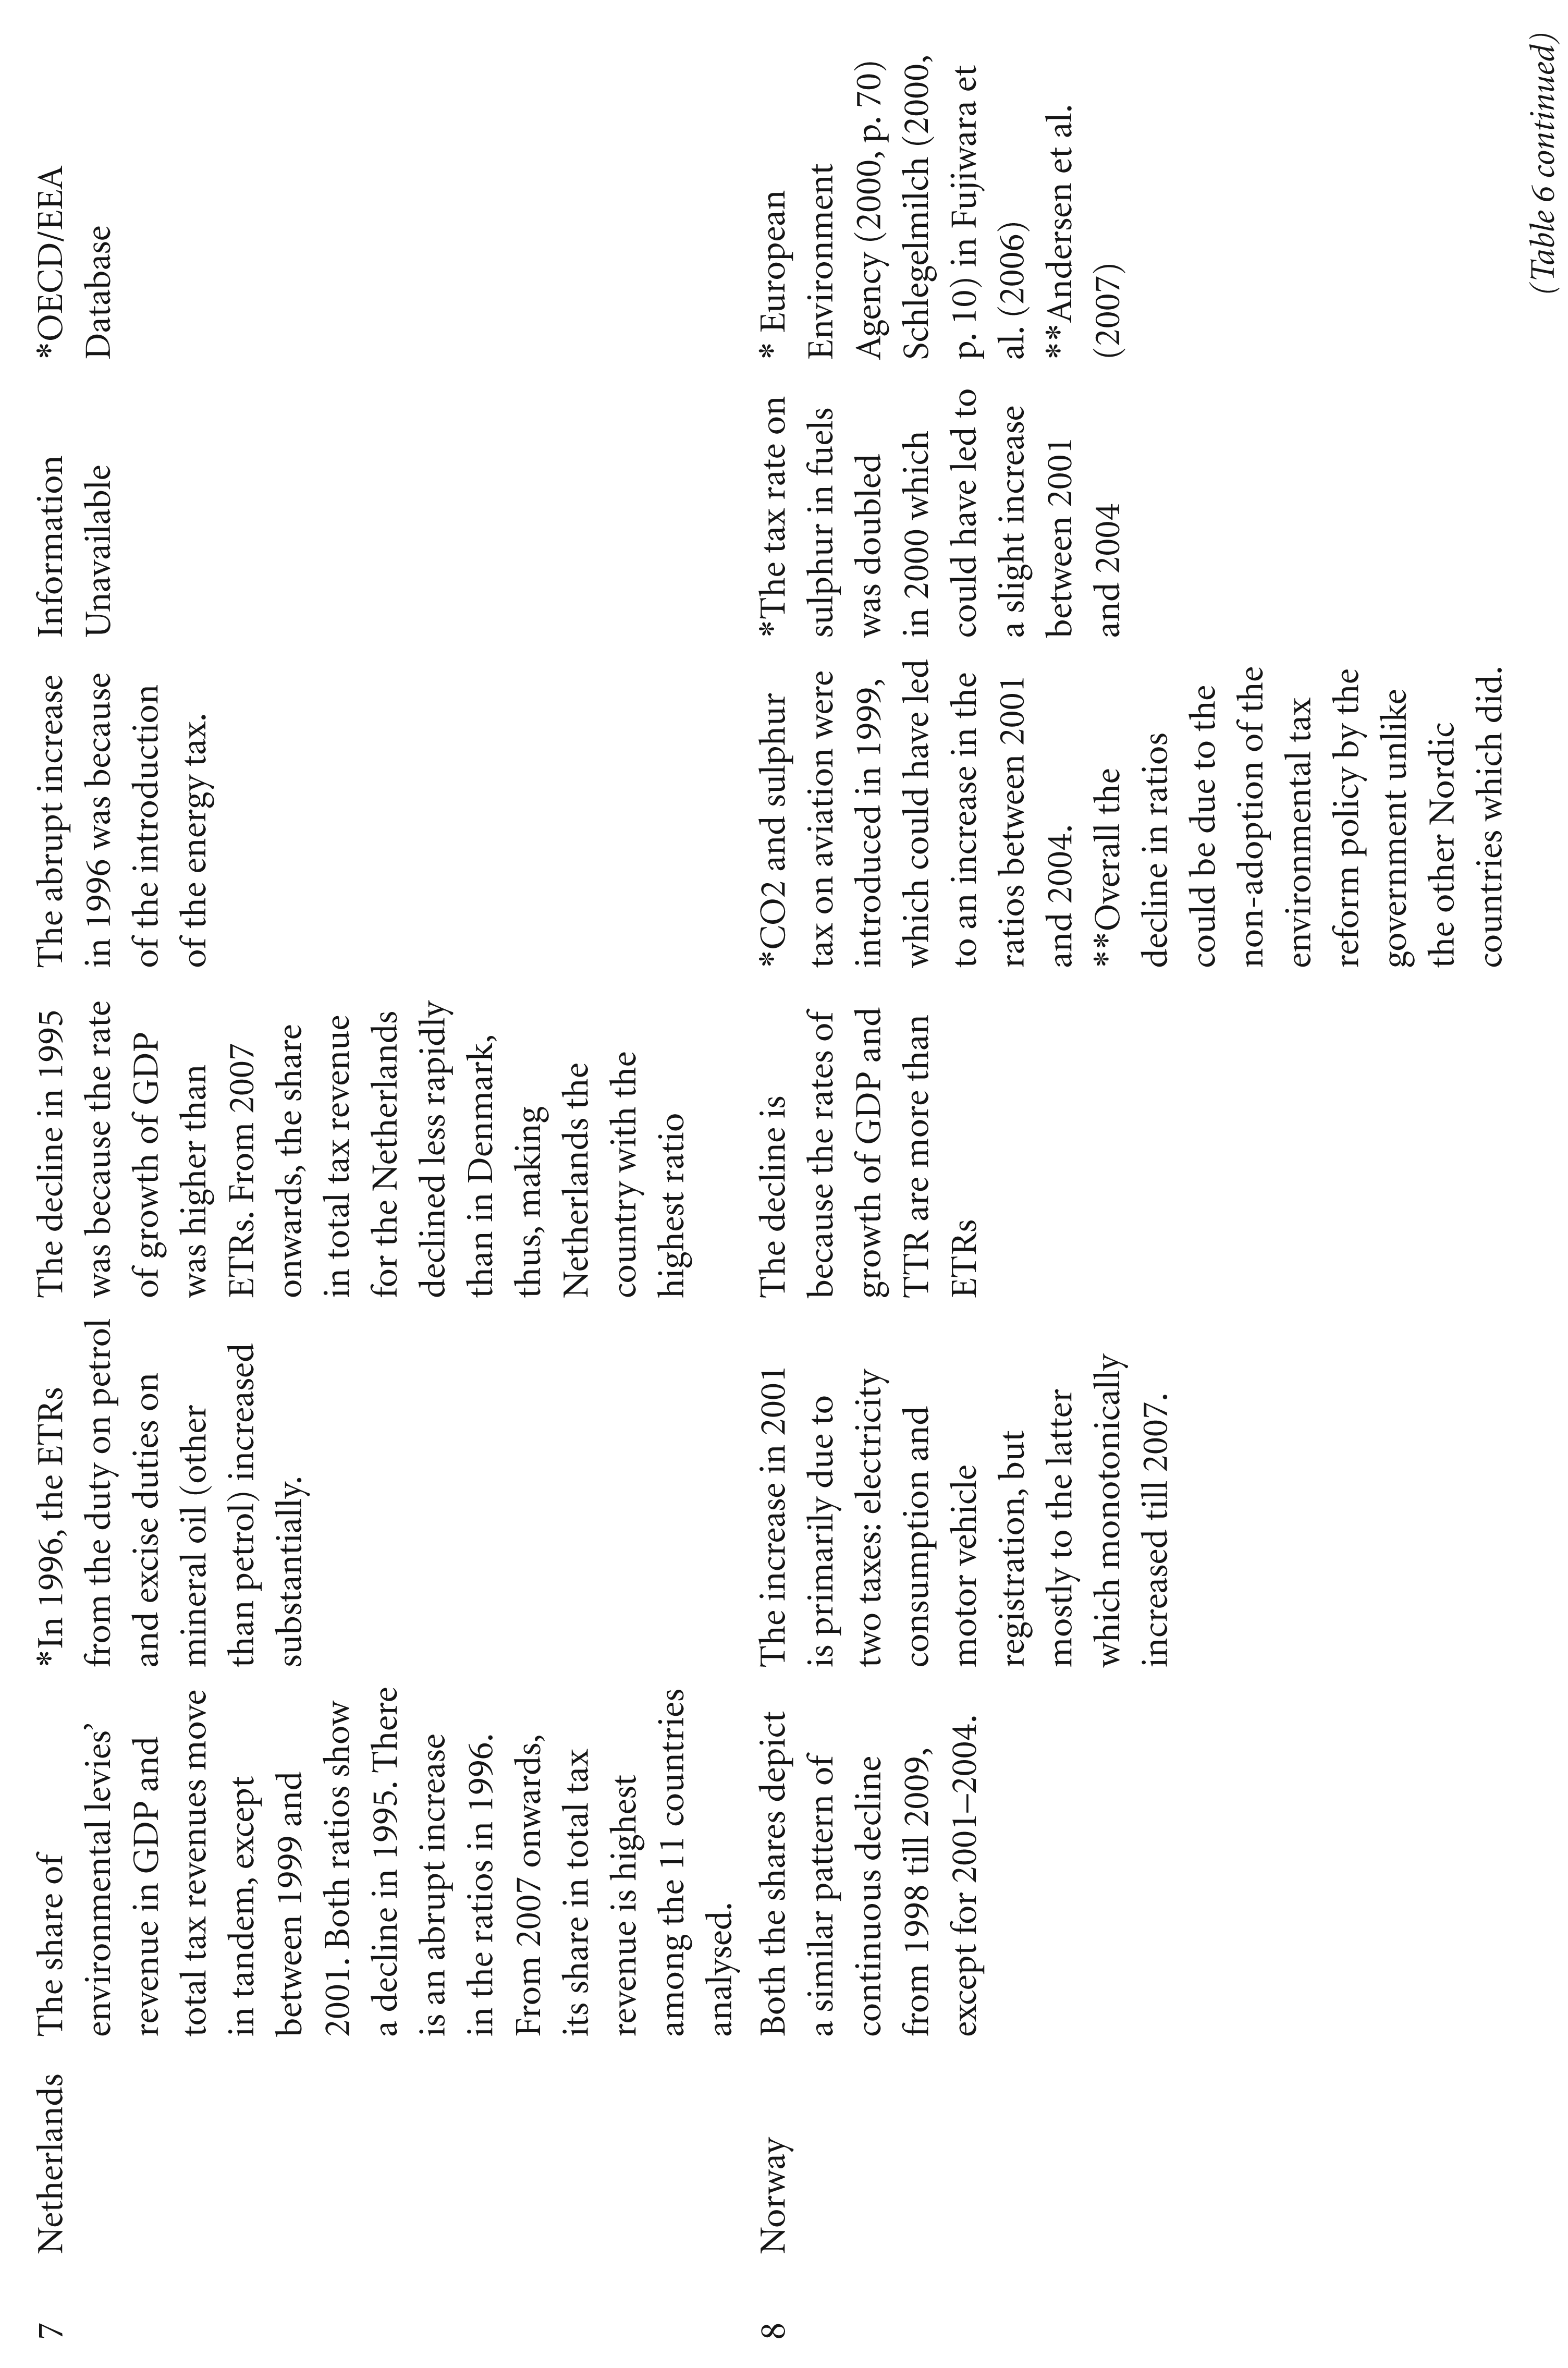
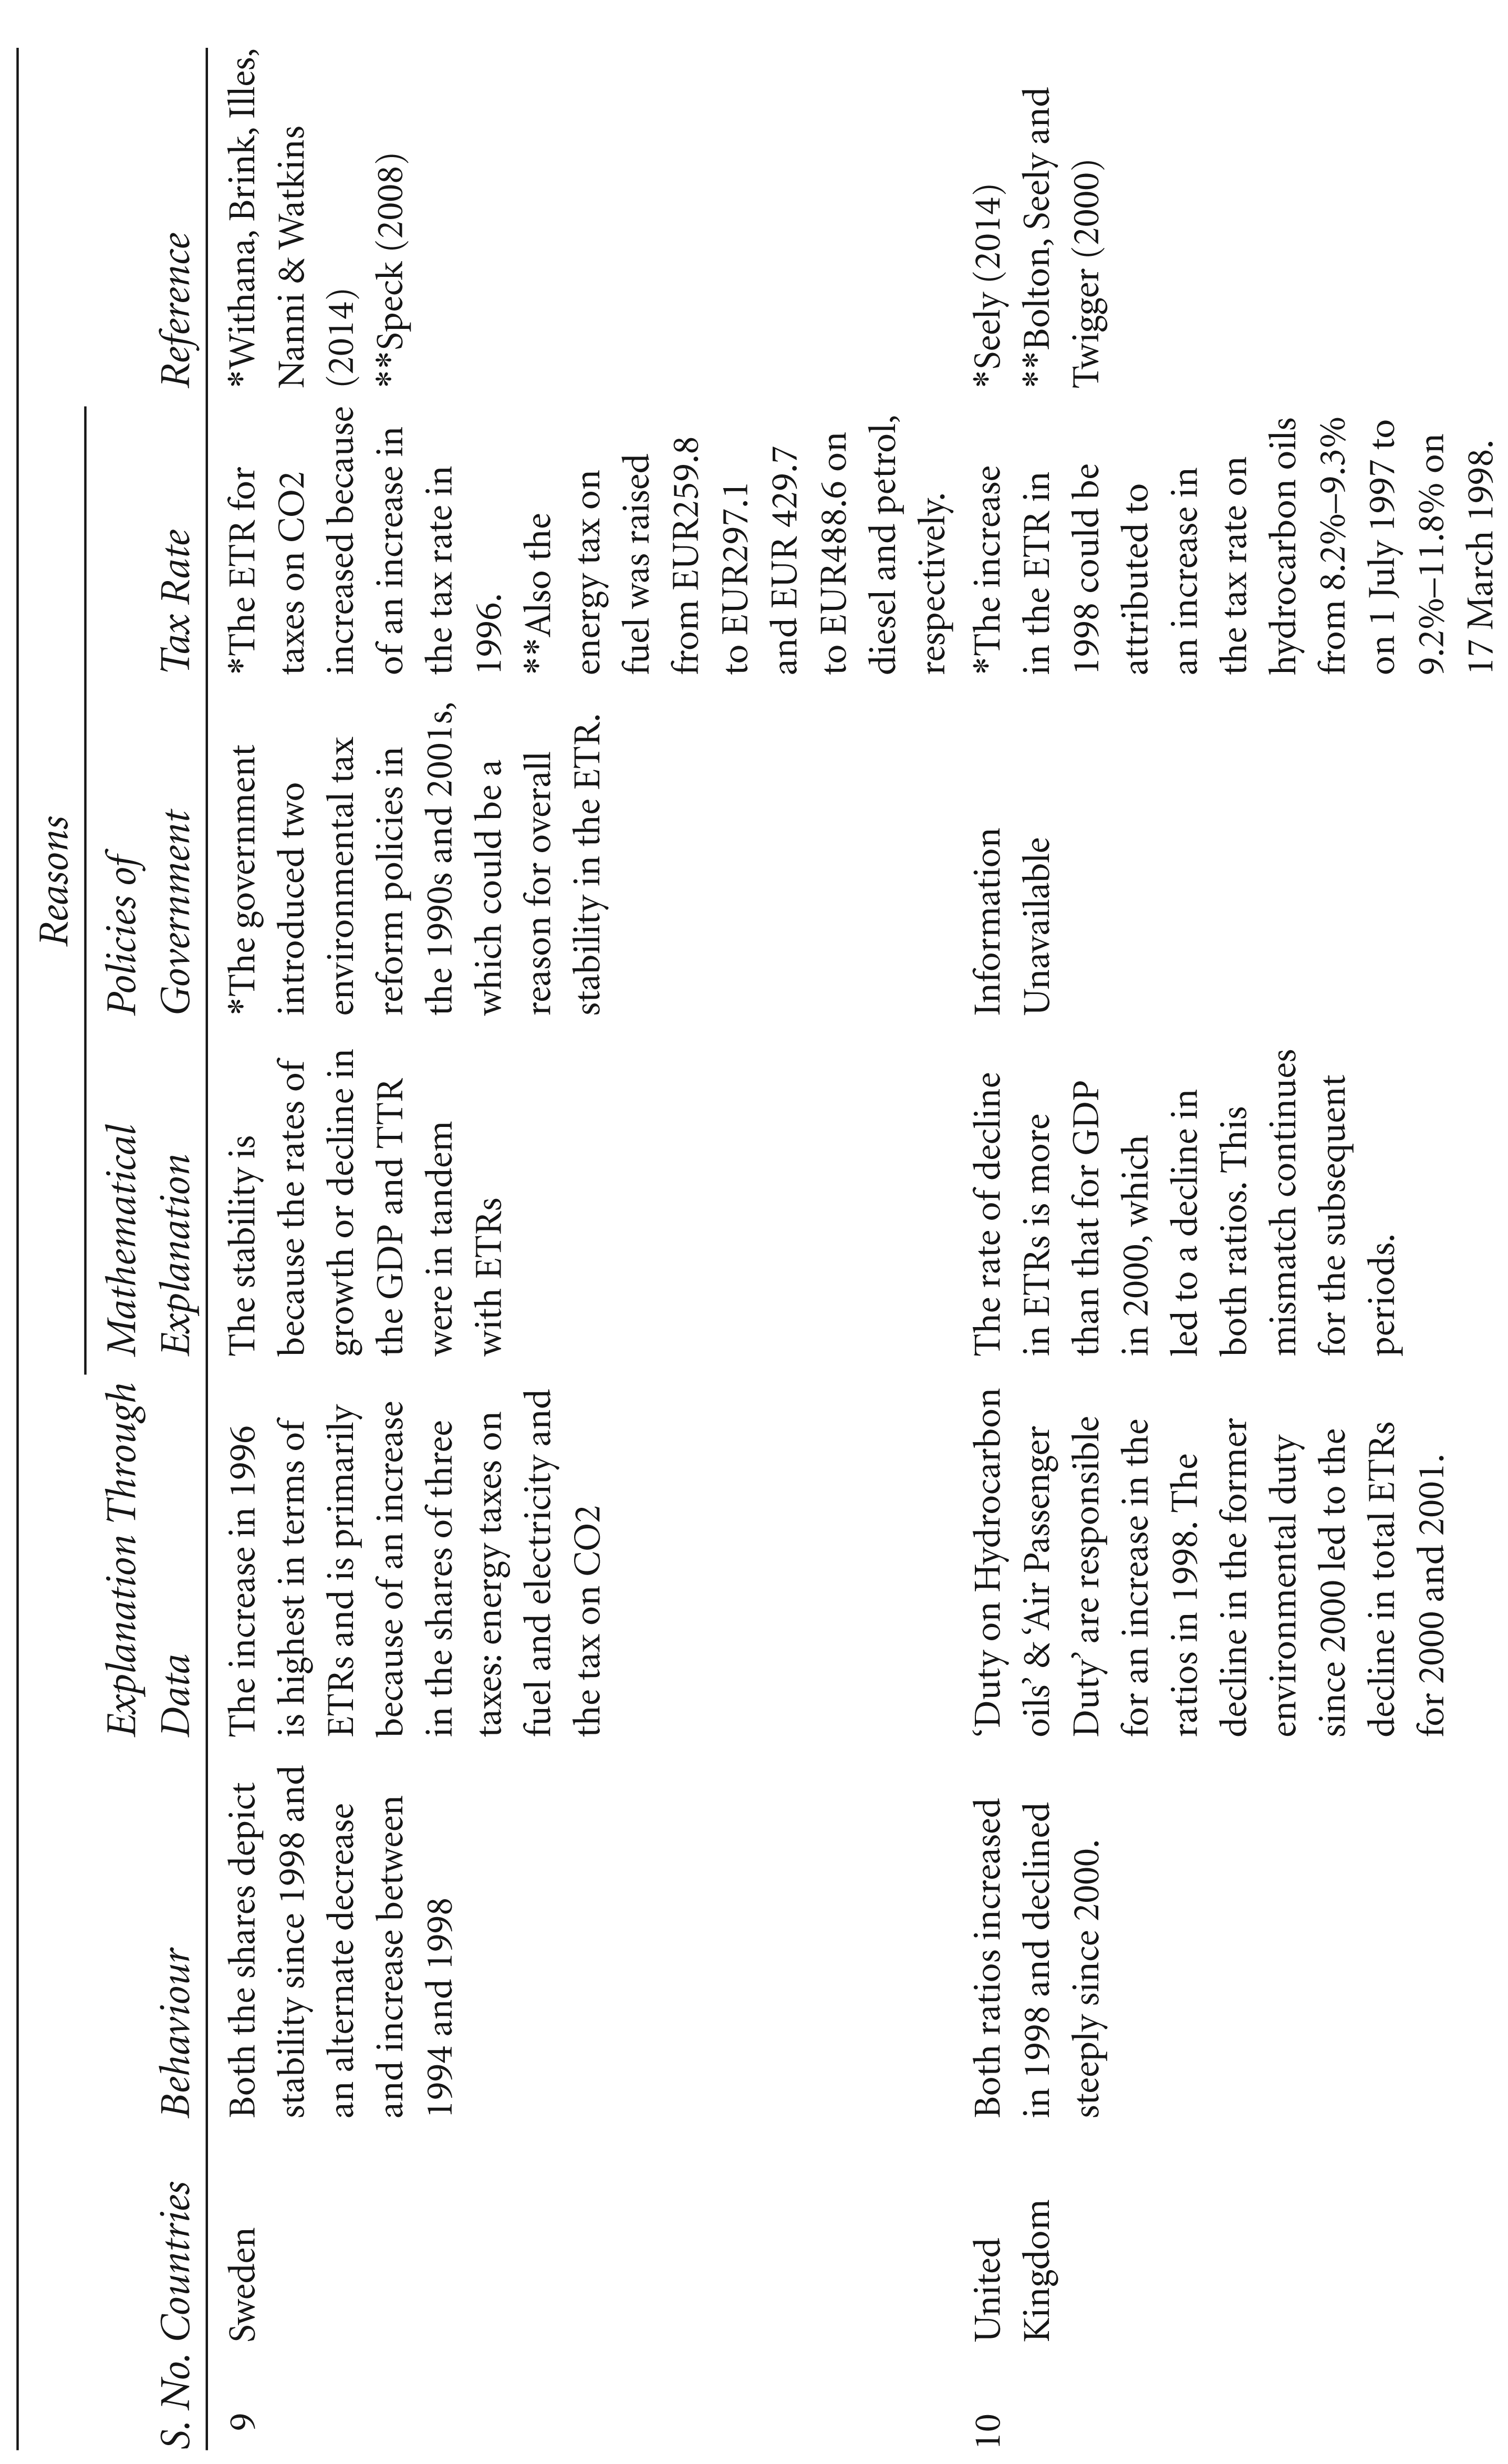
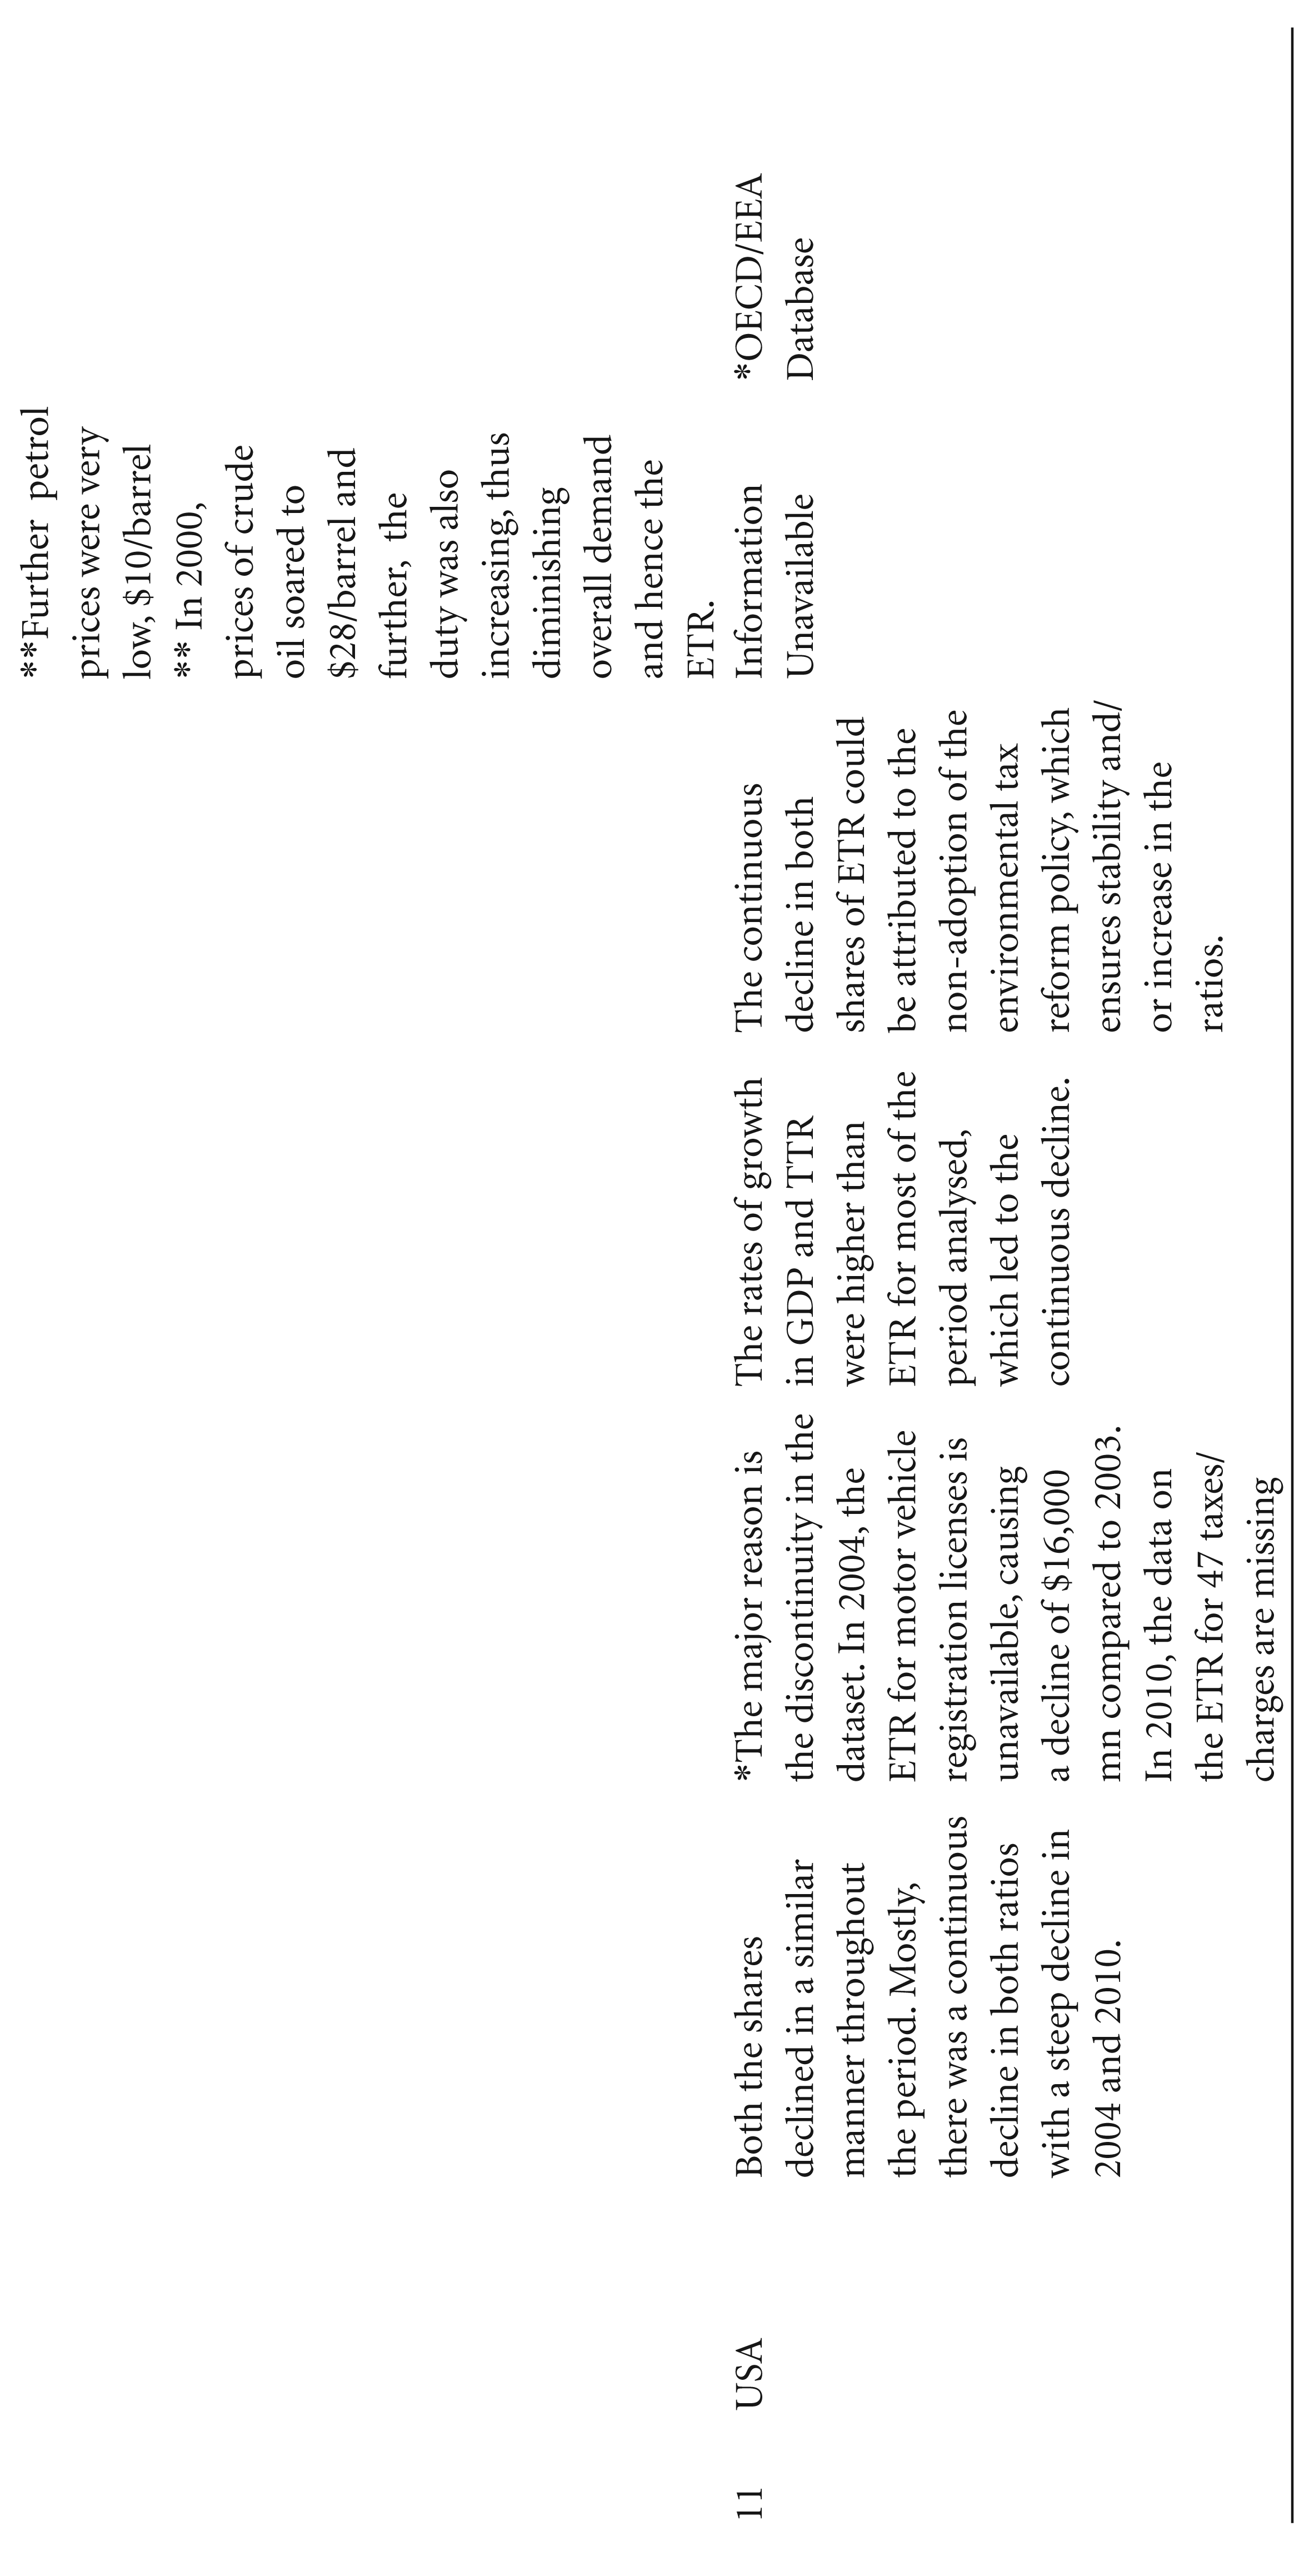
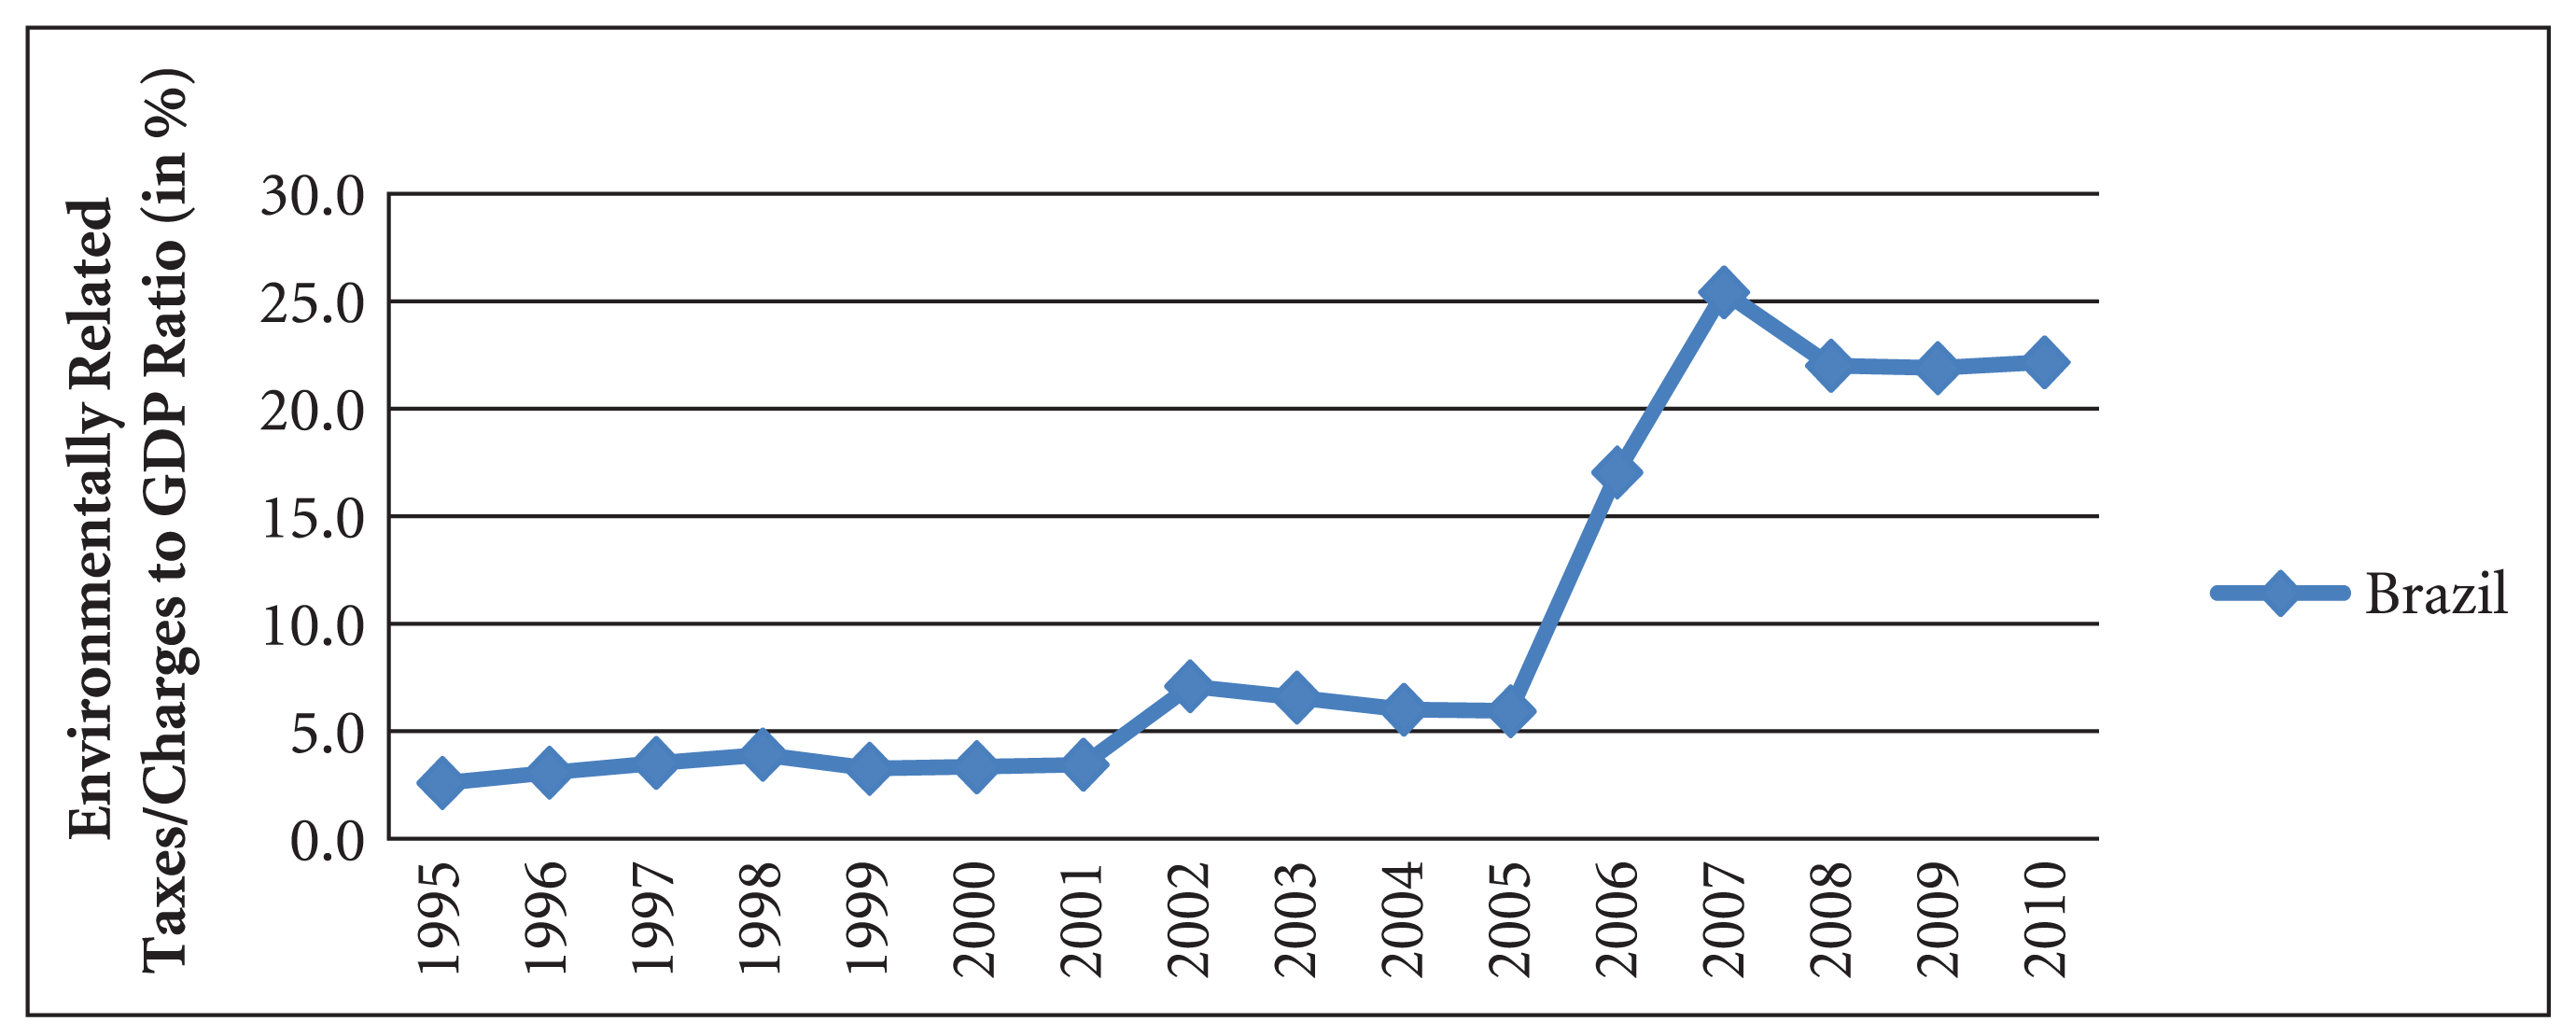
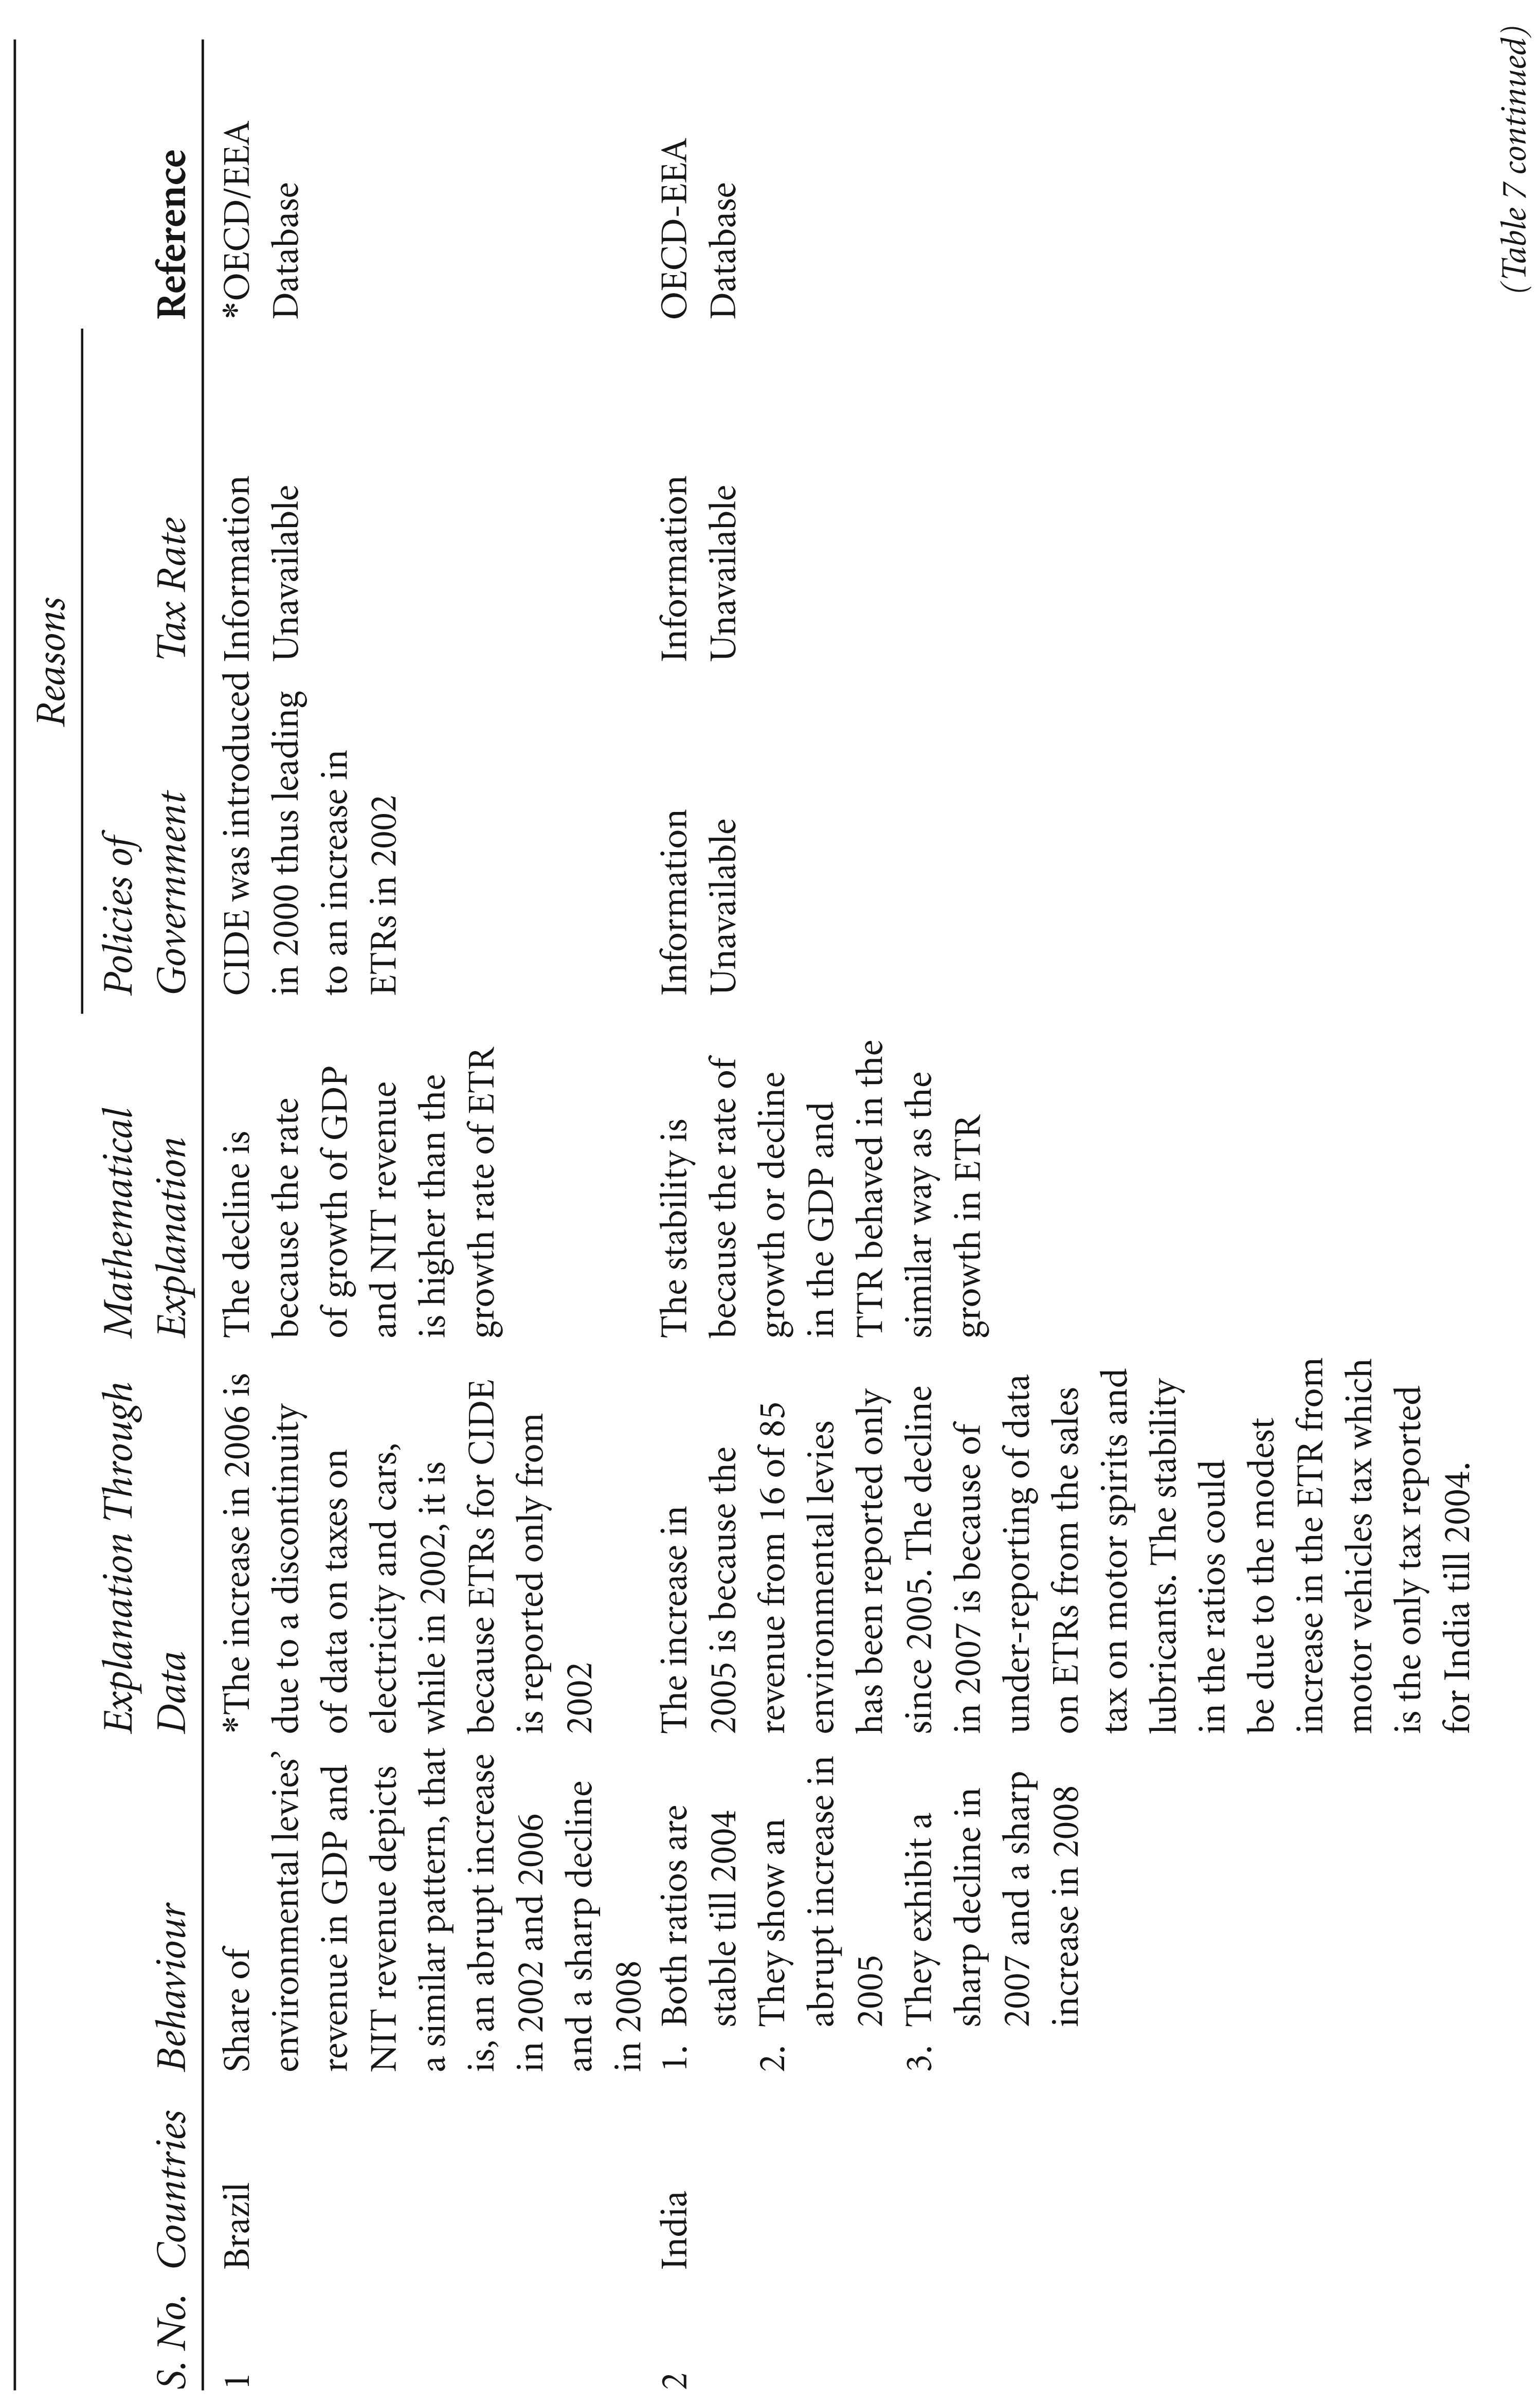
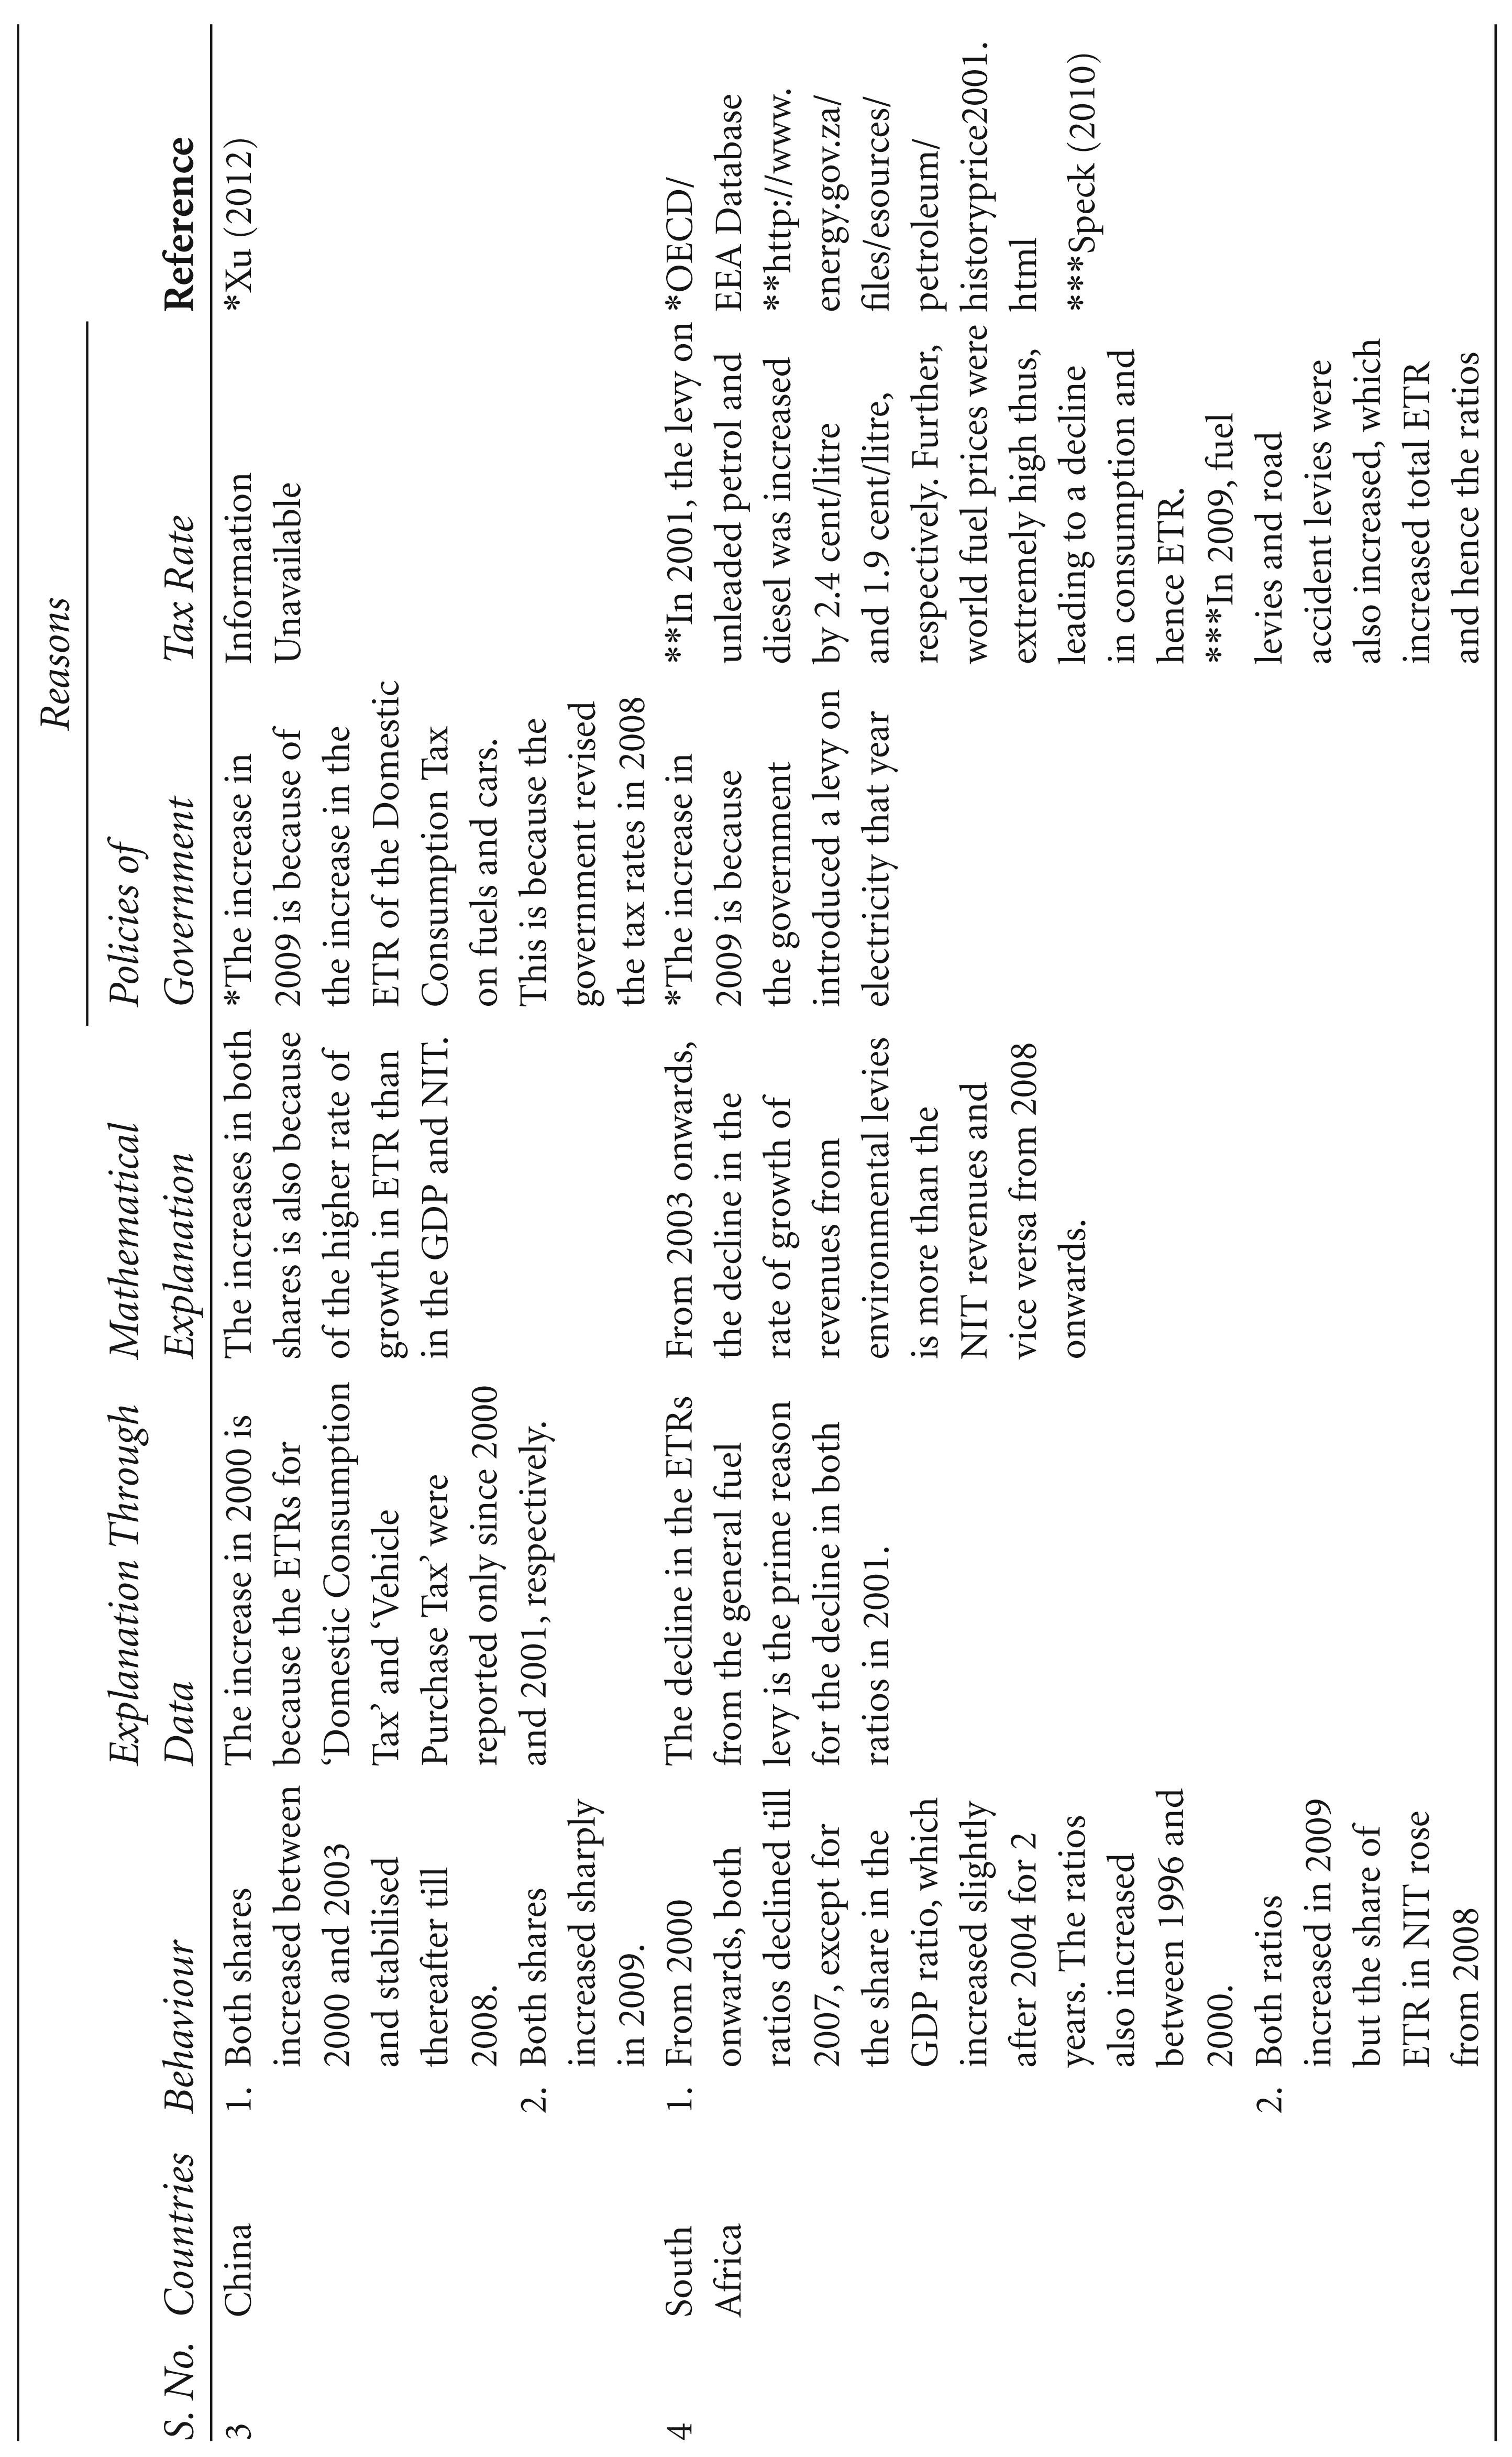
Figure 5 depicts revenues from environmental levies as a proportion of GDP for Non-Annex I countries. The figure does not include Brazil because its pattern is hugely irregular which distorts the analysis for the other three countries, and we have considered Brazil separately in Figure 6. The analysis shows that the ratios for India and Brazil remained stable in the initial years, at around 0.2 per cent and 3.4 per cent of their respective GDPs, whereas the ratio for China stabilised only during 2004–2008 at 0.8 per cent of its GDP, after which there was an abrupt increase. On the other hand, the ratio for South Africa stabilised only during 2003–2006 at around 1.7 per cent of its GDP, otherwise its ratio fluctuated considerably. Figure 6 depicts an abrupt increase for Brazil in 2002 and even more in 2006. The increase in 2006 is due to a discontinuity of data on taxes on electricity and cars. The revenue from these taxes was reported only since 2006; therefore, it indicates an increase of around USD17,000 mn, thereby distorting the analysis. Similarly, the increase in 2002 was because the ETRs from a tax called ‘Contributions for interventions in the economic domain’ were reported only since 2002, thus indicating an increase of around USD2,500 mn in total ETRs in 2002. India has a similar situation in 2005 when the drastic increase in its ETRs is largely because the revenue from 16 of the 85 environmental levies has been reported only since 2005. In case of China as well, both shares, that is, the share of ETR in GDP and in total NIT revenue, increased between 2000 and 2003 and in 2009. The first increase is because the ETRs from the domestic consumption tax on fuels and cars and the vehicle purchase tax were reported only from 2000 to 2001, respectively; in 2009 the increase was again because of the domestic consumption tax on fuels and cars, but not due to a discontinuity in the data but due to an increase in tax rates in 2008 (Xu, 2012).
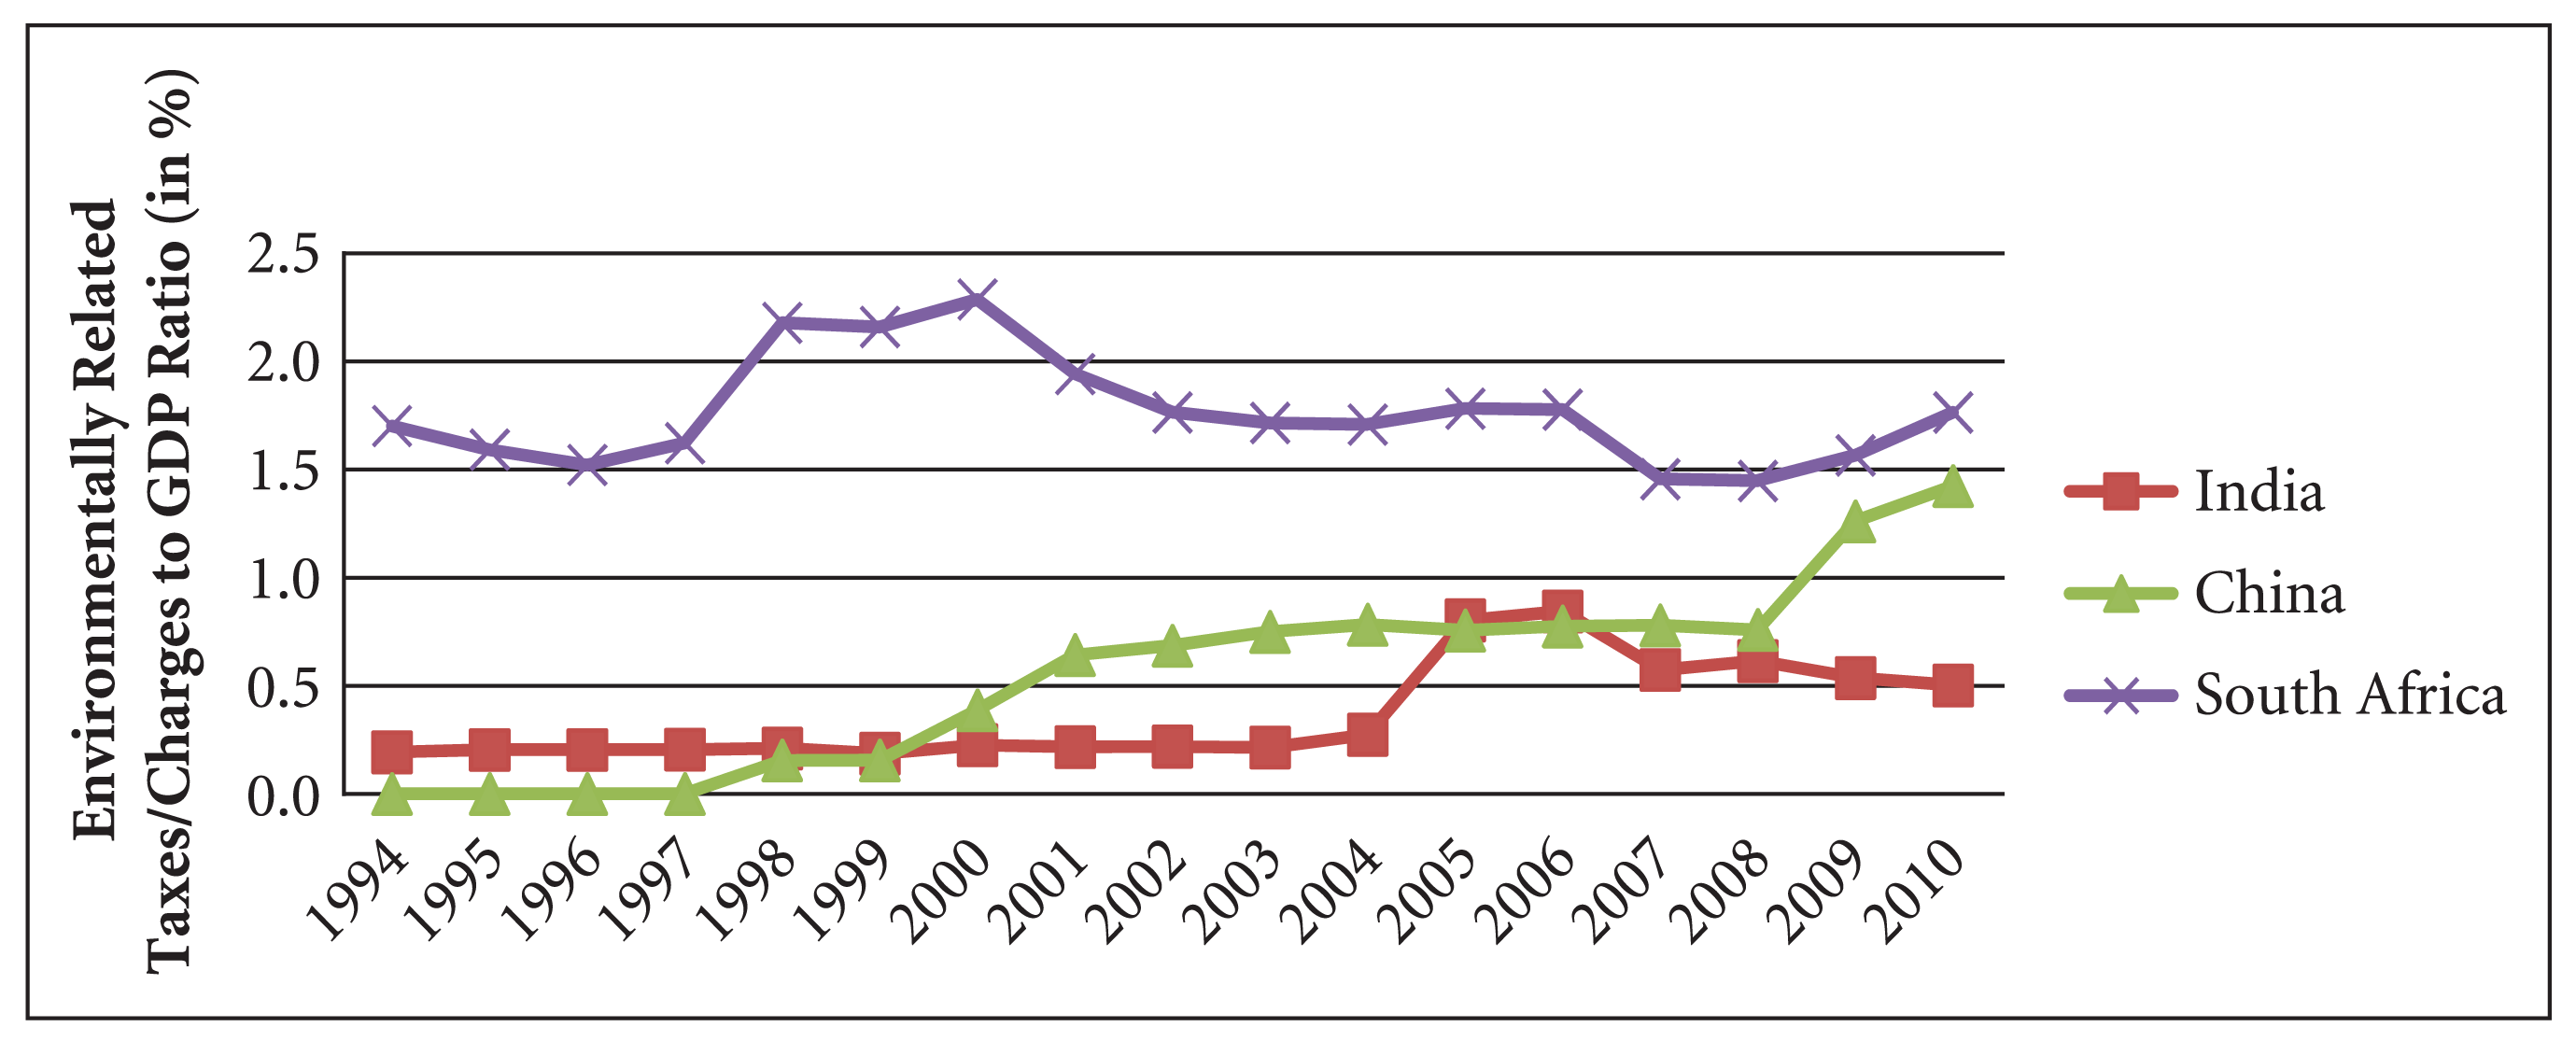
South Africa is the only exception in this group, where discontinuity in data has not affected the analysis. As discussed earlier, South Africa shows a lot of variations in both ratios and the patterns of these ratios are similar for the entire study period. For example, from 2001 onwards, both ratios declined till 2007, except for the share in GDP ratio which increased slightly after 2004 for 2 years. The ratios also increased from 1996 to 2000. The decline in both ratios could be attributed to the ETR in 2001 which declined largely because of the reduction in revenues from the general fuel levy. From 2003 onwards, the decline in the rate of growth of revenues from environmental levies was greater than the total NIT revenues because of which the share of ETR in NIT declined. A synopsis of this analysis, which also includes explanations through changes in the policies of respective governments and tax rates, can be found in Table 7.
Analysing the Pattern of Environmental Levy Revenues in the Non-Annex I Country Revenues
Data on the financial costs associated with environmentally related subsidies and environmental tax expenditure are available only for a very few parts of the various subsidy schemes adopted by the Annex II countries. This restricts any analysis for these fiscal instruments. Except for Iceland and Denmark, data are unavailable for more than 80 per cent of such instruments. Iceland is an exception because it has only two such levies, so there is no difficulty in obtaining the data. Denmark is the only country which has continuous time series data for 90 per cent of its total fiscal instruments. This highlights the lacuna in the OECD/EEA database in providing details on the financial costs of such fiscal instruments. The condition for non-OECD countries is even worse, because the financial costs of environmentally related subsidies and tax expenditure were available only for two countries, that is, India and China, and these too were incomplete.
Conclusion
In this article, an attempt was made to track the status of EFIs so as to explore relative international experiences of ecotaxes in the context of India; and to examine India’s specificities in these taxes in a wider perspective of other fiscal measures. This was carried out by reviewing environmental levies and their revenues across 15 countries that were categorised into Annex-II and Non-Annex-I groups based upon the UNFCCC classification. The EFIs were categorised into three groups: environmental taxes/charges, environmental subsidies and tax expenditure. Although, it is clear that ecotaxes have a dominant advantage over the other two in terms of generation of revenue as a by-product, subsidies and tax expenditure are also being used along with ecotaxes to enhance the environmental gains from ecotaxes. This is because both EFIs work in tandem, as one dis-incentivises polluting behaviour and other incentivises positive environmental behaviour. Thus, ecotaxes can be understood as an indispensable initial and economically viable step for environmental preservation through the use of EFIs. Further, there were issues pertaining to categorisation as certain levies could not be classified under any of the four categories mentioned by Eurostat (2001). There are certain levies which are prevalent in India but were not classified by the database like the forest development tax, the Sikkim ecological fund, etc. (Verma, 2016).
The analysis further showed that the most common taxes in the Annex II countries are in the form of energy taxes, followed by transport taxes. For India, energy and transport taxes could prove to be vital types of ecotaxes as the country has committed to reducing its emissions intensity by 33–35 per cent by 2030 (Government of India, 2015). These forms of taxes have proven to depict positive impacts in several European countries, such as Finland, Norway and Denmark, by way of observed reductions in CO2 emissions in these countries in the range of 7 per cent to 23 per cent (refer Table 1). Pollution taxes would be difficult to levy in the Indian context, which is also the case for the other Annex-II countries, given the technological and administrative requirements for such taxes. Resource taxes, on the other hand, would be an important class of ecotaxes that would be required because of severe environmental problems associated with mining and related activities in India (MoEF, 2009). In this regard, India could take lessons from the United States of America on levying ecotaxes on mining; however, there is not much literature on the effectiveness of this type of tax. Both subsidies and tax expenditure are prevalent across the Annex-II countries in various forms such as grants, soft loans, tax reductions and others. Some examples of these are subsidies for conserving bio-diversity, forests and water; soft loans for green initiatives, etc.
The financial cost of the EFIs could not be ascertained due to the paucity of data, nevertheless it is very important for countries using such instruments to track revenue losses from implementing uninformed policy decisions. The analysis of the revenue generated from the levy of environmental taxes/charges showed that it accounted for a substantial part of the total tax revenue for all the Annex II countries. It hovered between 5 per cent and 10 per cent of their respective total tax revenue and between 2 per cent and 4 per cent of their GDP, except for Canada and the United States of America. On the other hand, Non-Annex I nations’ ETR-to-GDP ratios ranged only between 0 and 1 per cent of their GDP and between 1 and 10 per cent of their total NIT revenue. This share, when compared with Annex-II countries, is low for Non-Annex I countries and could possibly be because of the relatively recent origin of these taxes in these countries (Verma, 2016).