
Abstract
The study investigates the macroeconomic effects of public debt in India during 1980–2017 using a structural vector autoregression framework. The objective is to examine the impact of public debt on the interest rate, investment, inflation and economic growth in India. The results of the impulse response functions show that public debt has an adverse impact on economic growth but a positive impact on the long-term interest rate in the short run and a mixed effect (both negative and positive) on investment and inflation. We also find that domestic debt has a more adverse impact on the economy than external debt. The estimated variance decomposition analysis finds that much of the variation in selected macro variables are explained by public debt and growth in India. This study suggests that public debt especially domestic debt should be controlled and channelled productively to have a favourable impact on the economy.
JEL Classification: H63, O40, C40
Introduction
The management of public debt is a global challenge faced by governments of many developing and developed countries. The macroeconomic effects of public debt have long been a debated issue in the literature. India has faced persistently high levels of the public debt-to-GDP ratio over the past decades, far higher than the various Finance Commissions’ long-term debt-to-GDP targets (of below 60%). 1 This rising trend has generally been accompanied by an expansion in the size of governments. Domestic public debt has become an important means for the government to mobilize financial resources to meet growing expenditure needs. In India, domestic debt makes up nearly 95 per cent of the aggregate public debt, while external debt constitutes a small share of total public debt. The accumulation of public debt might result in higher policy uncertainties and affect economic growth through its impacts on various macro variables such as the interest rate, inflation and investment in an economy. India has also been trying to adopt the fiscal consolidation path prescribed in its Fiscal Responsibility and Budget Management (FRBM) Act, 2003, and the recommendation of the FRBM review committee in 2017. In this context, this study addresses the following crucial questions: Does public debt affect growth in the Indian economy? Does public debt enhance or reduce gross investment in India? Has public debt had any impact on interest rates in India? Is there any relationship between public debt and inflation in India?
The burden of public debt depends on how the funds, mobilized through public debt, are used. If public debt is wasted on relatively unproductive activities (like financing current expenditure), it becomes a dead weight due to its adverse effect on capital accumulation, as well as productivity, and hence reduces economic growth. On the other hand, if resources raised by the government through borrowings are spent on developmental activities such as capital formation, they raise the productive capacity of the country and are thus not burdensome. 2 An important channel through which the accumulation of public debt can affect economic growth is that of long-term interest rates. Higher long-term interest rates, resulting from more debt-financed government budget deficits, can crowds out private investment, thus dampening potential output growth. A large public debt might create debt overhang, a situation in which investment is reduced or postponed since the private sector anticipates that the returns from their investment will serve to pay back creditors (Krugman, 1988).
The voluminous theoretical and empirical literature on this subject have predominantly studied the impact of public debt on economic growth; some studies have find negative impact (Adofu & Abula, 2010; Cunningham, 1993; Geiger, 1990; Panizza & Presbitero, 2014) and a non-linear relationship (Checherita & Rother, 2010; Pattillo & Ricci, 2011) between debt and economic growth across developing and developed countries. Another strand of literature has focused on the sustainability of public debt (Afonso, 2005; Bohn, 1998; Buiter & Patel, 1992; Kaur & Mukherjee, 2012; Neck & Haber, 2012; Pradhan, 2016). Islam and Hasan (2007) empirically examined the effects of government debt on the interest rate, price, output and capital formation in the USA during the period between 1946 and 2000. They conclude that public debt increases inflation, with adverse effects on capital formation and real output. Much controversy surrounds the quantitative effects of government debt and deficits on long-term real interest rates. Laubach (2009) studied the impact of public debt and the deficit on the interest rate in the form of treasury yields and found a significant relationship between government debt and the interest rate. Fosu (1996) investigated the impact of external debt on growth and investment in sub-Saharan African countries over 1970–1986 and concluded that the burden of debt (measured as debt service or outstanding) is harmful to economic growth, and that debt has a weak effect on investment levels, and negatively affected productivity in sub-Saharan Africa.
The empirical literature on the impact of public debt on major macroeconomic variables in India is scarce. Earlier studies focused either on debt sustainability or the impact of debt on growth in India. With this motivation, this study empirically assesses the macroeconomic effects of public debt in India during 1980–2017, specifically on four major macro variables, that is, the interest rate, investment, inflation and economic growth. It thus contributes to the existing literature on debt and the Indian macroeconomy in several ways. First, it analyses the impacts of the combined central and state government public debt, and the central government’s public debt separately on selected macro variables. Second, it examines separately the effects of domestic debt and external debt of the respective governments because of the composition of public debt, the share of external debt, risk characteristics of public debt, etc., could play a crucial role in maintaining sustainability and stability in the economy. It is important to understand how different types of public debt affect the macroeconomy to help policymakers frame their debt-management policy. Third, it finds that in India, overall high public debt is a burden on the economy, while domestic debt has a more adverse influence on macro variables than external debt. The study uses the structural vector autoregression (SVAR) approach to gauge the dynamic linkages between public debt and other variables using the most recent data in the Indian economy.
The organization of the article is as follows: The trends in public debt are analysed in Section 2; Section 3 offers a brief review of the literature; the analytical framework of the study is discussed in Section 4, and the data sources and the methodology are provided in Section 5. The estimated empirical results are analysed in Section 6. Finally, the conclusions and policy implications are presented in Section 7.
Trends in Public Debt in India
Figure 1 displays trends in the public debt of the central government and combined public debt of the central and state governments 3 in India from FY 1980–1981 to 2017–2018. Total public debt can be classified into internal/domestic debt and external debt. The total public debt of the central government as a percentage of GDP has gone up from 45 per cent in FY 1980–1981 to more than 53 per cent in FY 2017–2018 (Figure 1). The average central government’s total public debt as a percentage of GDP in the 1980s, 1990s, 2000s and 2010–2017 was 56.27 per cent, 64.36 per cent, 67.08 per cent and 55.26 per cent, respectively. It reached a maximum of 72.34 per cent in 2002–2003 and recorded a minimum of 45.26 per cent in 1980–1981. Similarly, the domestic debt of the central government as a percentage of GDP has increased from 35 per cent in 1980–1981 to more than 50 per cent in 2017–2018. It recorded a maximum of 65.07 per cent in 2004–2005 and minimum of 34.86 per cent in 1981–1982. The figure also shows that external debt 4 as a percentage of GDP has been decreasing from nearly 10 per cent in 1980–1981 to less than 3 per cent in recent years. The average external debt as a percentage of GDP was 12.19 per cent in 1980s, 13.47 per cent in 1990s, 6.49 per cent in 2000s and 3.38 per cent during 2010–2017. After the new economic policy introduction in 1991–1992, external debt has declined consistently.
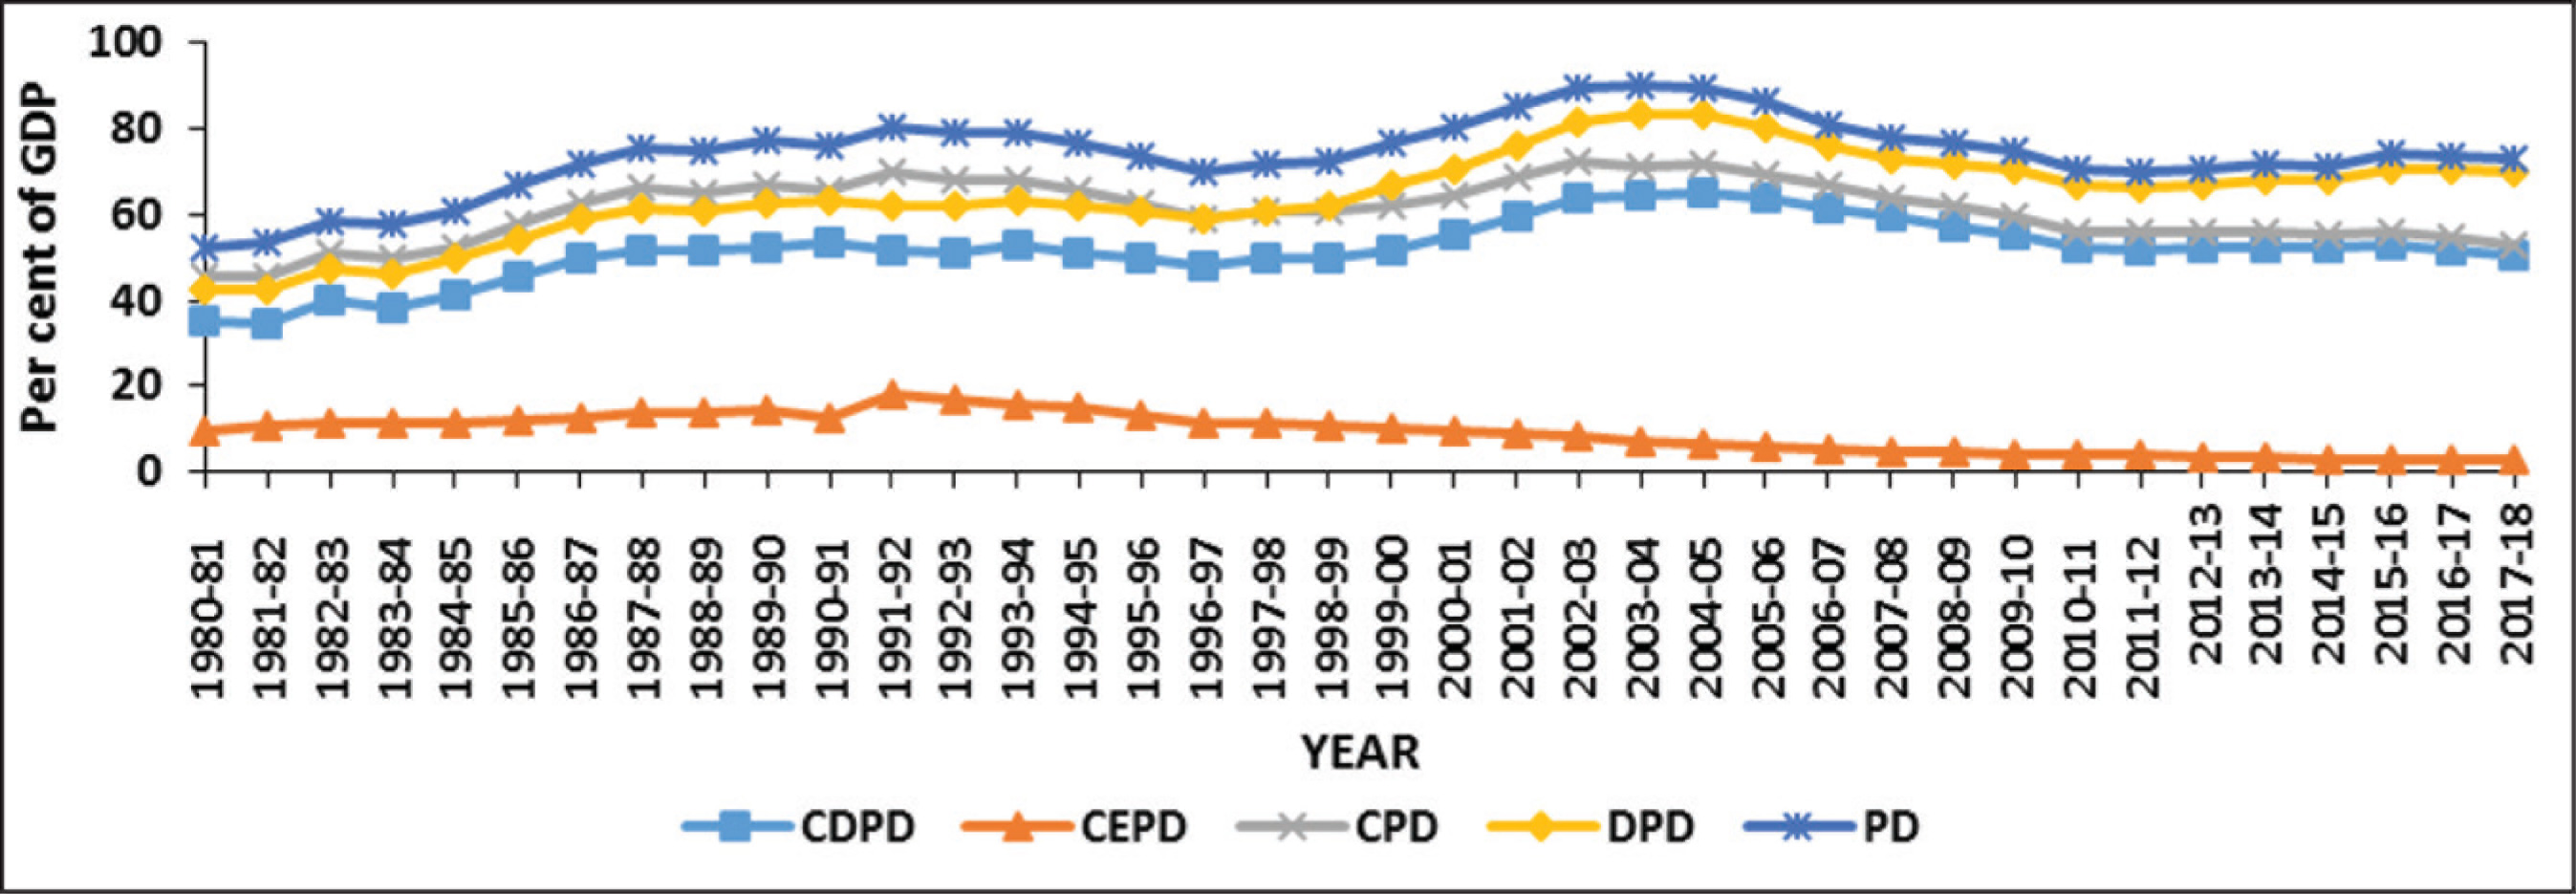
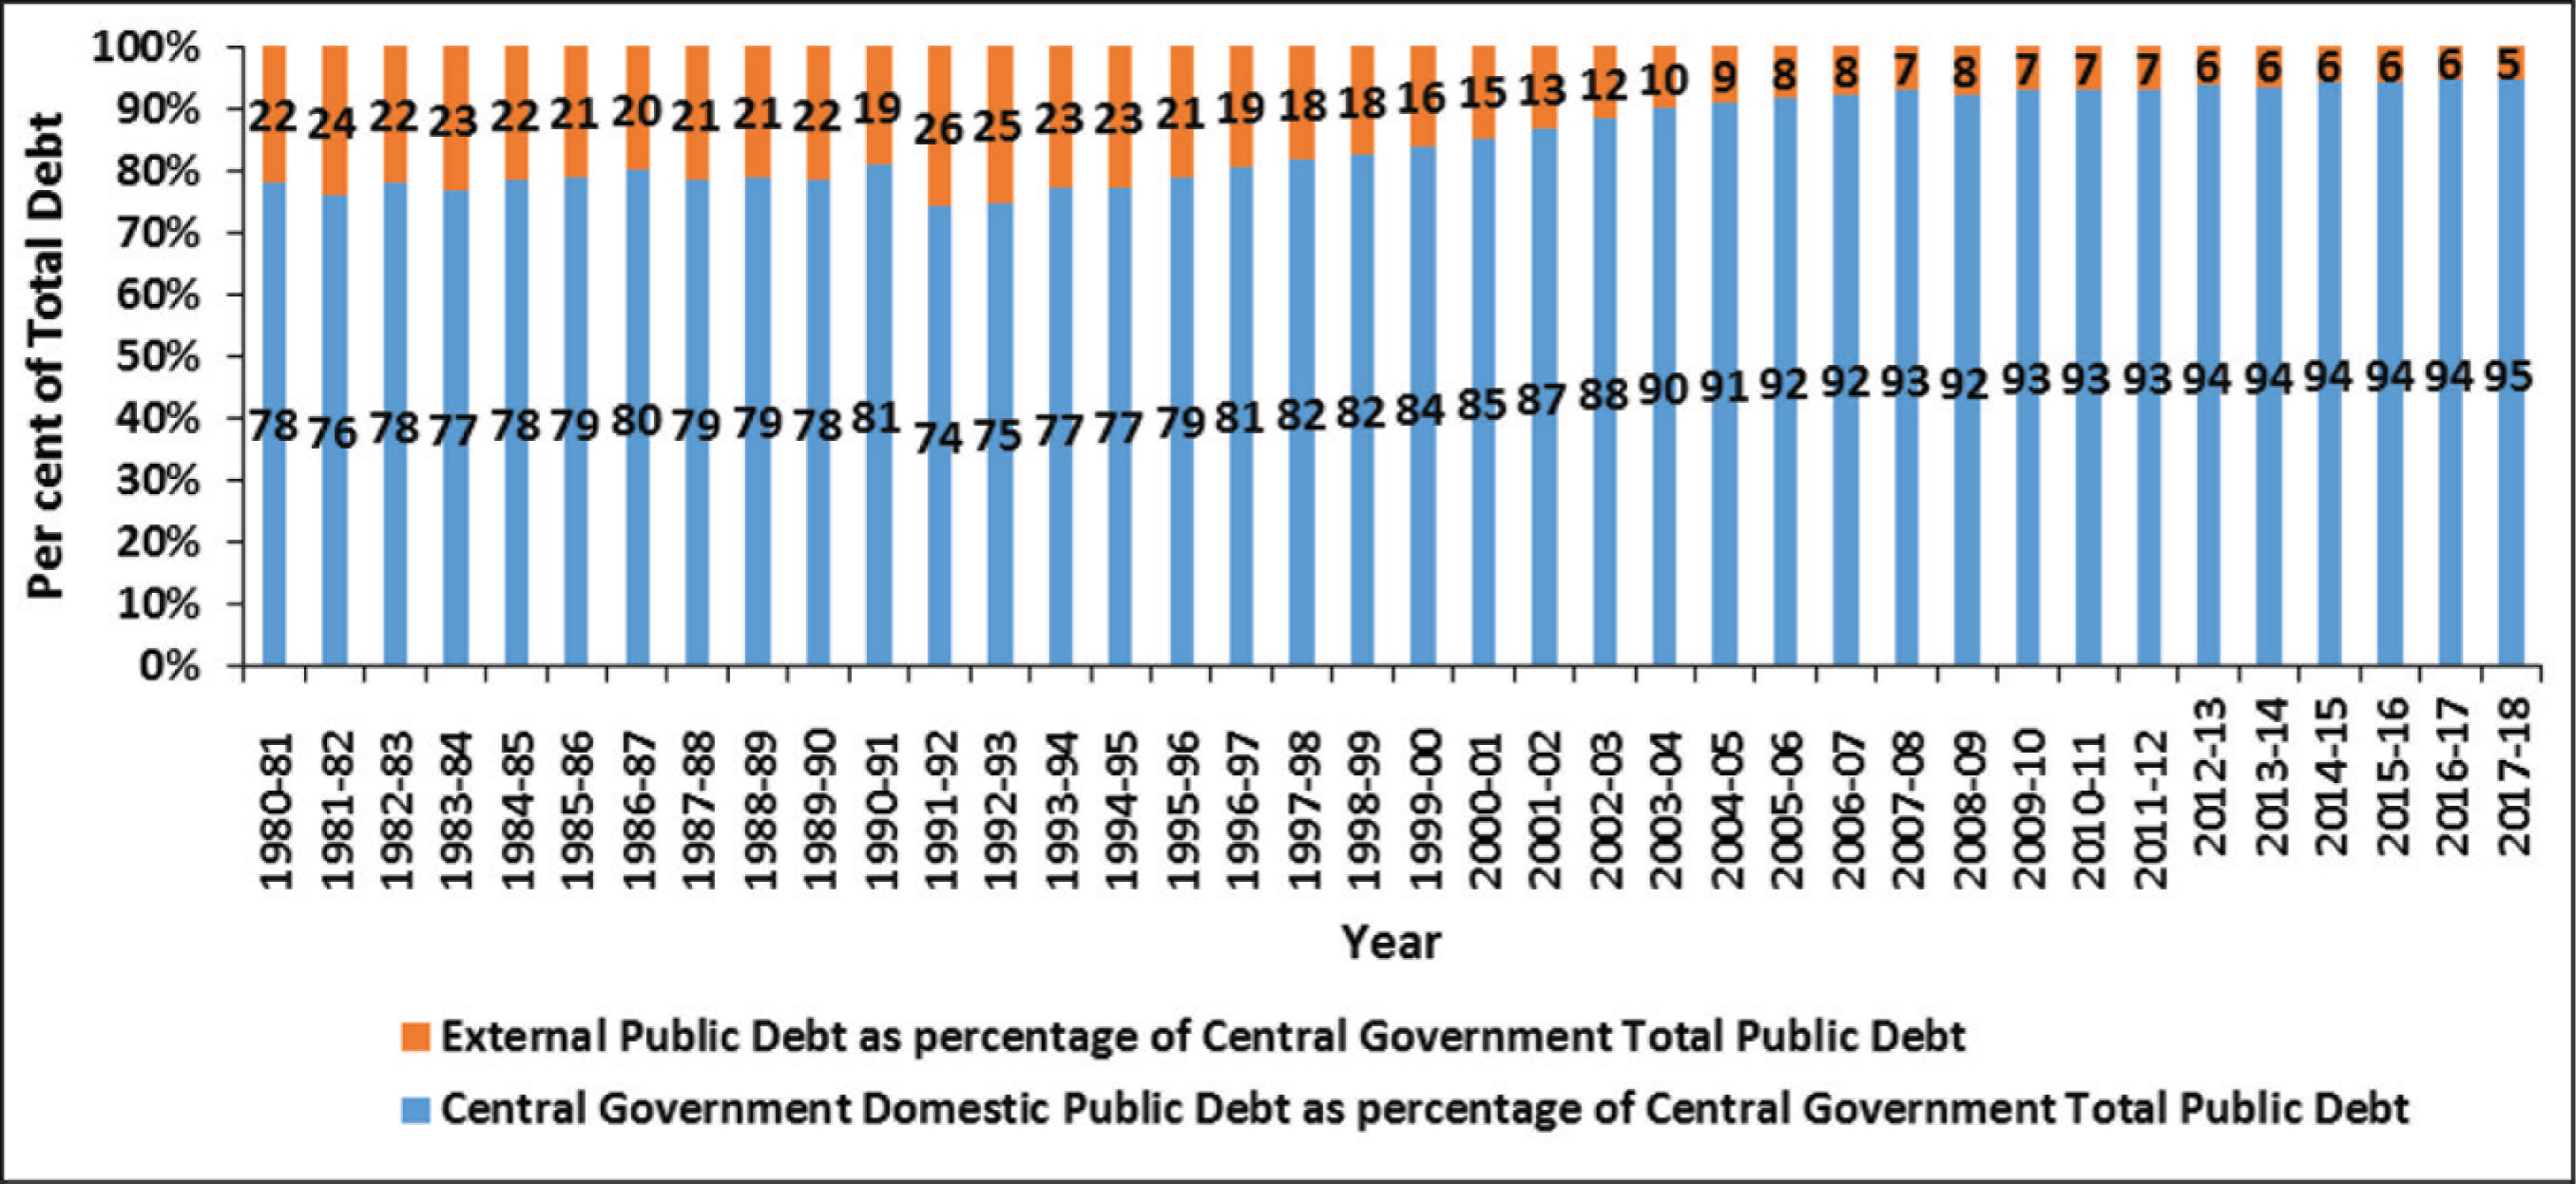
A similar trend is observed for the combined total public debt and combined domestic public debt in India from 1980–1981 to 2017–2018. The combined total public debt has shown an increasing trend from 1980–1981 to 1991–1992 due to fiscal stress and high primary deficits. The debt position was slightly improved from 1992–1993 to 1996–1997 because of the structural reforms undertaken in 1991–1992, but debt liabilities again accumulated sharply up to 2003–2004 due to an increase in expenditure linked to the Fifth Pay Commission award 5 and sluggish revenue growth during that period. Public debt has declined since 2003–2004 due to the adoption of a fiscal consolidation path by the enactment of the FRBM Act, 2003, as well as the high rate of nominal economic growth. The public debt-to-GDP ratio has stabilized in recent years. The slight increasing trend after 2012–2013 might be due to various domestic and global factors. The combined domestic debt follows a similar pattern over the same period. External debt constitutes only 5 per cent of the total public debt of the central government in recent years (Figure 2), as domestic debt constitutes the major part (nearly 95% in recent years) of total public debt in India. The share is almost similar in combined total public debt in India.
The above analysis shows that public debt in India has increased during the selected period. The government relies profoundly on domestic borrowing, as domestic debt constitutes a major part of total public debt and the share of external debt in total public debt has declined over time. Therefore, it would be very interesting to verify the macroeconomic impact of various types of public debt in India.
Ricardian equivalence theory postulates that today’s debt must be equal to the present value of future government surpluses, public debt has to be sustainable, is based on the inter-temporal budget constraint and the permanent income hypothesis. 6 The extant literature empirically verifies the sustainability of public debt in the context of both individual country and groups of countries (Afonso, 2005; Bohn, 1998; Fincke & Greiner, 2011; Mohan et al., 2005; Neck & Haber, 2012; Trehan & Walsh, 1988).
The extensive external debt burden created by structural problems in most economies results in difficulties in attaining rapid and sustainable growth and development. Karagol (2012) found a negative short-run impact of external debt service on economic growth and a unidirectional relationship between external debt service and economic growth in Turkey. In Indonesia, Muhdi and Sasaki (2009) showed that external debt had a positive effect on both investment and economic growth. Using a panel data of 93 developing countries, Pattillo and Ricci (2011) suggest that the average impact of external debt on economic growth turns negative at about 160–170 per cent of exports or 35–40 per cent of GDP.
The growth of public debt and economic growth are negatively related across countries in studies related to the Euro area (Checherita & Rother, 2010), OECD countries (Panizza & Presbitero, 2014), a panel of advanced and emerging economies (Cunningham, 1993; Woo & Kumar, 2015), Latin America (Geiger, 1990), Nigeria (Adofu & Abula, 2010) and Pakistan (Sheikh et al., 2010). Reinhart and Rogoff (2010) provided evidence of a negative link between public debt and growth by examining economic growth at different levels of government debt in a sample of 44 countries spanning about 200 years. They argued that growth slows down by about 1 percentage point when the debt-to-GDP ratio exceeds 90 per cent threshold. However, Herndon et al. (2014) replicated the same Reinhart and Rogoff (2010) study and found that GDP growth deteriorated even higher (2.2%) when countries crossed the threshold of 90 per cent of debt-to-GDP ratio.
In the case of India, Rangarajan and Srivastava (2005) indicated that large structural primary deficit and higher interest payment might be adversely affecting growth and suggested that the adverse effects of public debt on growth need to be brought down from the higher level. Singh (1999) supported the Ricardian equivalence hypothesis between domestic debt and growth in India using data from 1959–1995. Using Autoregressive Distributed Lag (ARDL) methods, Mohanty (2019) finds that fiscal deficit crowds out private corporate sector investment in India. Mohanty and Bhanumurthy (2020) find that government borrowing has a direct, though marginal, impact on interest rates in the short run, however, through the indirect channel, that is, inflation, it has a larger positive impact on interest rates in the long run. The sustainability of public debt in India is studied by addressing the issue of a regime shift, cointegration and other techniques, etc., (Goyal et al., 2004; Jha & Sharma, 2004; Kaur & Mukherjee, 2012; Pradhan, 2014, 2016). In the case of India, Bal (2014) examined the impact of public debt on the interest rate, output and gross fixed capital formation during 1998Q4–2012Q4. This study finds that public debt positively influences output and gross fixed capital formation as well. These present studies are limited and ambiguous, particularly, in the case of India. Therefore, it is interesting to study the impact of public debt on the Indian macroeconomy.
The Analytical Framework
Different theoretical arguments are discussed in the literature regarding the impacts of public debt on the economy. In a Keynesian approach, a rise in the public debt induced by a bond-financed fiscal policy will enhance the level of income, aggregate demand, investment and output in the economy. If the household sector perceives government bonds and securities as net wealth, this will increase private consumption expenditure, the transaction demand for money, the interest rate and prices because of an excess of aggregate demand oversupply in the short run. Further, it will enhance investment in the economy through the accelerator effect. Thus, overall, public debt has a favourable impact on the economy.
However, according to the classical or traditional view, an increase in public debt has an adverse impact on the economy based on the crowding-out effect: By possessing government bonds and securities, consumers consider themselves to be wealthier and therefore resort to higher spending. In the short run, higher consumer spending would raise the demand for goods and services and thus raise output and employment. The higher aggregate demand results in a higher price level in the short run. As the marginal propensity to consume is higher than the marginal propensity to save, the increase in private savings falls short of government dissaving, which increases the real interest rate in the economy. Then, the higher interest rate would discourage investment and thus ‘crowd-out’ private investment. An increase in the interest rate would also increase inflows from abroad, resulting in greater foreign debt. Lower domestic savings mean a smaller capital stock. The lower investment eventually leads to lower steady-state capital stock and a lower level of output. Therefore, public debt is considered a burden to the economy as the overall impact would be lower total output, eventually lower consumption, and reduced economic welfare in the long run (Meltzer, 1951; Modigliani, 1961).
The Ricardian equivalence theory argues that public debt has no real impact on the economy (Barro, 1974). Considering that consumers are rational and forward-looking and there is perfect capital mobility, the discounted sum of future taxes is equivalent to the current deficit. The rational consumer-facing current deficits save for a future rise in taxes and, consequently, total savings in the economy are not affected. A decrease in government dissaving is matched by an increase in private savings. So, the shift between taxes and deficits does not produce aggregate wealth effects. Thus, due to unchanged total savings, interest rates, investment and national income are also unaffected.
Leeper and Walker (2012) postulate that there are two regimes, namely ‘Regime M’ (active monetary policy/passive fiscal policy) and ‘Regime F’ (passive monetary/active fiscal policy). In Regime M, the inflation target is the main priority of monetary policy, which postulates that inflation is always and everywhere a monetary phenomenon. The role of fiscal policy is to support the active monetary policy by stabilizing the real debt (the debt-GDP ratio) through passively adjusting taxes in an economy. In Regime F, in contrast, monetary policy is tasked with maintaining the value of debt, and fiscal policy is assigned to control inflation. The fiscal authority is committed to its tax rule which determines the backing of the market value of government debt. Leeper (1991) defines that ‘active monetary policy targets inflation, while passive monetary policy weakly adjusts the nominal interest rate in response to inflation; an active tax policy sets taxes independently of government debt and a passive tax policy changes rates when debt rises to stabilize the debt-GDP ratio’. This study assumes an active fiscal policy (Regime F) in the analytical framework shown in Figure 3.
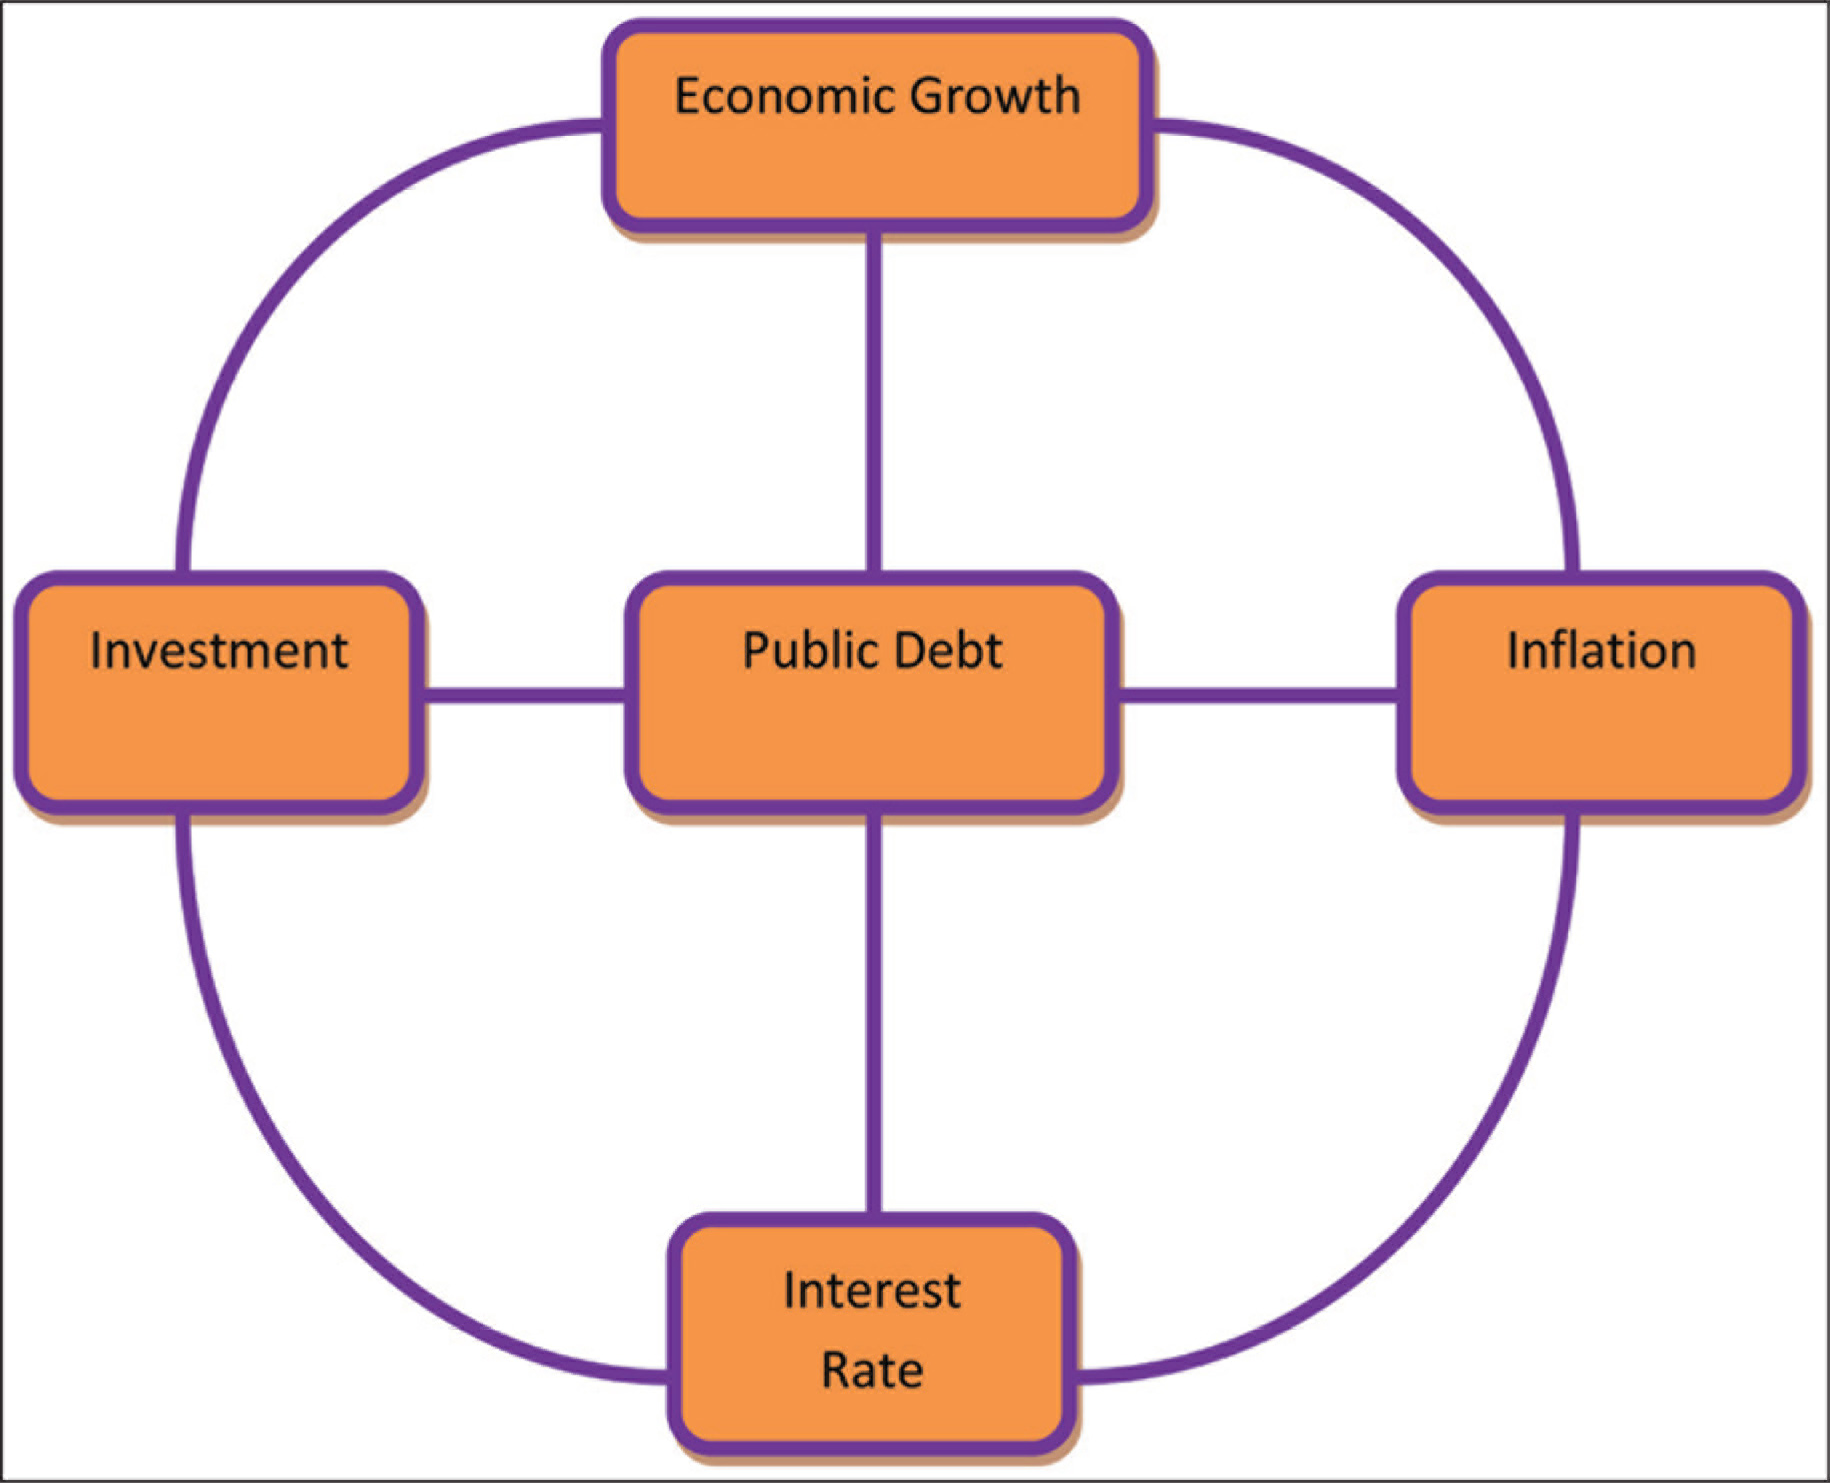
Following the above theoretical arguments, the impact of public debt on crucial macro variables can be explained in Figure 3. Fresh public debt requires the government to issue bonds and securities at interest rates that are attractive to investors. Ceteris paribus, the increased supply of bonds and securities may exert downward pressure on the prices of the government bonds and securities. Hence, it drives up interest rates, which would curtail any private investment that is not self-financed. Higher long-term interest rates, resulting from more debt-financed government budget deficits, can crowd-out private investment, thus dampening potential output growth. Similarly, excessive public borrowing may lead to a reduction of the supply of loanable funds from the banking system to the private sector in a developing economy. The public sector competes with the private sector for scarce physical and financial resources in these economies, which may lead to crowding-out of private sector investment in the economy, which adversely affects economic growth. High and rising public debt due to unsustainable fiscal policies might induce seigniorage financing which consequently affects inflation in an economy. The income and wealth effects of rising public debt lead to a rise in aggregate demand and inflation in the economy (Keynesian approach). However, all these macro variables are endogenous in nature. For example, a high-interest rate also promotes a rise in public debt, investment affects economic growth and vice-versa, and inflation influences growth, the interest rate, investment, etc. Due to the interrelationship among these variables, the study uses a VAR framework which treats each variable as endogenous in the system.
Where, yt = f(public debt, inflation, interest rate, economic growth and investment). The other notations are explained in the next section.
Data
The study uses an annual time series over the period, 1980–2017. The variables, namely GDP at factor cost, gross capital formation (GCF), total public debt of the centre, domestic public debt of the centre, external public debt of the centre, 7 combined total public debt of the centre and state governments, combined domestic public debt of the centre and states, the long-term interest rate and the inflation rate, are considered. Per capita GDP is taken as a proxy for economic growth and GCF as a percentage of GDP as a proxy for investment. All types of public debt are taken as a percentage of GDP. The growth rate of the GDP deflator is considered a proxy for the inflation rate. 8 Annual (gross) redemption yield of the long-term government of India securities (15 years and above) is used as a proxy for the rate of interest. 9 The real interest rate is calculated by subtracting the inflation rate from the nominal interest rate.
All the variables except the inflation and interest rates are converted to natural log. A detailed description of the variables is given in Table A1 and the summary statistics are presented in Table A2. Data are obtained from the RBI’s Handbook of Statistics on the Indian Economy.
Methodology
SVAR methodology is adopted to examine the dynamic relationship between public debt and key macro variables in India. The VAR approach was criticized as being devoid of any economic content and being theoretical in nature, which eventually led to the development of the SVAR model. The SVAR methodology can accommodate contemporaneous and dynamic relationships among macroeconomic variables, which is broadly consistent with the economic theory and stylized observed facts. It recovers the structural parameters from a reduced form of the VAR model. Hence, it helps in policy decisions by providing sensible solutions to various economic issues and problems.
The SVAR Model
The relationships between public debt, inflation, the interest rate, economic growth and investment are examined within an SVAR framework as follows:

Since the structural shocks in Equation 2 are unobservable, additional identifying restrictions are necessary to uncover the underlying structural shocks in the model. The main purpose of an SVAR estimation is to obtain non-recursive orthogonalization of the error terms for impulse response analysis. A five-variable VAR 10 model has been considered in order to extract the five structural shocks.
In matrix notation,
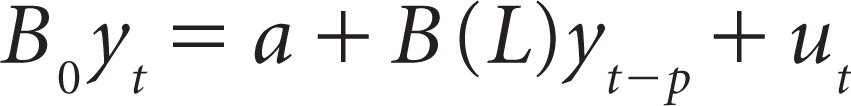
Where, yt is a 5×1 vector, a is a 5×1 vector of constants, ut is a 5×1 structural disturbances vector. Here, ut is serially and mutually uncorrelated, while p refers to the number of lags.
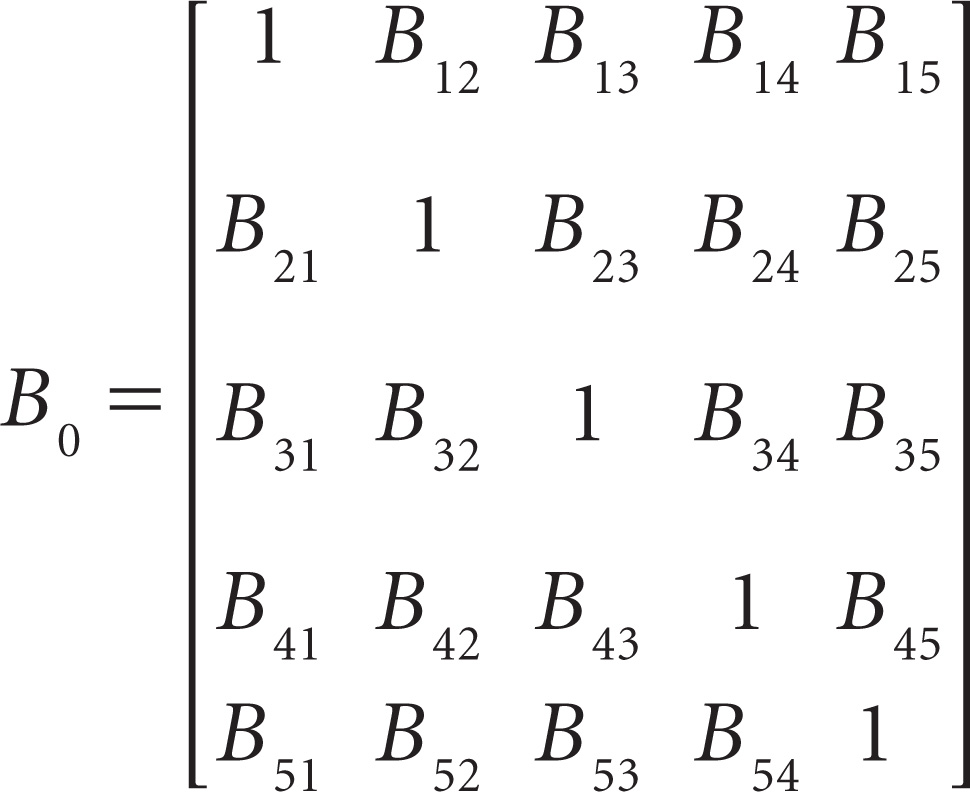
The matrix B0 is described as follows:
By pre-multiplying

Where
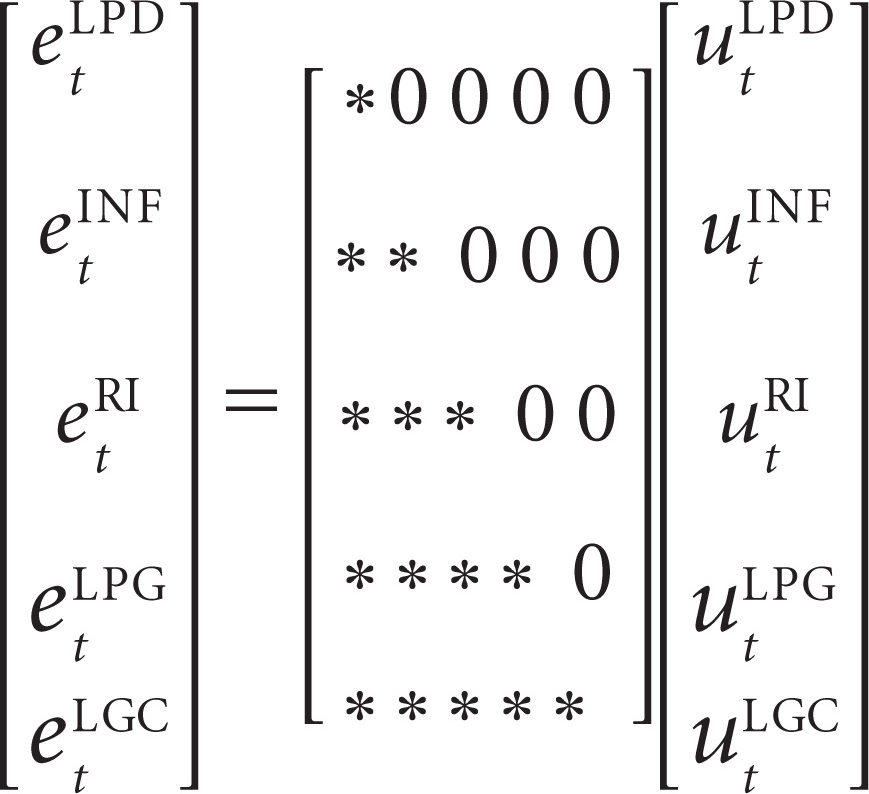
The following assumptions have been made regarding the structural shocks: Shocks to other variables in the system have no effect on the public debt (LPD). It is assumed to be a policy variable, which is appeared to be the most exogenous variable in the system. However, in a VAR framework, all the selected variables are endogenous in nature. Inflation (INF) is assumed to be affected by shocks to public debt and itself. Public debt implies the government injects more money into the economy, which leads to an increase in aggregate demand in the economy. Similarly, by possessing government securities, households feel wealthier which enhances their demand for goods and services. The higher aggregate demand results in a higher price level in the economy. The real interest rate (RI) is assumed to be affected by shocks to public debt, inflation and itself. As debt financing causes a supply of fresh government securities in the securities market. The increased supply of government securities (ceteris paribus) would put downward pressure on the prices of these government securities. Hence, it drives up domestic interest rates. A connection between inflation and interest rate is based on the Fisher effect. Growth is assumed to be affected by shocks to public debt, inflation, interest rate and itself. The relationship between public debt and growth is clearly discussed in the introduction. A moderate and stable inflation rate accelerates economic growth by enhancing investment, creating a favourable business environment, export competitiveness etc., while the persistence of high inflation rate may lead to uncertainty about the future profitability of investment projects. Thus, the borrowing requirements and public debt burden would induce interest rates on government securities, which may attract further capital inflows. Similarly, the interest rate might have an impact on growth through investment and inflation channel. It is assumed that shocks to public debt (crowding-out/-in), inflation, interest rate and growth are assumed to affect investment.
The system of equations derives by putting these restrictions can be specified as follows:


The imposed restrictions can be presented in a matrix form, that is,
Testing for Unit Roots
The first step in time series analysis is to check the stationary properties of the variables, through the Augmented Dickey–Fuller (ADF) and Phillips Perron (PP) tests. The null hypothesis of both the ADF and PP test states that the series is non-stationary (presence of a unit root or I(1)), while the alternative hypothesis implies that the series is stationary {I(0)}. If the absolute computed value exceeds the absolute critical value, then we reject the null hypothesis and conclude that the series is stationary and vice-versa. The results of the unit root tests for the selected variables are reported in Table A4. All the variables, except the interest rate, are non-stationary in their levels and become stationary when they are first differenced showing that the selected interest rate is stationary at level. Both the ADF test and the PP test produces similar results for the selected variables. Thus, the results of unit root tests confirm that the selected variables are a mix of both I(0) and I(1).
ARDL Bounds Test
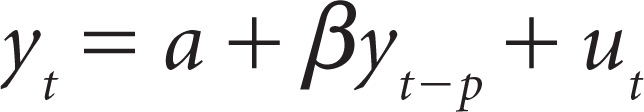
After testing the unit roots, we need to understand if there is any cointegration relationship among the selected variables. As the selected variables are of the mixed order of integration, that is, I(0) and I(1), the study applies the ARDL bounds testing approach to test the long-run relationship among the selected variables. The bounds test imposes a linear restriction on the coefficient of the one-period lagged level of variables. The null and alternative hypotheses are as follows:
Where, bi is the coefficient of the one-period lagged level of variables of the chosen models.
The computed F-test will be compared with the critical tabulated values given by Pesaran et al. (2001). Here, according to Pesaran et al. (2001), the lower-bound and upper-bound critical values assume that the explanatory variables are integrated to the order of zero {I(0)} and the order of one {I(1)}, respectively. If the estimated F-values are smaller than the lower-bound critical value, then the null hypothesis of no long-run relationship is accepted, whereas if the estimated F-statistic is higher than the upper-bound critical value, then the alternative hypothesis of a long-run relationship is accepted. However, if the estimated F-statistic falls in between the lower and upper-bound critical values, then the result is inconclusive. The computed results are reported in Table A5.
The results indicate that the calculated F-statistics of all the selected models are smaller than the upper-bound critical values found by Pesaran et al. (2001) at the 5 per cent level. Hence, the null hypothesis of no long-run relationship between the variables is not rejected at the 5 per cent significance level, so it may be concluded that there is no long-run relationship between these variables. In the next section, the short-run dynamics among the variables are estimated using the SVAR framework.
Impulse Response Functions
The ARDL bounds test showed that there is no long-run relationship between these variables. The SVAR approach is then applied to examine the short-run dynamics among the variables. The estimated results of the impulse response functions (IRFs) and the forecasted error variance decompositions are presented over 12-period horizons. The IRFs trace over time the effects of structural shocks on the endogenous variables. Following the AIC, SC and HQ criteria, we choose an optimum of lag one for all the selected models.
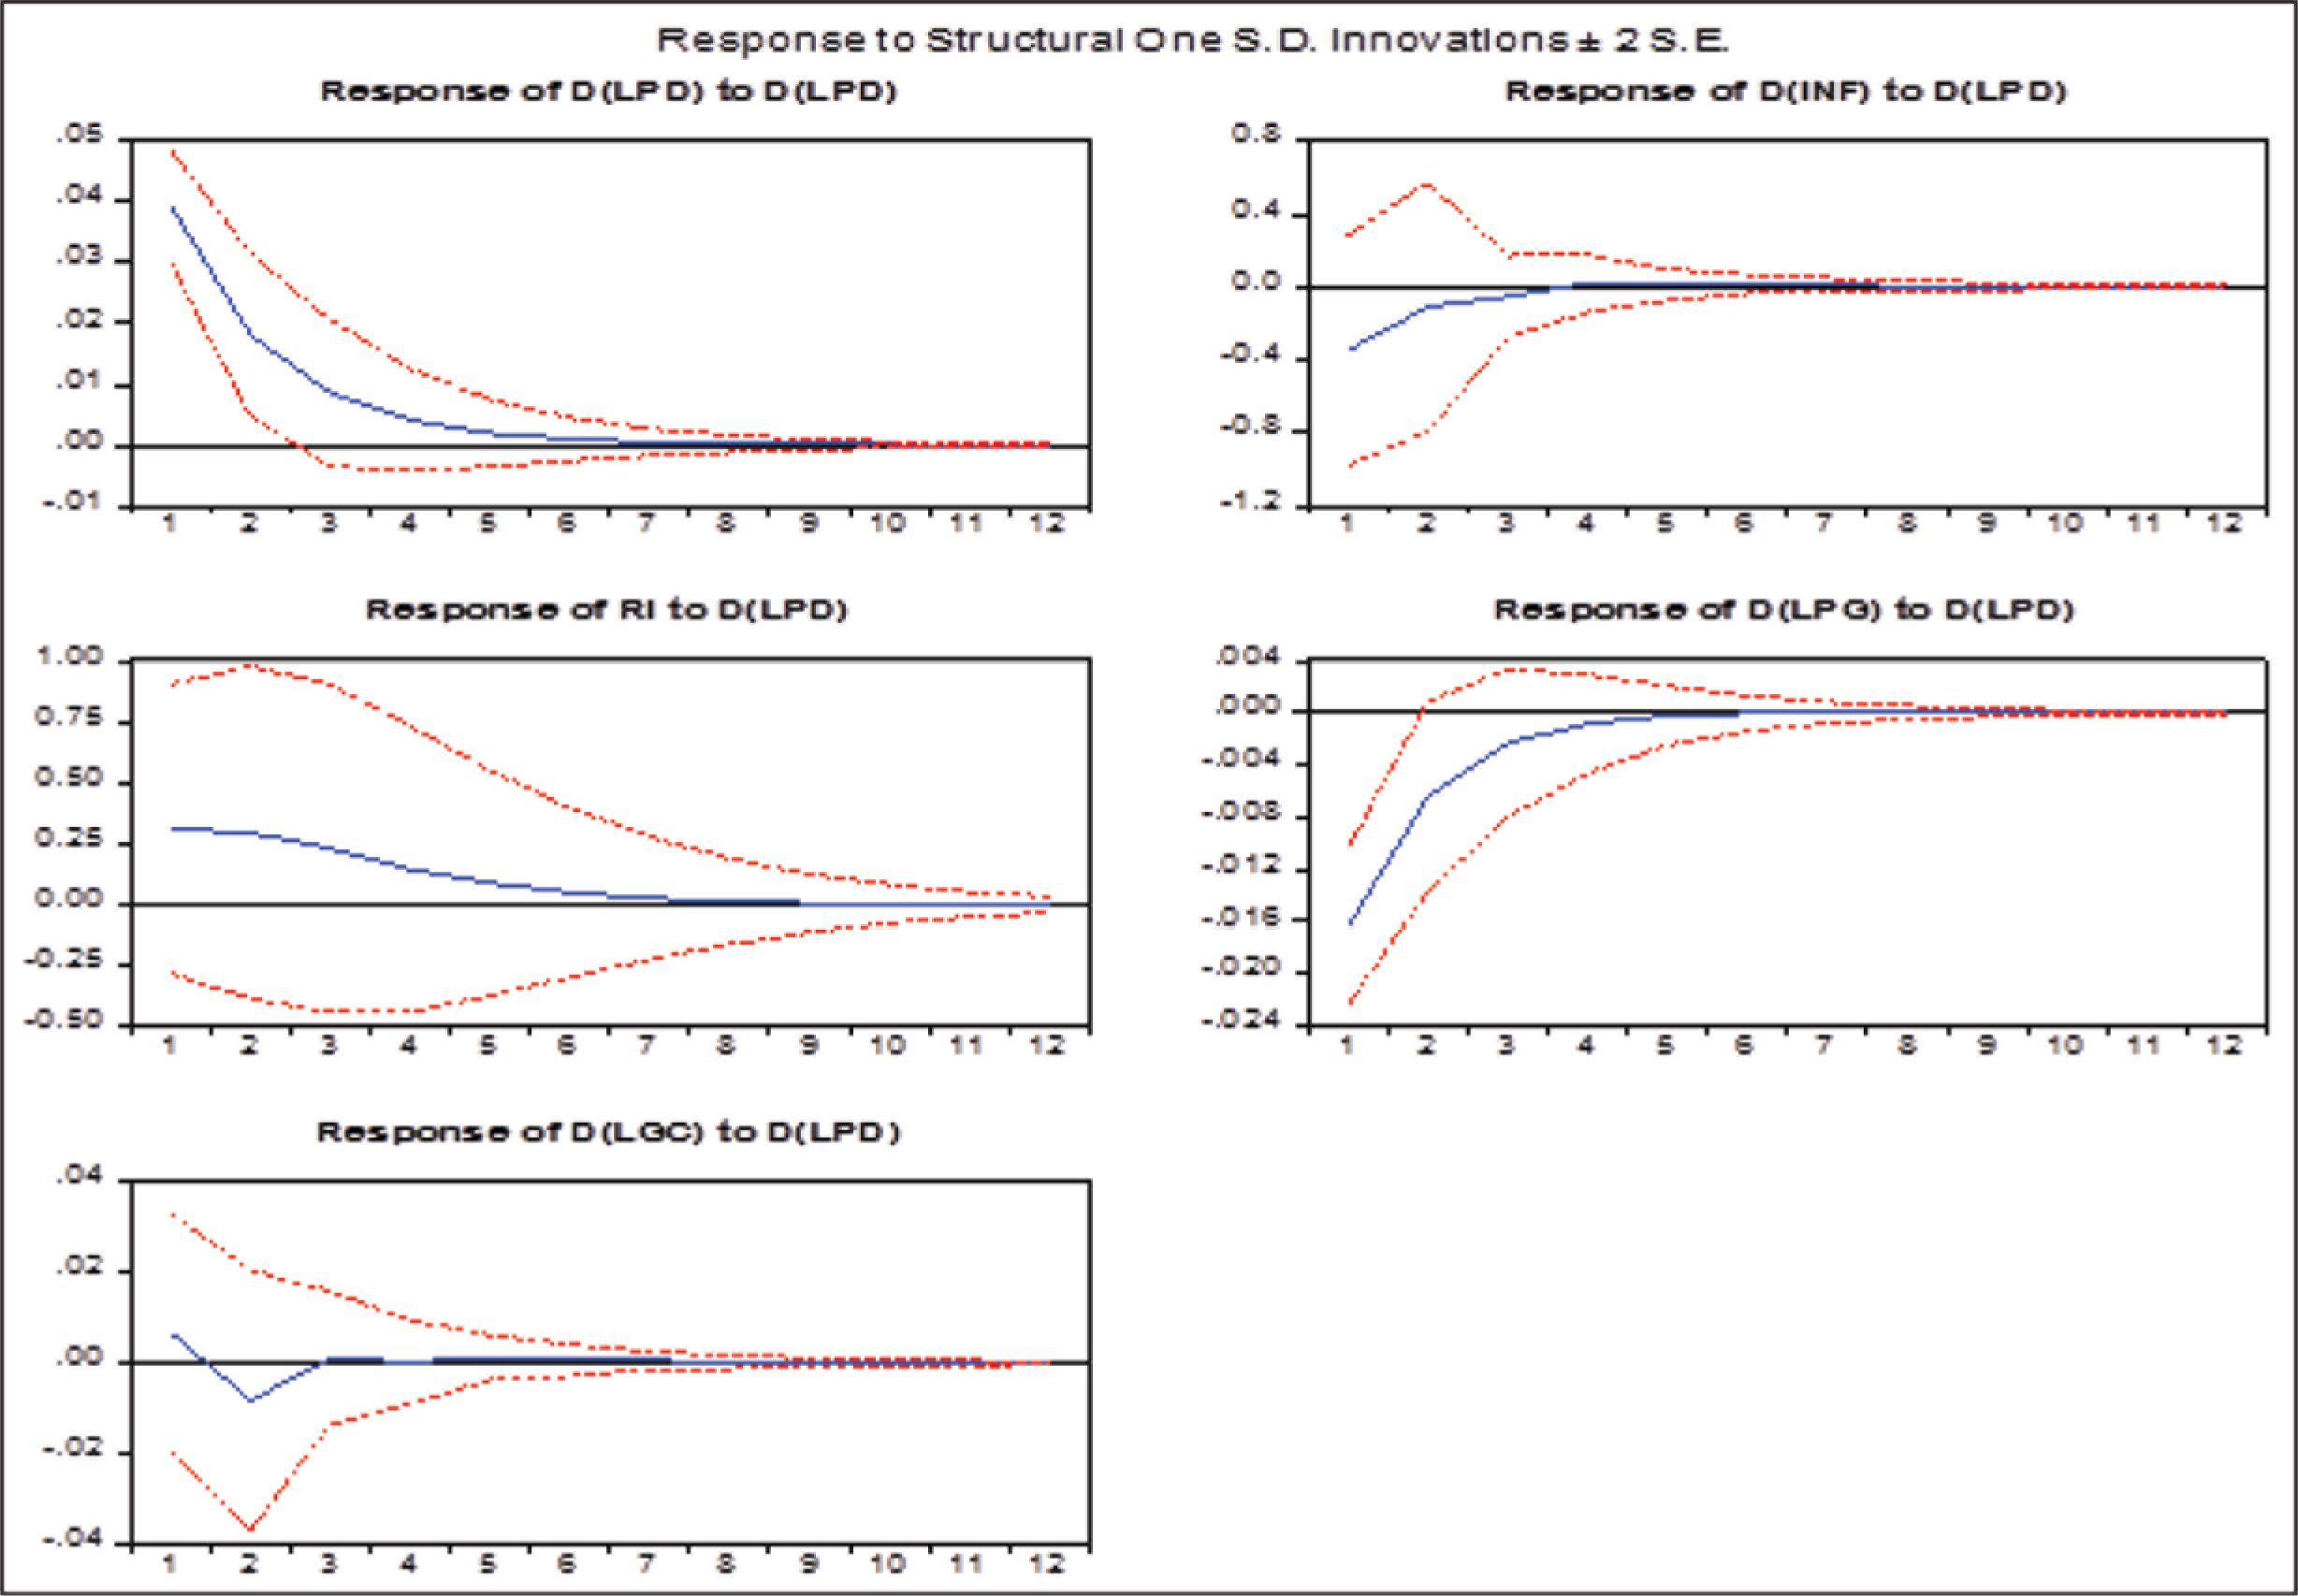
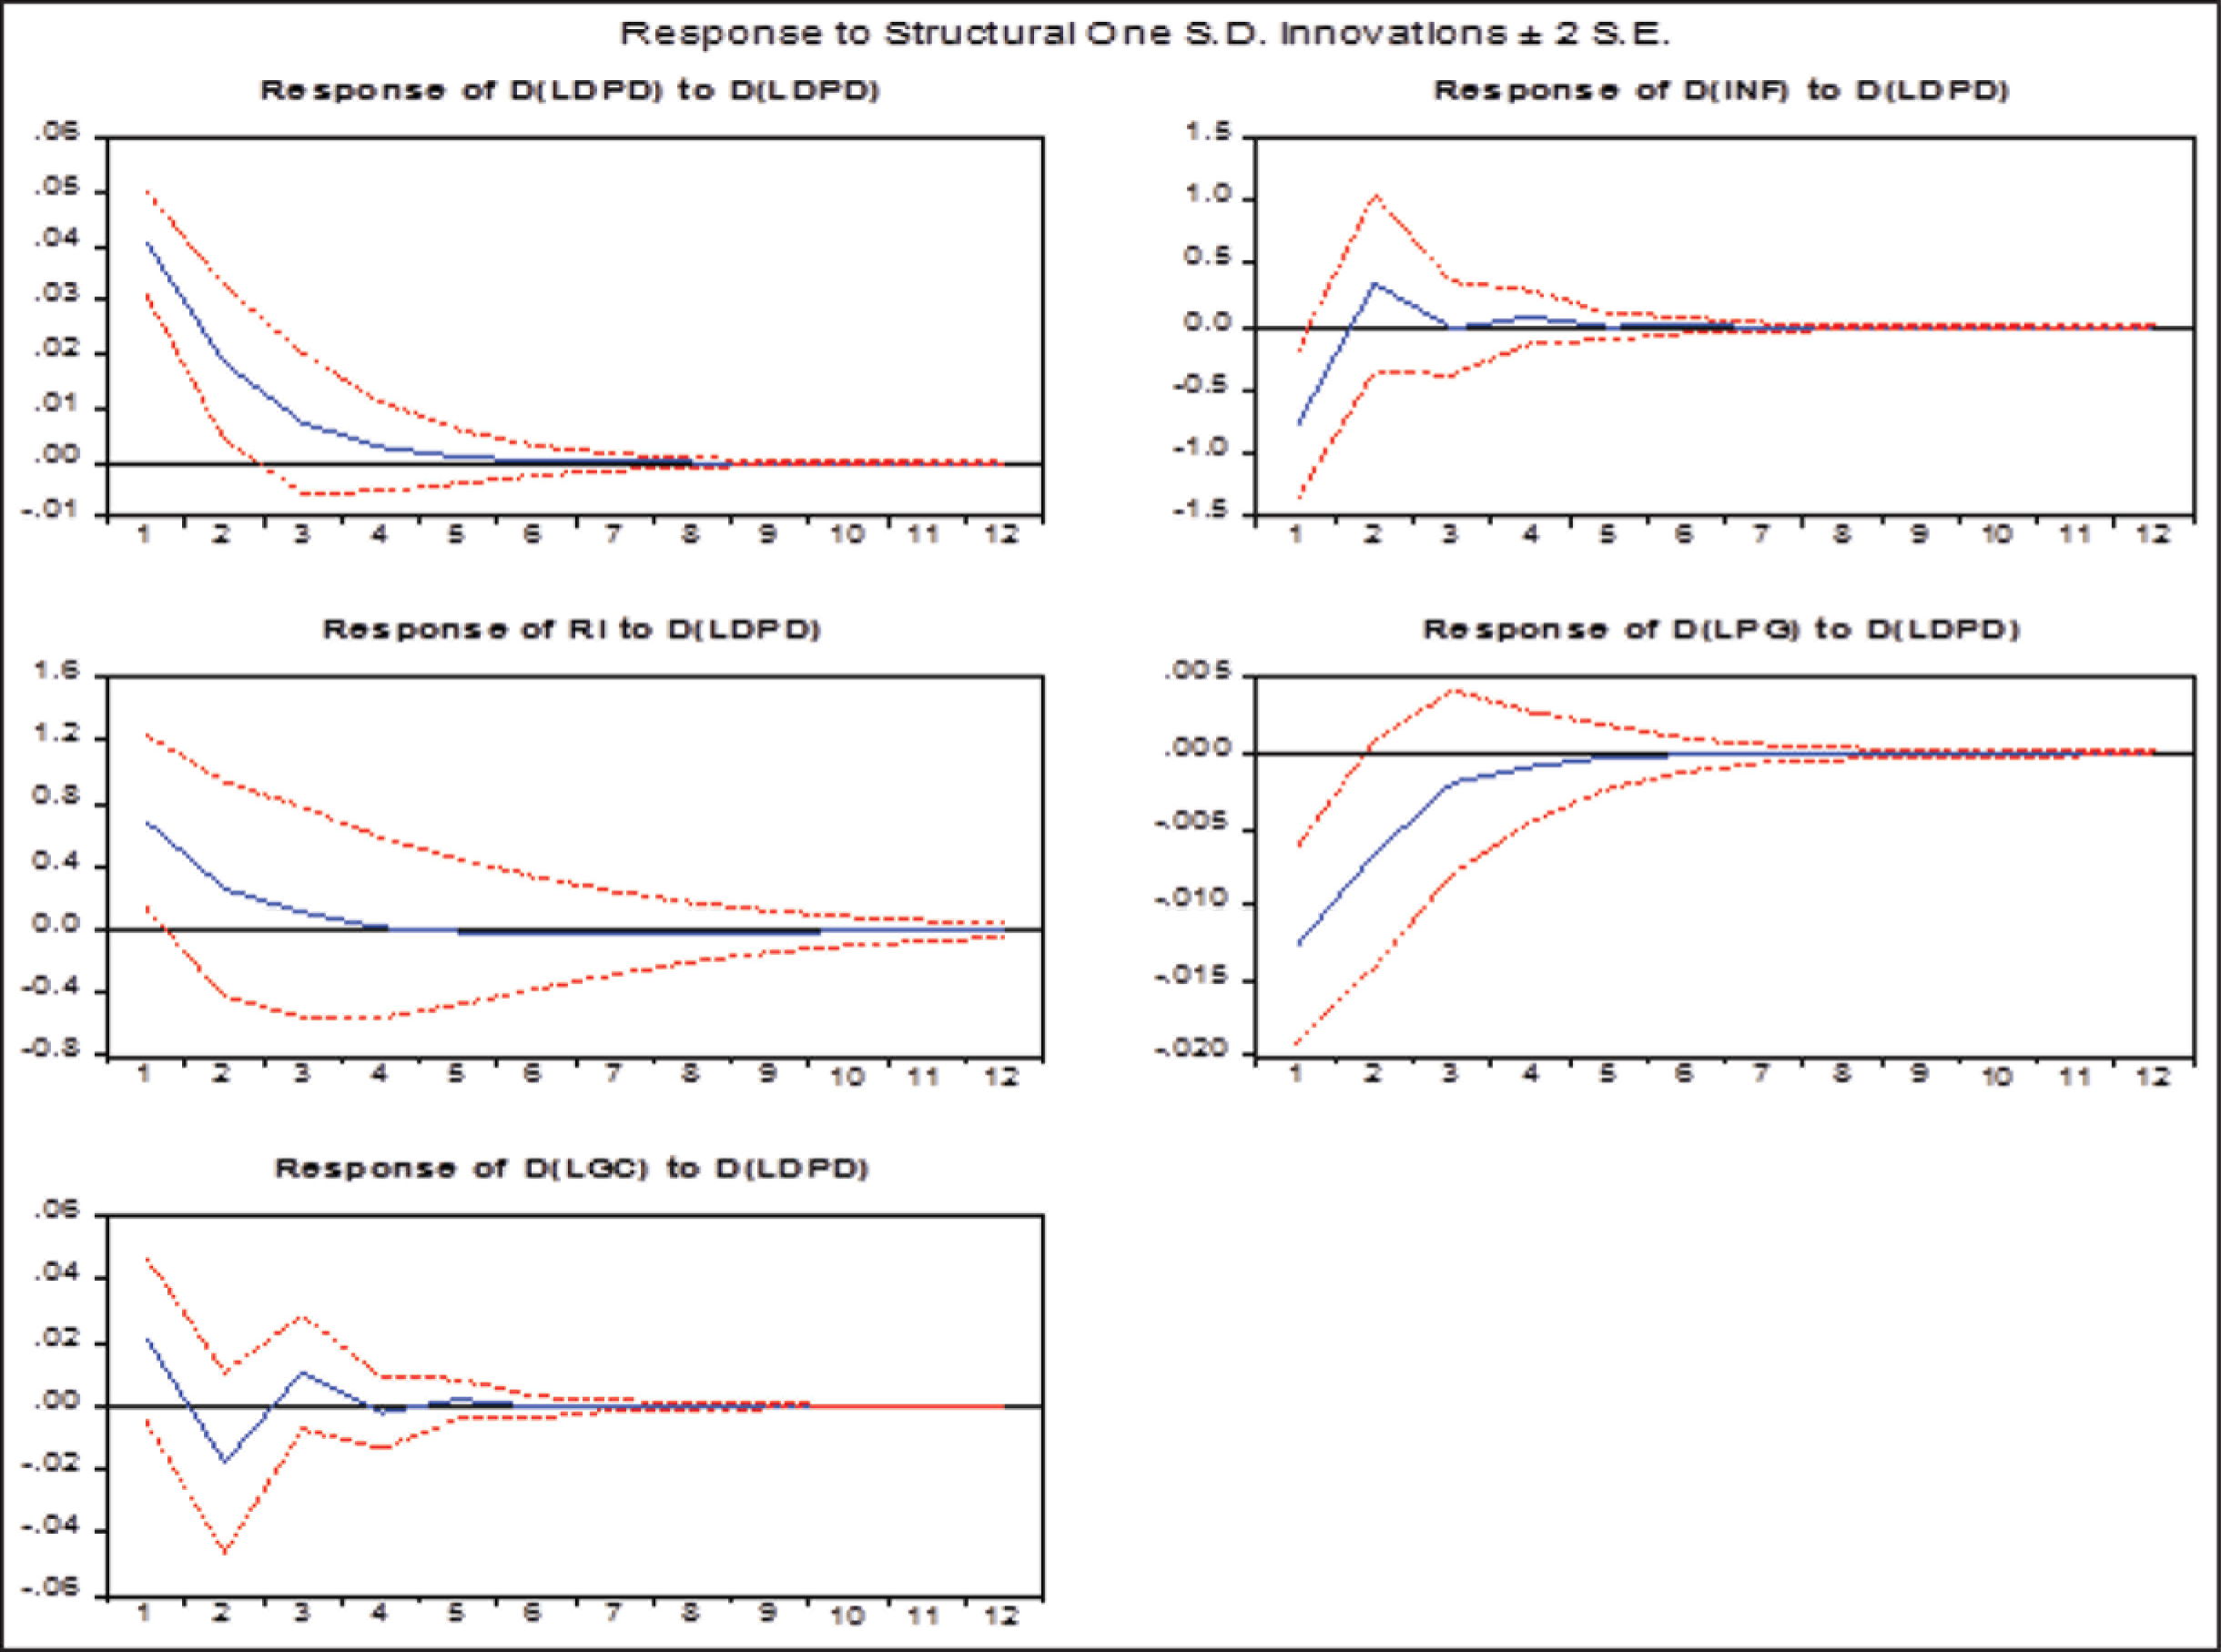
Figures 4 and 5 show the impulse responses of the selected variables when one standard deviation shock is given to the combined government total public debt (LPD) and combined government domestic debt (LDPD), respectively. The results (Figure 4) show that a shock to the total debt of the centre and states has a negative effect on growth and inflation and a positive effect on the real interest rate and itself. However, it has a mixed effect on investment, that is, it is both positive and negative in successive periods. A one standard deviation shock to the domestic debt of the centre and states also has almost similar effects on the selected variables (Figure 5). The reactions of economic growth to both the total and domestic debts of the centre and states’ shocks are negative, but after a five/six-year period, the effects die away. The shocks to both these public debts have a positive impact on the real interest rate. Public debt has a negligible impact on inflation and investment in the longer horizon. Thus, the results confirm that public debt has an adverse impact on economic growth and raises the interest rate in the Indian economy.
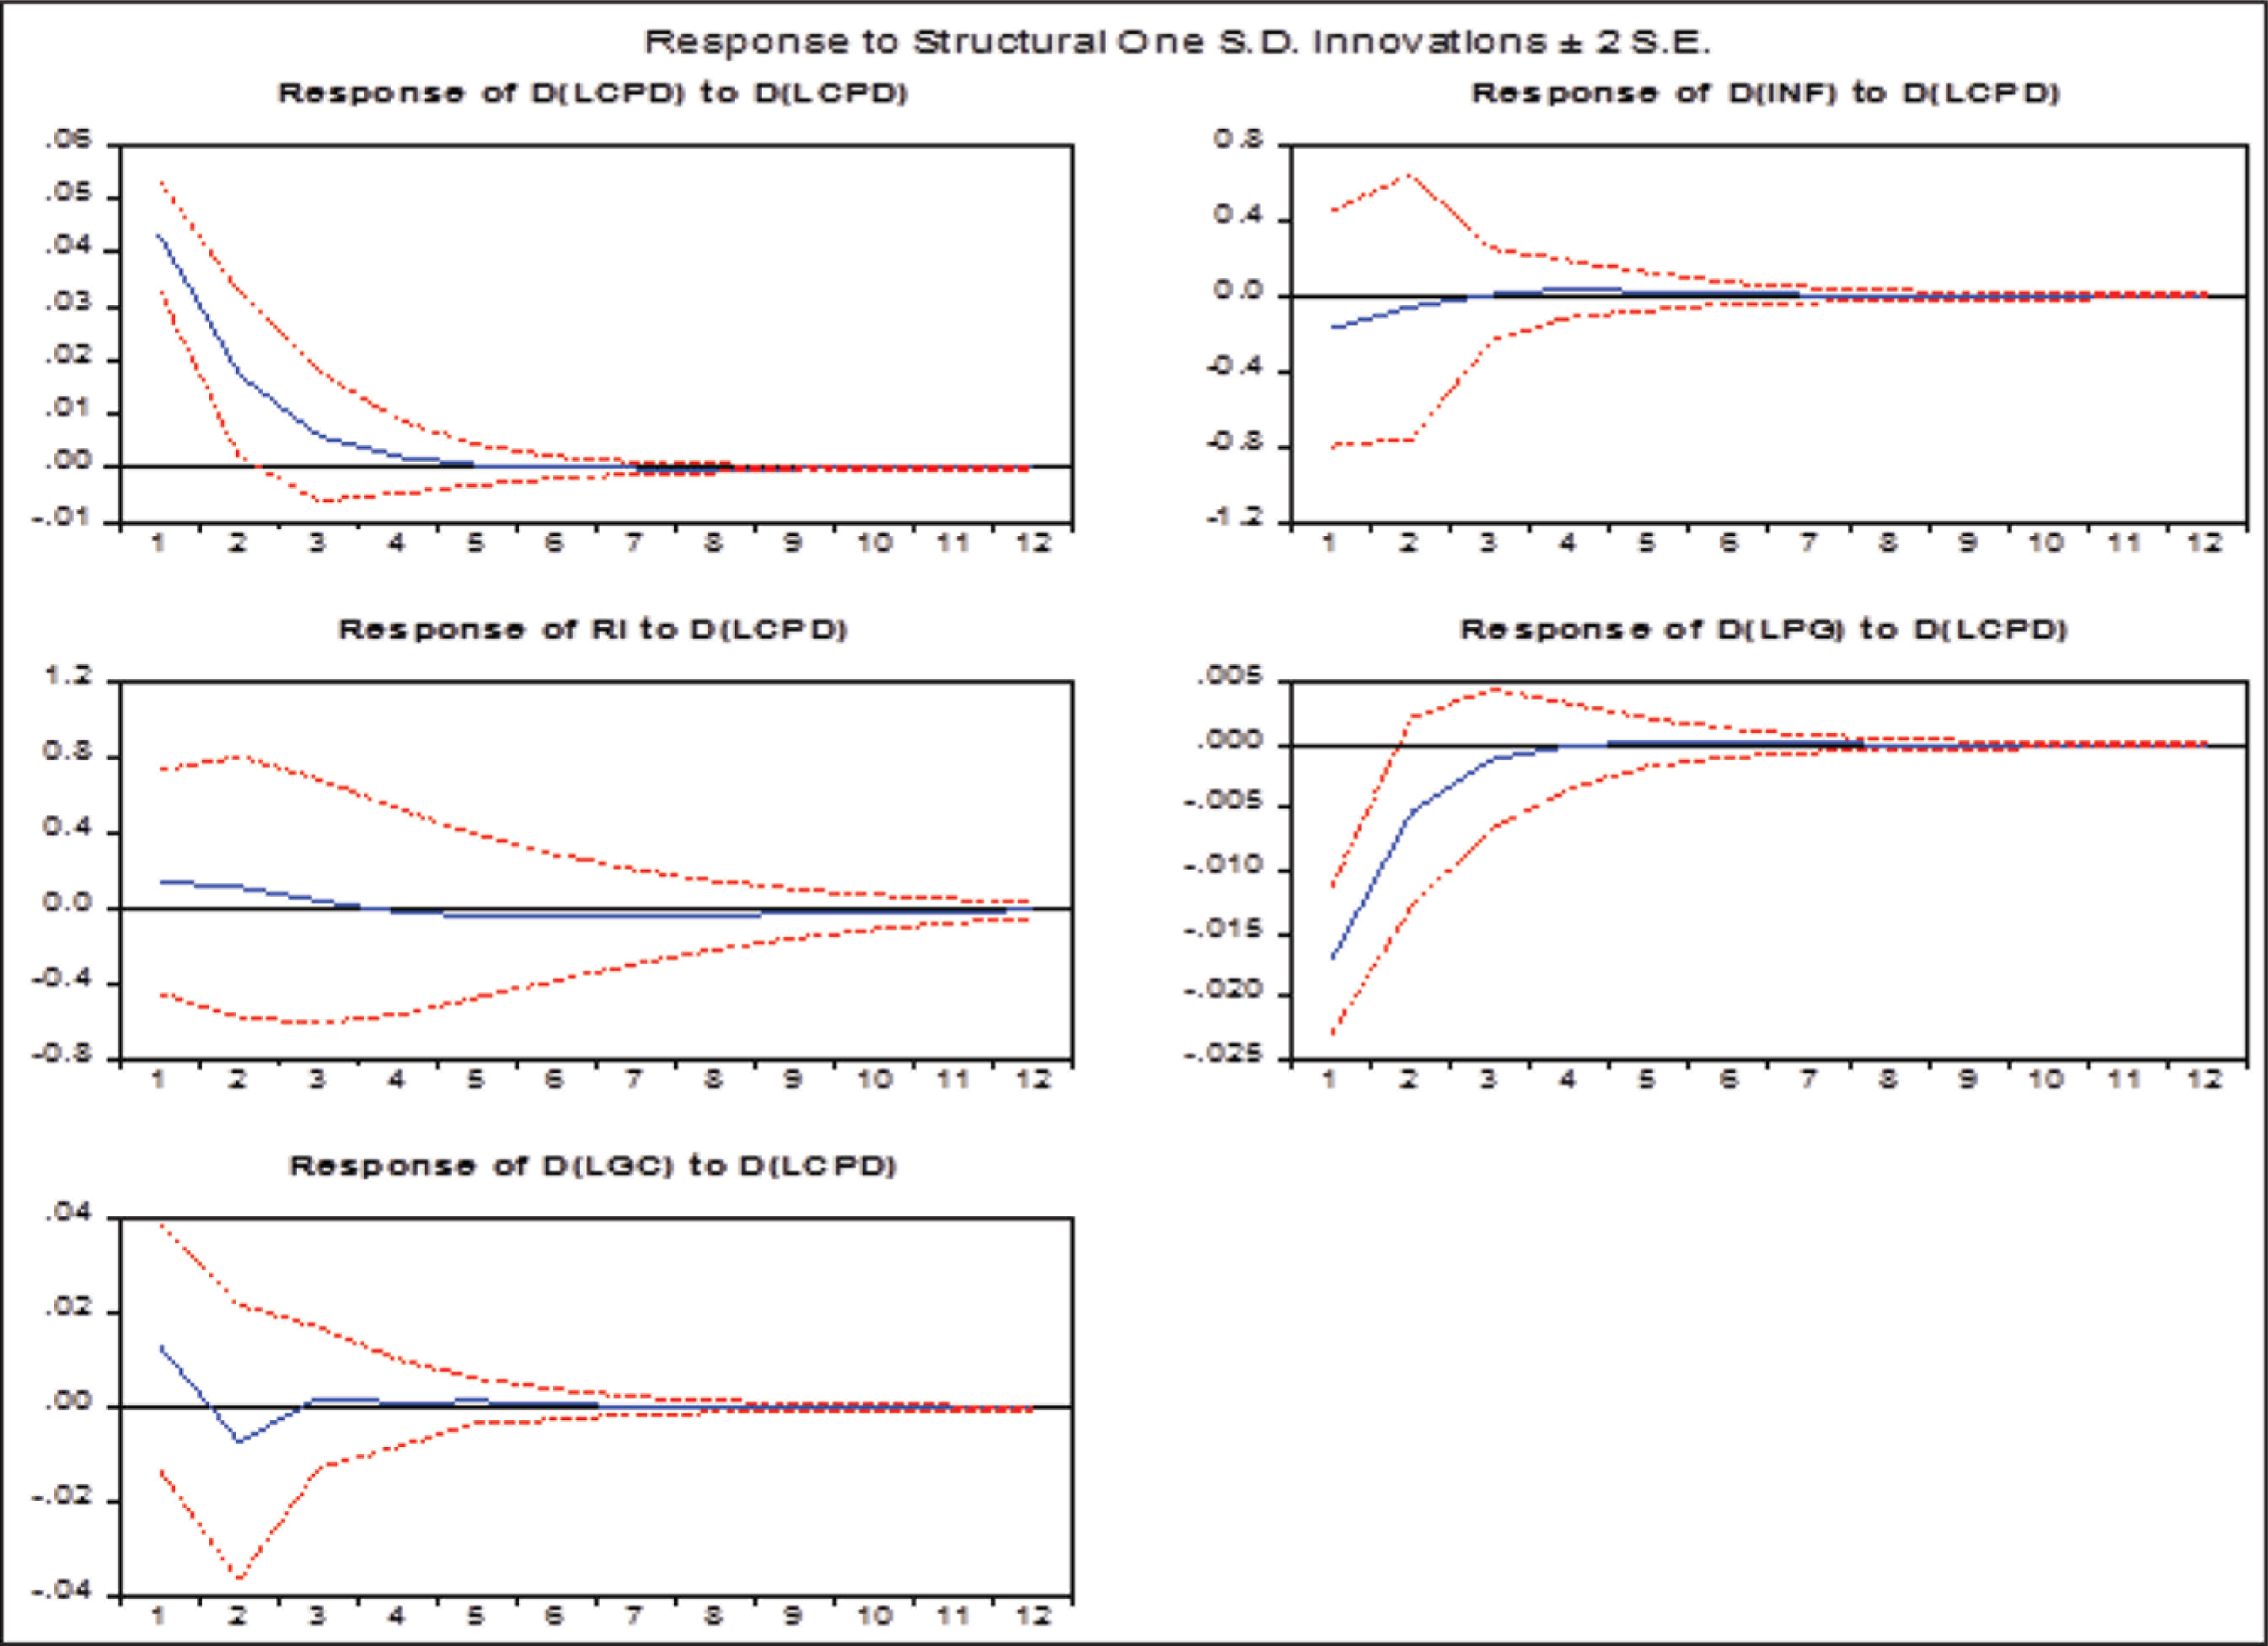
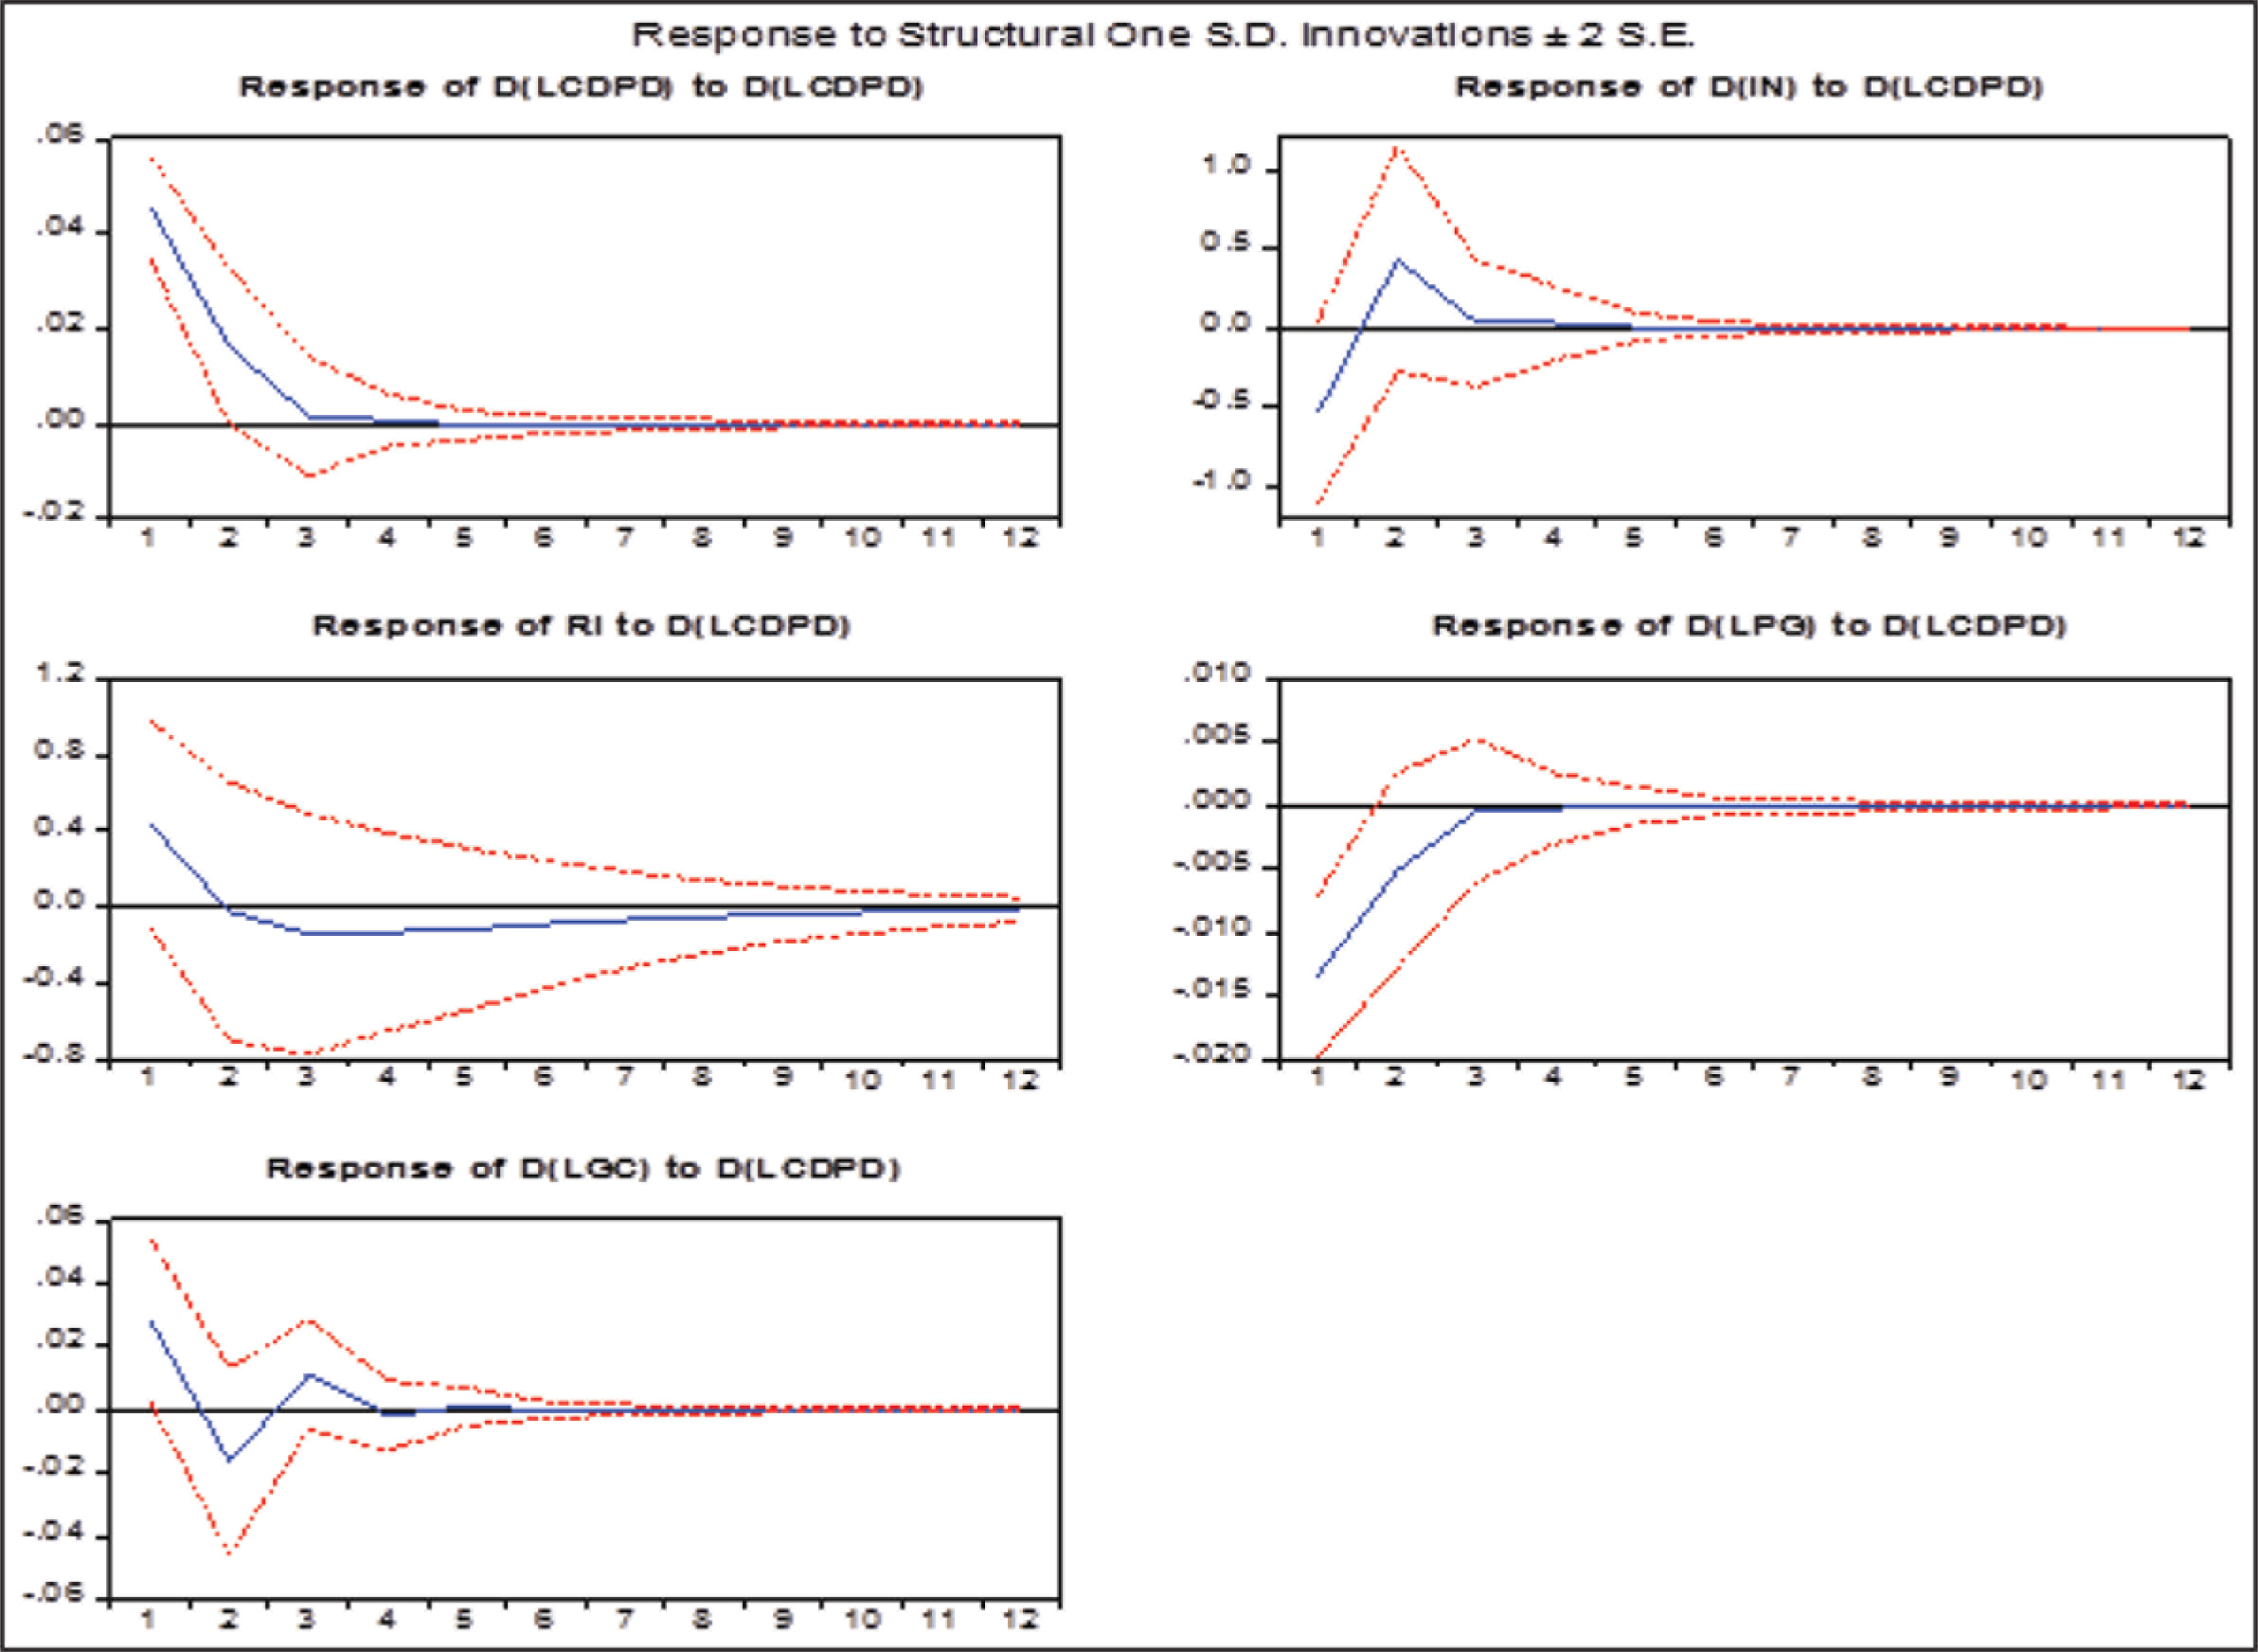
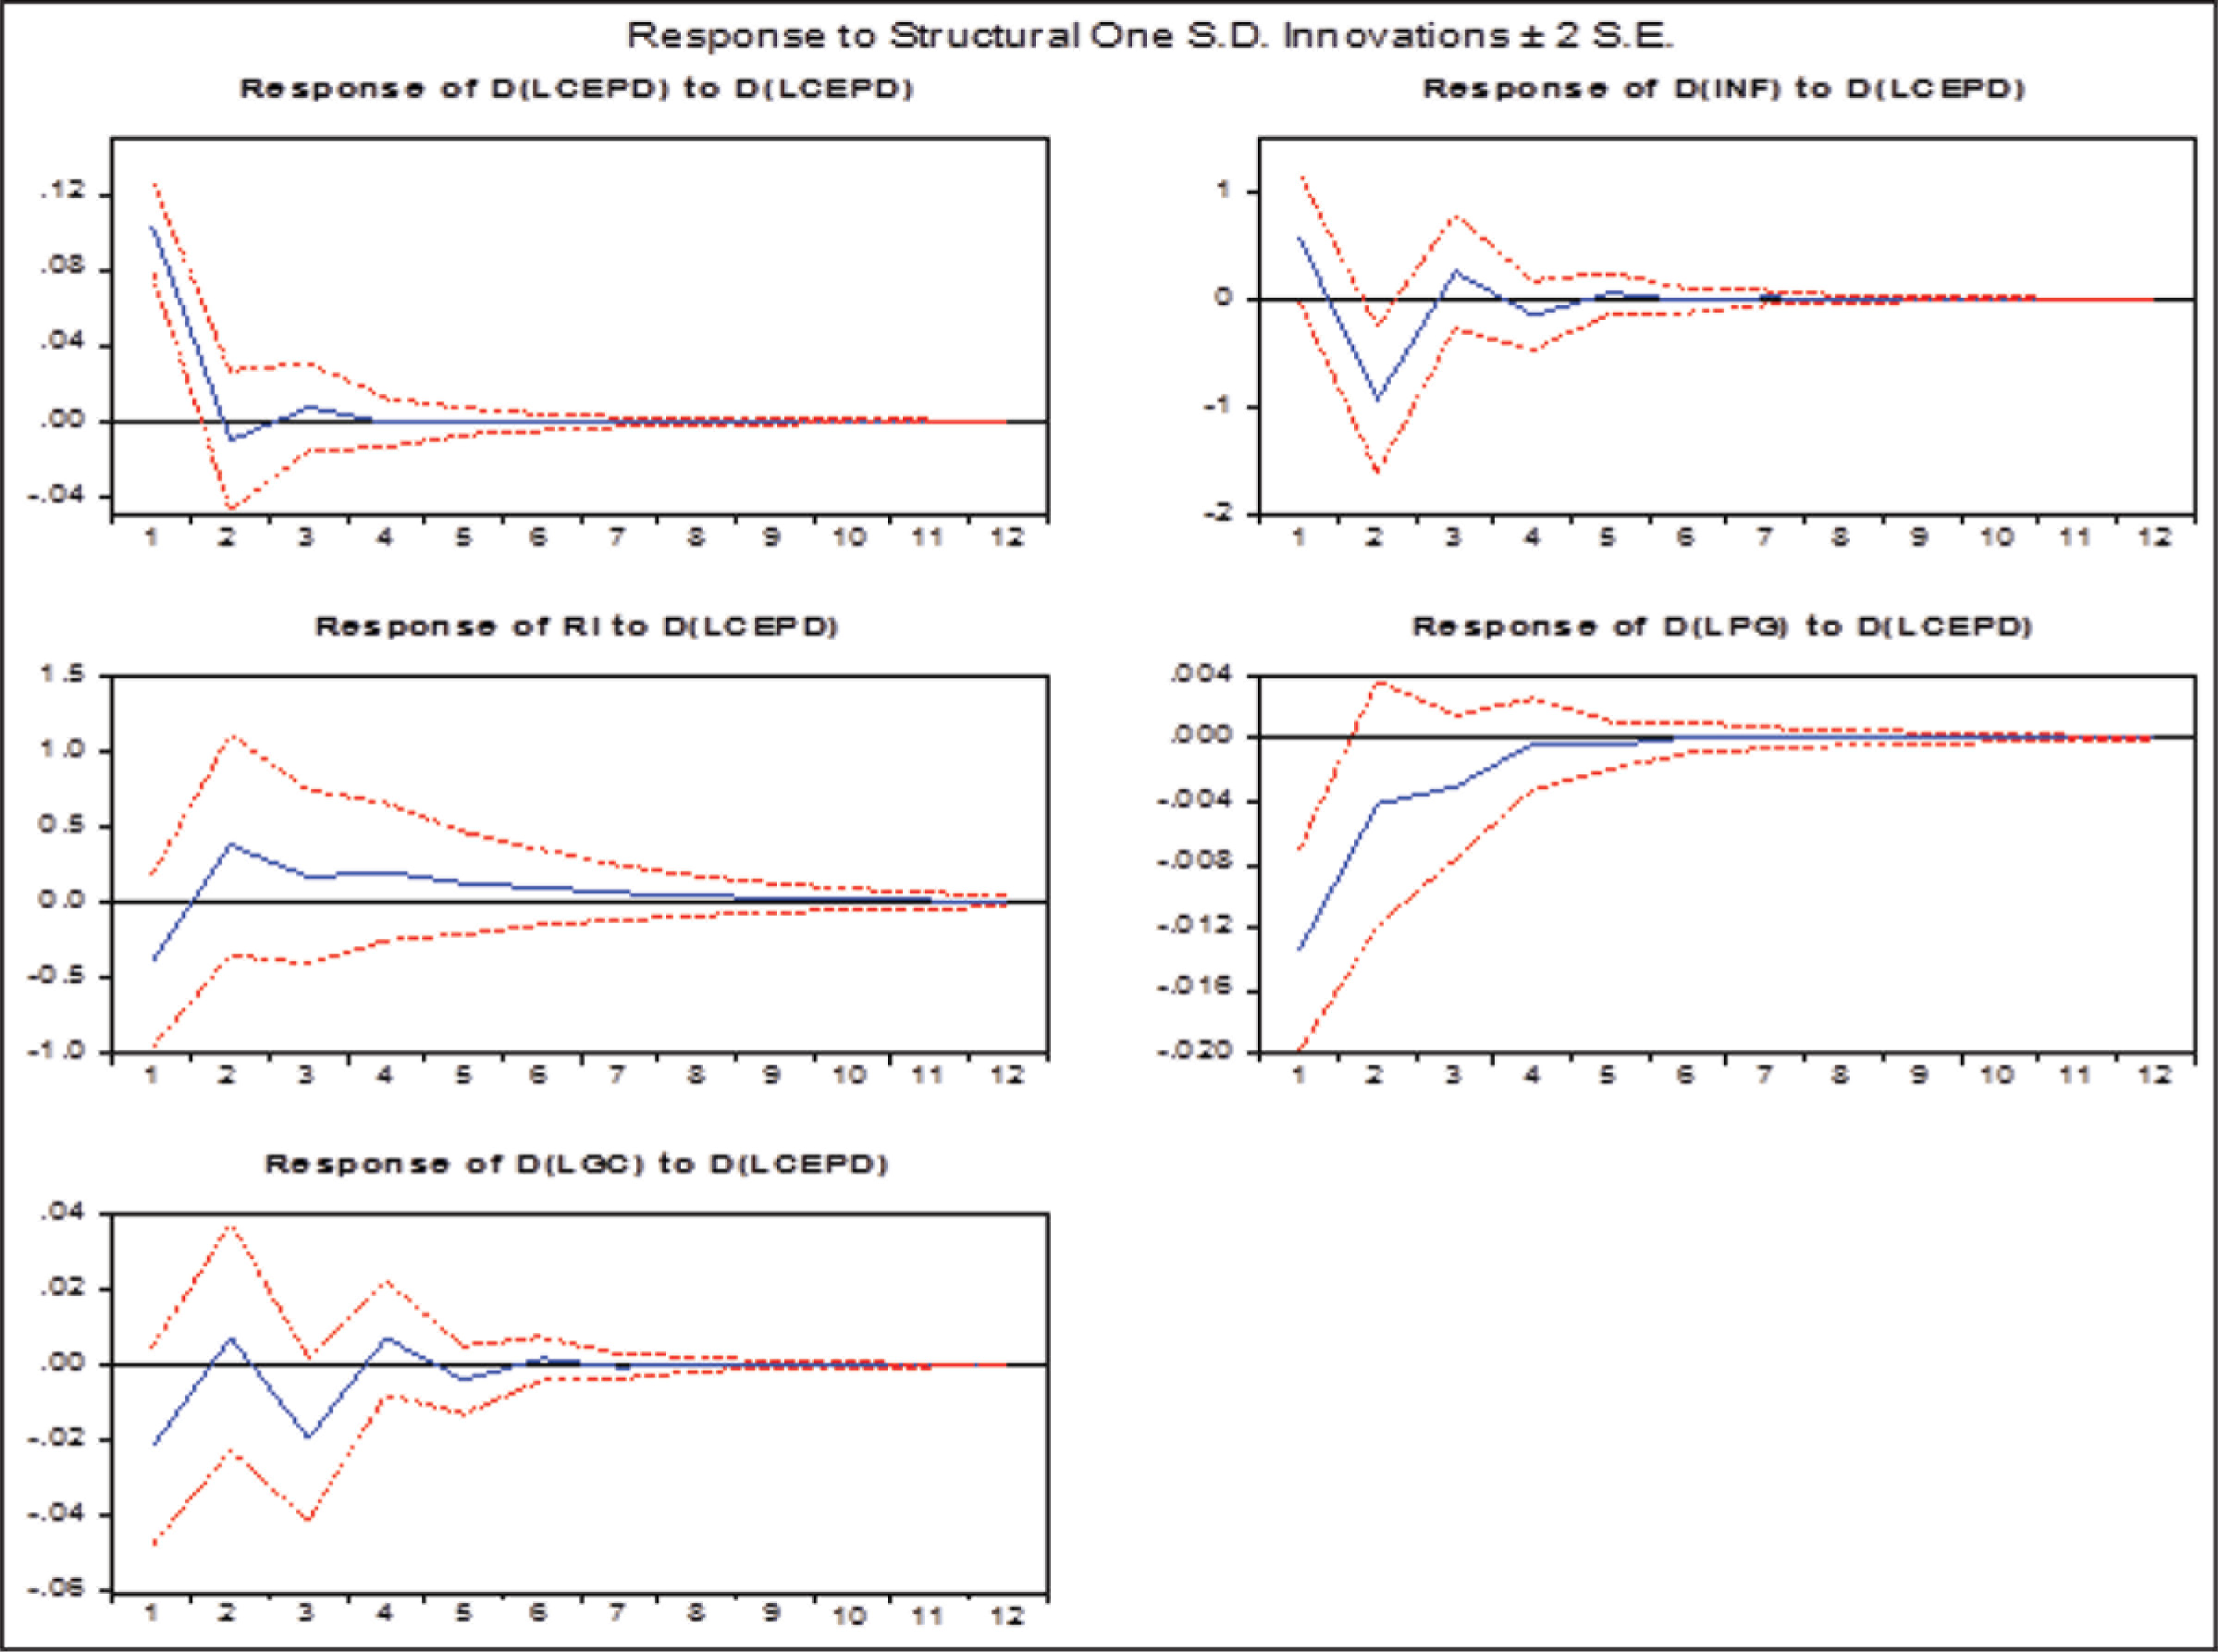
After analysing the impact of the combined public debt of both the centre and states, it would be interesting to verify how these major variables react to public debt at the central government level. Figures 6–8 show the impulse responses of the selected variables when one standard deviation innovation is given to the total public debt of the centre (LCPD), the domestic debt of the centre (LCDPD) and the external debt of the centre (LCEPD). The IRF results show that all types of central government public debt have an adverse effect on the growth of the economy, similar to the above findings. A shock to total and domestic public debt of the centre has a positive impact on the real interest rate, while a shock to the external debt has a negative effect on the real interest rate in the first year, and a positive impact in the remaining period. 11 It also confirms that shocks to all types of public debt have mixed and very negligible effects on investment and inflation. External debt has a volatile impact on investment as the funds raised from external sources might be used in a productive manner such as infrastructure development and capital formation. We analyse the magnitude of the response of selected variables to shocks on different types of public debt in the next section.
Tables A6 and A7 explain the effect of a one standard deviation shock to various public debt on selected macro variables for the first three annual years.
It is clearly seen that the impact of a shock to the combined domestic public debt is larger on inflation, real interest rate and investment than a shock to the combined total public debt. Similar findings are observed while analysing the impact on the public debt of the central government, that is, a shock to domestic debt of the central government has a larger effect than a shock to the total debt of the central government. Thus, domestic debt has a more adverse impact than total public debt which includes external debt. A shock to external debt has a negative impact on the real interest rate in the first year, then a positive impact in the remaining period. Hence, we find strong evidence that the impact of external debt is less harmful than domestic debt in India during the selected period.
Overall the IRF results show that various types of public debt, especially domestic debt, act as a burden on the economy as they have a negative impact on economic growth. This result supports the traditional view of a negative relationship between total public debt and economic growth. Indian public debt enhances the interest rate and has a moderate effect on both inflation and investment. Hence, there is a need to control India’s high public debt.
Variance Decomposition Analysis
Variance decomposition is a useful tool to provide information on the relative importance of each of the shocks to the system. It measures the proportion of movement of a variable emanating from shocks to itself and from shocks to other variables. Tables A8–A12 report the percentage of the forecast error variance of selected variables due to shocks in the SVAR model over three horizons in the future: 1–3 years, 6th year and 12th year.
The results indicate that 98–99 per cent of the variation in total public debt (both combined and central) is explained by shocks to itself. In case of domestic and external debt, much of the variation is explained by its own shock followed by growth. Further, much of the variation in inflation is explained by itself, growth and domestic public debt, and a very small part of the variation is explained by the interest rate and investment. The variations in the real interest rate are largely affected by inflation itself, growth and public debt. Similarly, the huge variation in economic growth is due to shocks in public debt and itself. The rest of the variation is explained by inflation, the interest rate and investment. Finally, the variation in investment is explained more by itself, growth, inflation and public debt, with a negligible amount explained by the interest rate. Over a longer horizon, the influences of growth, inflation and public debt have been increasing towards the variation in investment.
Overall, the results of the structural decomposition of the forecast error variance show that public debt is a policy variable, and therefore exogenous in nature. Inflation is largely due to the pressure of aggregate demand through growth and public debt. The interest rate is due to the Fisher effect and a rise in aggregate demand. Economic growth is adversely affected by public debt, and finally, investment is also influenced by the rise in aggregate demand.
Conclusion and Policy Implications
The effect of public debt on crucial macroeconomic variables has been a debated issue in the current literature. Theoretical arguments presented by the Classical, Keynesian and Ricardian equivalence approaches have varied opinions on the impact of public debt on the macroeconomy. India has a high level of public debt both at the centre and at the state level; also, domestic debt constitutes nearly 95 per cent of total public debt. It would be very interesting to examine whether the public debt in India is being used in a productive or unproductive way. Using an SVAR framework, the study assesses empirically the macroeconomic effects of public debt in India from 1980–1981 to 2017–2018. For a robust analysis, the impacts of both the combined central and state governments’ public debt, and the central government’s public debt on the interest rate, investment, inflation and economic growth are analysed separately. The study also examines separately the effects of domestic debt and external debt of the respective governments on these macro variables for understanding the issue succinctly.
The results of the unit root tests find that the selected variables are both stationary and non-stationary. Therefore, the ARDL bounds testing approach is used to check the cointegration relationship between the variables. The results confirm that variables do not have long-run relationships. The short-run dynamics among the variables are estimated using the SVAR framework with impulse response functions and variance decompositions. Overall, the results of the impulse response functions show that public debts (at the central government as well as combined governments of both centre and states) have an adverse impact on economic growth in India. The results also show that they have a positive impact on the long-term interest rate and a mixed response (both negative and positive) on gross investment and inflation. When separating total public debt into domestic debt and external debt, we find that domestic debt has a more adverse influence on the macro variables than external debt. Thus, the empirical findings support the classical argument that public debt acts as a burden on the economy.
The estimated variance decomposition analysis finds that public debt is a policy variable and independent of other variables, and variables such as growth, inflation and the interest rate have very little impact on it. Inflation is largely explained by itself, growth and domestic public debt, while the interest rate is largely affected by inflation, itself, growth and public debt. Public debt explains a high variation in economic growth, while inflation, interest rate and investment have very little impact on economic growth. Over a longer horizon, the influence of growth, inflation and public debt has been increasing towards the variation in investment. Thus, overall we find that much of the variation in selected macro variables is explained by public debt and growth in India. It appears that the resources generated through public debt are basically used in an unproductive manner rather in a productive way. Hence, it is recommended that the government allocate the resources generated through public debt to developmental activities which will increase the productive capacity of the economy.
The study suggests that public debt especially domestic debt should be controlled and used in a more productive manner to have a favourable impact on the economy. Recently, India has implemented two major policy reforms to enhance its revenue base, that is, a goods and services tax (GST) and demonetization of high-denominated currency in 2016. These policies might stimulate tax compliance and increase the number of taxpayers and tax receipts in the near future. But simultaneously, the government of India is also facing the burden of additional public spending due to the recommendations of the Seventh Pay Commission. Thus, efforts should be made to improve the revenue base of the economy as an alternative policy strategy to settle the outstanding public debt. Examining the sustainability of public debt and verifying the non-linear relationship between public debt and other major macro variables will require a separate study. These exercises are beyond the scope of the present study and, thus, considered one of the limitations of the study.
Footnotes
Declaration of Conflicting Interests
The authors declared no potential conflicts of interest with respect to the research, authorship and/or publication of this article.
Funding
The authors received no financial support for the research, authorship and/or publication of this article.
Acknowledgements
The earlier version of the article was presented at the South Asia Workshop on Fiscal Policy, organized by the World Bank Group and the Chief Economist for the South Asia Region of the World Bank, on 17–18 September 2018, in Kathmandu, Nepal. We would like to thank the discussant and participants at the conference for their comments and suggestions. We would also like to thank the anonymous reviewer for constructive comments and suggestions. Any errors and omissions are the authors’ alone.
Appendix
Variance Decomposition with Central Government External Public Debt
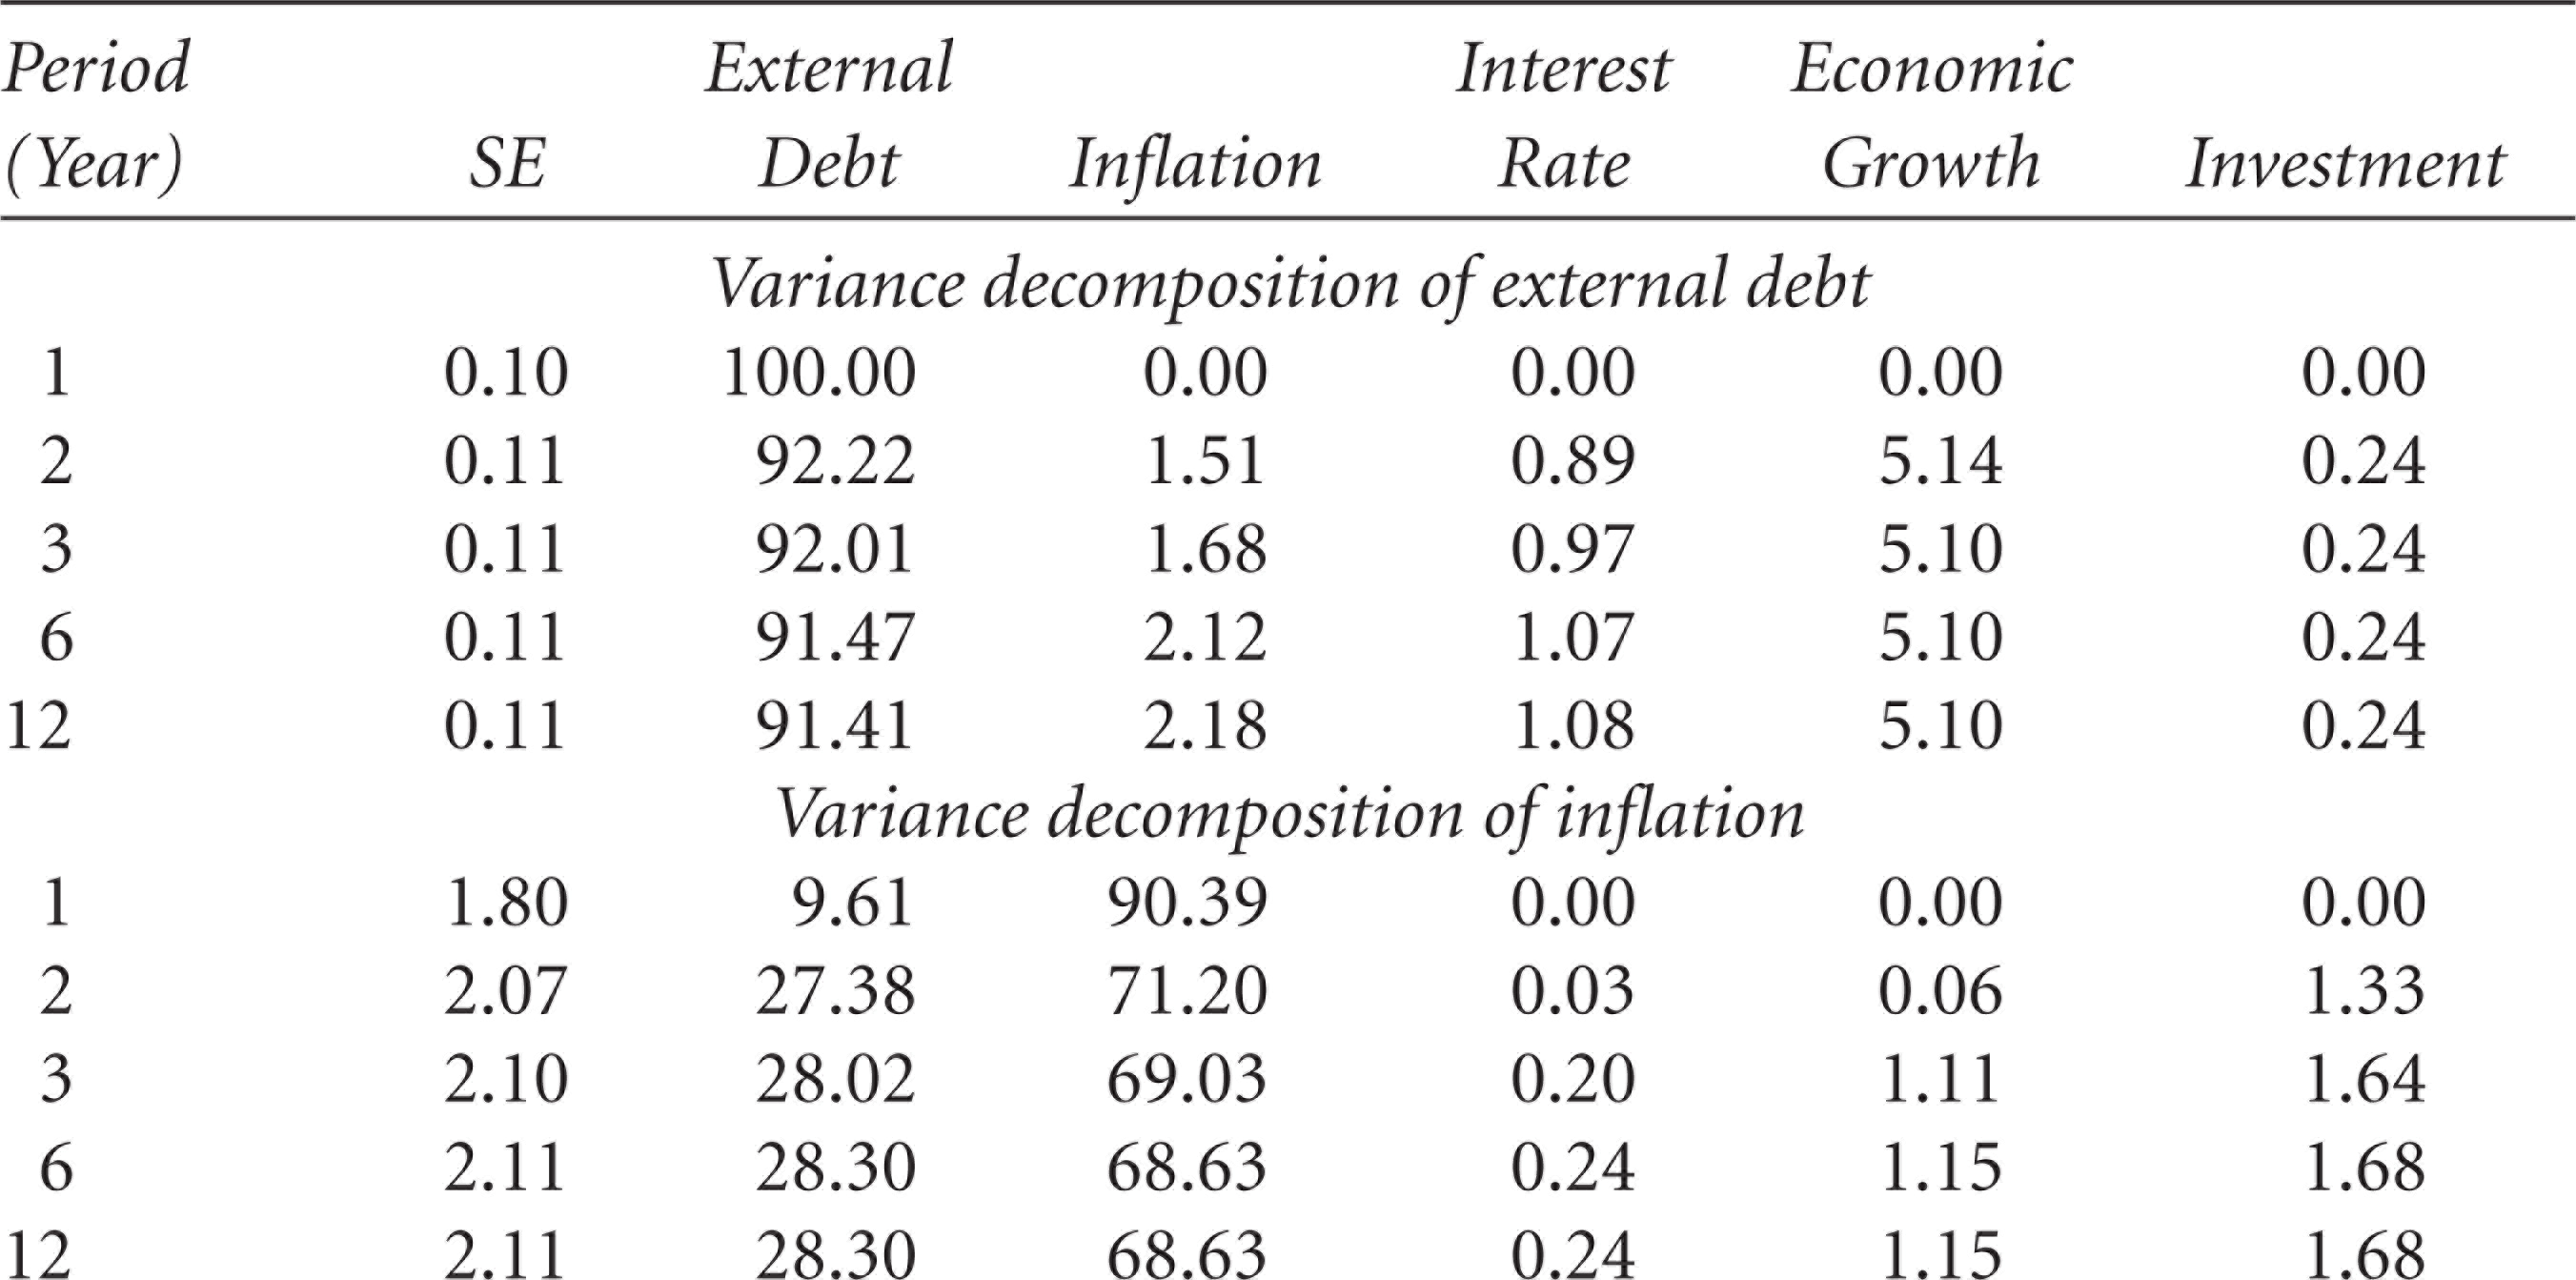
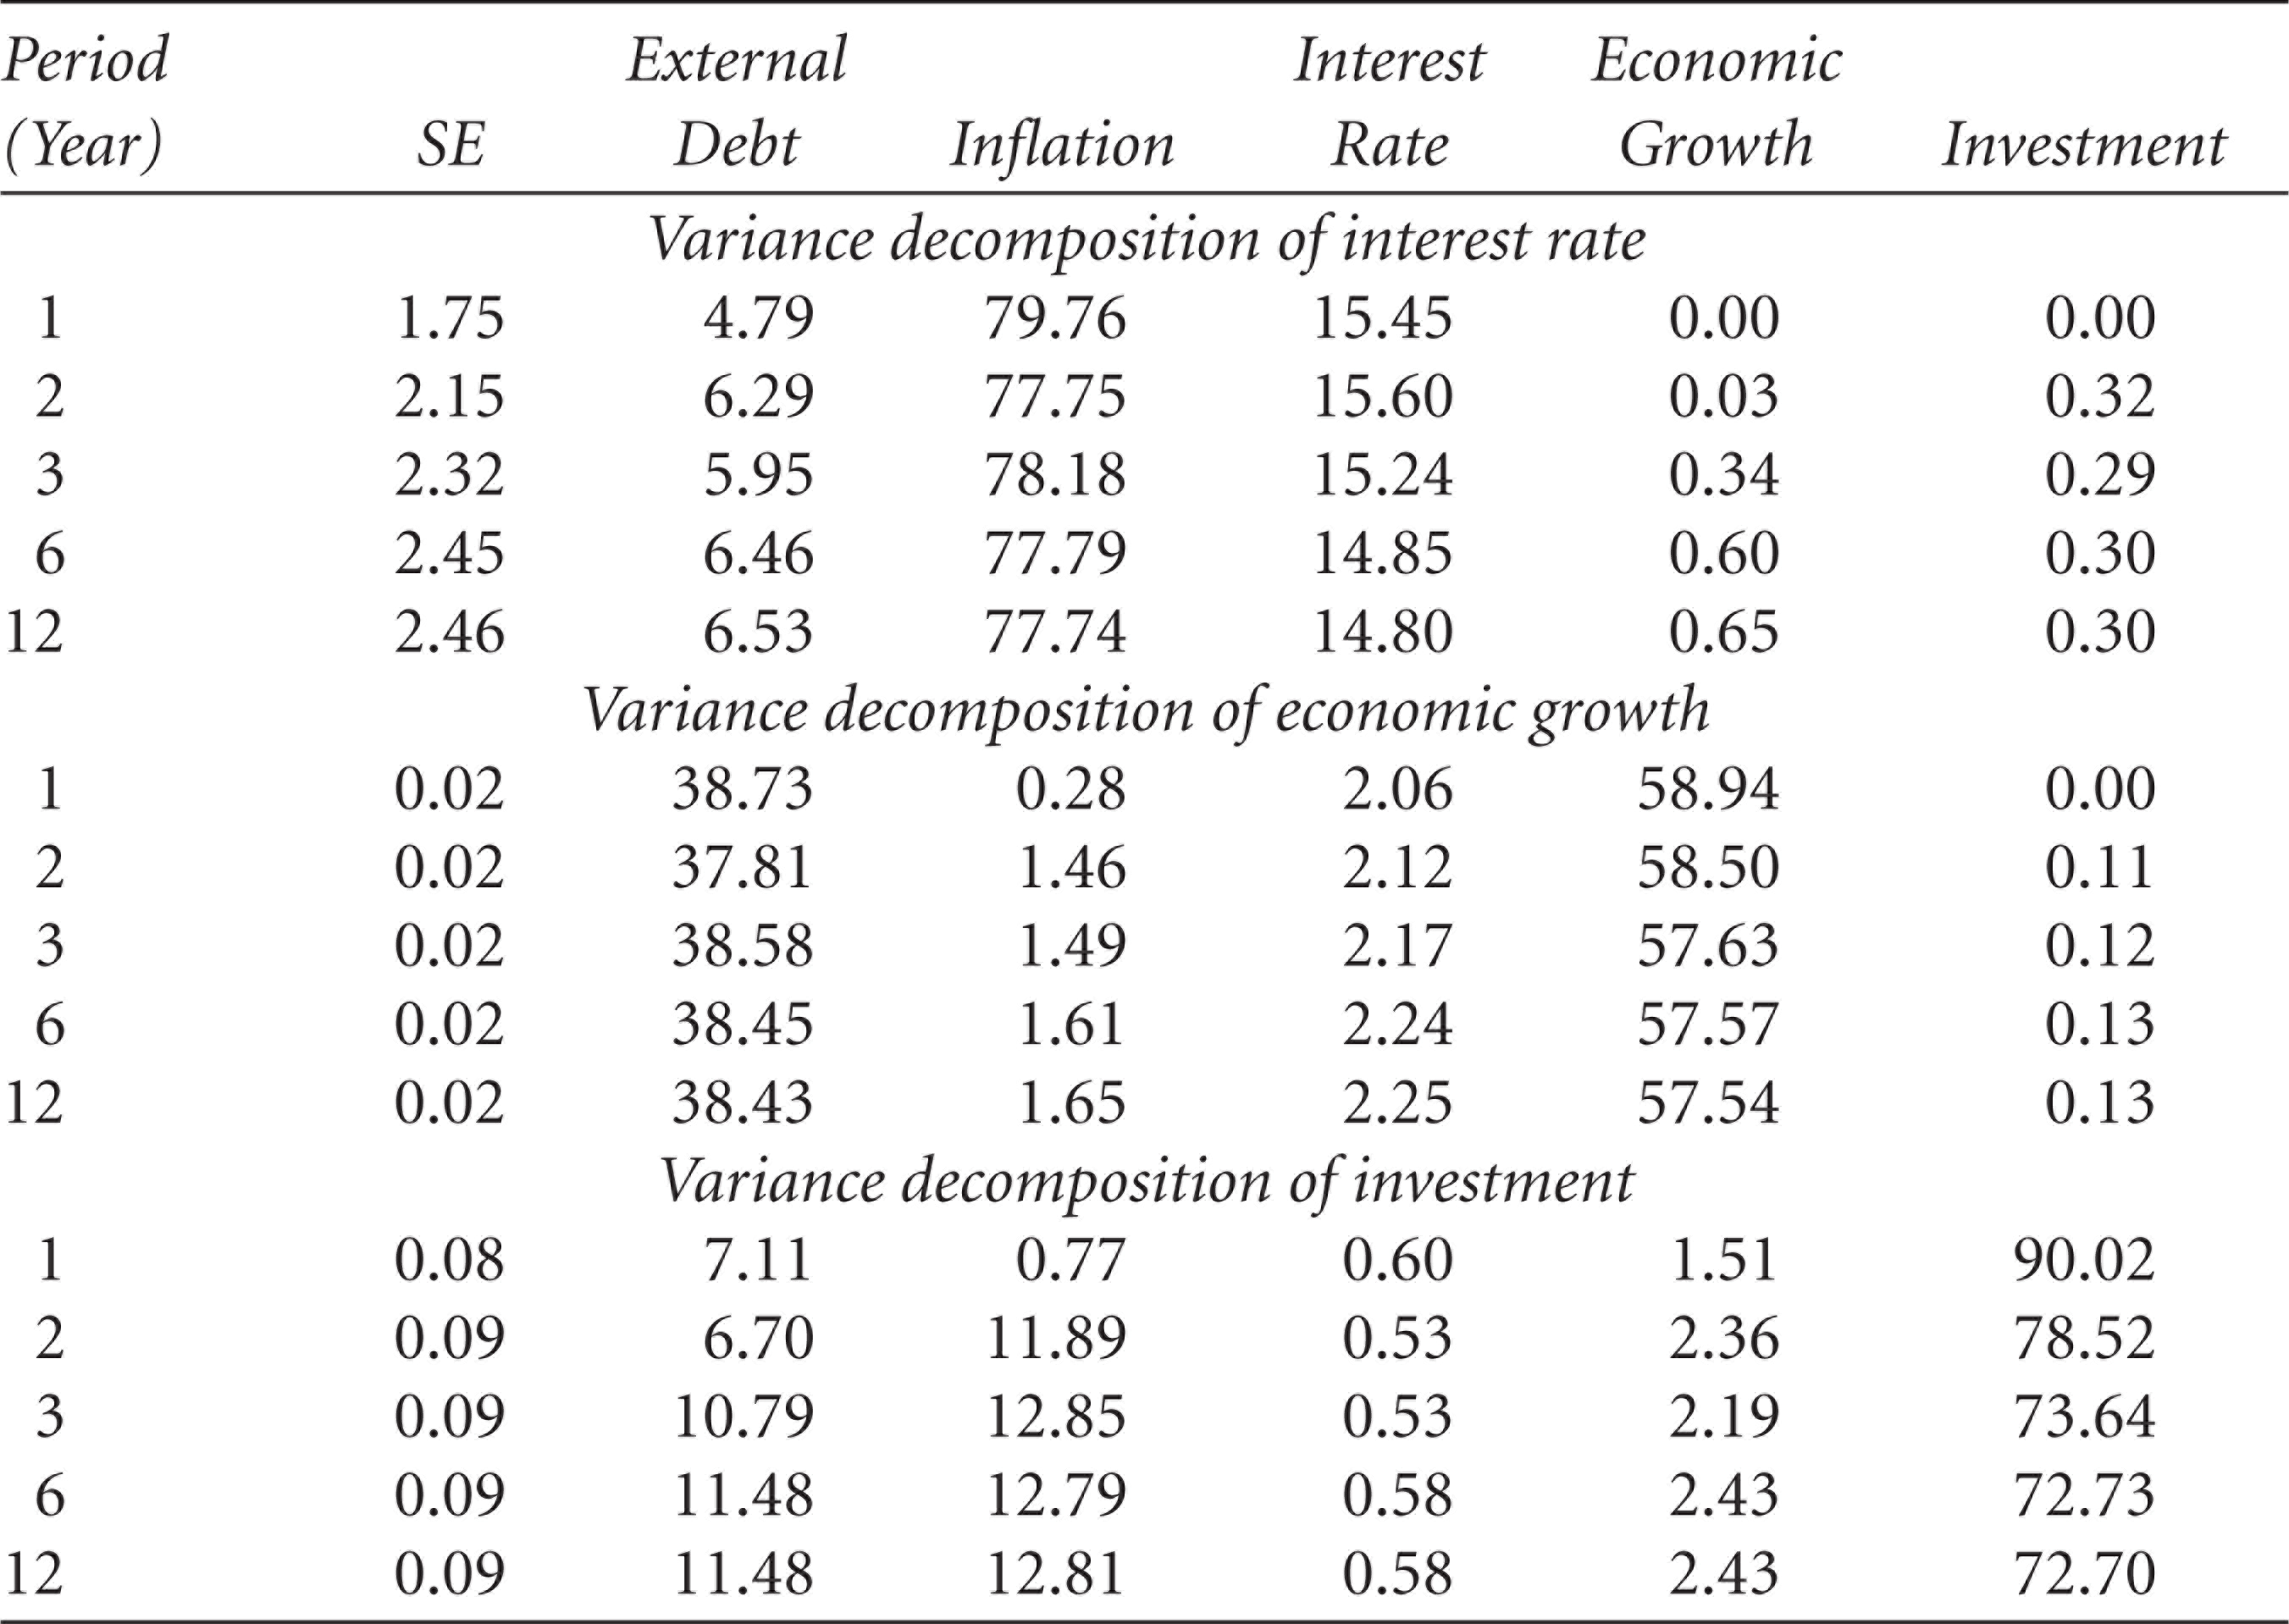
| Period (Year) | SE | External Debt | Inflation | Interest Rate | Economic Growth | Investment |
| Variance decomposition of external debt | ||||||
| 1 | 0.10 | 100.00 | 0.00 | 0.00 | 0.00 | 0.00 |
| 2 | 0.11 | 92.22 | 1.51 | 0.89 | 5.14 | 0.24 |
| 3 | 0.11 | 92.01 | 1.68 | 0.97 | 5.10 | 0.24 |
| 6 | 0.11 | 91.47 | 2.12 | 1.07 | 5.10 | 0.24 |
| 12 | 0.11 | 91.41 | 2.18 | 1.08 | 5.10 | 0.24 |
| Variance decomposition of inflation | ||||||
| 1 | 1.80 | 9.61 | 90.39 | 0.00 | 0.00 | 0.00 |
| 2 | 2.07 | 27.38 | 71.20 | 0.03 | 0.06 | 1.33 |
| 3 | 2.10 | 28.02 | 69.03 | 0.20 | 1.11 | 1.64 |
| 6 | 2.11 | 28.30 | 68.63 | 0.24 | 1.15 | 1.68 |
| 12 | 2.11 | 28.30 | 68.63 | 0.24 | 1.15 | 1.68 |
| Variance decomposition of interest rate | ||||||
| 1 | 1.75 | 4.79 | 79.76 | 15.45 | 0.00 | 0.00 |
| 2 | 2.15 | 6.29 | 77.75 | 15.60 | 0.03 | 0.32 |
| 3 | 2.32 | 5.95 | 78.18 | 15.24 | 0.34 | 0.29 |
| 6 | 2.45 | 6.46 | 77.79 | 14.85 | 0.60 | 0.30 |
| 12 | 2.46 | 6.53 | 77.74 | 14.80 | 0.65 | 0.30 |
| Variance decomposition of economic growth | ||||||
| 1 | 0.02 | 38.73 | 0.28 | 2.06 | 58.94 | 0.00 |
| 2 | 0.02 | 37.81 | 1.46 | 2.12 | 58.50 | 0.11 |
| 3 | 0.02 | 38.58 | 1.49 | 2.17 | 57.63 | 0.12 |
| 6 | 0.02 | 38.45 | 1.61 | 2.24 | 57.57 | 0.13 |
| 12 | 0.02 | 38.43 | 1.65 | 2.25 | 57.54 | 0.13 |
| Variance decomposition of investment | ||||||
| 1 | 0.08 | 7.11 | 0.77 | 0.60 | 1.51 | 90.02 |
| 2 | 0.09 | 6.70 | 11.89 | 0.53 | 2.36 | 78.52 |
| 3 | 0.09 | 10.79 | 12.85 | 0.53 | 2.19 | 73.64 |
| 6 | 0.09 | 11.48 | 12.79 | 0.58 | 2.43 | 72.73 |
| 12 | 0.09 | 11.48 | 12.81 | 0.58 | 2.43 | 72.70 |