





Abstract
Abstract
This study contributes to the existing body of knowledge concerning corporate governance practices by examining the corporate board and governance structures of American and Indian listed companies in a comparative study. Two hundred companies have been considered out of which 100 companies are listed on NYSE (New York Stock Exchange) and 100 companies are listed on BSE (Bombay Stock Exchange). T-test has been used for comparison between sample means from the two data sets (United States and India). To measure the year-wise variation in the mean values of variables, one-way ANOVA (analysis of variance) has been applied.
Results of the study demonstrates that boards of US listed companies are relatively larger with majority of independent directors on board, prominence of combined board leadership structure and relatively more gender diverse as compared to Indian boards. The paper can be quite useful to academics and policy makers in terms of understanding developed and developing country corporate governance structures.
Keywords
Introduction
Corporate governance is perhaps one of the most important differentiators of a business that has impact on the profitability, growth and even sustainability of business. It is a multi-level and multi-tiered process that is distilled from an organization’s culture, its policies, values and ethics, especially of the people running the business and the way it deals with various stakeholders. (Kshama & Dutta, 2012)
High-profile corporate scandals raise a moot question about the effectiveness of corporate boards worldwide and concerns about the performance of corporations and the way they are governed by their board members. Examples are cited from the United States (Enron fiasco, World Com and Tyco scandal), the United Kingdom (the collapse of Maxwell Publishing Group), Germany (Holtzman, Berliner Bank and HIH), Australia (Ansett Airlines and One Tel), France (Credit Lyonnais and Vivendi), Switzerland (Swissair) and India (Satyam and NSEL scam). The board of directors is the ultimate internal monitor and is the most prominent internal governance mechanism in aligning the interests of managers and shareholders (Daily, Dalton & Cannella, 2003; Fama, 1980) and also assists in the attainment of high-level financial performance and market valuation (Klapper & Love, 2002; Rajagopalan & Zhang, 2008). Among the most debated corporate governance issues currently faced by the modern corporation are those relating to the role of board of directors and their configuration in making a board more effective and proficient, such as, board size (Boone, Field, Karpoff & Raheja, 2007; El-Faitouri, 2014; Raheja, 2005), board independence (Fich, 2005; Hermalin & Weisbach, 1988; Sarkar & Sarkar, 2009), board diversity in terms of gender (Adams & Ferreira, 2009; Galbreath, 2011; Sikand, Dhami & Batra, 2013) and board leadership structure (Jackling & Johl, 2009; Rechner & Dalton, 1991). Therefore, in most of the codes and principles for ensuring good corporate governance standards and practices, the corporate board structure has been considered as one of the key provisions of the codes of corporate governance worldwide including the United States as well as India.
The diversity of board roles in the governance of corporations, differences in the leadership structure, the organisation structure and the composition of board provide a wide range of board models in different countries. For instance, the Anglo-Saxon countries such as the United States, the United Kingdom and Canada have adopted variants of one-tier models whereas in majority of European countries and Japanese firms variants of the two-tier board model is prevailing where an additional organisational layer has been designed to separate the executive function of the board from its monitoring function. In Anglo-Saxon one-tier board model, executive directors and nonexecutive directors operate together in one organisational layer (the so-called one-tier board). The members of the one-tier board are elected by the shareholders, while the members of the management board are usually elected by the supervisory board. Some one-tier boards are dominated by a majority of executive directors while others are composed of a majority of nonexecutive directors. In addition, one-tier boards can have a board leadership structure that separates the CEO and chair positions of the board. One-tier boards can also operate with a board leadership structure that combines the roles of the CEO and the chairman known as CEO duality. One-tier boards also make often use of board committees like audit remuneration and nomination committees. Most features of the Anglo-Saxon model exist in the Indian corporate scenario barring a few, such as, the dispersed equity ownership.
The belief that the purpose of the modern corporation is to maximise shareholder value, along with typical capital market and ownership features, has been associated with the ‘Anglo-Saxon’ agency model of the corporation. Both the countries the United States and India follow the Anglo-Saxon model of corporate governance, which has certain limitations in terms of its applicability in different political, legal and economic environment. For instance, the central governance issue in the United States is disciplining management that has ceased to be effectively accountable to the owners who are dispersed shareholders (Pandey & Kaushik, 2012). While, the main issue of corporate governance in India is disciplining the dominant shareholders who are the principal block-holders and the promoters of the companies (as family businesses and corporate groupware culture is common in India and often leads to expropriation of minority shareholder value through actions like ‘tunnelling’ of corporate gains or funds to other corporate entities within the group) and to protect the interest of the minority shareholders. The primary difference between corporate governance enforcement problems in India and the most Western economies including the United States (on whose codes the Indian codes are largely modelled) is that the entire corporate governance approach hinges on disciplining the management and making them more accountable.
Undoubtedly, most of the discussion on corporate governance originates from the United States (Sheridan & Kendall, 1992) but literature on the corporate governance structure and its comparison with developing economies such as India is very restricted. Hence, the present study contributes to the existing body of knowledge concerning corporate governance practices emphasising on corporate board and governance structure by empirically examining the size and composition of corporate boards of selected US and Indian listed companies as a comparative study.
Research Objectives
With a view to examine and compare the developed (United States) and developing country (India) corporate governance structure the objectives of the study are:
Revisit the regulatory framework on corporate governance structure in the United States and India. Analyse the trends and patterns of board structure of companies listed in the United States and India. Examine and compare the board structure (namely, board size, board composition and independence, board leadership structure and gender diversity) of both US and Indian listed companies.
Corporate Board and Governance in the United States and India: An Overview
The legal system is responsible for codification and the implementation of a series of reforms aims at crafting an effective corporate governance mechanism and protecting the rights of investors and other stakeholders. An effective legal framework is indispensable for the proper and sustained growth of the company. The US system of corporate governance has evolved continuously over the last several decades.
The governance structure of corporations is regulated by both federal and state securities laws and state corporation laws. In the U.S. the board of directors is the focal point under corporate law. Each of the 50 states in the U.S. has its own corporation’s code and an individual state is free to design its legislation in whatever manner it sees fit, assuming it does not violate constitutional principles protecting the flow of trade and commerce throughout the U.S. (Cheffins, 2012)
Federal and state securities laws mainly regulate the disclosure of detailed information in annual reports, proxy statements (though proxy solicitation regulated by the 1934 Act) and other reporting titles on matters related to the nomination of directors, the formation and composition of board committees, the organisation of board leadership structures and the remuneration of directors in publicly held corporations. Listing rules provide an additional source of corporate governance requirements.
The major federal statutory initiative having a considerably wider corporate governance ambit, is the enactment of the Sarbanes–Oxley Act of 2002 (SOX) as a result of Enron collapse. This act is characterised as ‘the most far reaching reforms of American business practices since the time of Franklin Delano Roosevelt’.1 The act mandated a number of reforms to enhance corporate responsibility, enhance financial disclosures and combat corporate and accounting fraud, and created the ‘Public Company Accounting Oversight Board’, also known as the PCAOB, to oversee the activities of the auditing profession. Under the Sarbanes–Oxley Act, many aspects of corporate governance that previously were addressed, if at all, through stock market listing requirements, best practice standards, or policy statements from the Securities & Exchange Commission (SEC) are now the subject of direct binding law. In 2003, the SEC promulgated a number of rules that implement provisions of the Sarbanes–Oxley Act.
In July, 2010 the passage of the landmark Dodd-Frank Wall Street Reform and 2Consumer Protection Act (‘Dodd-Frank’) was an important event in the area of corporate governance. Furthermore, a flurry of corporate governance guidelines and codes of best practice such as National Association of Corporate Directors (NACD), Report of the NACD Blue Ribbon Commission on Director Professionalism; The Business Round Table, The Principles of Corporate Governance; Council of Institutional Investors (CII), Core Policies, General Principles, Positions & Explanatory Notes, California Public Employees’ Retirement System (CalPERS), Corporate Governance Core Principles and Guidelines: The United States, etc. recommend how public company boards should configure their structures and processes.
The institutional framework for corporate governance initiatives in India consists of the Ministry of Corporate Affairs (MCA) and the Securities and Exchange Board of India (SEBI). SEBI serves as a market-oriented independent entity to regulate the securities market akin to the role of the Security and Exchange Commission (SEC) in the United States. It is the regulator and promoter for the development of securities market, monitors and regulates corporate governance of listed companies through Clause 49 of the Stock Exchange Listing Agreements viewed as a milestone in the evolution of corporate governance practices in India. The composition and proper functioning of the board of directors emerges as one of the key areas of Clause 49. The companies (of a certain size) that do not comply with Clause 49 can be de-listed and charged with financial penalties. Clause 49 became applicable in a phased manner to all the listed companies by March 2003 and has been revised from time to time. The realm of SEBI’s statutory authority has also been the subject of extensive debate and some researchers have pointed out to whether SEBI which oversees the codification and implementation of Clause 49 can make regulations aligning with the jurisdiction of MCA, which administers the Companies Act. Therefore, to facilitate the listing companies to ensure the compliance with the provisions of revised Clause 49 and to eliminate the problems arising from an overlap of jurisdictions between Clause 49 and the Companies Act, SEBI vide circular date 15 September 2014 had made certain amendments to Clause 49, which inter alia, include the following: (i) non-applicability of Clause 49 for companies having paid up equity share capital not exceeding `100 million and net worth not exceeding `250 million, as on the last day of the previous financial year; (ii) maximum tenure of independent directors shall be as per the Companies Act, 2013 (and classification made there under) as against the existing tenure of 5 years (iii) definition of independent directors revised. These changes to some extent align the requirements of Clause 49 with those in the Companies Act but in many other areas, still retain the more stringent requirements.2
Corporate Board Structure in the United States and India: Current Status and Provisions
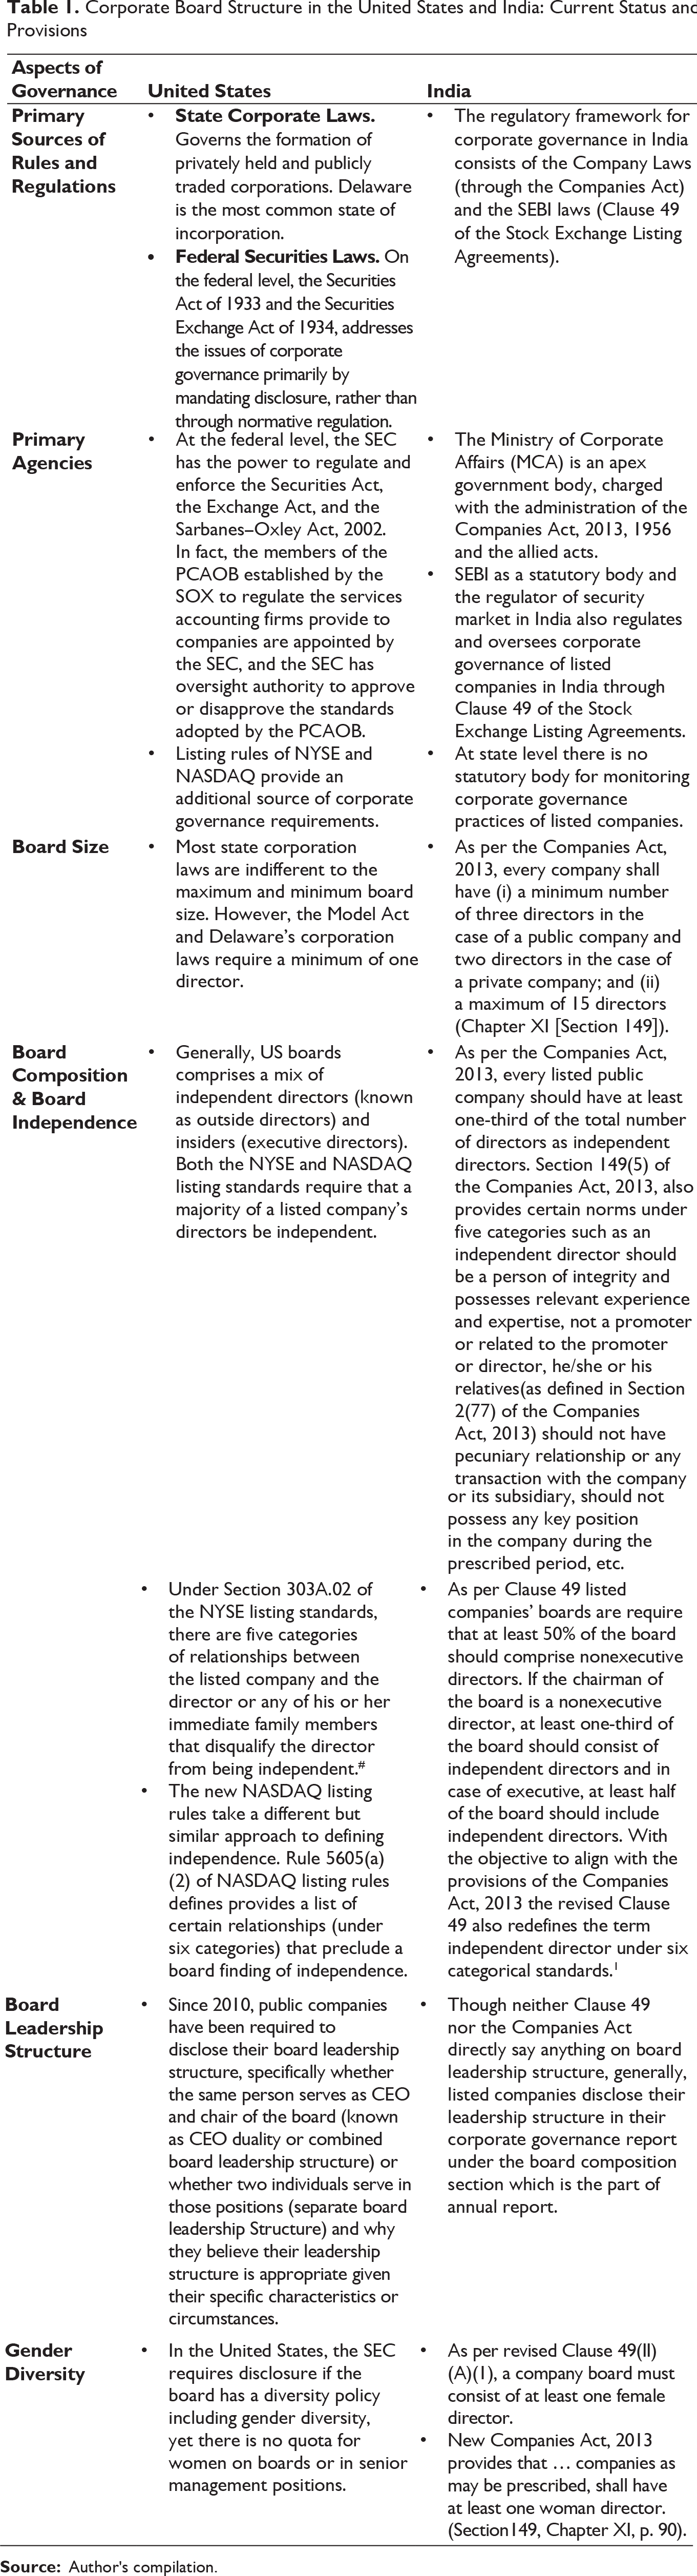
**For details, see Revised Clause 49 Circular dated 17 April 2014, CIR/CFD/POLICY CELL/2/2014; available at http://www.sebi.gov.in/cms/sebi_data/attachdocs/1397734478112.pdf
***For details, see the New Companies Act, 2013; available at /http://www.mca.gov.in/Ministry/pdf/CompaniesAct2013.pdf/
#For details, see NYSE Listing Standards (Rules) codified in Section 3003A.000 (approved in August, 2013); available at http://nysemanual.nyse.com/LCMTools/PlatformViewer.asp?selectednode=chp_1_4_3&manual=%2Flcm%2Fsections%2Flcm-sections%2F
##For details, see The NASDAQ OMX Group, Inc. Corporate Governance Guidelines APPROVED: 6 May 2015; available at http://files.shareholder.com/downloads/NDAQ/0x0x
21344/9019EBAF-60B7-4340-8AE3-F377D313AF55/Corp_gov_guide.pdf
###For the details, see The SOX Act, 2002; available at http://www.sec.gov/about/laws/soa2002.pdf
####For details, see http://www.sec.gov/about/laws/soa2002.pdf
1.
In addition, under the revised Clause 49, a flurry of new provisions and amendments have been incorporated for making boardrooms more independent and transparent such as criterion for performance evaluation of independent directors, separate meeting of independent directors, etc., which are the reflection of the US legislation.
Literature Review and Hypotheses Development
The literature dealing with US and Indian corporate governance structure is voluminous. This section presents some selected prior research work on board-related attributes.
Board Size: Board size is an important aspect of corporate governance structure that can potentially determine the effectiveness of board performance. Indeed, indications from the literature suggest that there is a limit to the level whereby board size can positively affect board performance (Forbes & Milliken, 1999). Different countries have different board sizes. There is no one optimal size for a board. Jensen (1993) suggested that an optimal limit should be around eight directors in US listed companies and Lipton and Lorsch (1992) suggested the maximum size of the board should be 10 members, as greater numbers will interfere with the group dynamics and hinder board performance. A study conducted by Jayati Sarkar and Subrata Sarkar projects that corporate boards of large companies in India in 2003 were slightly smaller than those in the United States (in 1991), with 9.46 members on average in India compared to 11.45 in America. Based on the prior literature on board size the following hypotheses can be outlined:
Ho: There is no significant change in the trend and pattern of board size of US and Indian listed companies. Ho: There is no significant difference in the board size of US and Indian listed companies.
Board Composition and Independence: Board independence often refers to the proportion of ‘outside directors’ to ‘inside directors’ or ‘nonexecutive directors’ to ‘executive directors’. The concept of board independence came into existence due to the watchdogs’ desire to pre-empt the natural human tendency of the principal block holders for undue enrichment at the expense of the minority shareholders and to discourage unethical board practices. The agency theory also promotes the requisite for boards to be independent in order to be effective in monitoring and controlling management (Fama & Jensen, 1983) and as protectors of the shareholders’ welfare Hermalin & Weisbach, 1988). A study by Jayati Sarkar and Subrata Sarkar (2000) revealed that Indian boards had relatively fewer independent directors (just over 54 per cent compared to 60 per cent in the United States) and relatively more affiliated outside directors (over 20 per cent versus 14 per cent in the United States). The proportion of independent directors on boards in China in the study conducted by Lo, Wong and Firth (2010) is 34.5 per cent whereas a study conducted by Ramdani and Witteloostuijn (2010) indicates that proportion of outside directors in Sri Lankan firms are 69 per cent. Reviewing the literature on board independence in various countries’ company, the following hypotheses can be proposed:
Ho: There is no significant change in the trend and pattern of proportion of independent directors on board of companies in the United States and India. Ho: There is no difference in the number of independent directors on board of companies listed in the United States and India.
Board Leadership Structure: Prior work on board leadership structure reports mixed results. Rachner and Dalton (1991) empirically conclude that firms opting for separate leadership structure consistently perform better than those having the CEO duality. Gul and Leung (2004) in their study found that separate leadership structure is associated with higher voluntary disclosure. Contrary to that Donaldson and Davies (1991) linked the combined leadership structure with high firm performance. Some studies advocate that between 70 per cent and 80 per cent of large US publicly traded companies still maintain the combined board leadership structure (Coles, McWilliams & Sen, 2001; Rechner & Dalton, 1991). On the other hand, however, Dalton, Daily, Ellstrand and Johnson (1998) conclude that there is no difference in firm performance within combined or separate board leadership structure companies. Based on past literature, following hypothesis can be derived:
Ho: There is no significant difference in board leadership structure of US and Indian listed companies.
Gender Diversity: Significant governance issue faced by modern corporations is board diversity including gender diversity. Prior literature suggests that diversity of group membership increases discussion, the exchange of ideas and group performance (Schippers, Hartog, Koopman & Wienk, 2003; Watson, Kumar & Michaelsen, 1993). Gender Diversity Benchmark for Asia (2011) report stated that India had the lowest national female labour force of 29 per cent in 2011 in comparison to China (46 per cent), Japan (42 per cent) and Singapore (42 per cent) (Francesco & Mahtani, 2011). A small but growing stream of research has observed links between women on boards and firm economic performance (e.g., Bonn, 2004; Carter, Simkins & Simpson, 2003; Rose, 2007). One reason for this is that gender diversity has been advocated as a means of improving organisational value and performance by inculcating boards with new insights, new information and new perspectives. Galbreath (2011) argues that there is an association between women on boards of directors and corporate sustainability. Gender diversity as a crucial issue in modern scenario has been considered in this study and based on the above discussion the following hypotheses can be postulated:
Ho: There is no significant change in the trend and pattern of gender diversity in US and Indian listed companies. Ho: There is no significant difference in gender diversity of companies listed in the United States and India.
Research Design
Period of Study: The study covers five consecutive financial years from 2008–2009 to 2012–2013. Indian companies published their annual reports for one financial year starting from 1 March to 30 April, whereas American companies maintain their financial report from 1 January to 31 December. However, this time variation will not affect the analysis as time variation is very little only 3 months.
Type and Sources of Data: The secondary data requires in this study and gathered through companies’ reports, financial reports, quarterly reports, proxy statements, specific industry and government department online database, etc. For the purpose of reliability of data, corporate financial data have been obtained from CMIE (Center for Monitoring Indian Economy) Prowess for India and EDGAR (Electronic Data Gathering and Retrieval as maintained by Securities and Exchange Commission) database for the United States.
Sample Size and Sampling Techniques: Stratified Sampling Method has been used for the selection of sample companies. Total 200 companies have been considered out of which 100 companies are listed on NYSE (New York Stock Exchange) and 100 companies are listed on BSE (Bombay Stock Exchange). In the sample of the United States 50 companies are large-cap companies with more than $10 billion market capitalisation and remaining 50 per cent companies are mid-cap companies between $2 billion and $10 billion (as on 30 April 2013). Same procedure has been adopted for the selection of sample of India-listed companies where top 50 companies are large-cap companies with more than `100 billion market capitalisation and remaining top 50 companies are mid-cap companies with market capitalisation ranging from `20 to `100 billion. The companies with either large-cap or mid-cap market capitalisation selected because these are more likely to have the resources and motivation to take advantage of the opportunity to adopt good corporate governance practices.
Analysis Design: In order to analyse the various research objectives both descriptive as well as inferential statistical tools have been used in this study. Descriptive statistics used in the study consist of maximum, minimum, mean, median, inter-quartile range and standard deviation. As this study is comparative in nature and comparison is done between two sample means from the two data sets (United States and India), T-test has been used. To measure the year-wise variation in the mean values of variables, one-way ANOVA (analysis of variance) has been applied. Chi-square has also been used to analyse the distribution of frequencies for two categories (yes or no) of one variable, that is, board leadership structure.
Analysis and Discussion
Board Size in US and Indian Listed Companies
Year-wise Distribution of Board Size in US and Indian Listed Companies
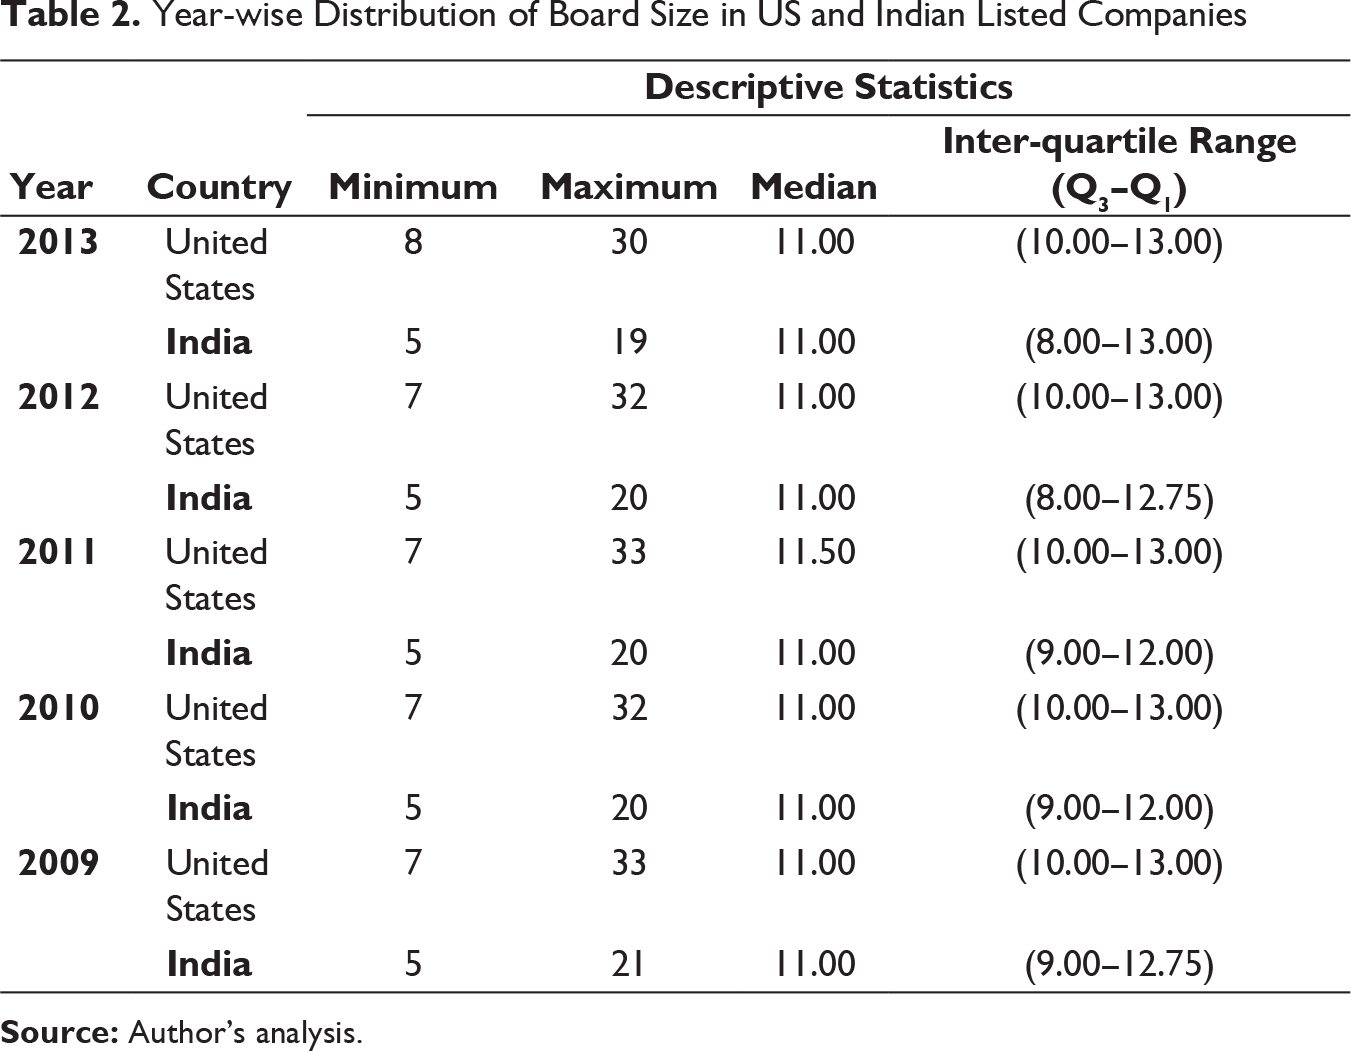
The size of the boards of directors of selected US companies ranged from 7 to 33 members, with median value of 11 members. In the United States minimum board size is 7 during the study period except in 2013. In contrast, Indian boardrooms have lower minimum size of board as compared to US board. The maximum size of US board ranges between 30 and 33 whereas in Indian the maximum board size ranges between 19 and 21. However, both countries board have same median board size, that is, 11 except in 2011 in the United States, indicates that 50 per cent of US and Indian companies have board size below 11. In India 25 per cent companies have not more than 9 members on board whereas in the United States 25 per cent companies’ boards consists of 10 directors. In addition, 75 per cent companies in the United States and India has board size below 13 as shown by inter-quartile range.
Figure 1 shows that the distribution of board size in the United States and India is relatively same expect in 2013 and 2012. It seems that there is no true difference between US and Indian board size as the median value, that is, 11 and inter-quartile range, that is, 3 is almost same in all years except in first 2 years. Moreover, in the United States the minimum size of board consists of at least eight directors as compared to India where smallest board comprises only five directors.

Comparison of US and Indian Board Size
Average (±SD) of Board Size in US and Indian Listed Companies
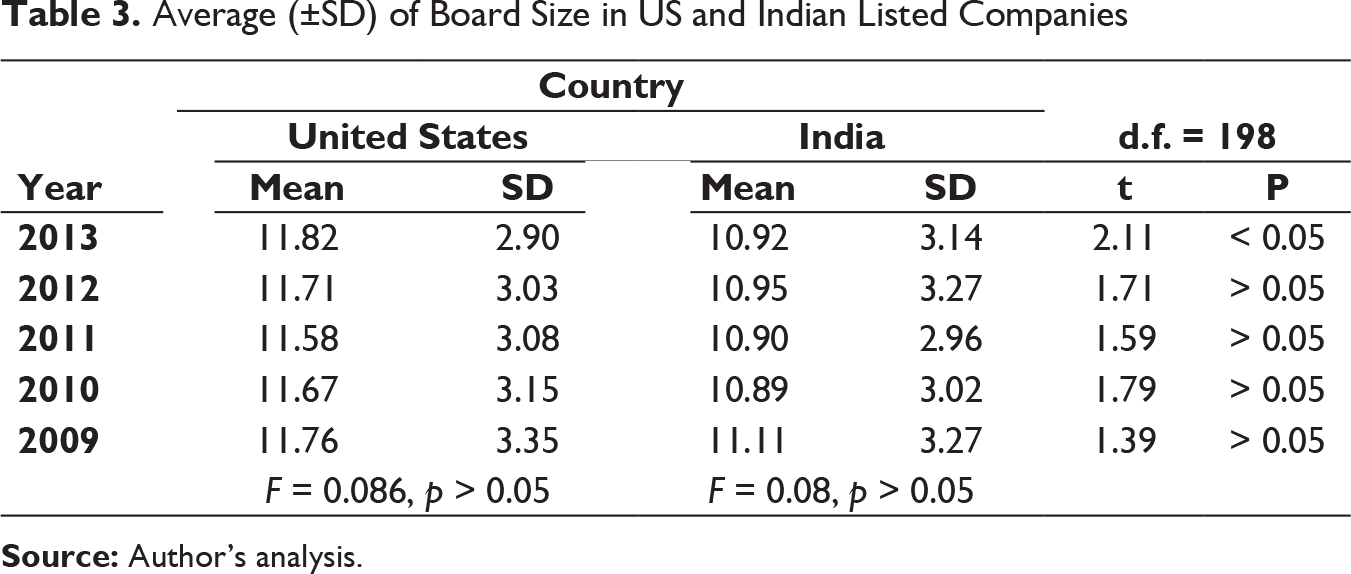
Hence, the null hypothesis which states that there is no significant change in the trend and pattern of board size of US- and Indian-listed companies has been accepted.
To test the difference between the average board size of the United States and India t-test has been used. The table indicates that average size of board in the United States is more than India. Though the average size of board in the United States is more than India but this difference in the mean values of board size is not statistically significant at 5 per cent level of significance for all the stated years (except in 2013 where p value is greater than 0.05). So, it can be said that there is no difference in the board size of the United States and India except in 2013.
Therefore, null hypothesis which states that there is no significant difference in the board size of companies listed in the United States and India has been accepted (except in 2013).
Board Independence in US and Indian Companies
Year-wise Distribution of Total Number of Independent Directors on Board in US and Indian Listed Companies
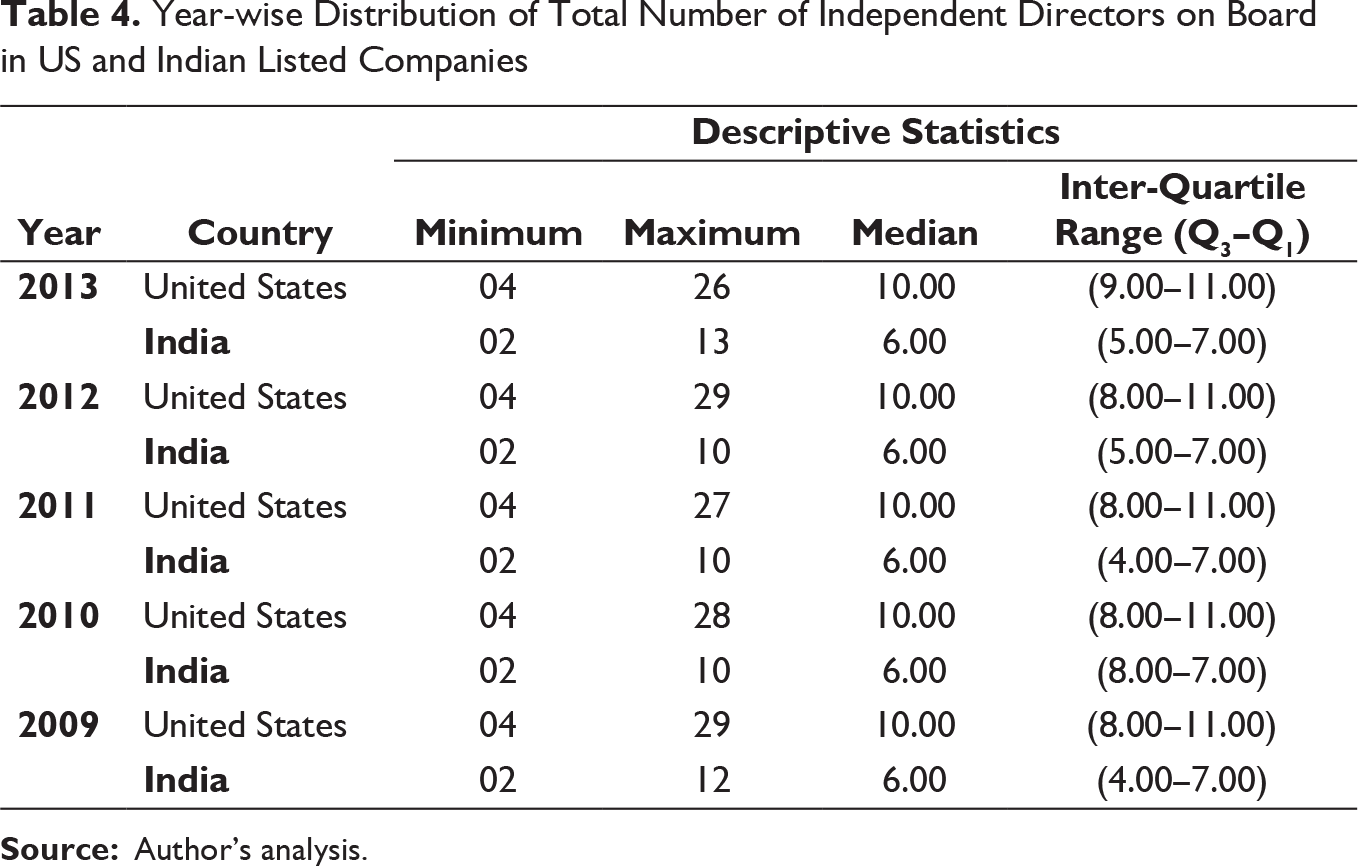
The box plot presented in Figure 2 presents that distribution of independent directors between the United States and India are symmetrical in nature. It indicates that there is obvious difference in the total number of independent directors on US and Indian boards because the numerical values of minimum, maximum, median, lower and upper quartile, all are skewed up in the United States. Thus it can be said that the United States boards have larger number of independent directors as compared to India.

Comparison of Number of Independent Directors on US and Indian Boards
Table 5 shows that average number of independent directors on board in the United States is almost double than India during the study period. As far as year-wise variation is concerned F value indicates that year-wise there is no change in the average number of independent directors on board of the United States and India as well.
Average (±SD) Number of Independent Directors on Board in US and Indian Listed Companies
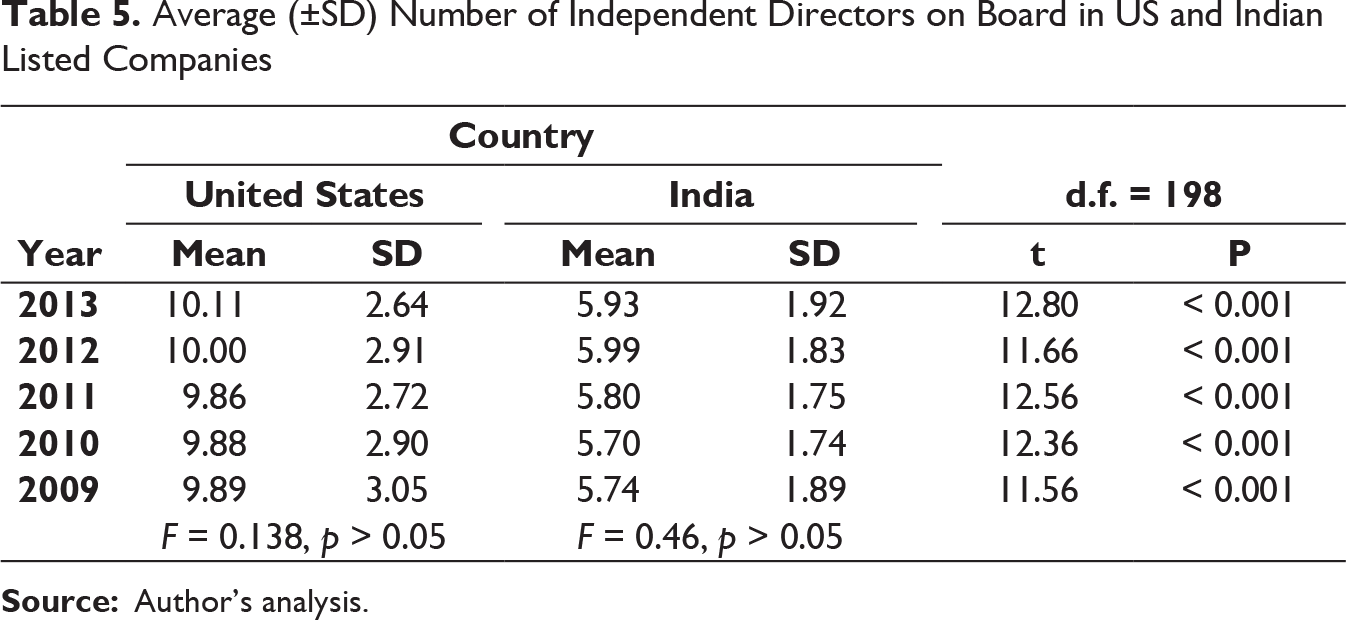
The proportion of outsiders on US board is 85 per cent as the mean board size is ranging from 11.58 to 11.82 and average numbers of independent directors are 9.86–10.11. Switzer and Tang (2008) reported the same proportion of independent directors for the United States. Statistical t-test further proves that there is highly significant difference in the average number of independent directors between the United States and India during study period.
Therefore, the null hypothesis which states that there is no difference in the number of Independent directors on board of companies listed in the United States and India is rejected.
Board Leadership Structure in Listed Companies in the United States and India
Board Leadership Structure (BLS) in US and Indian Listed Companies
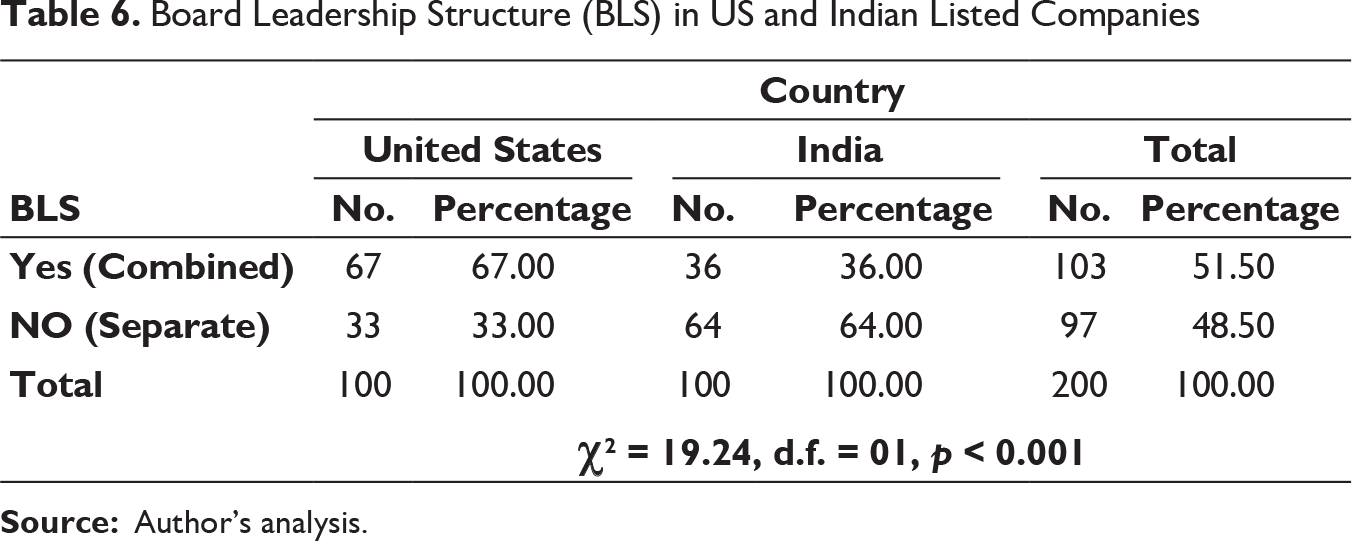
Table 6 depicts the board leadership structure in the United States as well as India and indicates that there is difference in the board leadership structure in both countries. There is combined leadership structure in majority of US listed companies, that is, 67 per cent, whereas in Indian-listed companies there is dominance of separate leadership structure, that is, 64 per cent. The findings about the leadership structure is in supportive with the other researchers findings that reported that between 70 per cent and 80 per cent of large US publicly traded companies still maintain the combined board leadership structure (Coles et al., 2001; Rechner & Dalton, 1991). It is to be noted that the separated board leadership structures did not prevent the spectacular collapses of Enron, WorldCom, Global Crossing, Qwest and Tyco (Finkelstein & Moony, 2003). It further suggests that the difference in the board leadership structure is highly significant in both countries as p value is less than 0.001.
Therefore, the null hypothesis states that there is no significant difference in board leadership structure of companies listed in the United States and India has been rejected.
Gender Diversity in US and Indian Companies
Tables 7 provides information regarding the presence of women directors on board of companies listed in the United States and India and to test statistically whether gender diversity differs in the United States and India or not.
Year-wise Distribution of Total Number of Women on Board in US and Indian Listed Companies
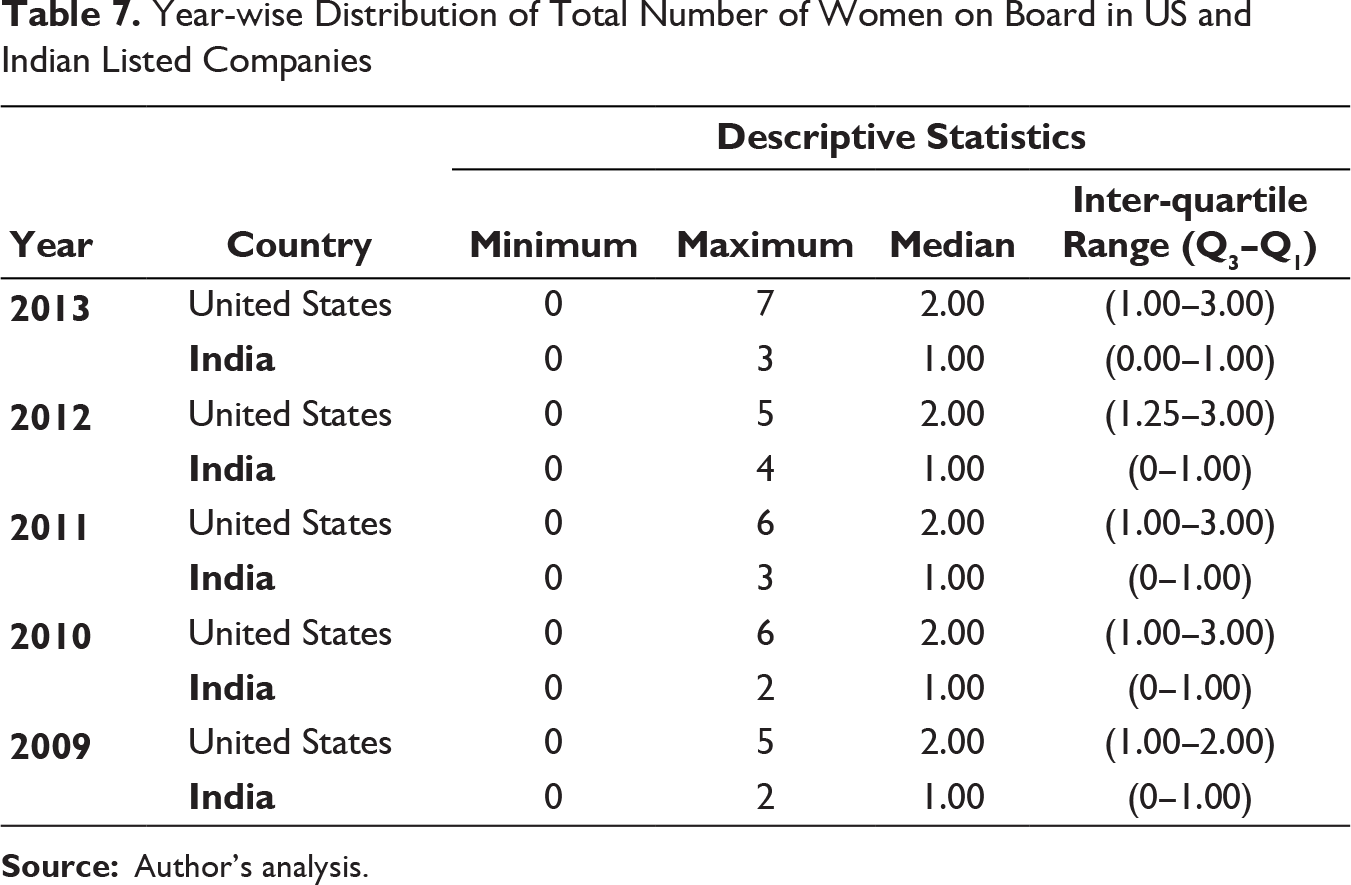
Table 7 shows that the minimum number of female directors on US listed companies’ boards as well as listed Indian companies’ board is zero. The maximum number of female directors in the United States is more than India and has been increased over the period of study. It indicates that the awareness about gender diversity in boardroom has been augmented. This is supported by McGregor (2007), that there is a need to have more women directors in listed companies’ boardrooms. The median value shows that 50 per cent listed companies in the United States have two or less than two female directors on board whereas 50 per cent and 75 per cent (as shown by 75th percentile) listed companies in India have either one or no female directors on board. Moreover, 75 per cent listed companies in the United States has either three or less than three female directors on board. Thus, it can be inferred that US listed companies board has larger number of female directors as compared to Indian listed companies’ board.
The box plot presented in Figure 3 shows clearly that distribution of total number of female directors on board between the United States and India are symmetrical in nature in each year during the study period. It indicates that there is obvious difference in the total number of female directors on US and Indian boards because the numerical values of minimum, maximum, median, lower and upper quartile, all are skewed up in the United States. Here, it is important to mention that the minimum value is zero as well as Q1 is also zero in case of India indicating that 25 per cent Indian boards have no female directors on their boards. That is why there are no inner fences in the above box plot of India during the study period. In 2009, in the United States the median value and third quartile values are same at 2.

Comparison of Gender Diversity between US and Indian Listed Companies
Average (±SD) Women on Board in the United States and India
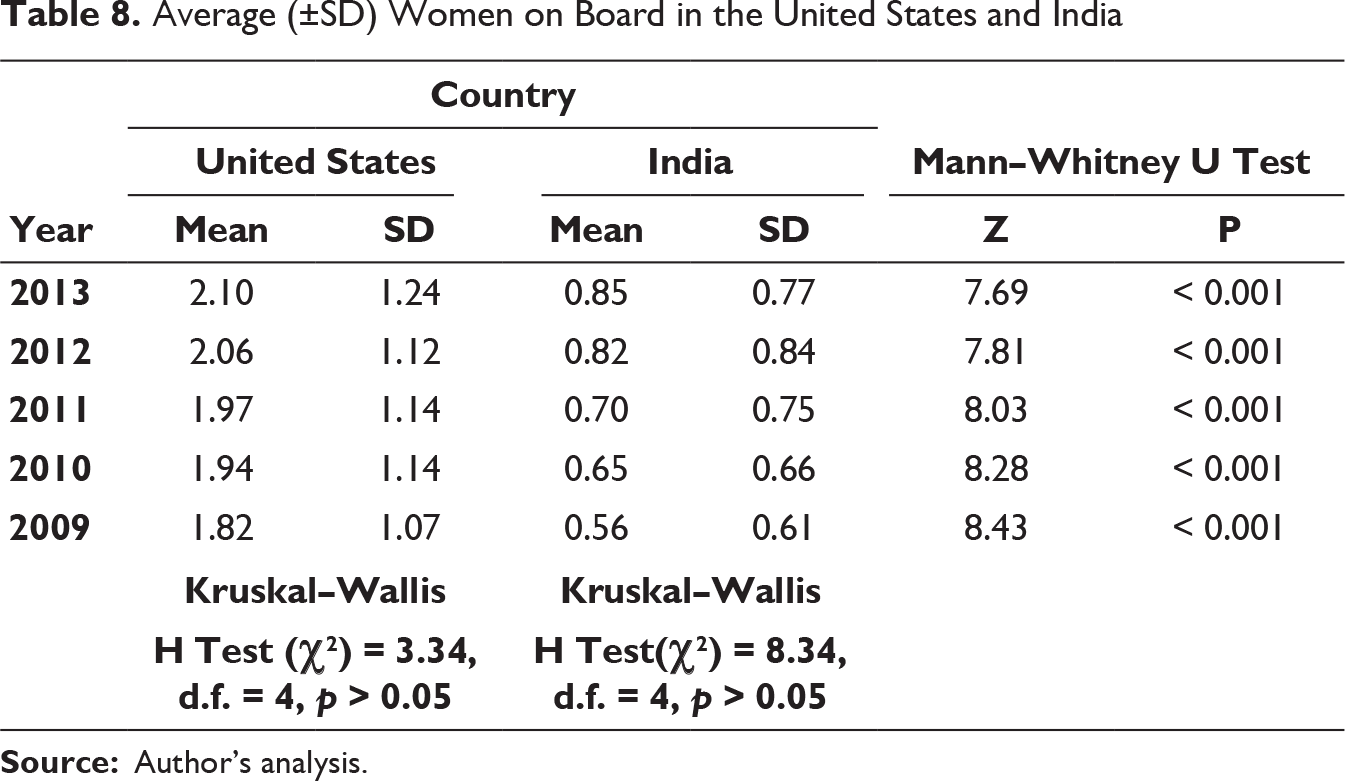
Therefore, null hypothesis state that there is no significant change in the trend and pattern of gender diversity in US and Indian listed companies has been accepted.
In order to test the null hypothesis that there is no difference in number of female directors on board of companies listed in the United States and India Mann–Whitney U test has been used as a non-parametric counterpart of the t-test. This test reveals that there is a statistically significant difference in the number of female directors on boards of companies listed in the United States and India as p value is less than 0.001.
Therefore, null hypothesis which states that there is no significant difference in gender diversity of companies listed in the United States and India has been rejected.
Summary of Findings
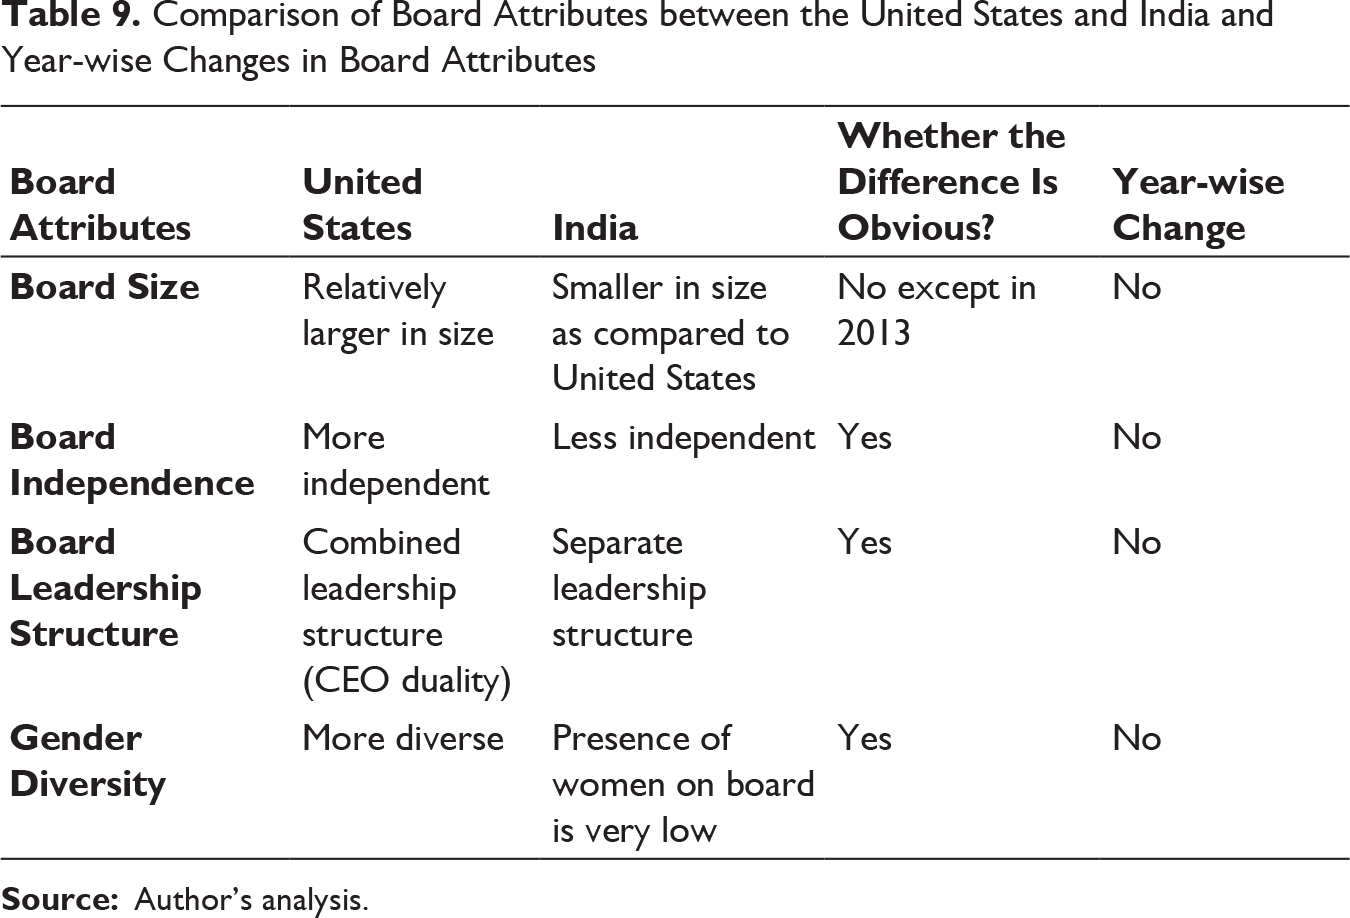
Comparison of Board Attributes between the United States and India and Year-wise Changes in Board Attributes
Conclusion
Both the countries the United States and India follow the Anglo-Saxon model of corporate governance and many features of the Anglo-Saxon board model of the United States exist in the Indian corporate scenario barring a few, such as the dispersed equity ownership. In spite of dissimilarities arising due to different political and legal system of both countries, over the decade, significant steps have been taken by the regulatory authorities in India to enhance corporate standards and these developments closely followed efforts in the jurisdiction of the United States (SOX). On statutory front, the various federal and states laws agencies with their proper coordination, provide the basic skeleton for US corporate governance structure whereas in India, only central (federal) authorities, namely, MCA and SEBI, are empowered for regulating and monitoring the corporate board and governance standards and still seek the clarities on their respective roles. Overall, after empirically examine and comparing the results obtained for both US and India dataset, it can be concluded that dissimilarities exist in terms of board size, board composition and independence, leadership structure and gender diversity of both countries. The findings of the study reveal that US companies’ boards are relatively larger with majority of independent directors on board with prevalence of combined leadership structure in most of companies. Contrary to that, Indian companies’ boardrooms comprise relatively less number of independent directors with the presence of separate board leadership structure in majority of companies. Furthermore, despite the absence of any quota for woman directors in US companies’ boardrooms they are more gender diverse as compared to Indian boards where one reserved seat is available. While the corporate governance codes in India have been drafted with a deep understanding of the governance standards around the world including US corporate governance norms, there is still a requirement of developing more appropriate solutions that would contribute in the policy formulation in order to make the corporate governance standards more effective for the Indian conditions. In this regard, this article may provide some valuable inputs for understanding the currents status and provisions of corporate governance structure and the prevailing practices of both economies. 1
For details, see http://www.sec.gov/about/laws/soa2002.pdf
Retrieved from http://www.indiainfoline.com/article/news-top-story/sebi-amendment-to-clause-49-what-kpmg-says-114091600105_1.html#sthash.WeE6YiZA.dpuf
NYSE Listing Company Manual Section 303A Corporate Governance Standards, Frequently asked questions (revised 4 January 2010). Retrieved from http://www1.nyse.com/pdfs/FINAL_FAQ_NYSE%20Listed%20Company%20Manual%20Section%20303A_updated_1_4_10.pdf